Market Minds Advisory
N-Ethyl-2-Pyrrolidone Market

N-Ethyl-2-Pyrrolidone Market: Inherited classification, closed-loop battery use and substitution fatigue to 2036

Buyers switched away from one restricted solvent at considerable expense, and the regulators then handed its replacement exactly the same hazard classification, which nobody at all had planned for anywhere.

Lead Analyst

Bilal Shaikh

Published

September 2026

Make Smarter Decisions with Customized Research Insights

Request a free sample report and evaluate market opportunities, growth trends, and competitive dynamics relevant to your business needs.

2025 MARKET VALUE$0.4BMarket Size 2025
2036 FORECAST VALUE$0.9BBase Case , 2026 to 2036
CAGR 2026 TO 20367.4 %Bull 8.6% / Bear 6.2%
INCREMENTAL OPPORTUNITY$0.5BNet 10- year value creation
EXPANSION MULTIPLE2.04x2036 value over 2026 base
Strategic Levers
M&A Pipeline
Regional Outlook
Country Rankings
Competitive Intelligence
Segmental Deep-dive
Call-Us : 91 93563 13602

Executive Snapshot and Market Trajectory

Two pyrrolidone solvents now carry the same reproductive toxicity classification, which means the substitution that European buyers funded to escape the first one bought them very little. Anybody who reformulated once is understandably reluctant to do it again on a promise. Money moved and nothing changed. Nobody expected it.
Electronics cleaning and photoresist applications grow at 11.1%, half again the market rate of 7.4%, because purity and dissolution requirements there make substitution hardest and pricing best. East Asia holds 32% of value, above the usual band, on battery and semiconductor manufacture concentrated there. Third generation alternatives show roughly a 24% dissolution shortfall. That gap is disqualifying in demanding applications and entirely tolerable in easy ones, which splits substitution by application.
Five producers hold 61% of supply and the concentration reflects amine and butyrolactone integration rather than any process advantage. The point most regulatory discussion misses is that 47% of volume goes into battery electrode slurry recovered at 99% inside closed loops, where worker exposure is a fraction of what open handling produces and the hazard case is entirely different. Nobody has argued that distinction. Somebody should.
Market Definition
This report covers N-ethyl-2-pyrrolidone and closely substitutable dipolar aprotic pyrrolidone solvents supplied across industrial applications, spanning battery electrode slurry, pharmaceutical synthesis, agrochemical formulation, electronics cleaning and photoresist, polymer processing and coatings, and industrial cleaning and paint removal. Value is measured at producer level on tonnage supplied. Excluded are non-pyrrolidone solvents sold as alternatives, polyvinylpyrrolidone polymers, recovered solvent traded between users, and formulated cleaning products.
Base Year Value
$0.4B in 2025 (MMA Primary Research Dataset, August 2026)
Forecast Period
2026 to 2036, eleven discrete annual values
CAGR
7.4% base case. Bull 8.6%. Bear 6.2%.
Fastest Growth Segment
Electronics Cleaning and Photoresist: 11.1% CAGR
Fastest Growth Country
India: 10.8% CAGR
Fastest Growth Region
South Asia and Pacific: 9.6% CAGR
Largest Region
East Asia: 32% of 2025 global value
Market Leaders
BASF, Mitsubishi Chemical, Ashland, Balaji Amines and Zhejiang Realsun Chemical lead the market. Source: MMA Primary Research Dataset, July 2026.
Primary Survey
n=3,800 procurement and R&D decision-makers, Q4 2025, six countries
Methodology
Demand-side build-up, cross-validated against public data, 47 expert interviews

N-Ethyl-2-Pyrrolidone Market Forecast Scenarios

n-ethyl-2-pyrrolidone-market-trends-size-forecast-scenario-1787555775941
Growth ran at 6.4% between 2020 and 2025 and two forces pulled hard in opposite directions. Battery electrode manufacture expanded enormously and consumes pyrrolidone solvent at scale, which drove volume. European restriction pushed buyers toward substitution, and the substitute received the same classification, which left everybody spending money to arrive nowhere. Nobody gained anything from the exercise except the reformulation consultants involved.
The 7.4% base case rests on three mechanisms. Battery electrode manufacture keeps expanding across China, Korea and increasingly Europe and North America, consuming solvent that closed-loop recovery returns at 99%. Electronics cleaning keeps growing at 11.1% as semiconductor investment expands and purity requirements exclude weaker alternatives entirely. And substitution fatigue keeps buyers with incumbent solvents rather than moving again on an uncertain promise. Battery capacity keeps commissioning across every region building it, which consumes inventory even where recovery returns most of it.
The 8.6% bull case is regulators recognising closed-loop battery use as materially different from open industrial handling, which would remove the largest application from restriction pressure entirely. The 6.2% bear case is dry electrode processing reaching commercial scale, since that eliminates the solvent from battery manufacture rather than substituting it and removes 47% of demand permanently.

The Substitute Inherited Everything

The commercially decisive event in this market was regulatory and it did not go the way anybody expected. European restriction of N-methyl-2-pyrrolidone as a reproductive toxicant sent buyers looking for a replacement, and N-ethyl-2-pyrrolidone was the obvious answer because it performs almost identically and required minimal reformulation. Regulators then classified the ethyl compound identically. Two pyrrolidone solvents now carry the same hazard class, and everybody who switched arrived exactly where they started.
TOP-FIVE CONCENTRATION61%Combined position across global pyrrolidone solvent supply held by leaders
BATTERY APPLICATION SHARE47%Portion of volume consumed dissolving electrode binder in cells
SOLVENT RECOVERY RATE99%Portion recovered and reused inside modern battery electrode plants
REPRODUCTIVE TOXICITY CLASSIFICATION2Number of pyrrolidone solvents now carrying the same hazard class
FEEDSTOCK COST SHARE57%Portion of production cost attributable to purchased raw chemicals
ALTERNATIVE SOLVENT PERFORMANCE GAP24%Shortfall third generation replacements show against incumbent dissolution power
That history explains the substitution fatigue running through this market. A formulator who spent a year and considerable expense moving off one solvent, only to find the destination reclassified, is not enthusiastic about a third attempt on the strength of a supplier's assurance. Third generation alternatives including bio-derived and cyclic ester chemistries show around a 24% shortfall in dissolution power, which is tolerable in easy applications and disqualifying in demanding ones. Substitution therefore proceeds unevenly by application rather than uniformly across the market.
The battery application deserves separate treatment and rarely receives it. Electrode slurry consumes 47% of volume and modern plants recover 99% inside closed loops, which produces worker exposure a small fraction of open industrial handling. That distinction has never been drawn in regulation.
"Everybody switched to escape a classification and the classification followed them across. That single experience has done more to slow adoption of genuinely better alternatives than any performance gap, because nobody wants to fund the same reformulation three times."
Director, Specialty Solvents and Process Chemicals Practice · MMA Chemicals and Materials Practice · August 2026

Market Trends

Substitution fatigue slows adoption of genuine alternatives

European buyers funded reformulation away from one restricted pyrrolidone solvent and regulators classified the replacement identically, which means a substantial investment purchased no regulatory relief whatever. That experience has produced measurable reluctance to attempt a third substitution on the strength of supplier assurances about compounds that have not yet attracted regulatory attention. Third generation alternatives showing around a 24% dissolution shortfall face that scepticism alongside a genuine performance gap. Commercially this holds incumbent solvents in place longer than the regulatory direction alone would suggest, and suppliers of alternatives underestimate the obstacle consistently.
Market Impact: Consumes 47% of total volume
Closed-loop battery recovery separates exposure from volume

Electrode slurry manufacture consumes 47% of pyrrolidone solvent volume and modern plants recover around 99% through condensation and distillation inside sealed systems, because the economics of losing the solvent are unacceptable regardless of any safety consideration. That closed operation produces worker exposure a small fraction of what open industrial cleaning or paint removal generates from far less material. Regulation written for open handling applies identically to both. Commercially this matters enormously, since the largest application by volume presents the weakest hazard case and receives no distinction in the rules governing it.
Market Impact: Segment compounds at 11.1% annually

Market Opportunities and Growth Drivers

Battery electrode manufacture consumes solvent at growing scale

Dissolving polyvinylidene fluoride binder for cathode slurry requires a dipolar aprotic solvent and pyrrolidone chemistry does it better than anything else available at industrial scale. Battery cell manufacture keeps expanding across China, Korea, Europe and North America, and every gigawatt hour of capacity consumes solvent inventory even where recovery returns most of it. That makes demand a function of installed and commissioning capacity rather than of any purchasing decision. The application accounts for 47% of volume and its growth has been the single largest force in this market for a decade.
Market Impact: Classifies 2 solvents identically

Semiconductor investment raises high purity solvent demand

Photoresist stripping and post-etch residue removal require solvents at purity levels that ordinary industrial grades cannot approach, with metal contamination measured in parts per billion and particle counts controlled tightly. Semiconductor fabrication investment across Taiwan, Korea, Japan, the United States and Europe keeps expanding that consumption. Alternatives showing a 24% dissolution shortfall are simply unusable where residue removal must be complete. Growth at 11.1% reflects both capacity expansion and the reality that this is the application where substitution pressure has least practical effect on what fabs actually buy. Fabs cannot risk residue.
Market Impact: Threatens 47% of demand

Market Restraints and Challenges

Reproductive toxicity classification restricts open handling uses

Both principal pyrrolidone solvents now carry reproductive toxicant classification in Europe, which imposes exposure limits, handling requirements and in some applications outright restriction on use. The root cause is toxicological rather than commercial and no reformulation of the solvent itself addresses it. Commercially this eliminates open handling applications including much paint removal and general industrial cleaning, which is where the classification concern genuinely applies. Producers are responding by concentrating on closed-loop and enclosed applications where exposure is controlled, and by supporting the argument that those uses differ materially. That argument remains unmade.
Market Impact: Follows 2 identical hazard classifications

Dry electrode processing would remove the largest application

Dry electrode manufacture forms the coating without any solvent at all, using binder fibrillation and mechanical pressing rather than slurry casting and drying. The root cause of the exposure is that this is process substitution rather than material substitution, so no solvent development answers it. Commercially it threatens the 47% of volume that battery manufacture represents, and the energy savings from eliminating drying ovens make the commercial case independently of any regulatory pressure. Commercial scale remains limited and several manufacturers are pursuing it seriously, which makes the timing genuinely uncertain.
Market Impact: Recovers 99% inside closed loops
3 additional market trends, 4 additional growth drivers, and 2 additional restraints and challenges are covered in the full report. Contact sales@marketmindsadvisory.com to access the complete intelligence.

Segment CAGR and Growth Architecture

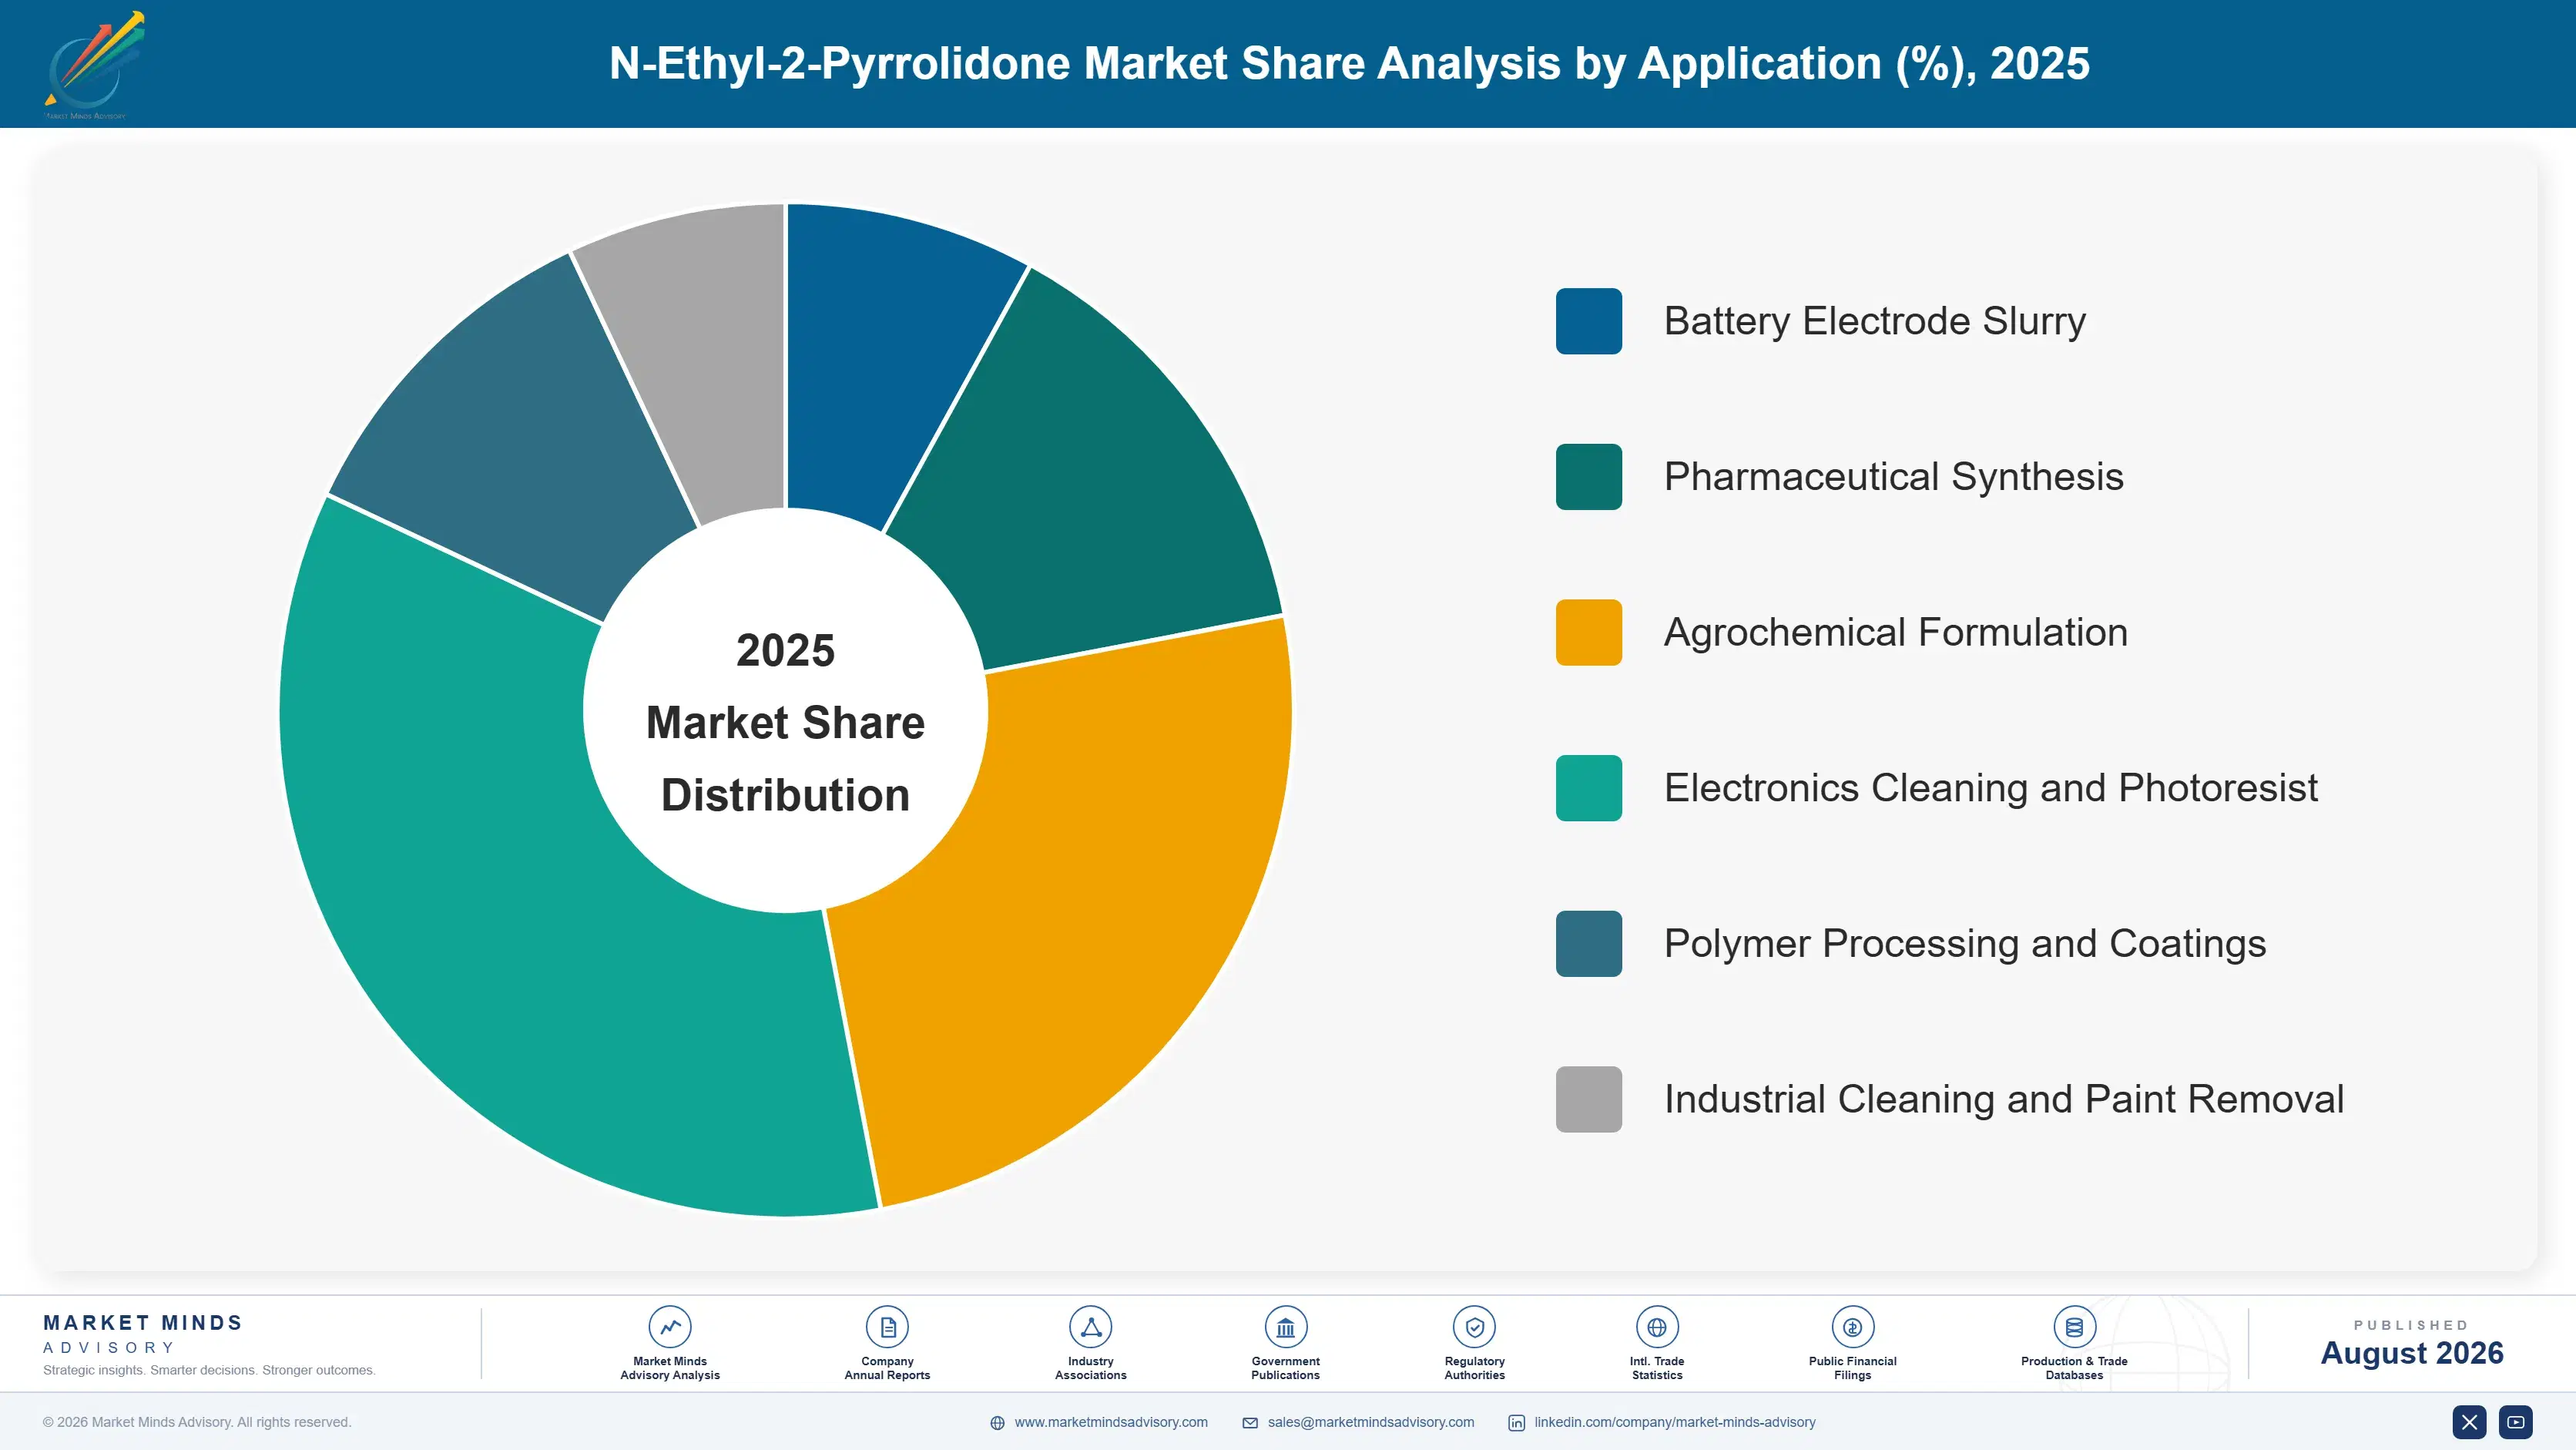
Volume is classified here by application, since that determines the purity required, the exposure conditions and how vulnerable a use is to substitution or restriction. Producer integration, supply arrangement and geography are handled separately in the framework, because one grade serves several applications without modification. Application decides both purity and vulnerability to substitution entirely.
n-ethyl-2-pyrrolidone-market-trends-market-share-analysis-1787555776476

Electronics Cleaning and Photoresist

Growing at 11.1%, half again the market rate, this is the application where substitution pressure has least practical effect on what buyers actually purchase. Photoresist stripping and post-etch residue removal demand complete dissolution and purity with metal contamination measured in parts per billion, and alternatives showing a 24% dissolution shortfall simply cannot be used where residue would destroy a wafer worth a great deal more than any solvent. Semiconductor fabrication investment across Taiwan, Korea, Japan, the United States and Europe keeps expanding consumption. Handling occurs inside enclosed tool sets, which addresses the exposure concern that drives restriction elsewhere entirely. Enclosed tool handling removes the exposure concern that drives restriction in every other application here.
CAGR 11.1%

Battery Electrode Slurry

Dissolving polyvinylidene fluoride binder requires a dipolar aprotic solvent and pyrrolidone chemistry does it better than anything at industrial scale, which is why 47% of volume goes here. Modern plants recover around 99% through condensation and distillation because losing the solvent is economically unacceptable, and that closed operation produces exposure a small fraction of open handling. Growth at 9.0% follows cell manufacturing capacity across every region building it. The genuine long-term exposure is not regulatory but technological, since dry electrode processing eliminates the solvent entirely rather than replacing it and carries energy savings that justify it independently. Dry electrode processing carries energy savings that justify it entirely independently of any regulatory pressure at all.
CAGR 9.0%
Full segment breakdown across 6 segments available in the complete report.

Regional Architecture and Country Demand Map

East Asia holds 32% of value, above the usual band, because battery cell and semiconductor manufacture both concentrate there more heavily than in almost any other chemical chain. North America follows at 22%. Manufacturing location decides this entirely. Nothing else explains where this volume goes at all.

East Asia

At 32% this region sits above the usual band ceiling because battery cell manufacture and semiconductor fabrication both concentrate here to a degree few chemical chains match. Chinese cell production consumes pyrrolidone solvent at volumes nothing elsewhere approaches, with recovery systems now standard across modern plants. Korean and Japanese producers hold the deepest capability in high purity electronic grades and supply fabs globally. Chinese domestic production serves most regional demand at prices international producers do not attempt on industrial grades. Growth at 8.4% combines battery capacity expansion with semiconductor investment happening simultaneously across the region. This share sits above the usual ceiling because few chemical chains concentrate consumption this heavily anywhere.
Share: 32% | CAGR: 8.4% (2026 to 2036)

North America

Battery cell manufacturing investment under domestic content incentives has created solvent demand where very little previously existed, with plants specifying closed-loop recovery from the outset rather than retrofitting it. Semiconductor fabrication expansion adds high purity consumption at specifications only a few producers can meet. Regulatory pressure on pyrrolidone solvents is advancing through federal chemical review, which affects open handling applications more than enclosed ones. Domestic production capability is meaningful and imports supply the balance. Growth at 6.8% sits close to the market average and rests on manufacturing investment rather than any regulatory development. Plants specify closed-loop recovery from the outset rather than retrofitting it later. Restriction affects open handling most.
Share: 22% | CAGR: 6.8% (2026 to 2036)
Regional intelligence for 5 additional markets available in the complete report: Western Europe, South Asia and Pacific, Latin America, Middle East and Africa, Eastern Europe. Contact sales@marketmindsadvisory.com.
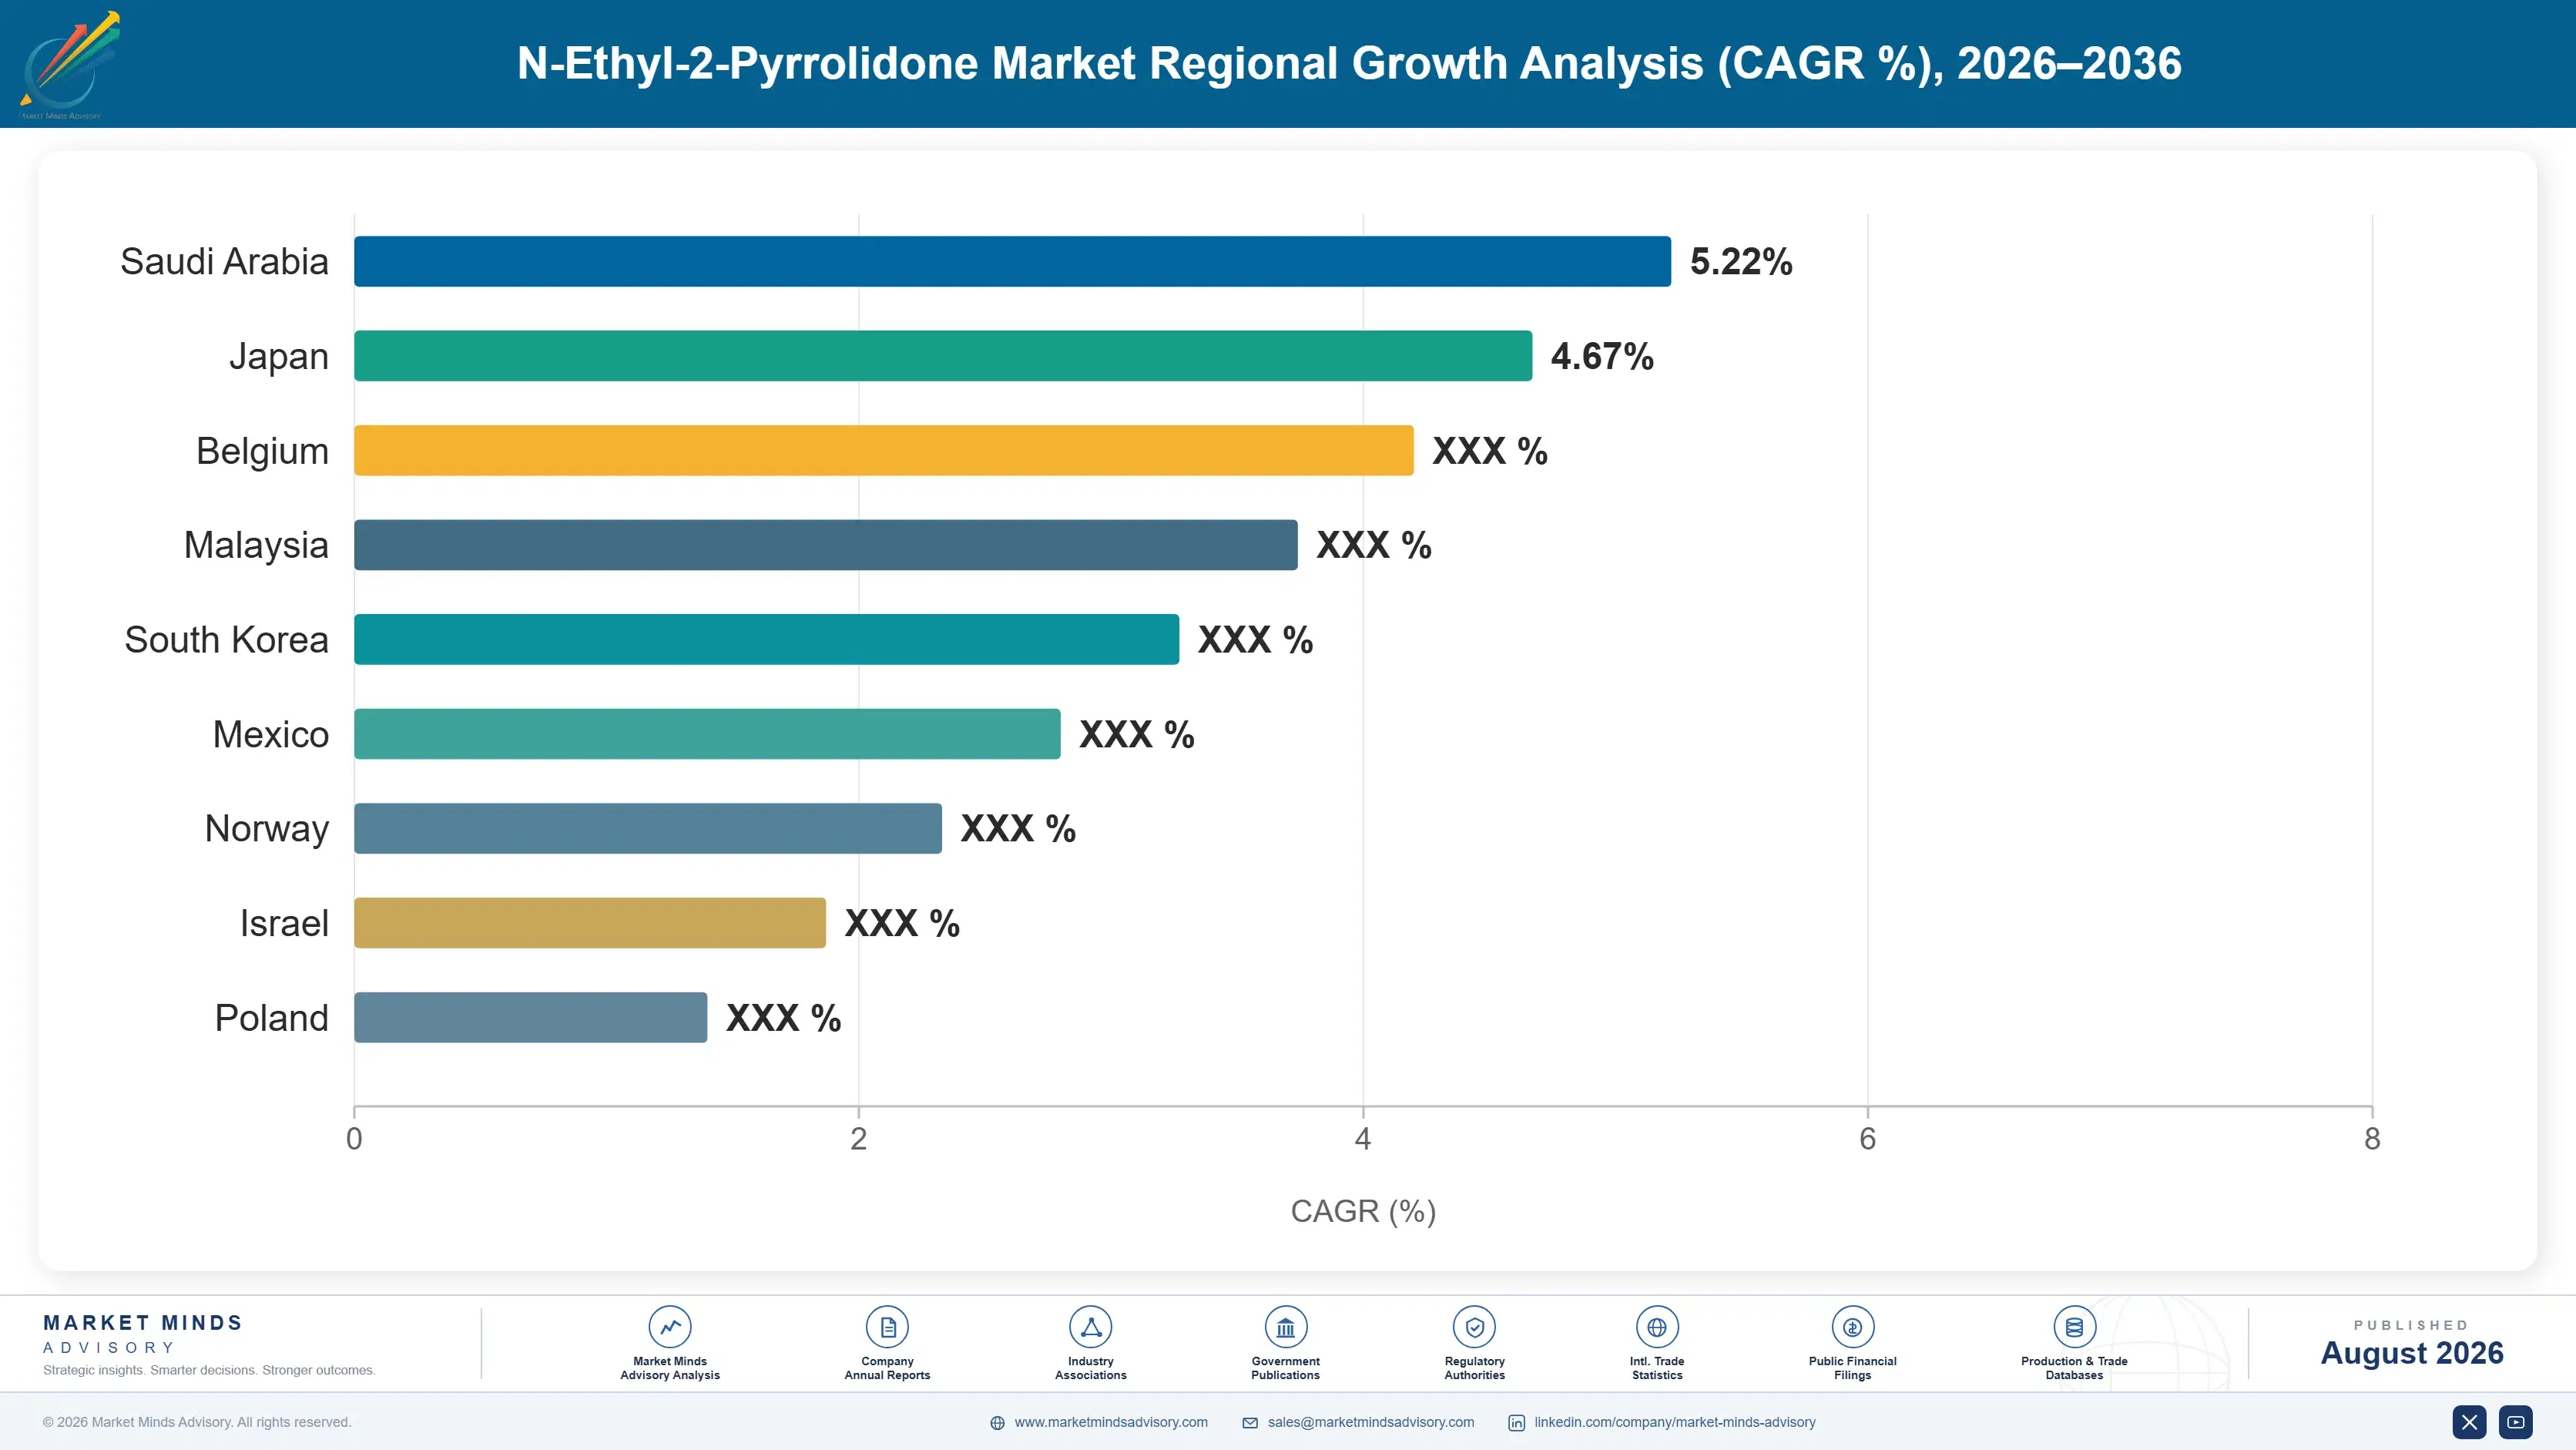
n-ethyl-2-pyrrolidone-market-trends-country-cagr-analysis-1787555777003

Where Solvent Margin Actually Sits

Four moves matter in a chemistry where the escape route received the same classification as the thing everybody was escaping. Two are about the applications where exposure is genuinely controlled, and two are about the customers who cannot substitute regardless of what regulators decide. Promising a clean alternative is not among them. Nobody believes it.

Argue closed-loop exposure as materially different

Battery electrode manufacture consumes 47% of volume and recovers around 99% inside sealed systems, producing worker exposure a small fraction of what open industrial cleaning generates from far less material. Regulation written for open handling applies identically to both because nobody has made the distinction properly. Producers supporting exposure measurement and closed-loop documentation give regulators the evidence to differentiate, which protects the largest application in the market. Nobody benefits from a restriction aimed at paint stripping catching a sealed recovery loop, and the case has simply not been argued. It costs very little.
Market Impact: Protects a full 47% of the total demand

Concentrate on applications alternatives cannot serve

Third generation alternatives show around a 24% dissolution shortfall, which is tolerable in general cleaning and disqualifying in photoresist stripping where incomplete residue removal destroys a wafer worth far more than any solvent saving. Electronics applications compound at 11.1% and buy on performance and purity rather than on regulatory positioning. Producers concentrating there face substitution pressure that has almost no practical effect on purchasing decisions. Producers defending general industrial cleaning are holding exactly the applications where alternatives work adequately and restriction bites hardest. Restriction bites hardest there. That distinction matters commercially more than the regulatory direction does.
Market Impact: Exploits a full 24% alternative dissolution power shortfall

Sell purity where a fab cannot risk residue

Semiconductor cleaning demands metal contamination measured in parts per billion and controlled particle counts, which excludes producers whose process leaves residues no purification economically removes. Fabrication investment across Taiwan, Korea, Japan, the United States and Europe keeps expanding that consumption at specifications that keep tightening. Those buyers pay for specification rather than negotiating tonnage, and qualification positions last years once established. The purity barrier is genuine and it separates a few producers from everybody else in a chemistry that otherwise looks like a commodity. Purity below 10 parts per billion metals is the specification that decides access.
Market Impact: Meets specifications below 10 parts per billion metals

Follow pharmaceutical synthesis into Indian manufacture

Indian active pharmaceutical ingredient production expands at rates nothing else on this table approaches, and pyrrolidone solvents appear across a wide range of the synthetic routes that industry runs at scale. Indian growth at 10.8% is the fastest of any country here. Regulatory pressure on these solvents is minimal there, which means applications restricted in Europe continue without constraint and demand grows accordingly. Producers organised entirely around European and North American customers are serving markets where restriction shrinks demand while ignoring one where it does not apply. Restriction does not apply.
Market Impact: Enters demand markets now growing at 10.8% annually

Who Controls the Margin Pool

Five producers hold 61% of pyrrolidone solvent supply, measured on tonnage supplied at producer level, the basis used throughout this section. That concentration follows integration into amine and butyrolactone feedstocks rather than any process advantage, since the synthesis is well understood and the difficulty is obtaining raw materials economically at scale. The gap between leaders and everybody else is feedstock position and purity capability rather than reactor technology. Synthesis chemistry has been public for decades.
Competition runs on three dimensions. Purity capability, which decides access to semiconductor and pharmaceutical applications where specification rather than price governs. Feedstock integration, since raw chemicals are 57% of production cost. And regulatory positioning, because a producer able to support closed-loop exposure arguments protects applications that others simply lose. Price competes hardest in industrial grades. Restriction eliminates rather than transfers.

Rankings shift as restriction eliminates open handling applications rather than transferring them between suppliers, which shrinks the addressable market for everybody weighted toward those uses. Chinese producers dominate industrial grade volume on cost. Japanese and Korean producers hold electronic grade positions that purity requirements protect effectively. Purity protects Japanese and Korean positions effectively.
n-ethyl-2-pyrrolidone-market-trends-company-positioning-matrix-1787555777528

Competitive Moat and Risk Dimensions

BASF

Moat: Feedstock integration and purity

BASF produces the amine and butyrolactone feedstocks that account for 57% of pyrrolidone production cost, which converts an integrated position into a cost advantage no merchant buyer can approach. The company also holds purity capability serving pharmaceutical and electronic applications where specification rather than price governs purchasing entirely.
BASF

Risk: European regulatory concentration

A substantial European manufacturing and customer position sits inside the jurisdiction that classified both principal pyrrolidone solvents as reproductive toxicants, which restricts open handling applications and produced the substitution fatigue defining this market. Producers weighted toward Asian battery and electronics demand face far less restriction pressure on their volumes.
BALAJI AMINES

Moat: Indian integrated amine position

Balaji Amines holds integrated amine production inside the market with the fastest pharmaceutical demand growth in this chemistry, combining feedstock cost advantage with location inside the demand rather than shipping toward it. Regulatory pressure on these solvents is minimal in India, which leaves applications restricted elsewhere growing without constraint.
BALAJI AMINES

Risk: Limited high purity capability

Semiconductor and advanced electronic applications demand purity levels that industrial and pharmaceutical grade production does not reach, and those are the segments compounding fastest at 11.1% globally. Building that capability requires purification investment and qualification cycles measured in years. Japanese and Korean producers hold those positions and defend them on specification rather than price.

Players Tracked

Prominent Players

BASF
Mitsubishi Chemical
Ashland
Balaji Amines
Zhejiang Realsun Chemical

Other Key Players

LyondellBasell
Eastman Chemical
Merck KGaA
Jiangsu Tongzhou Bio-Pharmaceutical
Shandong Qiyuan Biotechnology
Anhui Haoyuan Chemical
Nantong Acetic Acid Chemical
Circa Group
Mitsui Chemicals
Zhangjiagang Huachang
Shijiazhuang Jinxing
Kaiyuan Chemical
Alfa Aesar
Tokyo Chemical Industry
Sinopharm Chemical Reagent

Recent Developments

FEBRUARY 2025

A battery manufacturer published closed-loop solvent exposure data

A battery cell manufacturer published worker exposure measurements from closed-loop electrode slurry operations recovering solvent at high rates, demonstrating levels far below those associated with open industrial handling. This was a disclosure and advocacy exercise rather than any commercial transaction. Regulators have not yet responded.
Signal: Somebody is finally producing the evidence that closed-loop use differs materially, which regulation has never distinguished
AUGUST 2025

A European formulator abandoned a third solvent substitution attempt

A European industrial formulator halted evaluation of third generation solvent alternatives, citing dissolution performance shortfalls and reluctance to fund another reformulation after the previous substitution received the same hazard classification. This was an internal development decision rather than any transaction. Reformulation budgets went unspent entirely.
Signal: Substitution fatigue now measurably slows alternative adoption, which suppliers of replacement solvents keep underestimating quite badly
DECEMBER 2025

An Indian producer expanded pharmaceutical grade pyrrolidone capacity

An Indian producer commissioned additional pharmaceutical grade pyrrolidone solvent capacity serving domestic active ingredient manufacture expanding rapidly. This was organic capital investment rather than any partnership or acquisition, and it sits in the market with the fastest demand growth in this chemistry. European capacity serves shrinking demand.
Signal: Investment follows demand into markets without restriction pressure while European capacity serves a shrinking application base

What Moves Producer Cost

Purchased raw chemicals account for around 57% of production cost, principally gamma-butyrolactone and the corresponding amine, both bought from a limited producer base or made internally by integrated participants. Energy for reaction and distillation is meaningful. Purification to electronic and pharmaceutical grade adds cost disproportionate to the volume involved. Waste treatment is modest by specialty chemical standards.
Butyrolactone and amine prices moved sharply through 2021 and 2022 on petrochemical feedstock and European energy costs, and IEA data show European industrial gas far above Asian levels across that period. BASF recorded raw material and energy cost pressure across its intermediates operations in its Annual Report 2022. Producers holding annual contracts with battery and pharmaceutical customers absorbed most of the movement, since those buyers set formulation costs for a period.

Integration rather than purchasing skill determines cost position in this chemistry, and it is not a variable anybody can address through better negotiation. A producer making its own butyrolactone and amine carries a permanently lower cost base than one buying both on merchant terms, and no procurement improvement closes that gap. That is why concentration sits at 61% despite chemistry that has been public for decades.
n-ethyl-2-pyrrolidone-market-trends-cost-volatility-analysis-1787555777724

Contract butyrolactone supply across multiple producers

Gamma-butyrolactone comes from a limited producer base and an interruption stops pyrrolidone production entirely rather than merely raising cost for a period. Qualifying two or three sources takes commercial effort rather than capital and delivers continuity worth considerably more than any single-source discount. Producers without integration face availability risk that no purchasing arrangement fully removes.

Load purification capacity across grade requirements

Electronic and pharmaceutical grade purification is expensive capital requiring utilisation that a single application rarely provides. Loading the same purification train across semiconductor, pharmaceutical and high specification industrial grades spreads that cost considerably. Producers running purification for one customer segment carry capital that better-loaded competitors amortise across several segments simultaneously. Utilisation decides whether purification investment pays back at all.

Fund exposure measurement to defend closed-loop applications

Battery electrode manufacture consumes 47% of volume in sealed systems recovering nearly everything, and no producer has systematically documented the exposure difference against open handling. Funding that measurement gives regulators evidence to differentiate applications rather than restricting all of them together. The cost is modest against an application representing nearly half the market and currently undefended.

Portfolio Architecture for Margin Defence

Margin here tracks purity grade and application defensibility rather than production scale, because pyrrolidone synthesis is public chemistry that many producers run adequately. Industrial grade solvent runs at gross margins in the low twenties against Chinese producers with better feedstock costs. Pharmaceutical grade runs considerably better on documentation and qualification requirements. Electronic grade and closed-loop battery supply run higher again, because purity and application security both exclude most competitors entirely. Public chemistry defends nothing.
The tension is that industrial grades carry volume while high purity grades carry returns, and moving between them requires purification capital and qualification cycles measured in years rather than months. Producers stranded by restriction of open handling applications face exactly that problem: the returns are in electronics and the entry cost is high while their existing revenue is being regulated away. That sequencing difficulty explains why several producers have simply exited.

High-value pools sit in electronic grade purity, closed-loop battery supply and Indian pharmaceutical demand. None of the three is where open handling volume was. Production capacity by itself defends nothing against a restriction that eliminates an application. Purity and integration defend considerably more.

Volume / Commodity-Adjacent

Industrial grade solvent for cleaning, coatings and general processing where Chinese producers hold feedstock cost advantages and restriction is eliminating applications. The eight-point range separates integrated producers from those buying butyrolactone and amine on merchant terms entirely.
Gross Margin: 18%-26%

Premium / Certified

Pharmaceutical grade material where documentation, qualification and regulatory filings embed a supplier inside a registered synthesis route. The twelve-point spread reflects how deeply a position sits inside a customer's filed process rather than any purity difference.
Gross Margin: 28%-40%

Sustainability / Regulatory / Next-Generation

Electronic grade purity, closed-loop battery supply and applications alternatives cannot serve on dissolution performance. The eighteen-point range is wide because these price against specification scarcity rather than against any comparable product a buyer could substitute.
Gross Margin: 38%-56%
n-ethyl-2-pyrrolidone-market-trends-portfolio-architecture-1787555778222

High-value Sub-segments and Strategic Watch-out

Electronic Grade Purity Supply

Compounding at 11.1% and protected by parts per billion metal specifications that exclude most producers entirely, in applications where a 24% dissolution shortfall would destroy wafers worth far more than any solvent. Qualification cycles run years and defend the position afterwards. Very few producers hold it.
Gross Margin: 40%-56%

Closed-Loop Battery Applications

Forty-seven percent of volume recovered at 99% inside sealed systems, with worker exposure a fraction of open handling and no regulatory distinction drawn. Nobody has funded the measurement that would establish it. Funding that measurement is cheap against nearly half the market. Nobody has funded it yet.
Gross Margin: 34%-48%

Industrial Grade Open Handling

The volume that restriction is eliminating rather than transferring between suppliers, and where alternatives at a 24% shortfall work adequately anyway. Manage for orderly decline rather than any defence. Alternatives work adequately there, which makes defence pointless. Chinese feedstock costs settle the rest of the argument entirely.
Gross Margin: 18%-26%

Indian Pharmaceutical Demand

Growing at 10.8% with minimal regulatory pressure on these solvents, which means applications restricted in Europe continue expanding without constraint. Most Western producers ignore the market entirely. Freight terms make it reachable and almost nobody has gone. Restriction pressure simply does not reach that market at all.
Gross Margin: 30%-42%

How Solvent Demand Renews

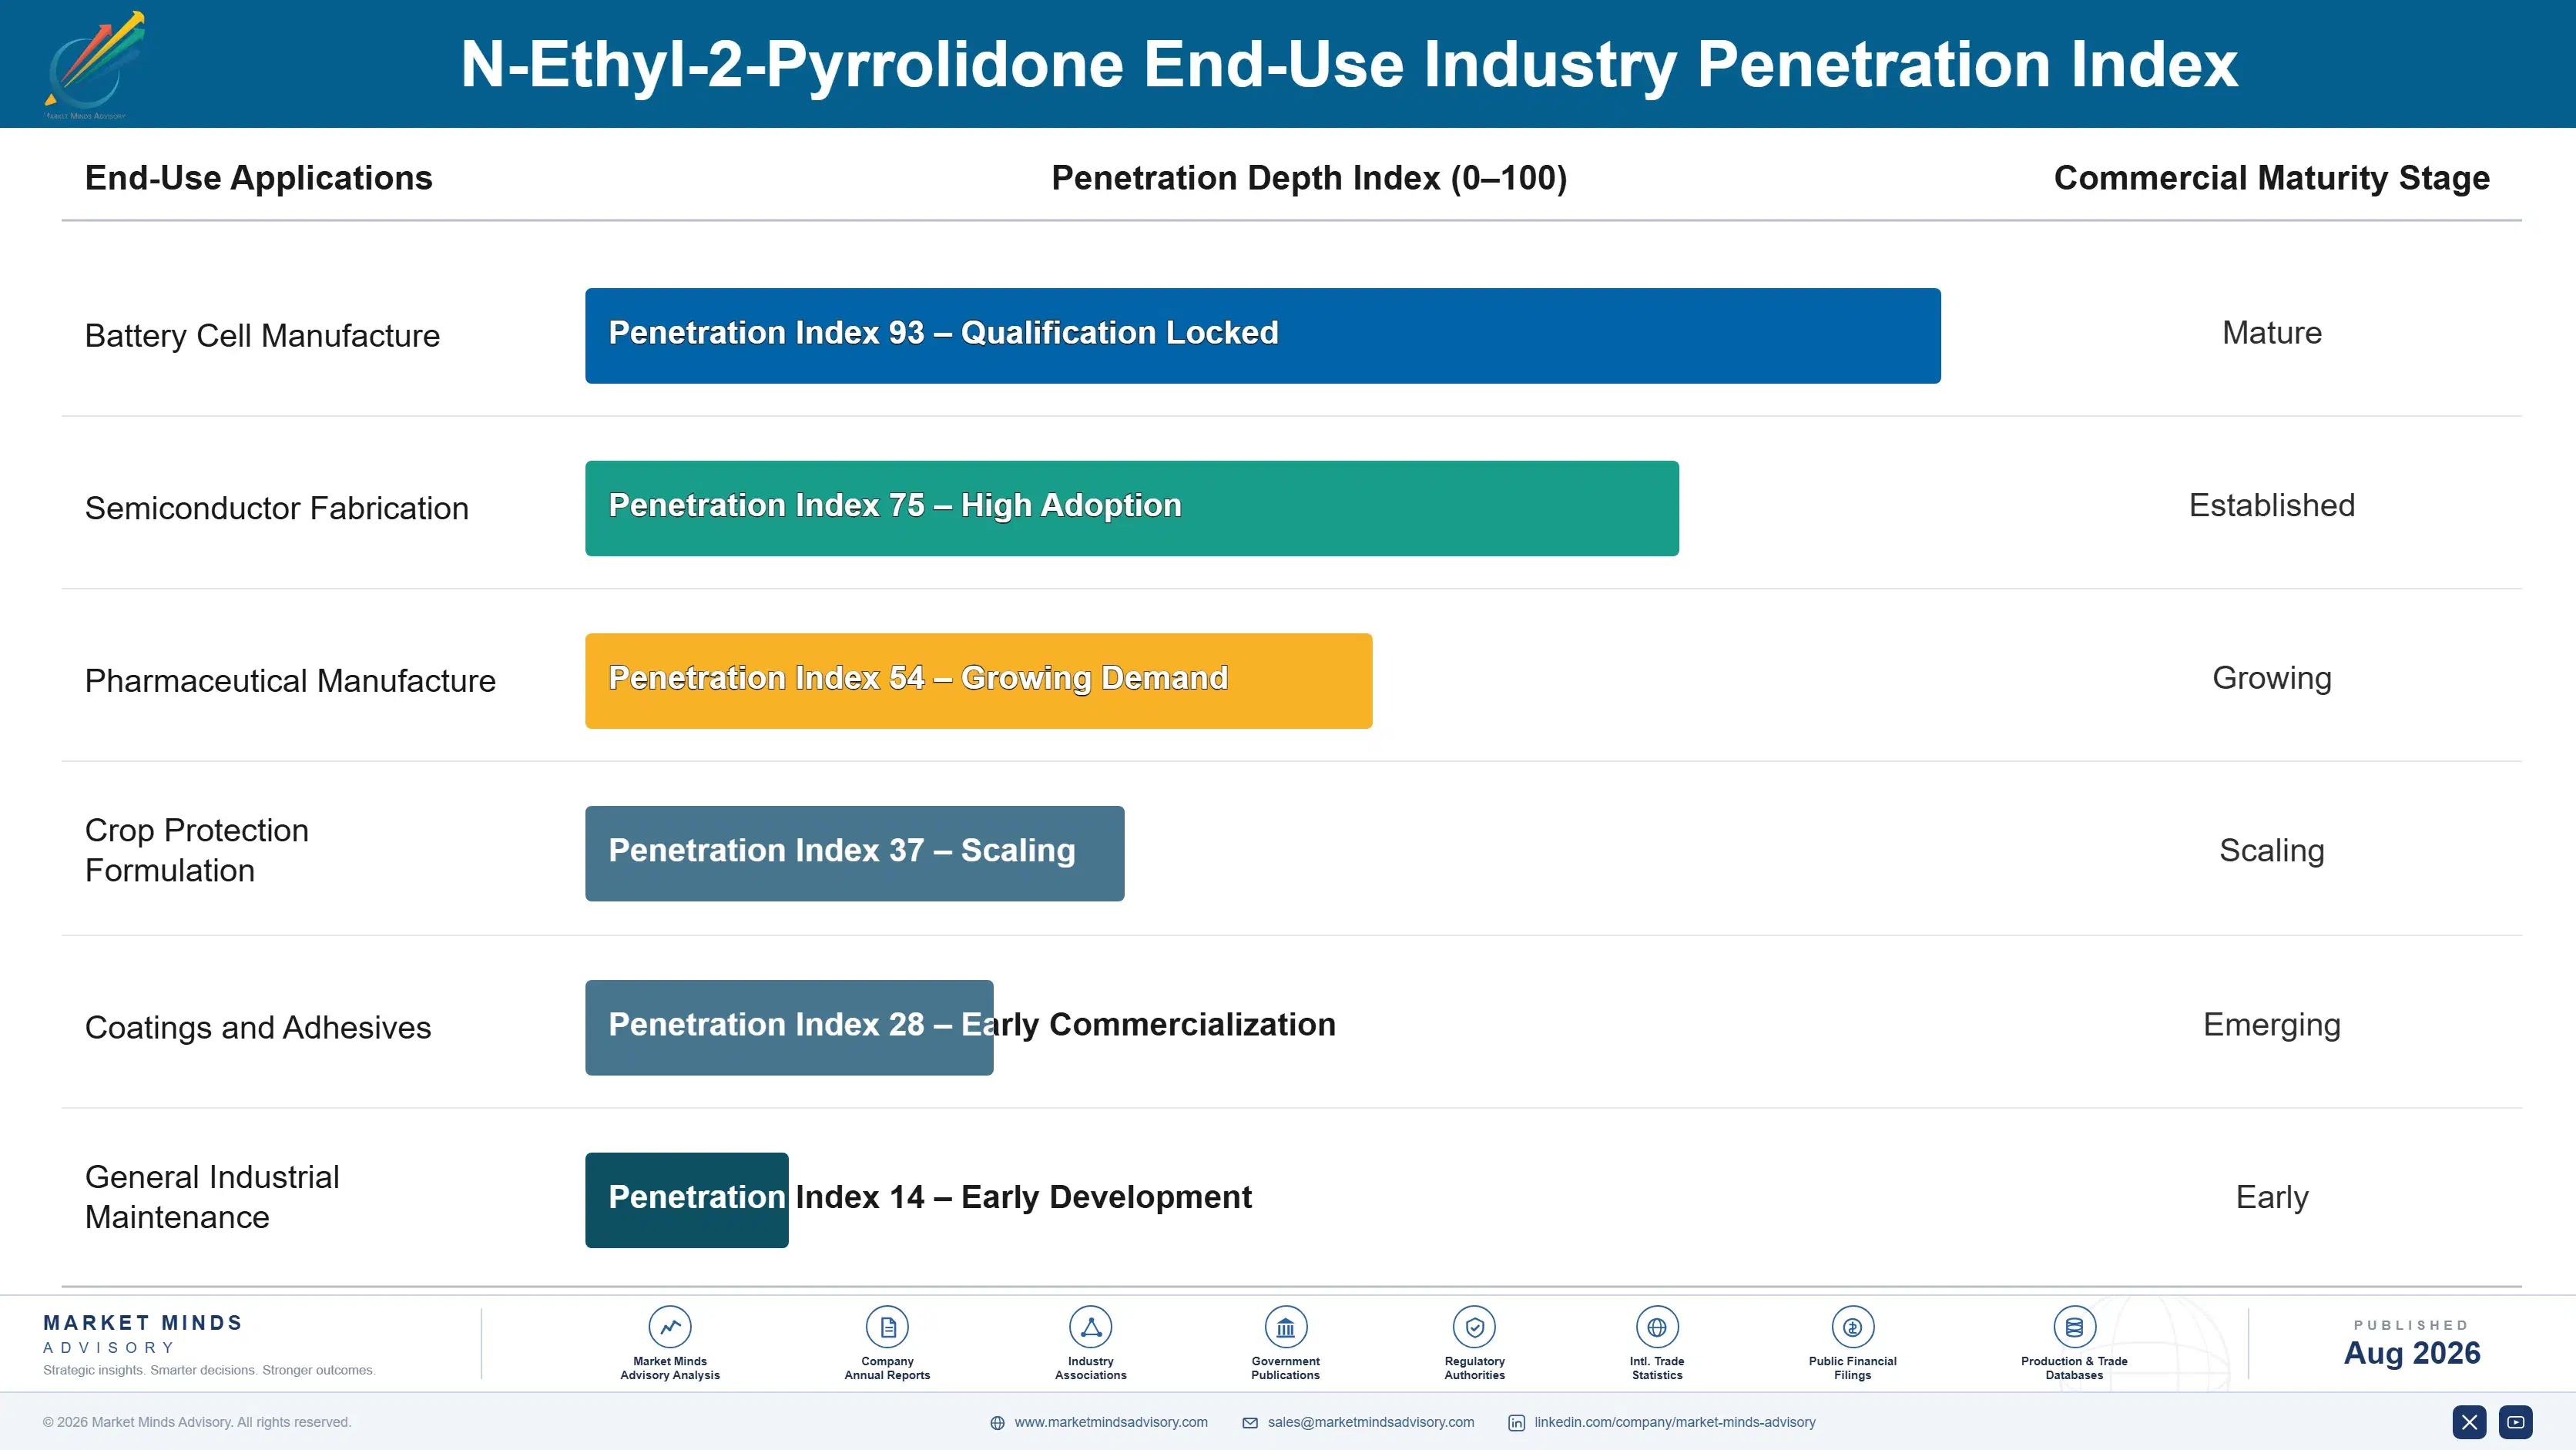
Demand renews through the process rather than through any purchasing cycle. A solvent written into a battery electrode line or a registered pharmaceutical synthesis is consumed continuously for as long as that process runs, with volumes following production rather than any decision. Changing means requalification, and in pharmaceutical applications regulatory variation filings that nobody undertakes to save a small percentage on an input. Nobody switches casually.
Stickiness is high everywhere and highest where documentation attaches. Pharmaceutical positions inside registered routes are close to permanent, since the regulatory cost of change exceeds any plausible saving. Electronic grade qualifications hold nearly as well on requalification cost and risk. Battery applications hold on recovery system compatibility, since a plant's distillation train is tuned to a specific solvent and its impurity profile.

The buyer now includes regulatory affairs and sustainability functions who did not previously participate. Solvent selection sat with process chemists weighing dissolution power, boiling point and cost. It now involves people assessing hazard classification and substitution roadmaps, and their questions have driven more reformulation than any technical development in this chemistry ever did. Chemistry answers none of their questions.
n-ethyl-2-pyrrolidone-market-trends-end-use-penetration-index-1787555778708

Where To Place The Bet

These are among the four positions where our research anticipates prominent divergence between winners and laggards over the coming forecast period. Each is grounded in the demand model, the regulatory perimeter, and the announced capacity pipeline.
01 / CLOSED-LOOP EVIDENCE BUILDING

Prove sealed use differs from open handling

Battery electrode manufacture consumes 47% of pyrrolidone solvent volume and recovers around 99% of it inside sealed condensation and distillation systems, which produces worker exposure a small fraction of what open industrial cleaning or paint removal generates from far less material. Regulation written for open handling applies identically to both because nobody has ever properly made the distinction. Producers funding exposure measurement and closed-loop documentation give regulators the evidence to differentiate, which protects the single largest application in the entire market.
02 / PERFORMANCE BARRIER FOCUS

Serve where alternatives genuinely cannot work

Third generation alternatives including bio-derived and cyclic ester chemistries show around a 24% shortfall in dissolution power, which is entirely tolerable in general industrial cleaning and completely disqualifying in photoresist stripping where incomplete residue removal destroys a semiconductor wafer worth far more than any solvent saving. Electronics applications compound at 11.1% and purchase on performance and purity rather than on regulatory positioning at all. Producers defending general industrial cleaning are holding precisely the applications where alternatives work adequately and restriction bites hardest.
03 / PURITY CAPABILITY INVESTMENT

Buy the specification barrier competitors lack

Semiconductor cleaning applications demand metal contamination measured in single parts per billion alongside tightly controlled particle counts, which excludes any producer whose process leaves residues that purification cannot economically remove afterwards. Fabrication investment across Taiwan, Korea, Japan, the United States and Europe keeps expanding that consumption at specifications which continue tightening steadily rather than settling anywhere. Those buyers pay for specification instead of negotiating tonnage, and qualification positions established there last for many years rather than for any contract period.
04 / UNRESTRICTED MARKET ENTRY

Follow demand where restriction does not apply

Indian active pharmaceutical ingredient production expands at rates nothing else on this table approaches, and pyrrolidone solvents appear across a wide range of the synthetic routes that industry operates at genuine scale. Indian growth at 10.8% is the fastest of any country covered here, and regulatory pressure on these solvents remains minimal, which means applications restricted across Europe continue growing there without any constraint. Producers organised entirely around European and North American customers are defending shrinking demand while ignoring expanding demand elsewhere.

Engagement Snapshot From the Field

A live engagement with an industry participant carrying material or product regulatory and market exposure ahead of a defining policy shift, showing how our research translates into a defensible multi-year portfolio strategy.
MARKET MINDS ADVISORY · CLIENT ENGAGEMENT SUMMARY
N-Ethyl-2-Pyrrolidone Producer Strategic Portfolio Review and Transition Roadmap 2026·Investment Scenario on N-Ethyl-2-Pyrrolidone Exposure Evaluation 2025-26
CLIENT PROFILE
A European pyrrolidone solvent producer with annual revenue around EUR 128 million (client-reported, unverified by MMA), supplying industrial, coatings and pharmaceutical grade material across European markets. Electronic grade purification capability was absent. Roughly 55% of volume sat in open handling industrial applications. Feedstock was purchased on merchant terms. Feedstock integration was entirely absent. Volume kept falling.
STRATEGIC CHALLENGE
Volume had fallen for three consecutive years (client-reported, unverified by MMA) as European restriction eliminated open handling applications, and management proposed developing a third generation alternative solvent. Nobody had established whether customers would fund another substitution after the previous one delivered no regulatory relief at all. That question had never been tested with customers.
MMA APPROACH
MMA tested customer willingness to attempt a third substitution through the expert interview programme rather than assuming an alternative would be adopted. Electronic grade purification investment was modelled against semiconductor demand growth and qualification timelines. Closed-loop battery exposure evidence was assessed, and Indian pharmaceutical demand was sized against the client's export capability.
KEY FINDINGS
  1. Customers who had already funded one substitution that delivered no regulatory relief showed strong reluctance to evaluate a third alternative on any supplier assurance whatsoever.
  2. Electronic grade purification investment showed acceptable returns against semiconductor demand growth, though qualification cycles measured in years delayed any revenue very considerably.
  3. No producer had funded exposure measurement demonstrating that closed-loop battery use differs materially from open handling, leaving the largest application entirely undefended.
  4. Indian pharmaceutical demand was reachable on freight terms and growing at rates the client's European customer base could not remotely approach at any point.
CLIENT PROFILE
A European pyrrolidone solvent producer with annual revenue around EUR 128 million (client-reported, unverified by MMA), supplying industrial, coatings and pharmaceutical grade material across European markets. Electronic grade purification capability was absent. Roughly 55% of volume sat in open handling industrial applications. Feedstock was purchased on merchant terms. Feedstock integration was entirely absent. Volume kept falling.
STRATEGIC CHALLENGE
Volume had fallen for three consecutive years (client-reported, unverified by MMA) as European restriction eliminated open handling applications, and management proposed developing a third generation alternative solvent. Nobody had established whether customers would fund another substitution after the previous one delivered no regulatory relief at all. That question had never been tested with customers.
MMA APPROACH
MMA tested customer willingness to attempt a third substitution through the expert interview programme rather than assuming an alternative would be adopted. Electronic grade purification investment was modelled against semiconductor demand growth and qualification timelines. Closed-loop battery exposure evidence was assessed, and Indian pharmaceutical demand was sized against the client's export capability.
KEY FINDINGS
  1. Customers who had already funded one substitution that delivered no regulatory relief showed strong reluctance to evaluate a third alternative on any supplier assurance whatsoever.
  2. Electronic grade purification investment showed acceptable returns against semiconductor demand growth, though qualification cycles measured in years delayed any revenue very considerably.
  3. No producer had funded exposure measurement demonstrating that closed-loop battery use differs materially from open handling, leaving the largest application entirely undefended.
  4. Indian pharmaceutical demand was reachable on freight terms and growing at rates the client's European customer base could not remotely approach at any point.
RECOMMENDED STRATEGY
Phase 1: Phase one: abandon the alternative solvent development, since customers have demonstrated they will not fund a third substitution on any promise. Phase 2: Phase two: commit purification investment for electronic grade capability, accepting several years before any qualification work will produce meaningful revenue. Phase 3: Phase three: build Indian pharmaceutical export positions and fund closed-loop exposure measurement jointly with several of the existing battery customers.
OUTCOME
Alternative solvent development was cancelled and purification investment approved with commissioning expected in 2028. Indian export positions are established with three customers. Joint exposure measurement is under way with two battery manufacturers, and the client reports volume stabilising (client-reported, unverified by MMA). Alternatives were never going to work.

Frequently Asked Questions

Foundational context covering the market sizes, CAGR, scope, country, region and competition that inform every finding below. This section is provided to cover basics and most often pre-purchase conversations, answered from the MMA Primary Research Dataset.

What is the current size of the N-Ethyl-2-Pyrrolidone Market?

The market was valued at USD 0.42 billion in 2025, rising to an estimated USD 0.45 billion in 2026. East Asia holds the largest regional share at 32% of value.

How large will the N-Ethyl-2-Pyrrolidone Market be by 2036?

MMA forecasts USD 0.92 billion by 2036 under the base case, an expansion multiple of 2.04 times the 2026 value. That represents USD 0.47 billion of incremental value.

What is the CAGR for the N-Ethyl-2-Pyrrolidone Market 2026 to 2036?

The base case runs at 7.4% compound annual growth between 2026 and 2036, with a bull case at 8.6% and a bear case at 6.2%. Historical growth from 2020 to 2025 was 6.4%.

Which segment is growing fastest?

Electronics cleaning and photoresist applications lead at 11.1%, half again the market rate, where purity requirements exclude alternatives entirely. Battery electrode slurry follows at 9.0%.

Who are the major companies in the N-Ethyl-2-Pyrrolidone Market?

BASF, Mitsubishi Chemical, Ashland, Balaji Amines and Zhejiang Realsun hold 61% of supply between them. Feedstock integration rather than any process advantage sustains those positions.

Which country is growing fastest?

India leads at 10.8%, driven by active pharmaceutical ingredient manufacture that is expanding rapidly alongside minimal regulatory pressure on these solvents inside the domestic market.

Report Segmentation Architecture

The full report scope spans multiple orthogonal segmentation dimensions, with cross-tabulated demand data provided for each dimension pair. Coverage extends further to regional breakdowns, trend trajectories, and the competitive detail needed to support segment-level decision-making.

By Application

  • Battery Electrode Slurry
  • Pharmaceutical Synthesis
  • Agrochemical Formulation
  • Electronics Cleaning and Photoresist
  • Polymer Processing and Coatings
  • Industrial Cleaning and Paint Removal

By End-Use Industry

  • Battery Cell Manufacture
  • Semiconductor Fabrication
  • Pharmaceutical Manufacture
  • Crop Protection Formulation
  • Coatings and Adhesives
  • General Industrial Maintenance

By Supply Arrangement

  • Integrated Producer Direct Supply
  • Term Contract Supply
  • Chemical Distributor Channel
  • High Purity Qualified Supply
  • Spot Trading Channel

By Region

  • North America
  • Western Europe
  • East Asia
  • South Asia and Pacific
  • Latin America
  • Middle East and Africa
  • Eastern Europe

Scope, Methodology, and Coverage

Every figure in this report is reproducible from documented input assumptions. The scope below maps the historical period, the forecast horizon, the segmentation dimensions, and the countries covered, alongside the underlying primary and qualitative methodology.
Historical Period
2020 to 2025
Forecast Period
2026 to 2036
Base Year
2025 (USD billions; MMA Primary Research Dataset, August 2026)
Market Definition
The market comprises N-ethyl-2-pyrrolidone and closely substitutable dipolar aprotic pyrrolidone solvents supplied across battery, semiconductor, pharmaceutical, agrochemical, coatings and industrial applications, covering battery electrode slurry, pharmaceutical synthesis, agrochemical formulation, electronics cleaning and photoresist, polymer processing and coatings, and industrial cleaning and paint removal. Value is measured at producer level on tonnage supplied through integrated, term, distributor and spot channels. Non-pyrrolidone solvents sold as alternatives, polyvinylpyrrolidone polymers, recovered solvent traded between users and formulated cleaning products fall outside scope.
Quantitative Units
USD billions (current prices); thousand tonnes supplied annually; USD per tonne by application grade
Segmentation Dimensions
By Application; By End-Use Industry; By Supply Arrangement; By Region
Regions Covered
North America, Western Europe, East Asia, South Asia and Pacific, Latin America, Middle East and Africa, Eastern Europe
Countries Covered
China, Japan, South Korea, Taiwan, India, Singapore, Thailand, Vietnam, Australia, United States, Canada, Mexico, Germany, Belgium, Netherlands, France, United Kingdom, Italy, Spain, Switzerland, Poland, Hungary, Czechia, Slovakia, Brazil, Argentina, Colombia, Saudi Arabia, Israel, South Africa
Key Companies Profiled
BASF, Mitsubishi Chemical, Ashland, Balaji Amines, Zhejiang Realsun Chemical, LyondellBasell, Eastman Chemical, Merck KGaA, Jiangsu Tongzhou Bio-Pharmaceutical, Shandong Qiyuan Biotechnology, Anhui Haoyuan Chemical, Nantong Acetic Acid Chemical, Circa Group, Mitsui Chemicals, Zhangjiagang Huachang, Shijiazhuang Jinxing, Kaiyuan Chemical, Alfa Aesar, Tokyo Chemical Industry, Sinopharm Chemical Reagent
Quantitative Methodology
Primary survey, n=3,800 respondents, Q4 2025, six countries; demand-side model with trade association cross-validation
Qualitative Methodology
47 expert interviews, Q4 2025; applied to validate demand model assumptions, identify emerging dynamics, and assess competitive positioning
Report Format
PDF and XLSX data workbook (Word format preview document)
Publisher
Market Minds Advisory
Report Code
MMA-2026-CHM-679
Published
August 2026
Contact
sales@marketmindsadvisory.com | www.marketmindsadvisory.com

Purchase the full N-Ethyl-2-Pyrrolidone Market Report (2026 to 2036).

The full report sizes the global N-ethyl-2-pyrrolidone market to 2036 across six applications and seven regions, measured on tonnage supplied at producer level. It treats the inherited hazard classification as the governing commercial fact and quantifies the substitution fatigue it produced among buyers who funded one reformulation for nothing. Competitive analysis covers 20 participants evaluated on tonnage supplied, with moat and risk assessment for the two leaders. Closed-loop battery exposure is assessed separately from open handling, since the two present entirely different hazard cases. Four quantified revenue levers close the analysis.
Six-application segment sizing with segment-level growth rates
Seven-region share and growth breakdown to 2036
Twenty-participant competitive map on one tonnage basis
Closed-loop exposure assessed separately from open industrial handling
Alternative solvent performance gaps quantified by application requirement
Four quantified revenue levers with commercial impact ranges

Built For The People Who Decide

From boardroom strategy to bench-side execution, this report is read cover-to-cover by leaders shaping the next decade of their industry, turning demand scenarios, market dynamics and valuation benchmarks into decisions.
CXOs/ Presidents/ VPs/ Managers
M&A and Corporate Development
Strategy Teams and R&D Heads
Procurement and Product Directors
Regulatory and Compliance Leaders
Investor Relations and Equity Analysts