Market Minds Advisory
N-Methyl Pyrrolidone Market

N-Methyl Pyrrolidone Market: Battery fill economics, recovered supply competition and legacy application decline to 2036

Demand now tracks how many electrode plants actually get built rather than how many cells they eventually produce, because a running plant recovers almost everything and buys very little afterwards.

Lead Analyst

Bilal Shaikh

Published

September 2026

Make Smarter Decisions with Customized Research Insights

Request a free sample report and evaluate market opportunities, growth trends, and competitive dynamics relevant to your business needs.

2025 MARKET VALUE$1.9BMarket Size 2025
2036 FORECAST VALUE$3.8BBase Case , 2026 to 2036
CAGR 2026 TO 20366.8 %Bull 8.0% / Bear 5.6%
INCREMENTAL OPPORTUNITY$1.9BNet 10- year value creation
EXPANSION MULTIPLE1.93x2036 value over 2026 base
Strategic Levers
M&A Pipeline
Regional Outlook
Country Rankings
Competitive Intelligence
Segmental Deep-dive
Call-Us : 91 93563 13602

Executive Snapshot and Market Trajectory

A new electrode plant needs around 900 tonnes of solvent before it starts and replaces only about 4% of that annually afterwards, because recovery returns nearly everything. Demand therefore follows plant construction rather than plant output, which most forecasting in this market gets wrong. Construction schedules forecast this properly.
Recovered and recycled material grows at 10.2%, half again the market rate of 6.8%, because every battery plant that commissions becomes a source of returning solvent competing with virgin supply. East Asia holds 33% of value, above the usual band, on electrode manufacture concentrated there. Battery processing now takes 54% of total demand. Virgin producers increasingly compete against their own molecules coming back into the market at costs new production cannot match.
Five producers hold 56% of supply and the concentration follows feedstock integration rather than any process advantage. What has genuinely changed is the customer: coatings, cleaning and surface preparation applications that defined this solvent for fifty years are contracting at roughly 6% annually under restriction, while a battery industry that barely existed a decade ago now sets the whole demand curve. Nobody predicted that.
Market Definition
This report covers N-methyl-2-pyrrolidone supplied as virgin and recovered material across industrial applications, spanning battery electrode processing, recovered and recycled NMP, petrochemical extraction, pharmaceutical and agrochemical synthesis, electronics and photoresist stripping, and coatings, cleaning and surface preparation. Value is measured at producer and recovery operator level on tonnage supplied. Excluded are other pyrrolidone solvents sold as substitutes, polyvinylpyrrolidone polymers, formulated cleaning products, and electrode slurry sold as a finished intermediate.
Base Year Value
$1.9B in 2025 (MMA Primary Research Dataset, August 2026)
Forecast Period
2026 to 2036, eleven discrete annual values
CAGR
6.8% base case. Bull 8.0%. Bear 5.6%.
Fastest Growth Segment
Recovered and Recycled NMP: 10.2% CAGR
Fastest Growth Country
China: 10.4% CAGR
Fastest Growth Region
South Asia and Pacific: 8.8% CAGR
Largest Region
East Asia: 33% of 2025 global value
Market Leaders
BASF, Mitsubishi Chemical, LyondellBasell, Zhejiang Realsun Chemical and Jiangsu Tongzhou Bio-Pharmaceutical lead the market. Source: MMA Primary Research Dataset, July 2026.
Primary Survey
n=3,800 procurement and R&D decision-makers, Q4 2025, six countries
Methodology
Demand-side build-up, cross-validated against public data, 47 expert interviews

N-Methyl Pyrrolidone Market Forecast Scenarios

n-methyl-pyrrolidone-market-trends-size-forecast-scenario-1787555794426
Growth ran at 5.8% between 2020 and 2025 and the composition of demand changed more than its size did. Battery electrode capacity commissioned across China, Korea and increasingly Europe consumed initial solvent fills at substantial scale. Coatings, cleaning and paint stripping applications contracted steadily as European reproductive toxicity restriction removed open handling uses that had defined the solvent for decades.
The 6.8% base case rests on three mechanisms. Battery electrode plant construction continues across every region building cell capacity, and each commissioning consumes an initial fill measured in hundreds of tonnes. Recovered material keeps growing at 10.2% as the installed plant base expands and returns solvent into the market. And electronics photoresist stripping keeps expanding with semiconductor investment at purity levels that exclude most producers. None of those three depends on cell output rising at all.
The 8.0% bull case is battery capacity commissioning faster than announced schedules suggest, since initial fills dominate demand and a construction acceleration converts directly into solvent volume. The 5.6% bear case is dry electrode processing reaching commercial scale, which removes the solvent from battery manufacture entirely and would strand capacity built for an application representing over half of current demand.

Demand Follows Construction, Not Output

The most consequential thing about this market is a demand shape that almost nobody models correctly. A new battery electrode plant requires an initial solvent charge of around 900 tonnes to fill its slurry mixing, coating and recovery systems before it produces a single electrode. Once running, closed-loop condensation and distillation return nearly all of it, and the plant replaces perhaps 4% of that charge annually. Demand therefore correlates with how many plants get built rather than with how many cells they subsequently make, and those two curves diverge sharply.
TOP-FIVE CONCENTRATION56%Combined position across global supply held by leading producers
BATTERY SHARE OF DEMAND54%Portion of volume now consumed inside electrode processing plants
GIGAFACTORY INITIAL FILL900 tonnesSolvent inventory a new electrode plant requires before starting
ANNUAL MAKEUP REQUIREMENT4%Share of the initial charge a running plant replaces yearly
FEEDSTOCK COST SHARE59%Portion of production cost attributable to purchased raw chemicals
COATINGS DEMAND DECLINE6%Annual contraction in industrial coatings and cleaning consumption
That shape has commercial consequences producers frequently miss. A construction boom generates enormous solvent demand followed by a long plateau of small makeup volumes, which means a supplier who builds capacity against announced gigafactory pipelines faces a cliff once commissioning finishes rather than a growing annuity. Forecasts extrapolating from cell production overstate demand substantially, and several capacity decisions rest on that error.
Meanwhile the solvent's original identity is disappearing. Coatings, cleaning and surface preparation applications that defined it for fifty years contract at roughly 6% annually under reproductive toxicity restriction, and the customer base has become a battery industry that did not exist commercially a decade ago.
"People model this against gigawatt hours and it should be modelled against construction schedules. A plant buys nine hundred tonnes to open and forty a year to keep going, and the difference between those two numbers is the whole forecasting problem."
Director, Battery Materials and Process Chemicals Practice · MMA Chemicals and Materials Practice · August 2026

Market Trends

Initial fills dominate demand and construction sets the curve

An electrode plant requires around 900 tonnes of solvent to charge its mixing, coating and recovery systems before producing anything, and thereafter replaces roughly 4% of that annually because recovery returns nearly everything. The consequence is that demand tracks commissioning schedules rather than production volumes, and those diverge sharply once a construction wave completes. Producers extrapolating from cell output forecasts substantially overstate future consumption. Commercially this means a capacity decision taken during a gigafactory boom faces a demand cliff rather than a plateau, which several producers are discovering rather uncomfortably at present.
Market Impact: Takes 54% of total demand

Recovered solvent competes directly with virgin production

Battery plants recovering around 96% of their annual throughput generate returning material that is chemically identical to virgin product once purified, and as the installed plant base expands that recovered volume grows alongside it. Specialist recovery operators are building businesses on exactly this stream. Growth at 10.2% follows installed capacity rather than any new demand, which means virgin producers are increasingly competing against their own molecules coming back into the market. Commercially this caps virgin volume growth well below what battery expansion alone would suggest and pressures pricing in the largest application.
Market Impact: Segment compounds at 9.4% annually

Market Opportunities and Growth Drivers

Battery electrode plant construction continues across every region

Cell manufacturing capacity keeps being commissioned across China, Korea, Japan, Europe and North America, and each electrode plant requires an initial solvent charge measured in hundreds of tonnes before producing anything at all. That construction is driven by vehicle manufacturer supply commitments, domestic content requirements and grid storage demand rather than by any chemical market consideration. Battery processing now takes 54% of total demand and continues rising as legacy applications contract. The commissioning pipeline is publicly documented, which makes this the most forecastable demand in the market for anybody who reads it correctly.
Market Impact: Contracts 6% every single year

Semiconductor investment sustains high purity photoresist demand

Photoresist stripping and post-etch residue removal require this solvent at purity levels that ordinary industrial grades cannot approach, with metal contamination controlled to single parts per billion and particle counts held tightly. Fabrication investment across Taiwan, Korea, Japan, the United States and Europe keeps expanding that consumption at specifications that continue tightening. Growth at 9.4% reflects both capacity expansion and the fact that no alternative solvent removes cured photoresist as completely. Those buyers purchase on specification rather than negotiating tonnage, which makes the application unusually profitable relative to its volume.
Market Impact: Threatens 54% of demand

Market Restraints and Challenges

Legacy coatings and cleaning applications contract steadily

Industrial coatings, cleaning and paint stripping consumption declines at roughly 6% annually as European reproductive toxicity restriction removes open handling uses and other jurisdictions follow. The root cause is toxicological classification applying to a solvent used for fifty years in exactly the applications where worker exposure is highest and least controlled. Commercially this eliminates rather than transfers volume, since alternatives at lower performance are adequate for most of those uses. Producers are responding by concentrating on enclosed battery, electronics and pharmaceutical applications where exposure is controlled and performance genuinely matters.
Market Impact: Requires 900 tonnes per plant

Dry electrode processing would remove the largest application

Dry electrode manufacture forms the coating through binder fibrillation and mechanical pressing without any solvent, eliminating both the slurry and the drying oven. The root cause of the exposure is that this substitutes a process rather than a material, so no solvent development answers it at all. Commercially it threatens the 54% of demand that battery processing represents, and the energy savings from removing drying make the case independently of chemistry. Commercial scale remains limited and several manufacturers are pursuing it seriously, which leaves the timing genuinely uncertain rather than distant.
Market Impact: Recovered volume compounds at 10.2%
3 additional market trends, 4 additional growth drivers, and 2 additional restraints and challenges are covered in the full report. Contact sales@marketmindsadvisory.com to access the complete intelligence.

Segment CAGR and Growth Architecture

Volume is classified here by application and source, since recovered material competes directly with virgin production and belongs in the same comparison. Producer integration, purity grade and supply arrangement are handled separately in the framework, because one grade serves several applications without any modification. Source matters as much as application now. Both determine the price.
n-methyl-pyrrolidone-market-trends-market-share-analysis-1787555794959

Recovered and Recycled NMP

Growing at 10.2%, half again the market rate, recovered material is the segment virgin producers rarely include in their own market sizing and probably should. Battery plants recover nearly all their throughput through condensation and distillation because losing solvent is economically unacceptable, and specialist operators purify the residual streams into product chemically indistinguishable from virgin material. As the installed plant base expands, recovered volume expands with it automatically. That means virgin producers increasingly compete against their own molecules returning to the market at costs no new production can match. The stream is genuinely growing faster than the demand it serves, which is an unusual and uncomfortable position. Producers rarely count it.
CAGR 10.2%

Electronics and Photoresist Stripping

Removing cured photoresist and post-etch residue demands complete dissolution at purity levels where metal contamination is measured in single parts per billion, because a residue left behind destroys a wafer worth considerably more than any quantity of solvent. No alternative chemistry removes cured resist as completely, which makes substitution pressure largely theoretical in this application whatever regulators decide elsewhere. Growth at 9.4% follows semiconductor fabrication investment across Taiwan, Korea, Japan, the United States and Europe. Handling occurs entirely inside enclosed tool sets, which addresses the exposure concern driving restriction in open industrial uses completely. Those buyers purchase on specification rather than negotiating tonnage, which makes the application unusually profitable relative to the volume it actually consumes.
CAGR 9.4%
Full segment breakdown across 6 segments available in the complete report.

Regional Architecture and Country Demand Map

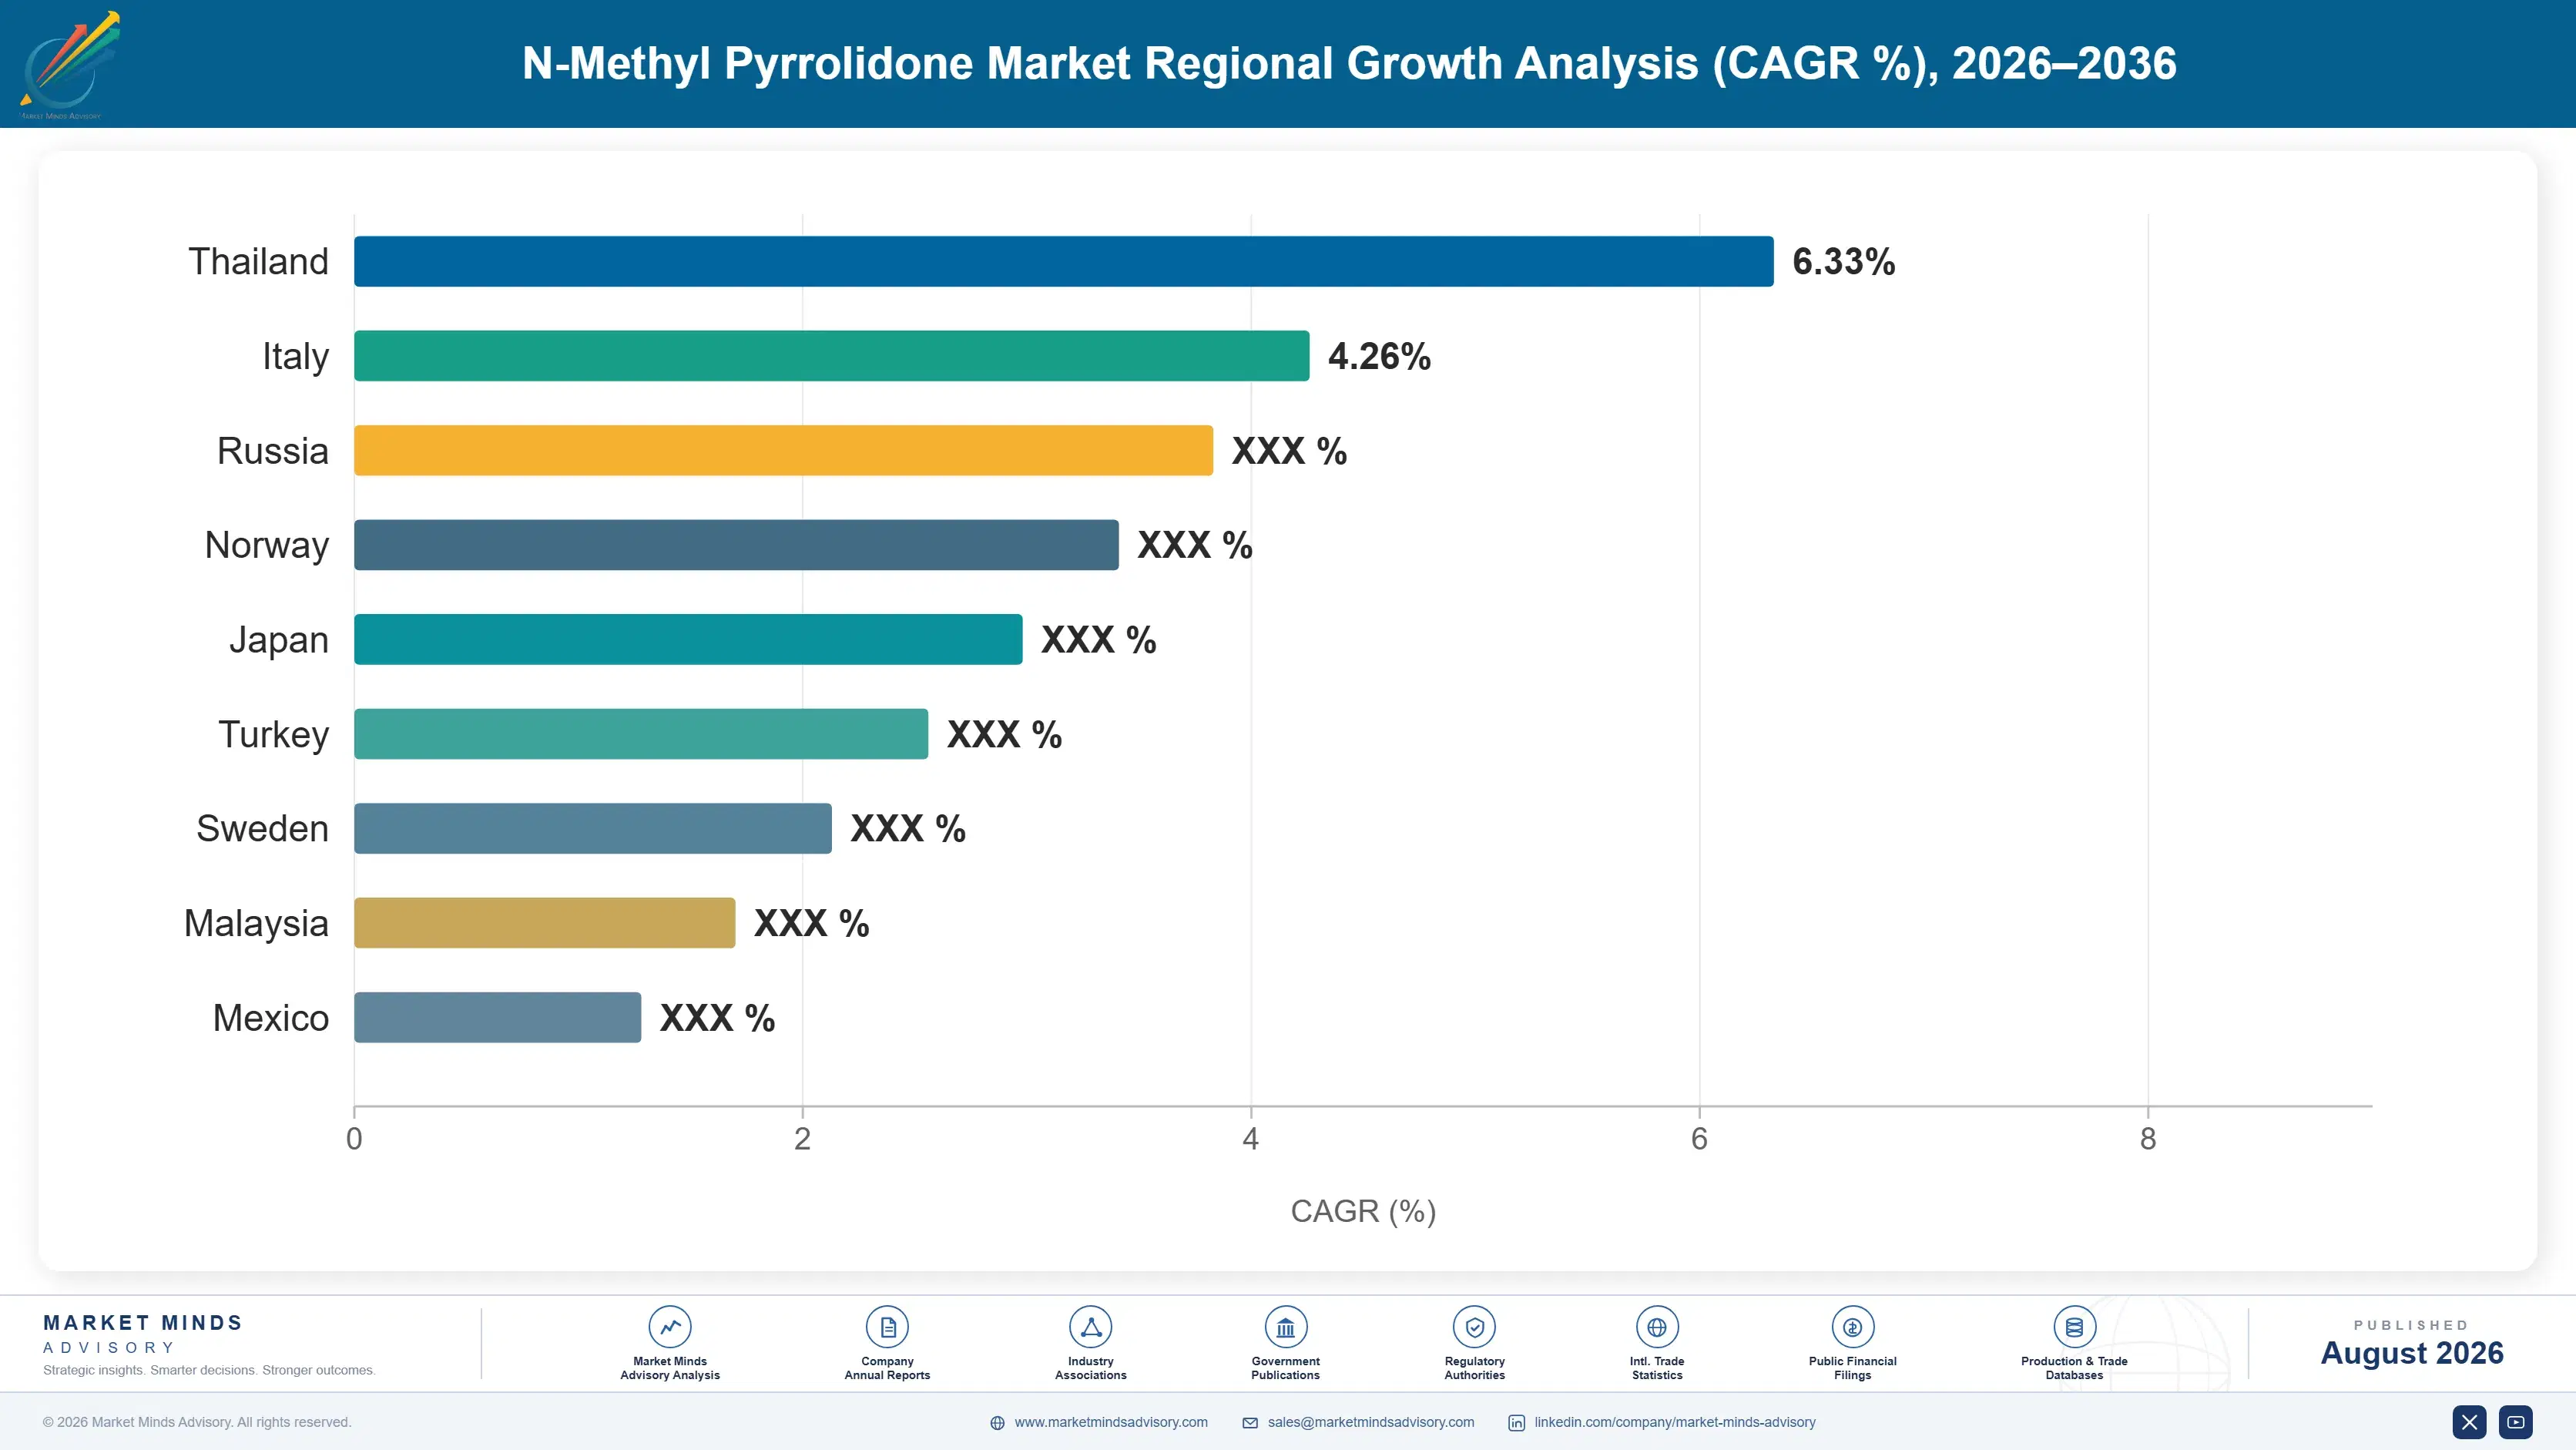
East Asia holds 33% of value, above the usual band, because battery electrode and semiconductor manufacture both concentrate there far more heavily than in any other chemical chain. North America follows at 22%. Plant construction decides everything here. Output explains rather less than most analysis assumes it does.

East Asia

At 33% this region sits above the usual band ceiling because battery electrode manufacture and semiconductor fabrication both concentrate here to a degree few chemical chains match anywhere. Chinese electrode capacity commissioning has consumed initial fills at extraordinary scale over a decade and continues, though the pipeline is maturing and makeup volumes will eventually dominate. Chinese growth at 10.4% is the fastest of any country here. Korean and Japanese producers hold the deepest capability in electronic grade purity and supply fabs globally. Domestic production serves most regional demand at costs international producers cannot approach on industrial grades. This share sits above the usual ceiling because no other chemical chain concentrates its demand quite this heavily.
Share: 33% | CAGR: 7.8% (2026 to 2036)

North America

Battery cell manufacturing investment under domestic content incentives has created solvent demand where almost none existed five years ago, with each new electrode plant requiring an initial charge before producing anything. That construction wave dominates regional consumption and will subside into makeup volumes once commissioning completes. Semiconductor fabrication expansion adds high purity demand at specifications only a few producers meet. Chemical review is advancing on this solvent and affects open handling applications more than enclosed ones. Growth at 8.0% is the fastest large-region figure and rests almost entirely on plant construction schedules. Commissioning dominates and will subside into makeup volumes within a few years. Construction sets the curve. Purity demand grows alongside.
Share: 22% | CAGR: 8.0% (2026 to 2036)
Regional intelligence for 5 additional markets available in the complete report: Western Europe, South Asia and Pacific, Latin America, Middle East and Africa, Eastern Europe. Contact sales@marketmindsadvisory.com.
n-methyl-pyrrolidone-market-trends-country-cagr-analysis-1787555795475

Where Solvent Margin Actually Sits

Four moves matter in a market where demand follows construction schedules, recovered material competes with virgin production and the applications that built the business are being regulated away. Two are about reading the demand shape correctly, and two are about the applications nothing substitutes into. Extrapolating from cell output is not among them. Nobody should.

Forecast against commissioning schedules, not output

An electrode plant consumes around 900 tonnes as an initial charge and roughly 4% of that annually thereafter, which means demand tracks how many plants commission rather than how many cells they produce. Those curves diverge sharply once a construction wave completes. Producers building capacity against gigawatt hour forecasts are sizing for an annuity that does not exist and will meet a demand cliff instead. Reading published commissioning pipelines rather than production projections is the single most valuable forecasting change available in this market. Pipelines are published. Reading them is free.
Market Impact: Models the full 900 tonne initial fill correctly

Enter recovery rather than competing against it

Battery plants return nearly all their throughput and recovered material purifies into product chemically indistinguishable from virgin at costs no new production matches. That stream compounds at 10.2% and grows automatically with the installed plant base rather than with any demand. Virgin producers watching their own molecules return as competition can instead operate the recovery, which converts a threat into a position and puts them inside the customer's plant. Very few virgin producers have moved, which leaves specialist operators building businesses on volume the producers originally supplied. Position beats competition.
Market Impact: Captures a stream now compounding at 10.2% annually

Concentrate on applications regulation cannot reach

Coatings, cleaning and surface preparation contract at around 6% annually because open handling is exactly where reproductive toxicity restriction applies and alternatives at lower performance are adequate there. Battery processing and photoresist stripping both occur inside enclosed systems where exposure is controlled and no alternative performs adequately, which makes them defensible on both grounds simultaneously. Producers still serving declining open handling volume are defending applications that will disappear entirely rather than transfer, and every year spent there is a year not spent qualifying elsewhere. Withdrawal beats defence. Every year there is wasted.
Market Impact: Escapes a 6% annual contraction in that demand

Build purity capability for semiconductor qualification

Photoresist stripping demands metal contamination controlled to single parts per billion because residue destroys a wafer worth far more than any solvent quantity, and no alternative chemistry removes cured resist as completely. That combination makes substitution pressure largely theoretical in the application whatever regulators decide about open industrial uses. Growth at 9.4% follows fabrication investment across five major regions. Qualification takes years and holds for years afterwards, which makes it the most defensible position available to a producer watching legacy volume disappear. Revenue is disappearing. Qualification holds for years. Legacy revenue funds it.
Market Impact: Meets a 1 part per billion metal specification

Who Controls the Margin Pool

Five producers hold 56% of supply, measured on tonnage supplied at producer and recovery operator level, the basis used throughout this section. That concentration follows integration into butyrolactone and methylamine feedstocks representing 59% of production cost rather than any process advantage, since the synthesis is public chemistry that many companies could run competently given the raw materials. Raw materials decide everything.
Competition runs on three dimensions. Feedstock integration, which decides cost position more than any operating improvement can. Purity capability for semiconductor and pharmaceutical qualification, where specification rather than price governs. And increasingly recovery operation, since recovered material competes directly with virgin production. Price competes hardest in industrial grades where restriction is eliminating demand anyway. Recovery is becoming a third front. Recovered material competes on cost nobody new can match.

Rankings shift as recovery operators take volume that virgin producers previously supplied, which is an unusual competitive dynamic since the molecules are the producers' own returning. Chinese producers dominate industrial grade volume on feedstock cost. Battery construction timing rather than any competitive action determines regional demand across the forecast period. Chinese producers hold industrial grade cost positions permanently.
n-methyl-pyrrolidone-market-trends-company-positioning-matrix-1787555795993

Competitive Moat and Risk Dimensions

BASF

Moat: Feedstock and purity integration

BASF produces the butyrolactone and methylamine feedstocks accounting for 59% of production cost, which converts integration into a cost position no merchant buyer approaches. The company also holds purity capability serving pharmaceutical and electronic applications where specification rather than price governs purchasing, which is precisely where demand is moving as legacy volume disappears.
BASF

Risk: European legacy volume decline

A substantial European position sits inside the jurisdiction that restricted this solvent as a reproductive toxicant, eliminating open handling applications contracting at roughly 6% annually. European battery capacity has repeatedly underdelivered against announcements, which leaves the offsetting demand smaller than planned. Producers weighted toward Asian battery and electronics consumption face considerably less of that erosion.
ZHEJIANG REALSUN CHEMICAL

Moat: Chinese battery proximity and cost

The company operates inside the region commissioning more electrode capacity than everywhere else combined, which matters enormously when initial fills measured in hundreds of tonnes go to whoever can supply quickly and locally. Chinese feedstock costs and freight proximity together produce a position international producers cannot match on industrial and battery grade material.
ZHEJIANG REALSUN CHEMICAL

Risk: Construction wave maturity ahead

Chinese electrode capacity commissioning has been the dominant demand driver for a decade and that pipeline is maturing, after which makeup volumes at roughly 4% of installed charge dominate instead. A position built on initial fills faces a demand shape change rather than a competitive one. Producers with electronics or pharmaceutical positions carry demand independent of construction.

Players Tracked

Prominent Players

BASF
Mitsubishi Chemical
LyondellBasell
Zhejiang Realsun Chemical
Jiangsu Tongzhou Bio-Pharmaceutical

Other Key Players

Ashland
Eastman Chemical
Balaji Amines
Merck KGaA
Shandong Qiyuan Biotechnology
Anhui Haoyuan Chemical
Nantong Acetic Acid Chemical
Mitsui Chemicals
Zhangjiagang Huachang
Shijiazhuang Jinxing
Kaiyuan Chemical
Puyang Myland Chemical
Sinopharm Chemical Reagent
Tokyo Chemical Industry
Solventis

Recent Developments

FEBRUARY 2025

A recovery operator opened purification capacity at a battery cluster

A specialist solvent recovery operator commissioned purification capacity adjacent to a battery manufacturing cluster, processing recovered streams into material chemically indistinguishable from virgin product. This was organic capital investment rather than any partnership with the virgin producers whose molecules it processes. Producers had not moved first.
Signal: Recovery operators are taking volume virgin producers originally supplied, using the producers' own molecules to do it
AUGUST 2025

A producer cut capacity after a commissioning wave completed

A pyrrolidone producer reduced operating capacity after a regional battery construction wave finished commissioning, as demand fell from initial fill volumes to annual makeup requirements representing a small fraction of that. This was an operating decision rather than any transaction. The forecasting error was widespread.
Signal: The demand cliff after commissioning is now visible in operating decisions, which confirms the forecasting error was widespread
DECEMBER 2025

A European formulator exited coatings applications entirely

A European industrial formulator discontinued pyrrolidone-based coatings and cleaning products, citing reproductive toxicity restriction on open handling applications and adequate performance from lower cost alternatives in those uses. This was a product withdrawal rather than any commercial transaction. That volume disappears permanently. Alternatives proved adequate.
Signal: Legacy applications are exiting rather than substituting, which means that volume disappears from the market permanently

What Moves Producer Cost

Purchased raw chemicals account for around 59% of production cost, principally gamma-butyrolactone and methylamine, both from limited producer bases or made internally by integrated participants. Energy for reaction and distillation is meaningful. Purification to electronic grade adds cost disproportionate to volume. Recovery operations face an entirely different structure dominated by collection logistics and distillation energy rather than by feedstock at all.
Butyrolactone and methylamine prices moved sharply through 2021 and 2022 on petrochemical feedstock and European energy costs, and IEA data show European industrial gas far above Asian levels across that period. BASF recorded raw material and energy cost pressure across its intermediates operations in its Annual Report 2022. Producers holding term contracts with battery and pharmaceutical customers absorbed most of the movement, since those buyers fix process costs for a period.

Recovered material has a cost structure that virgin production cannot compete with and virgin producers rarely model. A recovery operator pays collection and distillation rather than the 59% raw chemical burden virgin synthesis carries. As the installed battery plant base grows, that lower cost supply grows with it automatically. Virgin producers treating recovery as a niche underestimate a competitor whose economics improve as this market grows.
n-methyl-pyrrolidone-market-trends-cost-volatility-analysis-1787555796188

Operate recovery rather than watching competitors do it

Recovered material carries collection and distillation cost rather than the 59% feedstock burden virgin synthesis pays, which makes it a permanently cheaper supply that grows with every plant commissioned. Virgin producers can operate that recovery themselves, converting a competitive threat into a position inside the customer's plant. Very few have moved, and specialist operators are building the businesses instead.

Contract butyrolactone across several qualified producers

Gamma-butyrolactone comes from a limited producer base and an interruption halts pyrrolidone production entirely rather than merely raising cost for a period. Qualifying two or three sources takes commercial effort rather than capital and delivers continuity worth considerably more than any single-source discount. Producers without integration carry availability risk that purchasing arrangements never fully remove.

Size capacity against commissioning, not production forecasts

Initial fills of around 900 tonnes dominate battery demand while makeup runs at roughly 4% annually, so capacity built against cell output projections meets a cliff once construction completes. Published commissioning pipelines forecast this demand far better than any gigawatt hour projection does. Producers who sized against output are already reducing rates, which was entirely avoidable.

Portfolio Architecture for Margin Defence

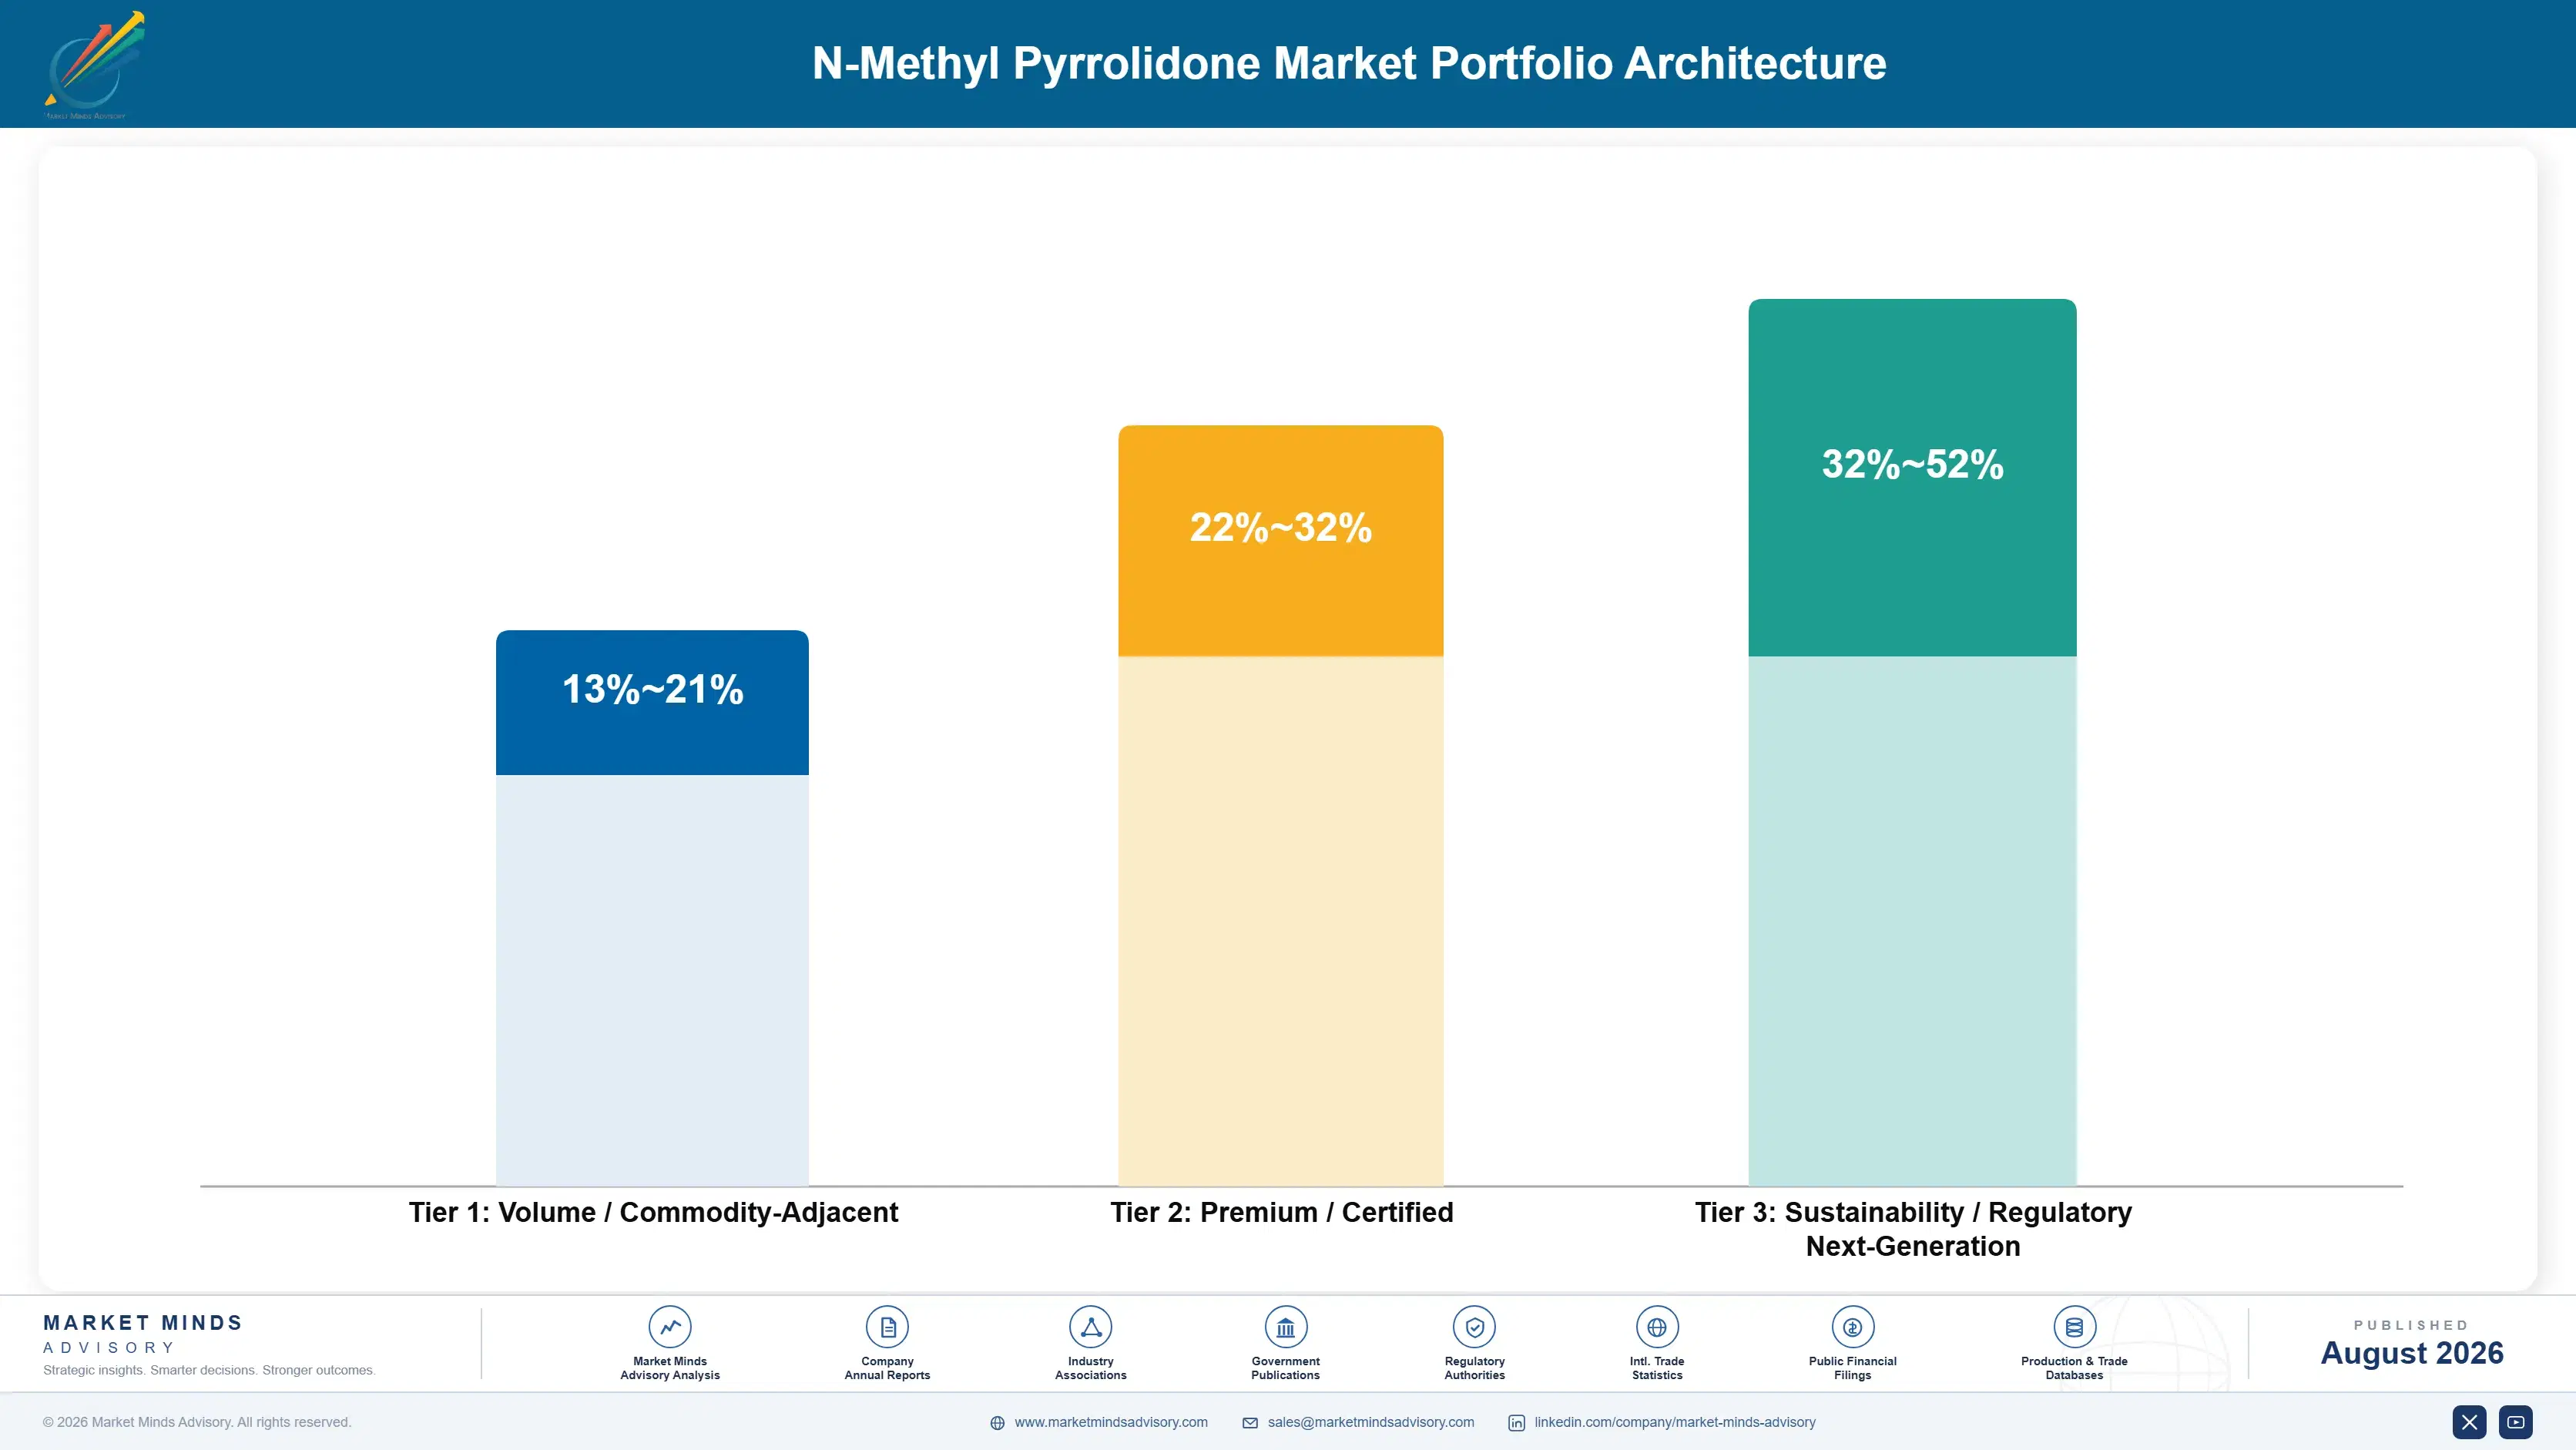
Margin here tracks purity grade and application durability rather than production scale, because the synthesis is public chemistry and feedstock access rather than skill determines cost. Industrial and coatings grade runs at gross margins in the mid teens against Chinese feedstock costs and into applications contracting at 6% annually. Battery grade runs somewhat better on volume and proximity requirements. Electronic and pharmaceutical grades run considerably higher, because purity and qualification exclude most producers entirely. Feedstock access rather than skill decides it.
The tension is that battery volume dominates tonnage while electronics and pharmaceutical grades carry margin, and the two need different purification capital and different qualification cycles. Producers who built for battery fills face a demand shape change as commissioning matures, and repositioning toward electronics requires purification investment and multi-year qualification funded from revenue that is about to fall. That sequencing problem is uncomfortable and entirely foreseeable.

High-value pools sit in electronic grade purity, recovery operation and pharmaceutical qualification. Only one of the three depends on battery construction continuing. Production capacity by itself defends nothing against recovered molecules returning at lower cost. Purity and recovery defend considerably more.

Volume / Commodity-Adjacent

Industrial, coatings and cleaning grade material serving applications contracting at 6% annually under restriction and competing against Chinese feedstock advantages. The eight-point range separates integrated producers from those buying butyrolactone and methylamine entirely on merchant terms.
Gross Margin: 13%-21%

Premium / Certified

Battery grade and petrochemical extraction supply where volume, proximity and consistency matter more than any purity distinction. The ten-point spread reflects freight position and recovery integration, since local supply and returned molecules both undercut distant virgin production.
Gross Margin: 22%-32%

Sustainability / Regulatory / Next-Generation

Electronic grade purity, pharmaceutical qualified material and recovery operation. The twenty-point range is wide because purity qualification and recovered cost structures both create positions that ordinary virgin production cannot approach at any scale.
Gross Margin: 32%-52%
n-methyl-pyrrolidone-market-trends-portfolio-architecture-1787555796693

High-value Sub-segments and Strategic Watch-out

Recovery Operation Position

Recovered material carries collection and distillation cost instead of a 59% feedstock burden and grows automatically with every plant commissioned. Virgin producers watching their own molecules return could operate that recovery themselves instead. Specialist operators are building those businesses instead, using molecules producers originally supplied.
Gross Margin: 34%-52%

Electronic Grade Purity Supply

Compounding at 9.4% and protected by single parts per billion metal specifications alongside dissolution performance no alternative matches on cured photoresist. Enclosed tool handling removes the exposure concern entirely as well. Qualification runs years and holds for years afterwards, which makes it genuinely defensible. Nobody arrives late.
Gross Margin: 36%-50%

Industrial And Coatings Grade

Contracting at 6% annually as restriction eliminates open handling and adequate alternatives exist for those uses. Manage for orderly withdrawal rather than defence, because this volume disappears rather than transferring. Alternatives are adequate there and restriction removes the rest of it. Withdrawal is the honest answer here.
Gross Margin: 13%-21%

Battery Initial Fill Supply

Around 900 tonnes per plant at commissioning against 4% annual makeup afterwards, which makes this a construction business rather than an annuity. Sizing capacity against cell output badly misreads it. Capacity sized against output meets a cliff rather than any plateau. Commissioning pipelines forecast it accurately.
Gross Margin: 20%-30%

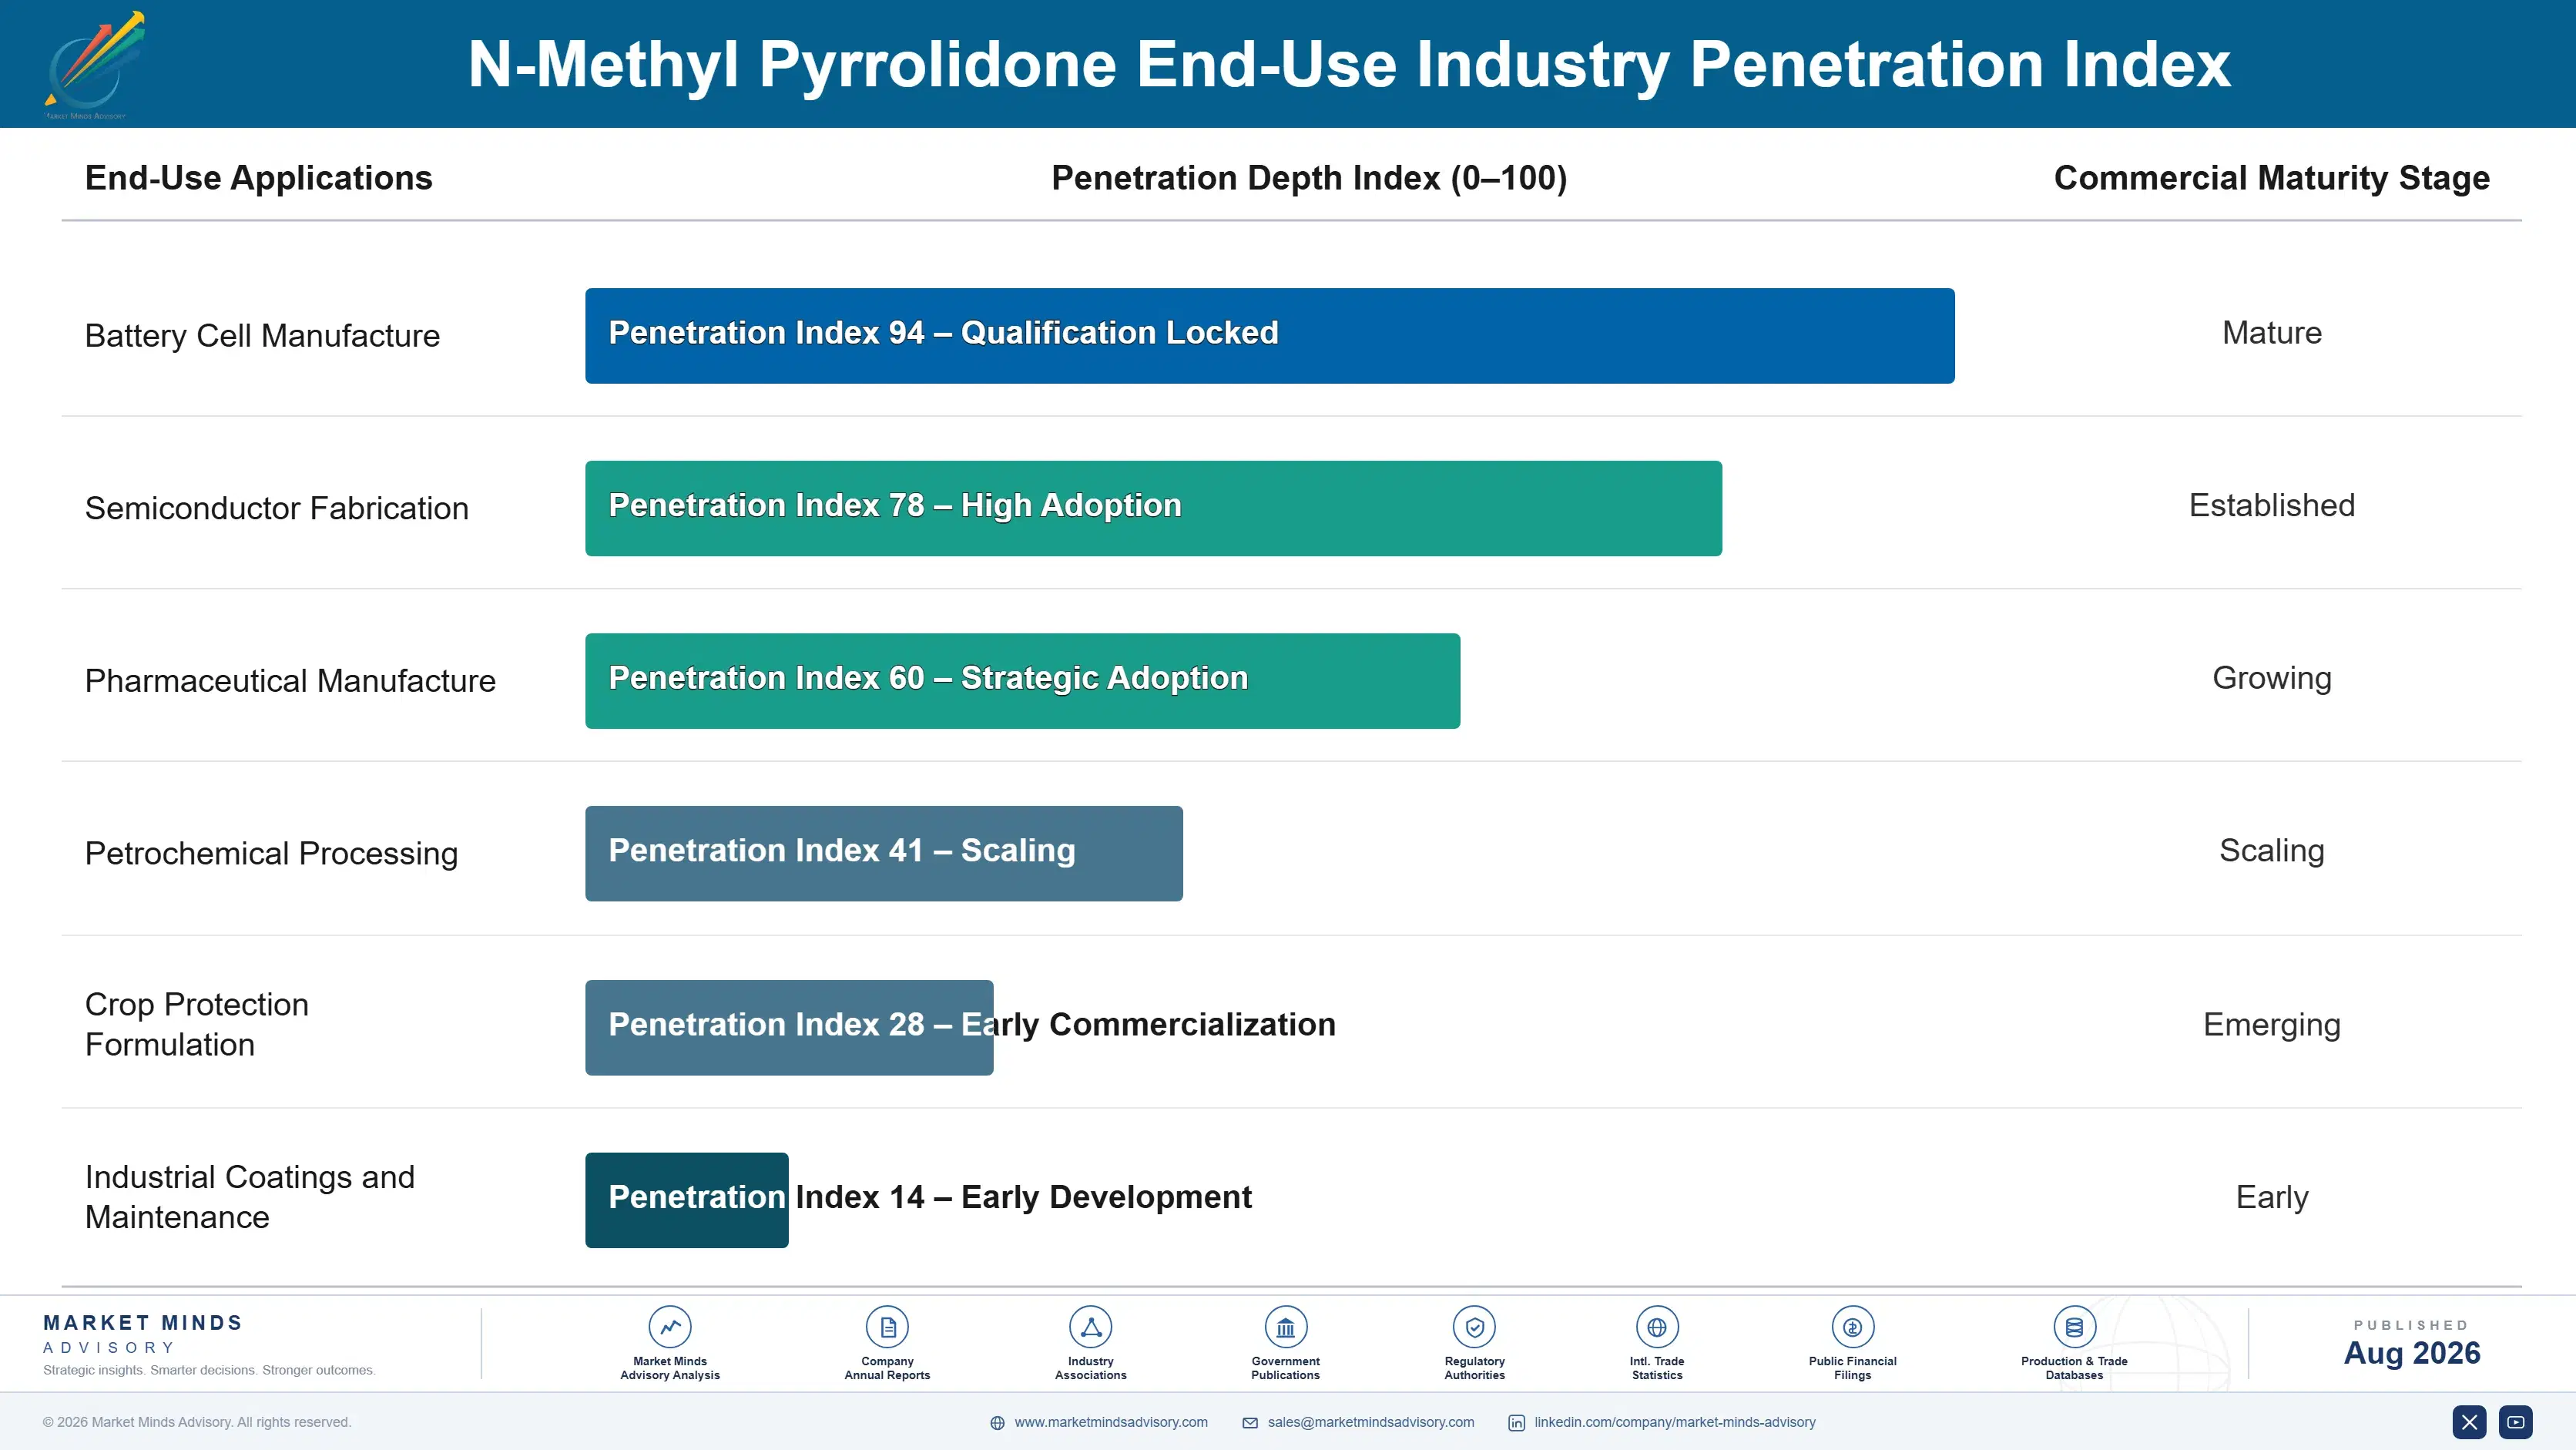
How Solvent Demand Renews

Demand renews in two shapes that could hardly differ more. Battery demand arrives as a large initial fill when a plant commissions and then almost stops, running at roughly 4% of the charge annually because recovery returns the rest. Pharmaceutical, electronics and extraction demand renews continuously with production and behaves like ordinary industrial consumption. Aggregating the two produces a curve that describes neither, which is why so much forecasting in this market has been wrong.
Stickiness is high wherever documentation attaches and low where it does not. Pharmaceutical positions inside registered synthesis routes are effectively permanent, since regulatory variation costs exceed any input saving. Electronic qualifications hold on requalification risk. Battery makeup volumes hold on recovery system compatibility, since a plant's distillation train is tuned to a specific impurity profile and a different supply upsets it.

The customer base has changed identity rather than merely changing hands. This solvent served coatings formulators, industrial cleaners and paint strippers for fifty years, and those buyers are leaving under restriction. It now serves battery process engineers and semiconductor fabs, who buy on entirely different criteria and would not recognise the industry it used to be.
n-methyl-pyrrolidone-market-trends-end-use-penetration-index-1787555797180

Where To Place The Bet

These are among the four positions where our research anticipates prominent divergence between winners and laggards over the coming forecast period. Each is grounded in the demand model, the regulatory perimeter, and the announced capacity pipeline.
01 / DEMAND SHAPE CORRECTION

Forecast commissioning schedules, not gigawatt hours

A battery electrode plant consumes an initial solvent charge of around 900 tonnes before producing anything at all and then replaces roughly 4% of that annually, because closed-loop recovery returns nearly everything else. Demand therefore tracks how many plants commission rather than how many cells those plants subsequently manufacture, and the two curves diverge sharply once any construction wave completes. Producers sizing capacity against gigawatt hour projections are building for an annuity that does not exist and will meet a demand cliff instead of a plateau.
02 / RECOVERY BUSINESS ENTRY

Operate the recovery competing with your production

Battery plants return nearly all their throughput and specialist operators purify those streams into material chemically indistinguishable from virgin product at costs no new synthesis can match, since recovery pays collection and distillation rather than the 59% feedstock burden. That stream compounds at 10.2% and expands automatically with every plant commissioned anywhere. Virgin producers watching their own molecules return as competition can instead operate the recovery themselves, which converts a growing threat into a position physically inside the customer's plant.
03 / APPLICATION MIGRATION DISCIPLINE

Leave open handling before it leaves you

Coatings, cleaning and surface preparation applications contract at roughly 6% annually because open handling is precisely where reproductive toxicity restriction applies most forcefully and lower performance alternatives are entirely adequate for those uses. That volume disappears from the market rather than transferring between suppliers, which makes defending it a waste of commercial effort. Battery processing and photoresist stripping both occur inside enclosed systems where exposure is genuinely controlled and no alternative performs adequately, making them defensible on two independent grounds.
04 / PURITY QUALIFICATION INVESTMENT

Buy the semiconductor barrier while revenue lasts

Photoresist stripping demands metal contamination controlled to single parts per billion, because residue left on a wafer destroys something worth far more than any quantity of solvent could ever cost. No alternative chemistry removes cured photoresist as completely, which makes substitution pressure largely theoretical in this application regardless of what regulators decide about open industrial handling elsewhere. Qualification takes years and holds for years afterwards, and it must be funded from legacy revenue that is currently disappearing at 6% annually.

Engagement Snapshot From the Field

A live engagement with an industry participant carrying material or product regulatory and market exposure ahead of a defining policy shift, showing how our research translates into a defensible multi-year portfolio strategy.
MARKET MINDS ADVISORY · CLIENT ENGAGEMENT SUMMARY
N-Methyl Pyrrolidone Producer Strategic Portfolio Review and Transition Roadmap 2026·Investment Scenario on N-Methyl Pyrrolidone Exposure Evaluation 2025-26
CLIENT PROFILE
An Asian pyrrolidone producer with annual revenue around USD 240 million (client-reported, unverified by MMA), supplying battery, industrial and pharmaceutical grade material. Capacity expansion had been approved against regional gigafactory announcements. Electronic grade purification was absent. No recovery operation existed anywhere in the business. Demand forecasting used published cell output projections throughout the business. Recovery was never considered.
STRATEGIC CHALLENGE
Volume had grown strongly through a battery construction wave and management had approved further capacity against announced cell output projections. Nobody had modelled the difference between initial fill demand and annual makeup, which meant the expansion was sized against a number that would not persist beyond commissioning. Nobody had questioned the underlying assumption.
MMA APPROACH
MMA rebuilt regional demand from published commissioning schedules and plant fill requirements rather than from cell output projections, separating initial charges from makeup volumes explicitly. Recovery operator activity was mapped across the client's customer base. Electronic grade purification economics were modelled, and legacy application decline was quantified by jurisdiction. Stranded capacity risk was quantified.
KEY FINDINGS
  1. Demand modelled from commissioning schedules fell substantially below the client's projection once the regional construction wave completed, since makeup runs at a small fraction of initial fill.
  2. Recovery operators were already processing streams from three of the client's largest customers, supplying material the client had originally provided at costs it could not match.
  3. The approved capacity expansion would have commissioned into a declining demand curve, arriving precisely as regional initial fill requirements finished rather than continued.
  4. Electronic grade purification was reachable from the client's existing plant with purification investment, though qualification cycles would run several years before revenue appeared.
CLIENT PROFILE
An Asian pyrrolidone producer with annual revenue around USD 240 million (client-reported, unverified by MMA), supplying battery, industrial and pharmaceutical grade material. Capacity expansion had been approved against regional gigafactory announcements. Electronic grade purification was absent. No recovery operation existed anywhere in the business. Demand forecasting used published cell output projections throughout the business. Recovery was never considered.
STRATEGIC CHALLENGE
Volume had grown strongly through a battery construction wave and management had approved further capacity against announced cell output projections. Nobody had modelled the difference between initial fill demand and annual makeup, which meant the expansion was sized against a number that would not persist beyond commissioning. Nobody had questioned the underlying assumption.
MMA APPROACH
MMA rebuilt regional demand from published commissioning schedules and plant fill requirements rather than from cell output projections, separating initial charges from makeup volumes explicitly. Recovery operator activity was mapped across the client's customer base. Electronic grade purification economics were modelled, and legacy application decline was quantified by jurisdiction. Stranded capacity risk was quantified.
KEY FINDINGS
  1. Demand modelled from commissioning schedules fell substantially below the client's projection once the regional construction wave completed, since makeup runs at a small fraction of initial fill.
  2. Recovery operators were already processing streams from three of the client's largest customers, supplying material the client had originally provided at costs it could not match.
  3. The approved capacity expansion would have commissioned into a declining demand curve, arriving precisely as regional initial fill requirements finished rather than continued.
  4. Electronic grade purification was reachable from the client's existing plant with purification investment, though qualification cycles would run several years before revenue appeared.
RECOMMENDED STRATEGY
Phase 1: Phase one: cancel the capacity expansion and rebuild demand forecasting from published commissioning schedules rather than from any cell output projection. Phase 2: Phase two: enter recovery operation at the customer sites already served, capturing the returning stream before specialist operators establish those positions permanently. Phase 3: Phase three: commit purification investment for electronic grade qualification while legacy revenue can still fund the multi-year qualification cycle involved.
OUTCOME
The capacity expansion was cancelled before commitment. Recovery operation is agreed at two customer sites with a third in negotiation. Purification investment is approved with qualification expected from 2028, and the client reports avoiding a substantial stranded investment (client-reported, unverified by MMA). Forecasting now uses commissioning data.

Frequently Asked Questions

Foundational context covering the market sizes, CAGR, scope, country, region and competition that inform every finding below. This section is provided to cover basics and most often pre-purchase conversations, answered from the MMA Primary Research Dataset.

What is the current size of the N-Methyl Pyrrolidone Market?

The market was valued at USD 1.86 billion in 2025, rising to an estimated USD 1.99 billion in 2026. East Asia holds the largest regional share at 33% of value.

How large will the N-Methyl Pyrrolidone Market be by 2036?

MMA forecasts USD 3.84 billion by 2036 under the base case, an expansion multiple of 1.93 times the 2026 value. That represents USD 1.85 billion of incremental value.

What is the CAGR for the N-Methyl Pyrrolidone Market 2026 to 2036?

The base case runs at 6.8% compound annual growth between 2026 and 2036, with a bull case at 8.0% and a bear case at 5.6%. Historical growth from 2020 to 2025 was 5.8%.

Which segment is growing fastest?

Recovered and recycled material leads at 10.2%, half again the market rate, because every commissioned plant becomes a returning supply source. Electronics stripping follows at 9.4%.

Who are the major companies in the N-Methyl Pyrrolidone Market?

BASF, Mitsubishi Chemical, LyondellBasell, Zhejiang Realsun and Jiangsu Tongzhou hold 56% of global supply between them. Feedstock integration rather than process capability sustains those positions.

Which country is growing fastest?

China leads at 10.4%, driven by electrode plant commissioning at a scale no other market approaches, though that construction pipeline is now maturing steadily everywhere.

Report Segmentation Architecture

The full report scope spans multiple orthogonal segmentation dimensions, with cross-tabulated demand data provided for each dimension pair. Coverage extends further to regional breakdowns, trend trajectories, and the competitive detail needed to support segment-level decision-making.

By Application and Source

  • Battery Electrode Processing
  • Recovered and Recycled NMP
  • Petrochemical Extraction
  • Pharmaceutical and Agrochemical Synthesis
  • Electronics and Photoresist Stripping
  • Coatings, Cleaning and Surface Preparation

By End-Use Industry

  • Battery Cell Manufacture
  • Semiconductor Fabrication
  • Pharmaceutical Manufacture
  • Petrochemical Processing
  • Crop Protection Formulation
  • Industrial Coatings and Maintenance

By Supply Arrangement

  • Integrated Producer Direct Supply
  • Battery Plant Fill Contract
  • On-Site Recovery Operation
  • High Purity Qualified Supply
  • Chemical Distributor Channel

By Region

  • North America
  • Western Europe
  • East Asia
  • South Asia and Pacific
  • Latin America
  • Middle East and Africa
  • Eastern Europe

Scope, Methodology, and Coverage

Every figure in this report is reproducible from documented input assumptions. The scope below maps the historical period, the forecast horizon, the segmentation dimensions, and the countries covered, alongside the underlying primary and qualitative methodology.
Historical Period
2020 to 2025
Forecast Period
2026 to 2036
Base Year
2025 (USD billions; MMA Primary Research Dataset, August 2026)
Market Definition
The market comprises N-methyl-2-pyrrolidone supplied as virgin and recovered material across battery, semiconductor, pharmaceutical, petrochemical, agrochemical and industrial applications, covering battery electrode processing, recovered and recycled NMP, petrochemical extraction, pharmaceutical and agrochemical synthesis, electronics and photoresist stripping, and coatings, cleaning and surface preparation. Value is measured at producer and recovery operator level on tonnage supplied. Other pyrrolidone solvents sold as substitutes, polyvinylpyrrolidone polymers, formulated cleaning products and electrode slurry sold as a finished intermediate fall outside scope.
Quantitative Units
USD billions (current prices); thousand tonnes supplied annually; USD per tonne by application grade
Segmentation Dimensions
By Application and Source; By End-Use Industry; By Supply Arrangement; By Region
Regions Covered
North America, Western Europe, East Asia, South Asia and Pacific, Latin America, Middle East and Africa, Eastern Europe
Countries Covered
China, South Korea, Japan, Taiwan, India, Singapore, Malaysia, Vietnam, Australia, United States, Canada, Mexico, Germany, Belgium, Netherlands, France, United Kingdom, Sweden, Spain, Italy, Poland, Hungary, Czechia, Slovakia, Brazil, Argentina, Colombia, Saudi Arabia, Israel, South Africa
Key Companies Profiled
BASF, Mitsubishi Chemical, LyondellBasell, Zhejiang Realsun Chemical, Jiangsu Tongzhou Bio-Pharmaceutical, Ashland, Eastman Chemical, Balaji Amines, Merck KGaA, Shandong Qiyuan Biotechnology, Anhui Haoyuan Chemical, Nantong Acetic Acid Chemical, Mitsui Chemicals, Zhangjiagang Huachang, Shijiazhuang Jinxing, Kaiyuan Chemical, Puyang Myland Chemical, Sinopharm Chemical Reagent, Tokyo Chemical Industry, Solventis
Quantitative Methodology
Primary survey, n=3,800 respondents, Q4 2025, six countries; demand-side model with trade association cross-validation
Qualitative Methodology
47 expert interviews, Q4 2025; applied to validate demand model assumptions, identify emerging dynamics, and assess competitive positioning
Report Format
PDF and XLSX data workbook (Word format preview document)
Publisher
Market Minds Advisory
Report Code
MMA-2026-CHM-690
Published
August 2026
Contact
sales@marketmindsadvisory.com | www.marketmindsadvisory.com

Purchase the full N-Methyl Pyrrolidone Market Report (2026 to 2036).

The full report sizes the global N-methyl pyrrolidone market to 2036 across six applications and seven regions, measured on tonnage at producer and recovery operator level. It separates battery initial fill demand from annual makeup explicitly, since the two behave completely differently and conflating them has produced widespread capacity misjudgement. Competitive analysis covers 20 participants evaluated on tonnage supplied, with moat and risk assessment for the two leaders. Recovered material is treated as competing supply rather than as a sustainability footnote. Four quantified revenue levers close the analysis.
Six-application segment sizing with segment-level growth rates
Seven-region share and growth breakdown to 2036
Twenty-participant competitive map on one tonnage basis
Initial fill demand separated from annual makeup requirements explicitly
Recovered material treated as directly competing supply throughout
Four quantified revenue levers with commercial impact ranges

Built For The People Who Decide

From boardroom strategy to bench-side execution, this report is read cover-to-cover by leaders shaping the next decade of their industry, turning demand scenarios, market dynamics and valuation benchmarks into decisions.
CXOs/ Presidents/ VPs/ Managers
M&A and Corporate Development
Strategy Teams and R&D Heads
Procurement and Product Directors
Regulatory and Compliance Leaders
Investor Relations and Equity Analysts