Market Minds Advisory
Membrane Chemicals Market

Membrane Chemicals Market: Asset protection economics, biofouling constraints and discharge regulation to 2036

These chemicals are two percent of what a plant costs to run and they protect membranes worth eighteen times the annual spend, yet procurement still tenders them by the kilogram like caustic soda.

Lead Analyst

Bilal Shaikh

Published

September 2026

Make Smarter Decisions with Customized Research Insights

Request a free sample report and evaluate market opportunities, growth trends, and competitive dynamics relevant to your business needs.

2025 MARKET VALUE$3.2BMarket Size 2025
2036 FORECAST VALUE$6.9BBase Case , 2026 to 2036
CAGR 2026 TO 20367.2 %Bull 8.4% / Bear 6.0%
INCREMENTAL OPPORTUNITY$3.5BNet 10- year value creation
EXPANSION MULTIPLE2.00x2036 value over 2026 base
Strategic Levers
M&A Pipeline
Regional Outlook
Country Rankings
Competitive Intelligence
Segmental Deep-dive
Call-Us : 91 93563 13602

Executive Snapshot and Market Trajectory

Membrane chemicals account for roughly 2% of plant operating cost and protect membranes worth around 18 times the annual chemical spend. Choose the wrong antiscalant and the asset destroyed exceeds eighteen years of chemical budget. Procurement tenders it by the kilogram anyway. Everybody knows and nobody moves.
Biodegradable polymer antiscalants grow at 10.8%, half again the market rate of 7.2%, because phosphorus discharge limits near 1 milligramme per litre are pushing operators off phosphonate chemistry whether they want to move or not. East Asia holds 29% of value on Chinese industrial water treatment volume. Polyamide membranes fail above 0.1 parts per million free chlorine. That removes the cheapest biocide in water treatment from the application needing it most. Nothing replaces it.
Five suppliers hold 47% of chemical supply and the concentration reflects application knowledge rather than manufacturing, since antiscalant chemistry is well published and the difficulty lies in matching it to a specific water. The commercially interesting escape from price tendering is dosing control and outcome contracting, which converts a kilogram sale into a membrane life guarantee. Very few suppliers have built the monitoring to support that.
Market Definition
This report covers chemicals supplied to operate and maintain filtration membranes across desalination, municipal water, industrial process and reuse applications, spanning antiscalants, membrane cleaners, biocides and biofouling control, coagulants and pretreatment flocculants, biodegradable polymer antiscalants, and preservation and dechlorination agents. Value is measured at chemical supplier level. Excluded are the membranes themselves, filtration equipment and pressure vessels, general water treatment chemicals without membrane function, ion exchange resins, and plant engineering services.
Base Year Value
$3.2B in 2025 (MMA Primary Research Dataset, August 2026)
Forecast Period
2026 to 2036, eleven discrete annual values
CAGR
7.2% base case. Bull 8.4%. Bear 6.0%.
Fastest Growth Segment
Biodegradable Polymer Antiscalants: 10.8% CAGR
Fastest Growth Country
India: 10.2% CAGR
Fastest Growth Region
South Asia and Pacific: 9.4% CAGR
Largest Region
East Asia: 29% of 2025 global value
Market Leaders
Veolia Water Technologies, Ecolab, Kurita Water Industries, Solenis and BASF lead the market. Source: MMA Primary Research Dataset, July 2026.
Primary Survey
n=3,800 procurement and R&D decision-makers, Q4 2025, six countries
Methodology
Demand-side build-up, cross-validated against public data, 47 expert interviews

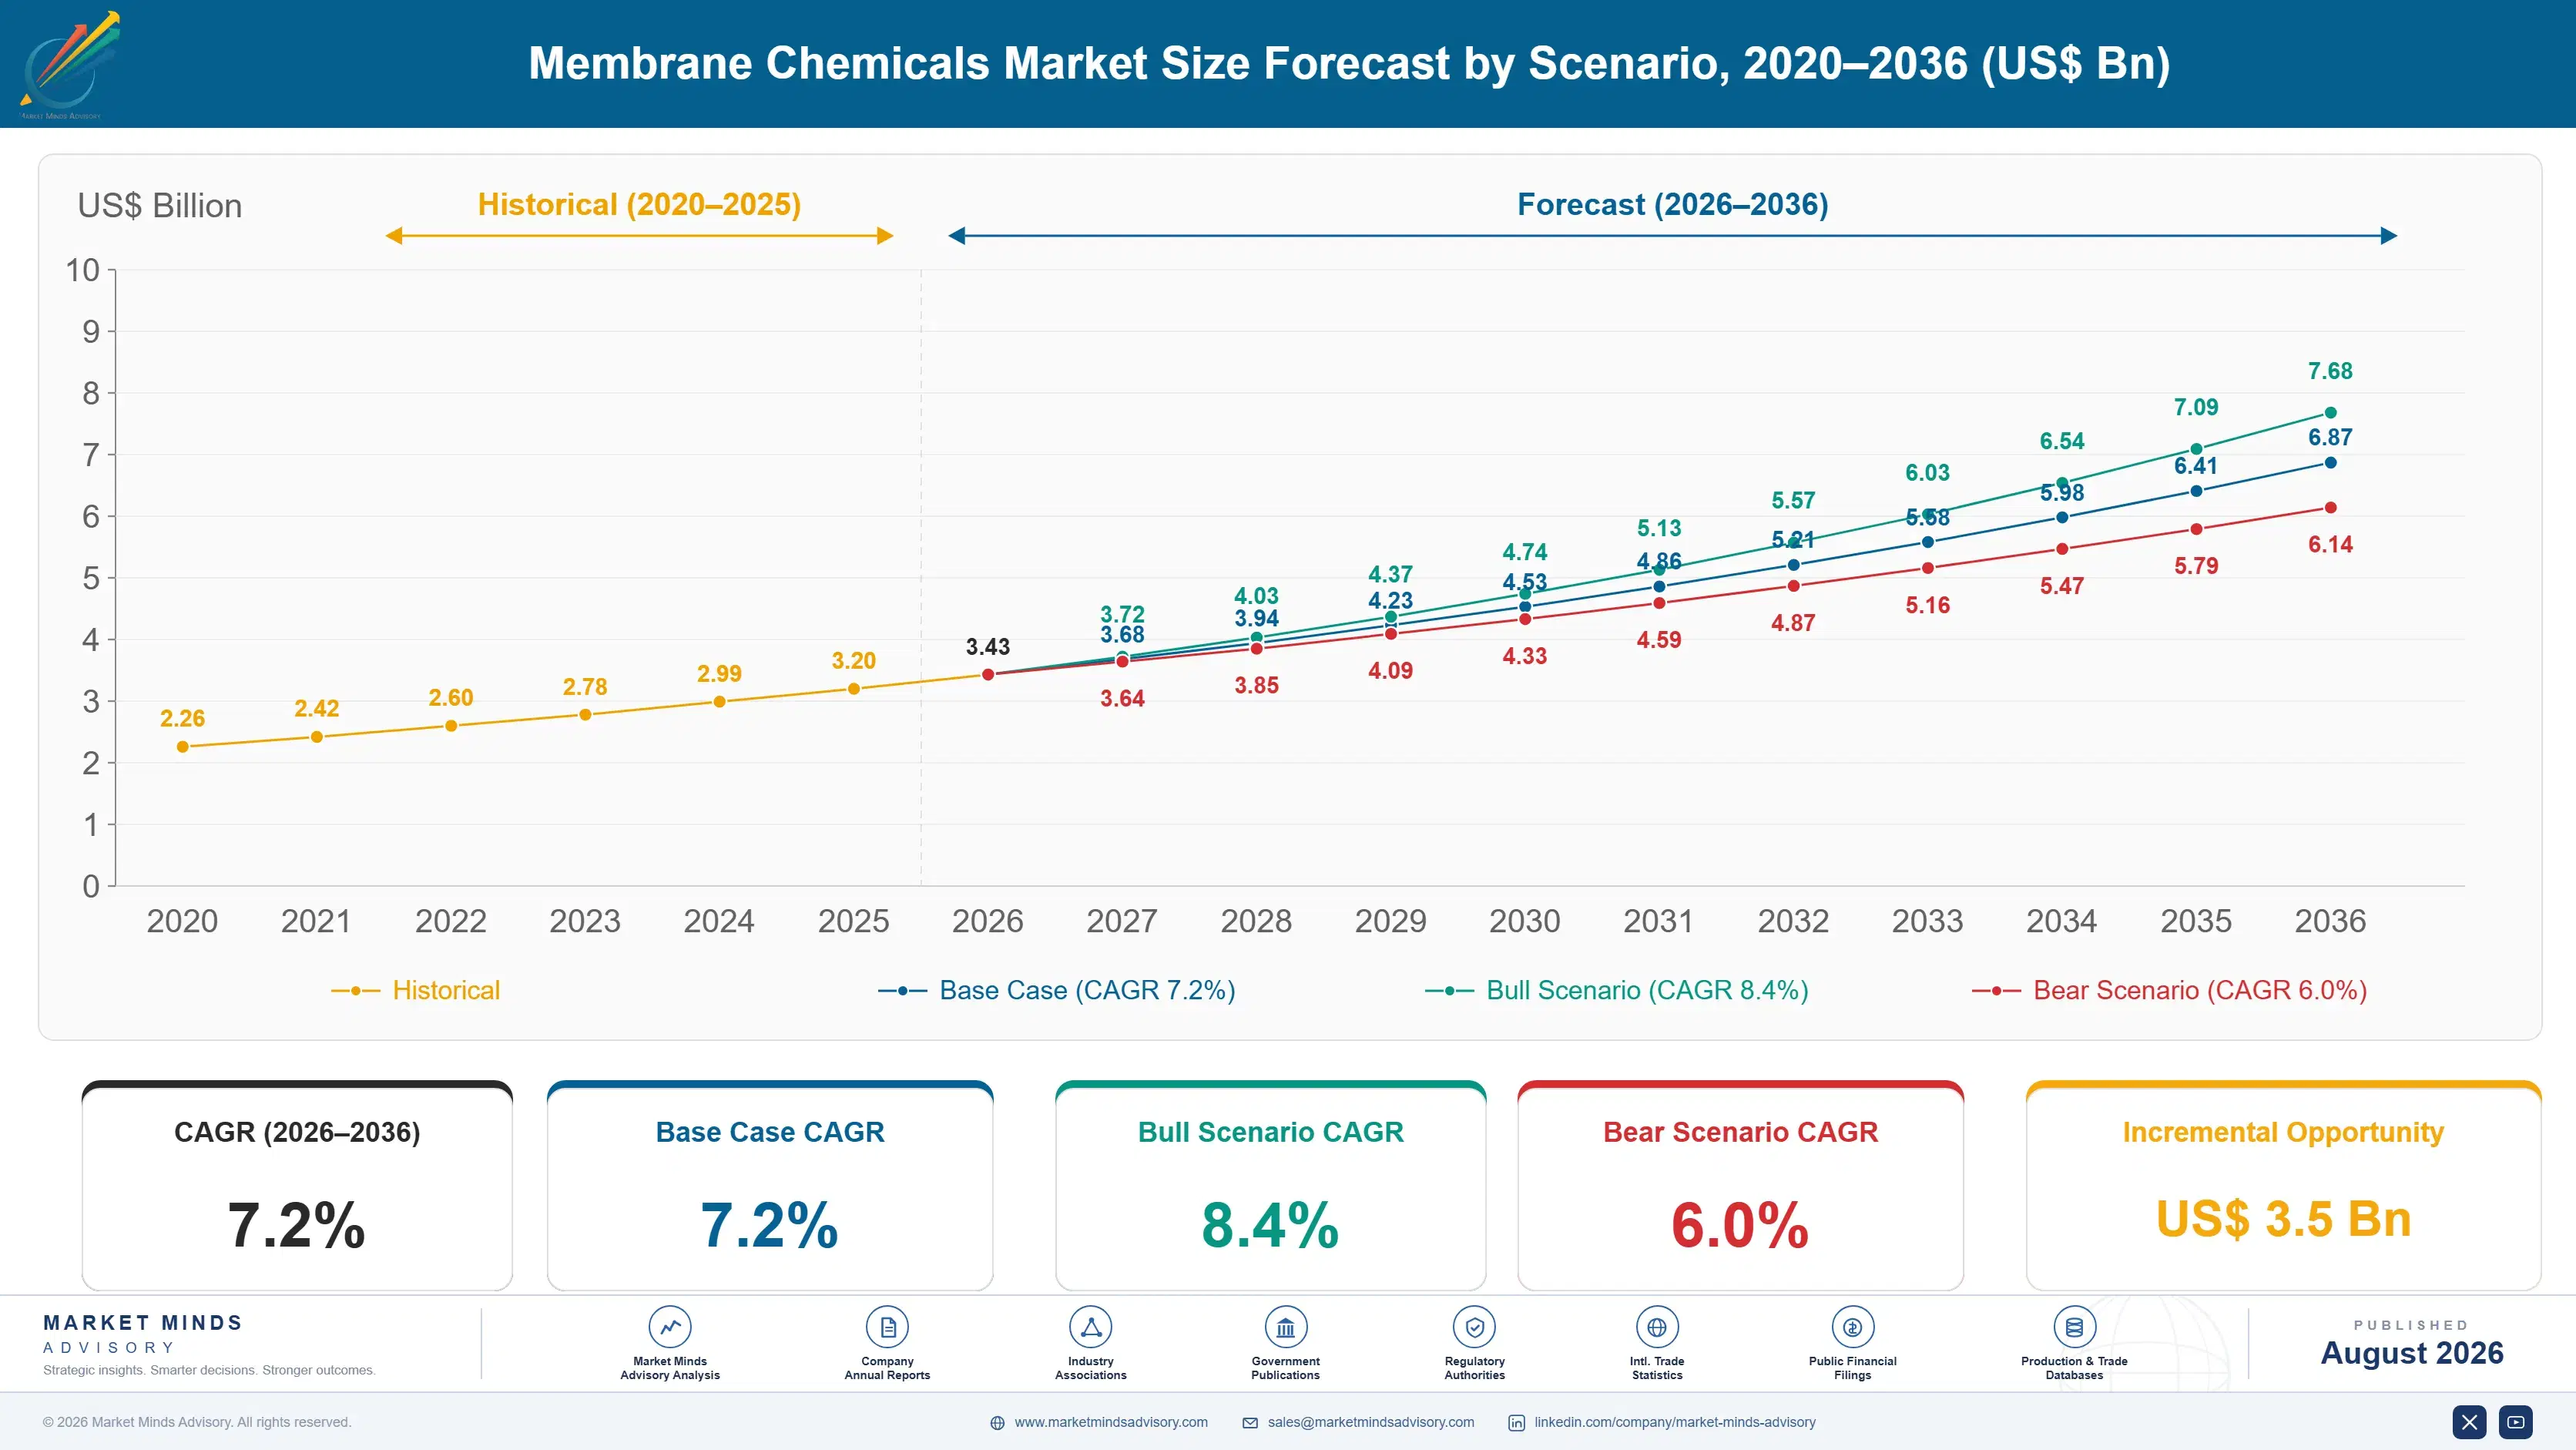
Membrane Chemicals Market Forecast Scenarios

membrane-chemicals-market-size-forecast-scenario-1787555498379
Growth ran at 5.8% between 2020 and 2025 and installed membrane capacity drove nearly all of it, since chemical consumption follows operating plants rather than any purchasing decision. Gulf desalination capacity expanded substantially across the period. Industrial water reuse installations grew as water-stressed sites and semiconductor fabs added recovery systems. Chemical pricing itself stayed flat or fell, which meant volume growth exceeded value growth throughout.
The 7.2% base case rests on three mechanisms. Desalination and reuse capacity keeps expanding across the Gulf, Asia and increasingly water-stressed industrial regions, and every operating plant consumes chemicals continuously regardless of anything else. Phosphorus discharge limits keep forcing conversion toward biodegradable polymer antiscalants at 10.8%, which price above the phosphonate chemistry they replace. And data centre water reuse keeps growing as consumption becomes politically visible. Every one of those plants consumes continuously.
The 8.4% bull case is outcome-based contracting spreading, since a supplier guaranteeing membrane life captures value proportional to the asset rather than to the kilogram. The 6.0% bear case is Chinese and Indian domestic suppliers taking commodity antiscalant volume on price, which they are already doing successfully in applications where the water chemistry is straightforward enough to standardise.

Two Percent Protecting Everything

The commercial situation in this market is close to absurd and almost nobody has fixed it. Membrane chemicals represent around 2% of what a desalination or reuse plant costs to operate, and the membranes they exist to protect cost roughly 18 times the annual chemical spend. Scaling, fouling or oxidation destroys those membranes years early, which converts a small saving on chemical price into an enormous replacement bill. Procurement tenders them by the kilogram using the process applied to bulk caustic, because the line item looks unimportant.
TOP-FIVE CONCENTRATION47%Combined position across membrane chemical supply held by leaders
CHEMICAL COST SHARE2%Portion of desalination plant operating cost spent on chemicals
MEMBRANE REPLACEMENT VALUE18xHow far membrane cost exceeds the annual chemical spend
CHLORINE TOLERANCE LIMIT0.1 ppmFree chlorine level polyamide membranes fail above during operation
PHOSPHONATE DISCHARGE LIMIT1 mg/LPhosphorus ceiling regulators apply to treated effluent streams
MEMBRANE SERVICE LIFE6 yearsTypical operating period before replacement under good chemical management
Biofouling is the technically hardest problem and the obvious solution is forbidden. Free chlorine is the cheapest and most effective biocide in water treatment and polyamide membranes fail above roughly 0.1 parts per million of it, which means the industry must control biological growth using chemistry that costs considerably more and works less reliably. That incompatibility explains why the biocide segment grows at 8.6% and why operators spend disproportionate attention on a problem solved everywhere else.
Regulation is now forcing a chemistry change nobody chose. Phosphorus discharge limits near 1 milligramme per litre catch the phosphonate antiscalants that have dominated this market for decades, pushing operators toward biodegradable polymers at 10.8%.
"A plant manager will spend four months tendering the antiscalant to save eight percent and then replace a membrane train two years early because the wrong product was cheapest. The chemical is not the cost, it is the insurance policy, and almost nobody buys it that way."
Director, Water Treatment Chemicals and Process Practice · MMA Chemicals and Materials Practice · August 2026

Market Trends

Discharge limits force conversion away from phosphonate chemistry

Phosphonate antiscalants have dominated membrane treatment for decades because they work extremely well and cost very little, and phosphorus discharge limits near 1 milligramme per litre in receiving waters catch them directly regardless of how effective they are. Operators facing those limits must convert to biodegradable polymer chemistry that costs more and requires redosing trials against their specific water. Growth at 10.8% follows regulatory geography rather than technical preference. The commercial consequence is a forced product transition that raises revenue per plant while requiring application support most suppliers have to rebuild for the new chemistry.
Market Impact: Runs across 6 year membrane life
Data centre water reuse creates continuously consuming installations

Data centre water consumption became politically visible rather than merely operational, and reuse systems are the industry response to communities and regulators asking where the water goes. Each installation runs membranes continuously and consumes antiscalant, cleaner and biocide on a permanent basis rather than in project bursts. That makes the demand behave like an annuity attached to a facility rather than like equipment sales. Growth here is following construction announcements directly and shows no sensitivity to chemical pricing, since the operator is solving a reputational and regulatory problem rather than optimising an input cost.
Market Impact: Drives 10.2% Indian growth

Market Opportunities and Growth Drivers

Installed membrane capacity consumes chemicals continuously

A membrane plant consumes antiscalant, cleaner and biocide every operating hour for its entire life, which makes chemical demand a function of installed capacity rather than of any purchasing cycle or construction activity. Gulf desalination capacity keeps expanding, industrial reuse installations keep multiplying across water-stressed regions and municipal treatment keeps adding membrane stages for contaminant removal. Every one of those plants becomes a permanent consumer. That underlying mechanism is why this market grows steadily regardless of economic conditions, and why suppliers who win a plant hold it for roughly six years at minimum.
Market Impact: Compresses a 2% cost line

Zero discharge mandates force membrane installation in India

Indian zero liquid discharge requirements applying to textile, tannery and several other industrial sectors compel membrane installation where the water economics alone would never justify it, which creates demand entirely independent of any commercial calculation the operator would make. Those installations then consume chemicals continuously for their operating lives. Indian industrial water stress reinforces the same direction across regions where groundwater depletion has become severe. Growth at 10.2% is the fastest of any country here and rests on regulation and hydrology rather than on industrial expansion, which makes it unusually durable.
Market Impact: Caps chlorine at 0.1 ppm

Market Restraints and Challenges

Procurement treats a risk product as a commodity purchase

Membrane chemicals are around 2% of plant operating cost and get tendered on price per kilogram by purchasing functions applying the process they use for bulk commodities. The root cause is that the line item is small enough to look unimportant while the asset it protects is not on the same budget. Commercially this compresses supplier margin and rewards products that meet a specification cheaply rather than products that extend membrane life. Suppliers are responding with dosing control, monitoring and outcome contracting that reprice the offer against membrane life rather than against kilogram delivered.
Market Impact: Meets a 1 milligramme phosphorus limit

Chlorine intolerance rules out the cheapest biofouling control

Polyamide reverse osmosis membranes fail above roughly 0.1 parts per million free chlorine, which eliminates the cheapest and most reliable biocide available in water treatment from the application that needs biological control most. The root cause is the membrane polymer chemistry itself, and thirty years of development has not produced a chlorine-tolerant membrane at competitive performance. Commercially this forces reliance on non-oxidising biocides costing considerably more and working less predictably. Suppliers are pursuing dosing strategies, dechlorination control and combination approaches rather than any single replacement chemistry. Nothing has replaced chlorine adequately.
Market Impact: Adds continuous demand across 6 years
3 additional market trends, 4 additional growth drivers, and 2 additional restraints and challenges are covered in the full report. Contact sales@marketmindsadvisory.com to access the complete intelligence.

Segment CAGR and Growth Architecture

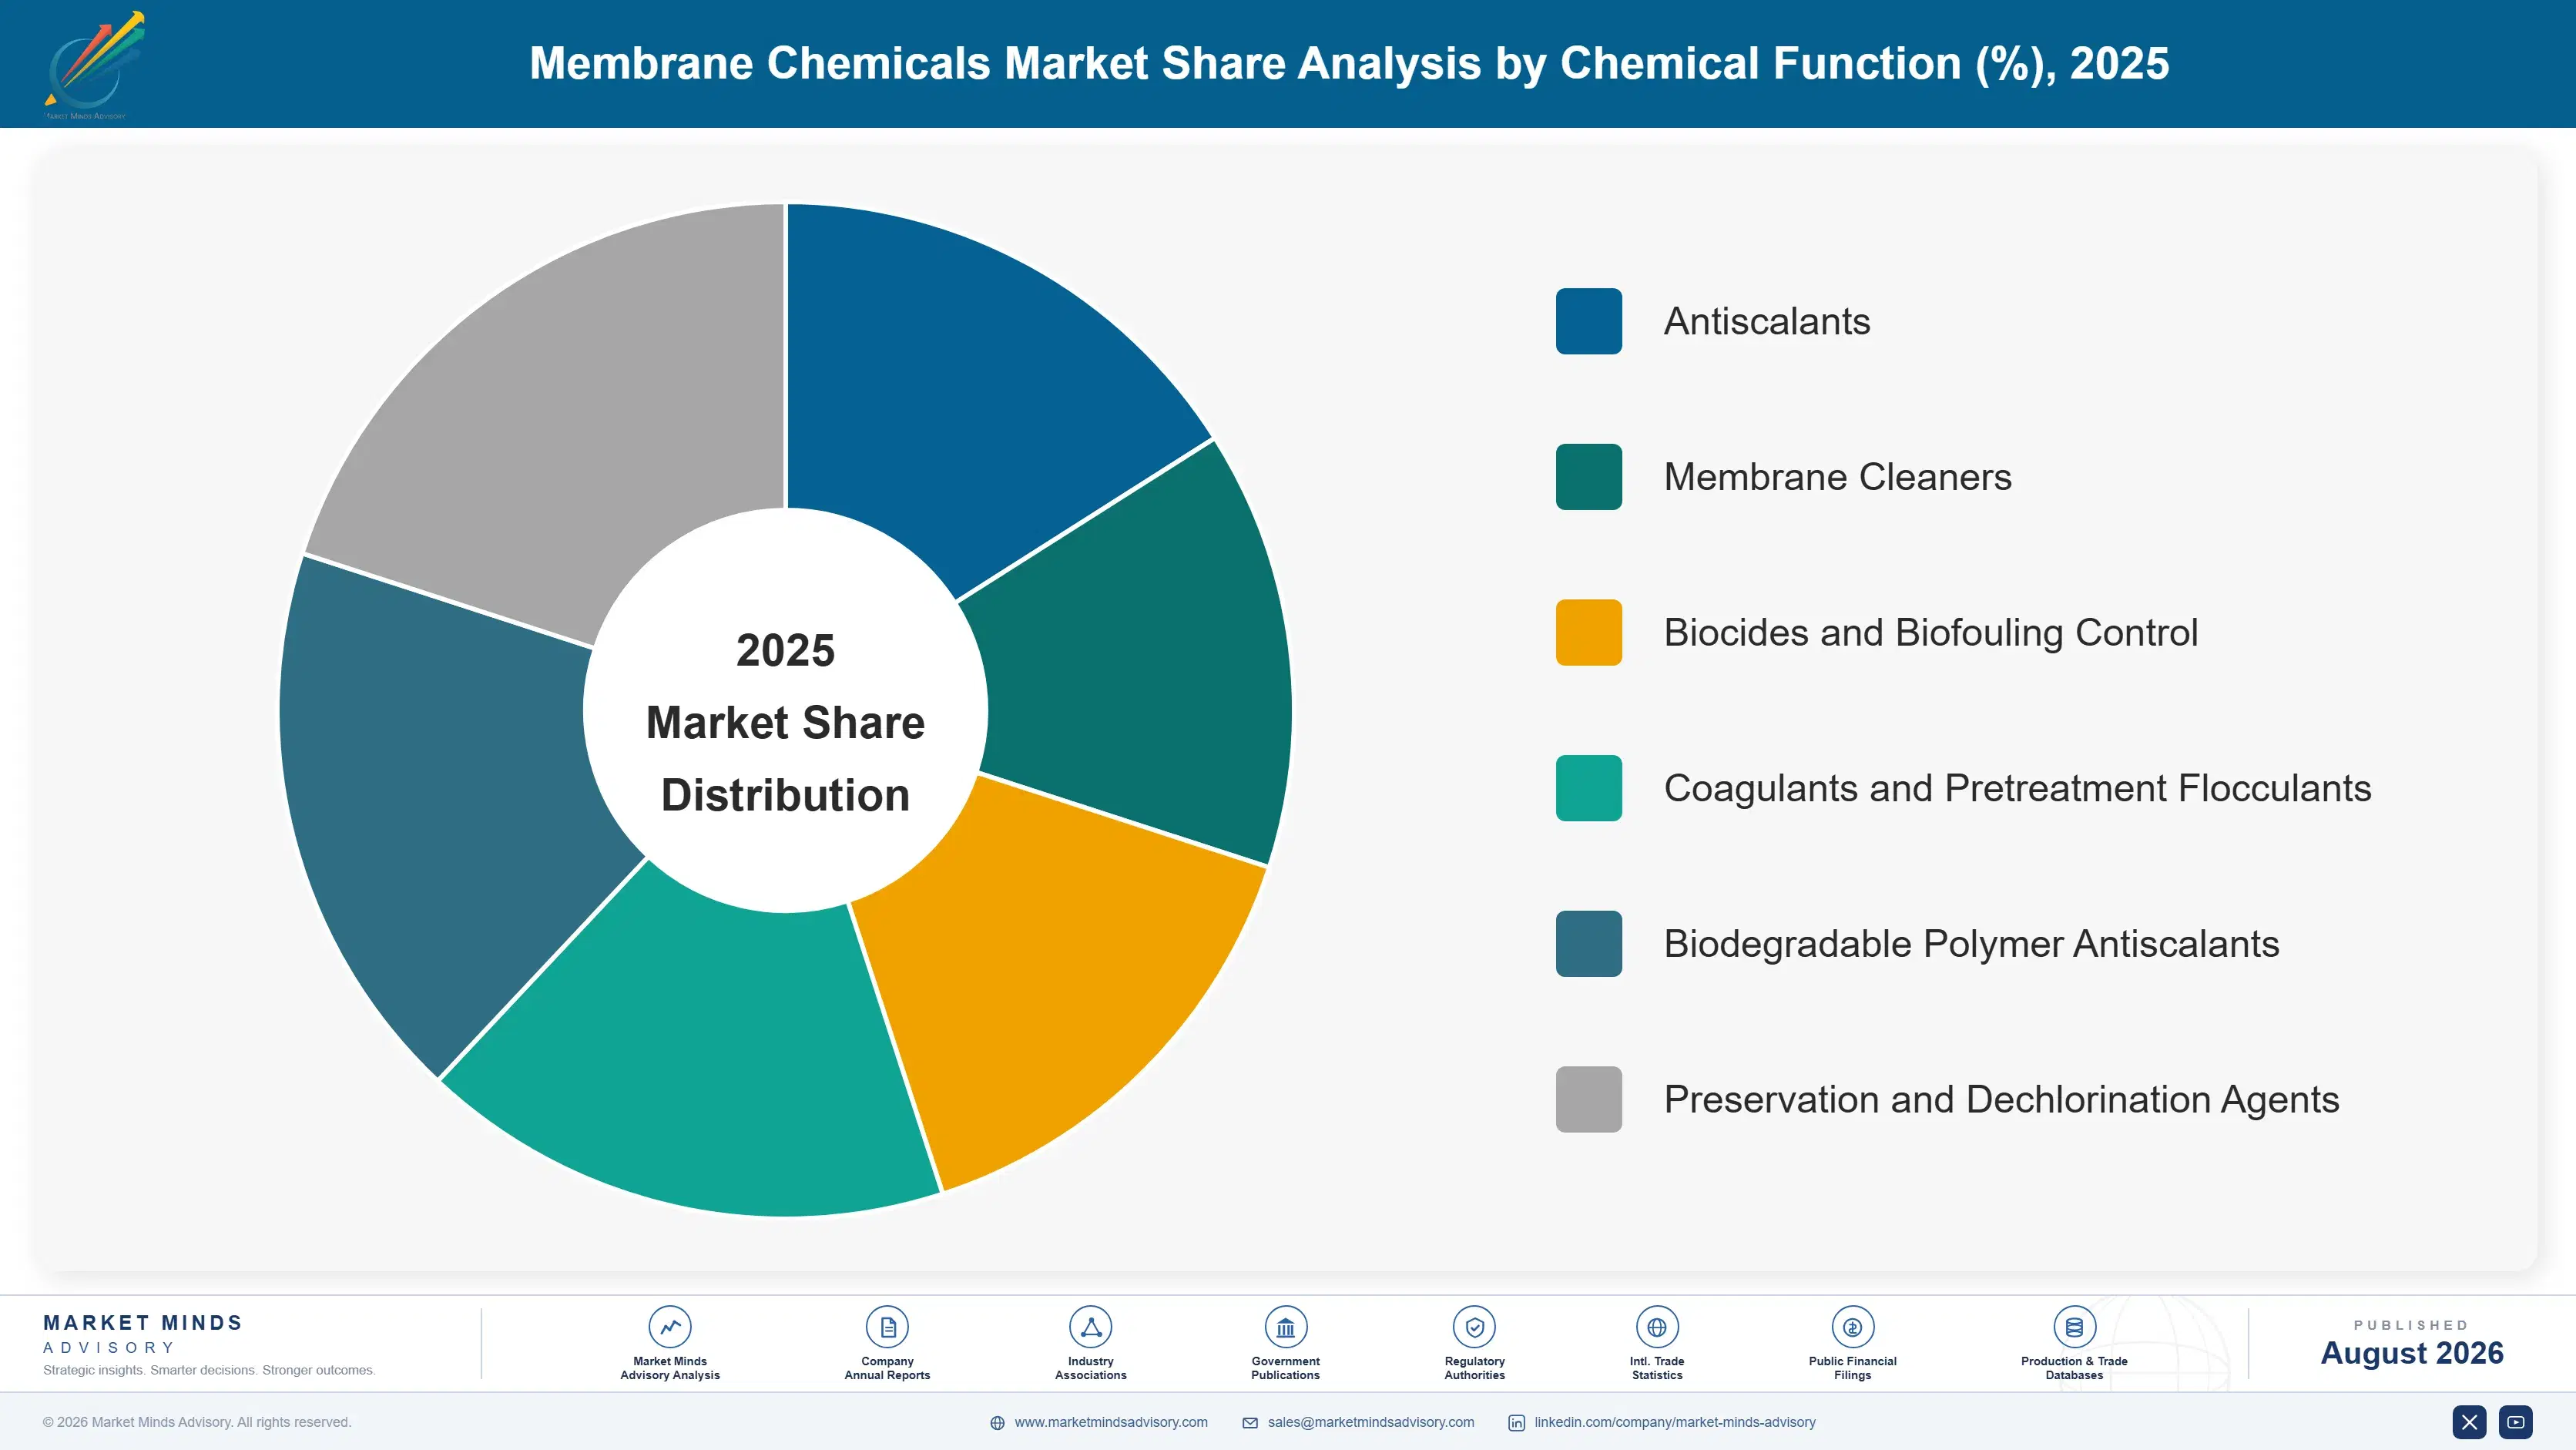
Chemicals are classified here by the function they perform on the membrane, since that determines the dosing regime, the technical support required and the consequence of getting it wrong. Membrane type, application sector and supply arrangement are handled separately in the framework, because one functional chemistry serves desalination, municipal and industrial plants alike. Function decides everything.
membrane-chemicals-market-market-share-analysis-1787555498920

Biodegradable Polymer Antiscalants

Growing at 10.8%, half again the market rate, this segment exists because regulation demanded it rather than because operators wanted it. Phosphonate antiscalants dominated membrane treatment for decades on performance and price, and phosphorus discharge limits near 1 milligramme per litre in receiving waters catch them regardless of how well they work. Converting means dosing trials against a specific water chemistry, since polymer antiscalants behave differently at the scaling thresholds that matter. The commercial attraction is that the products price above the phosphonate chemistry they replace and require application support that rebuilds the supplier relationship. The commercial difficulty is that conversion happens on a regulatory timetable nobody controls. Suppliers must move first.
CAGR 10.8%

Biocides and Biofouling Control

Biofouling is the hardest problem in membrane operation and the obvious answer is prohibited. Free chlorine is the cheapest and most dependable biocide in water treatment, and polyamide membranes fail above roughly 0.1 parts per million of it, which forces the industry onto non-oxidising chemistry costing considerably more and behaving less predictably against a living target. Growth at 8.6% follows both installed capacity and the reality that biological control is never actually finished. Products here command better margins than antiscalants precisely because performance varies with the water and the operator cannot simply tender on specification. Application knowledge matters more in this segment than anywhere else. Site experience rather than laboratory work builds it, which takes years nobody can compress.
CAGR 8.6%
Full segment breakdown across 6 segments available in the complete report.

Regional Architecture and Country Demand Map

East Asia holds 29% of value on Chinese industrial water treatment volume and rising discharge enforcement. North America follows at 24% on municipal treatment and industrial reuse. Installed membrane capacity rather than population or economy decides this map almost entirely. Nothing else explains the shares here.

East Asia

Chinese industrial water treatment operates at a scale nothing else approaches, and discharge enforcement has tightened considerably over the past decade in ways that force membrane installation across chemical, textile and electronics manufacturing. Domestic chemical suppliers serve much of that volume on price, particularly in applications where the water chemistry is consistent enough to standardise a product. Japanese and Korean semiconductor fabrication consumes ultrapure water systems with the most demanding specifications anywhere, and those buyers select on performance rather than price. Municipal membrane treatment is expanding across Chinese cities. Growth at 8.2% combines industrial capacity expansion with enforcement that keeps raising treatment requirements. Domestic suppliers keep taking the standardisable volume.
Share: 29% | CAGR: 8.2% (2026 to 2036)

North America

Municipal membrane treatment is expanding as utilities address contaminants that conventional processes do not remove, and PFAS in particular has driven reverse osmosis and nanofiltration installation across systems that never previously needed membranes. Industrial reuse is growing rapidly in water-stressed western states and increasingly around data centre developments where water consumption has become a public issue. Suppliers here have the most developed service and monitoring offers, which reflects a customer base willing to buy outcomes rather than kilogrammes. Growth at 7.6% sits above the market average and rests on contaminant regulation and reuse rather than on any capacity expansion in desalination. Data centre water consumption has become a genuinely political question, which changes who signs off on reuse.
Share: 24% | CAGR: 7.6% (2026 to 2036)
Regional intelligence for 5 additional markets available in the complete report: Western Europe, South Asia and Pacific, Latin America, Middle East and Africa, Eastern Europe. Contact sales@marketmindsadvisory.com.
membrane-chemicals-market-country-cagr-analysis-1787555499439

Where Membrane Chemical Margin Sits

Four moves matter for a supplier whose product is two percent of a plant's cost and protects an asset worth eighteen times what it earns annually. Two are about escaping the tender that treats insurance as a commodity, and two are about the chemistry regulation is forcing operators toward. Competing on price per kilogram is not among them.

Contract on membrane life, not kilogrammes delivered

Chemicals are around 2% of plant operating cost and the membranes cost roughly 18 times the annual chemical spend, which means the buyer is purchasing asset protection while procurement tenders it as a commodity. Suppliers accepting that framing compete on price against every competitor meeting the same specification. Suppliers offering membrane life guarantees backed by dosing control and monitoring reprice the entire relationship against the asset rather than the input. The customer gets a risk transfer they genuinely want and the supplier escapes an auction, which is a better outcome for both parties involved.
Market Impact: Protects an asset worth 18 times the spend

Convert phosphonate accounts before regulation forces them

Phosphorus discharge limits near 1 milligramme per litre catch phosphonate antiscalants that have dominated for decades, and conversion requires dosing trials against each specific water chemistry. Operators facing those limits will convert on a regulatory timetable whether or not their incumbent supplier is ready. Suppliers running conversion trials before the deadline arrives hold the account and price the new chemistry above the old. Suppliers waiting for the customer to ask will find a competitor already three months into trials, and the polymer segment growing at 10.8% will belong to somebody else entirely.
Market Impact: Enters a segment now compounding at 10.8% annually

Build application depth where chlorine cannot be used

Polyamide membranes fail above roughly 0.1 parts per million free chlorine, which removes the cheapest biocide in water treatment from the application that needs biological control most. Non-oxidising chemistry costs more and performs less predictably against a living target that varies with source water, temperature and season. That unpredictability is exactly why this segment resists commodity tendering and why it compounds at 8.6%. Suppliers with genuine application knowledge earn margins that antiscalant supply cannot approach, and the knowledge takes years of site experience rather than any laboratory programme. That knowledge cannot be bought.
Market Impact: Serves a hard 0.1 ppm free chlorine constraint

Follow reuse installations rather than desalination capacity

Industrial and data centre water reuse installations consume chemicals continuously across roughly six year membrane lives, and those operators are solving reputational and regulatory problems rather than optimising input cost. That makes them considerably less price sensitive than a desalination utility tendering annually. Reuse installation is growing faster than desalination capacity across North America, Europe and industrial Asia. Suppliers organised around large desalination tenders are competing hardest for the most price-driven demand available while a better customer type multiplies quietly alongside them. Reuse installations run continuously for roughly 6 years per membrane set and buy on reliability.
Market Impact: Serves a full 6 year membrane consumption cycle

Who Controls the Margin Pool

Five suppliers hold 47% of membrane chemical supply, measured on chemical revenue at supplier level, the basis used throughout this section. That concentration rests on application knowledge rather than manufacturing, since antiscalant and cleaner chemistry is well published and the genuine difficulty is matching a product to a specific water. The gap between leaders and everybody else is site experience and monitoring capability rather than any formulation advantage. Chemistry itself defends nothing.
Competition runs on three dimensions. Application support, since the same chemical performs differently in different waters and the operator cannot resolve that alone. Monitoring and dosing capability, which is how a supplier escapes price tendering. And regulatory chemistry readiness, particularly on phosphorus conversion. Price competes hardest in standard antiscalant supply where water chemistry is consistent. Water chemistry varies more than tenders assume it does.

Rankings shift as Chinese and Indian domestic suppliers take commodity antiscalant volume in applications straightforward enough to standardise, which is already happening. Outcome contracting favours suppliers with monitoring infrastructure. Biocide positions hold longest, because performance varies with the water and nobody tenders confidently on it. Nobody tenders confidently on biofouling.
membrane-chemicals-market-company-positioning-matrix-1787555499962

Competitive Moat and Risk Dimensions

VEOLIA WATER TECHNOLOGIES

Moat: Plant operation and chemistry

Veolia operates water treatment plants as well as supplying chemicals, which means it holds operating data across thousands of installations that no chemical-only supplier can accumulate. That data informs dosing decisions and membrane life prediction directly, and it also means the company is frequently its own customer, which removes the tender dynamic that compresses everybody else's margin.
VEOLIA WATER TECHNOLOGIES

Risk: Operating and supply conflict

Competing water operators are reluctant to buy chemicals from a company that also bids against them for operating contracts, which closes a substantial part of the addressable market for reasons unrelated to product quality. Independent chemical suppliers carry none of that conflict. In a market where application support requires close operational access, that reluctance costs more than it appears to.
ECOLAB

Moat: Monitoring and service infrastructure

Ecolab built dosing control, remote monitoring and service infrastructure that converts a chemical sale into a managed outcome, which is precisely the escape from kilogram tendering that this market rewards. That infrastructure took years and considerable capital to deploy across a customer base, and competitors offering chemicals alone compete on price against a proposition the customer values differently.
ECOLAB

Risk: Commodity segment price exposure

Standard antiscalant supply into consistent water chemistries is being taken by Chinese and Indian domestic producers on price, and the monitoring proposition does not justify a premium where the application is genuinely straightforward. That erodes volume underneath the service business. Competitors operating at lower cost bases can hold those accounts indefinitely without needing any service argument.

Players Tracked

Prominent Players

Veolia Water Technologies
Ecolab
Kurita Water Industries
Solenis
BASF

Other Key Players

SUEZ
Dow
Avista Technologies
King Lee Technologies
Genesys International
Accepta
Buckman
ChemTreat
Italmatch Chemicals
Aquapharm Chemicals
Kemira
SNF Group
Thermax
Ion Exchange India
Toray Industries

Recent Developments

FEBRUARY 2025

A Gulf utility contracted membrane life outcomes rather than chemical volume

A Gulf desalination utility awarded a supply agreement structured around guaranteed membrane life and performance rather than around chemical volume delivered, transferring replacement risk to the chemical supplier. This was a contracting structure change rather than any transaction between companies or any technology development. Volume pricing disappeared entirely.
Signal: Outcome contracting is reaching the largest and most sophisticated buyers first, which is how these structures usually spread
JULY 2025

A European operator completed conversion off phosphonate antiscalants

A European industrial water operator completed conversion of its membrane treatment to biodegradable polymer antiscalants across multiple sites, following phosphorus discharge limits that phosphonate chemistry could not satisfy. This was a regulatory compliance conversion rather than any commercial transaction between suppliers. Dosing trials preceded every site conversion by several months.
Signal: Conversions are running site by site on regulatory deadlines, which rewards suppliers who started dosing trials early
DECEMBER 2025

A data centre operator specified water reuse across a campus development

A data centre operator specified closed loop water reuse across a campus development, citing community concern and regulatory scrutiny over consumption rather than any operating cost calculation. This was a facility design specification rather than any transaction involving chemical suppliers directly. Operating cost never entered the decision.
Signal: Reuse is being installed to answer reputational pressure, which makes the operator far less sensitive to chemical pricing

What Moves Supplier Cost

Raw chemical inputs account for around 43% of supplier cost, principally phosphonates, acrylic acid polymers, surfactants and biocide actives purchased from commodity and specialty producers. Blending and packaging costs are modest. Technical service, site visits and monitoring infrastructure represent a substantial share that most cost analysis of this market omits entirely. Freight matters because dilute products travel poorly.
Acrylic acid and phosphonate intermediates moved sharply through 2021 and 2022 on petrochemical feedstock and European energy costs, and IEA data show European industrial gas far above American and Asian levels across that period. BASF recorded raw material cost pressure across its performance chemicals operations in its Annual Report 2022. Suppliers on annual tender pricing absorbed most of it, since a utility sets a contract price and does not reopen it.

Technical service cost is what genuinely separates suppliers and it appears nowhere in a tender comparison. A supplier maintaining site visits, dosing reviews and monitoring carries a cost that a competitor shipping drums does not, and the tender treats both offers as identical products. That mismatch pushes serious suppliers toward outcome contracting not merely for margin but because a commodity tender is incapable of valuing what they provide.
membrane-chemicals-market-cost-volatility-analysis-1787555500158

Price service separately from chemical volume supplied

Technical service, dosing review and monitoring carry real cost that a kilogram tender treats as free, which means suppliers providing them subsidise customers who compare only unit price. Separating the two into a chemical price and a service agreement makes the value visible and lets the customer choose. Customers declining the service reveal themselves as commodity accounts to serve accordingly.

Index tender contracts to published acrylic acid benchmarks

Raw inputs at 43% of cost price on petrochemical feedstock that moves for reasons unconnected to water treatment, and annual tender pricing against that transfers the whole exposure to the supplier. Indexing to published acrylic acid and phosphonate benchmarks with periodic reset removes it. Utilities resist because their budgets are fixed annually, which makes this a real negotiation.

Concentrate products to cut freight on dilute chemistry

Many membrane chemicals ship as dilute solutions where most of the delivered weight is water paying full freight to a customer who has abundant water on site already. Concentrated formats cut that cost substantially and require dosing equipment adjustment the customer must accept. Suppliers who fund the dosing conversion alongside the concentrate capture the saving and lock the account simultaneously.

Portfolio Architecture for Margin Defence

Margin here tracks how confidently a customer can tender rather than how sophisticated the chemistry is. Standard antiscalants into consistent water chemistries run at gross margins in the low twenties against domestic producers who meet the specification adequately. Cleaners and pretreatment chemistry run somewhat better on formulation variety. Biocides and biodegradable polymer antiscalants run considerably higher, because performance varies with the water and nobody tenders confidently on a product whose behaviour they cannot predict.
The tension is that commodity antiscalant volume funds the technical service organisation while the differentiated products justify it, and tender processes value neither correctly. A supplier maintaining site visits and dosing reviews carries cost a drum shipper does not, and the tender compares the two as identical. Several suppliers have responded by withdrawing service from commodity accounts, which is rational and which customers experience as a deterioration they did not choose.

High-value pools sit in biocide application support, phosphonate conversion and outcome-based contracting. None of the three is where the tonnage is. Formulation capability by itself defends very little when the chemistry has been published for thirty years. Application knowledge defends considerably more.

Volume / Commodity-Adjacent

Standard antiscalants and pretreatment chemistry into consistent water chemistries where domestic producers meet the specification and tenders compare unit price alone. The eight-point range separates concentrated product suppliers from those shipping dilute solutions across long freight distances.
Gross Margin: 19%-27%

Premium / Certified

Specialty cleaners, preservation chemistry and applications where formulation variety and cleaning protocol knowledge narrow the field. The ten-point spread reflects technical service depth, since the same product performs very differently with and without dosing support behind it.
Gross Margin: 30%-40%

Sustainability / Regulatory / Next-Generation

Biocides, biodegradable polymer antiscalants and outcome-based membrane life contracts. The eighteen-point range is wide because performance varies with source water and outcome contracts price against a protected asset rather than against delivered volume.
Gross Margin: 38%-56%
membrane-chemicals-market-portfolio-architecture-1787555500661

High-value Sub-segments and Strategic Watch-out

Outcome-Based Life Contracts

Chemicals are 2% of operating cost protecting membranes worth 18 times the annual spend, which makes life guarantees a risk transfer customers genuinely want. It also escapes the kilogram tender entirely, which very few suppliers have organised themselves to offer. The risk transfer is what customers want.
Gross Margin: 40%-56%

Biofouling Control Chemistry

Compounding at 8.6% because free chlorine destroys polyamide membranes above 0.1 parts per million, removing the cheapest biocide from the application needing it most. Performance varies with water, which keeps the segment out of confident tendering. Application knowledge earns the margin here entirely. Nobody tenders it.
Gross Margin: 38%-52%

Standard Antiscalant Volume

The tonnage that funds the technical organisation, and increasingly taken by Chinese and Indian producers wherever water chemistry is consistent enough to standardise. Manage it for volume and freight efficiency rather than for margin recovery. Margin was never genuinely available in this segment anywhere. Freight decides it.
Gross Margin: 19%-27%

Phosphonate Conversion Programmes

Discharge limits near 1 milligramme per litre are forcing conversion on a regulatory timetable, and each site needs dosing trials against its own water. Suppliers starting trials before the deadline hold accounts that competitors otherwise take. Trials started late lose accounts to whoever started earlier.
Gross Margin: 34%-48%

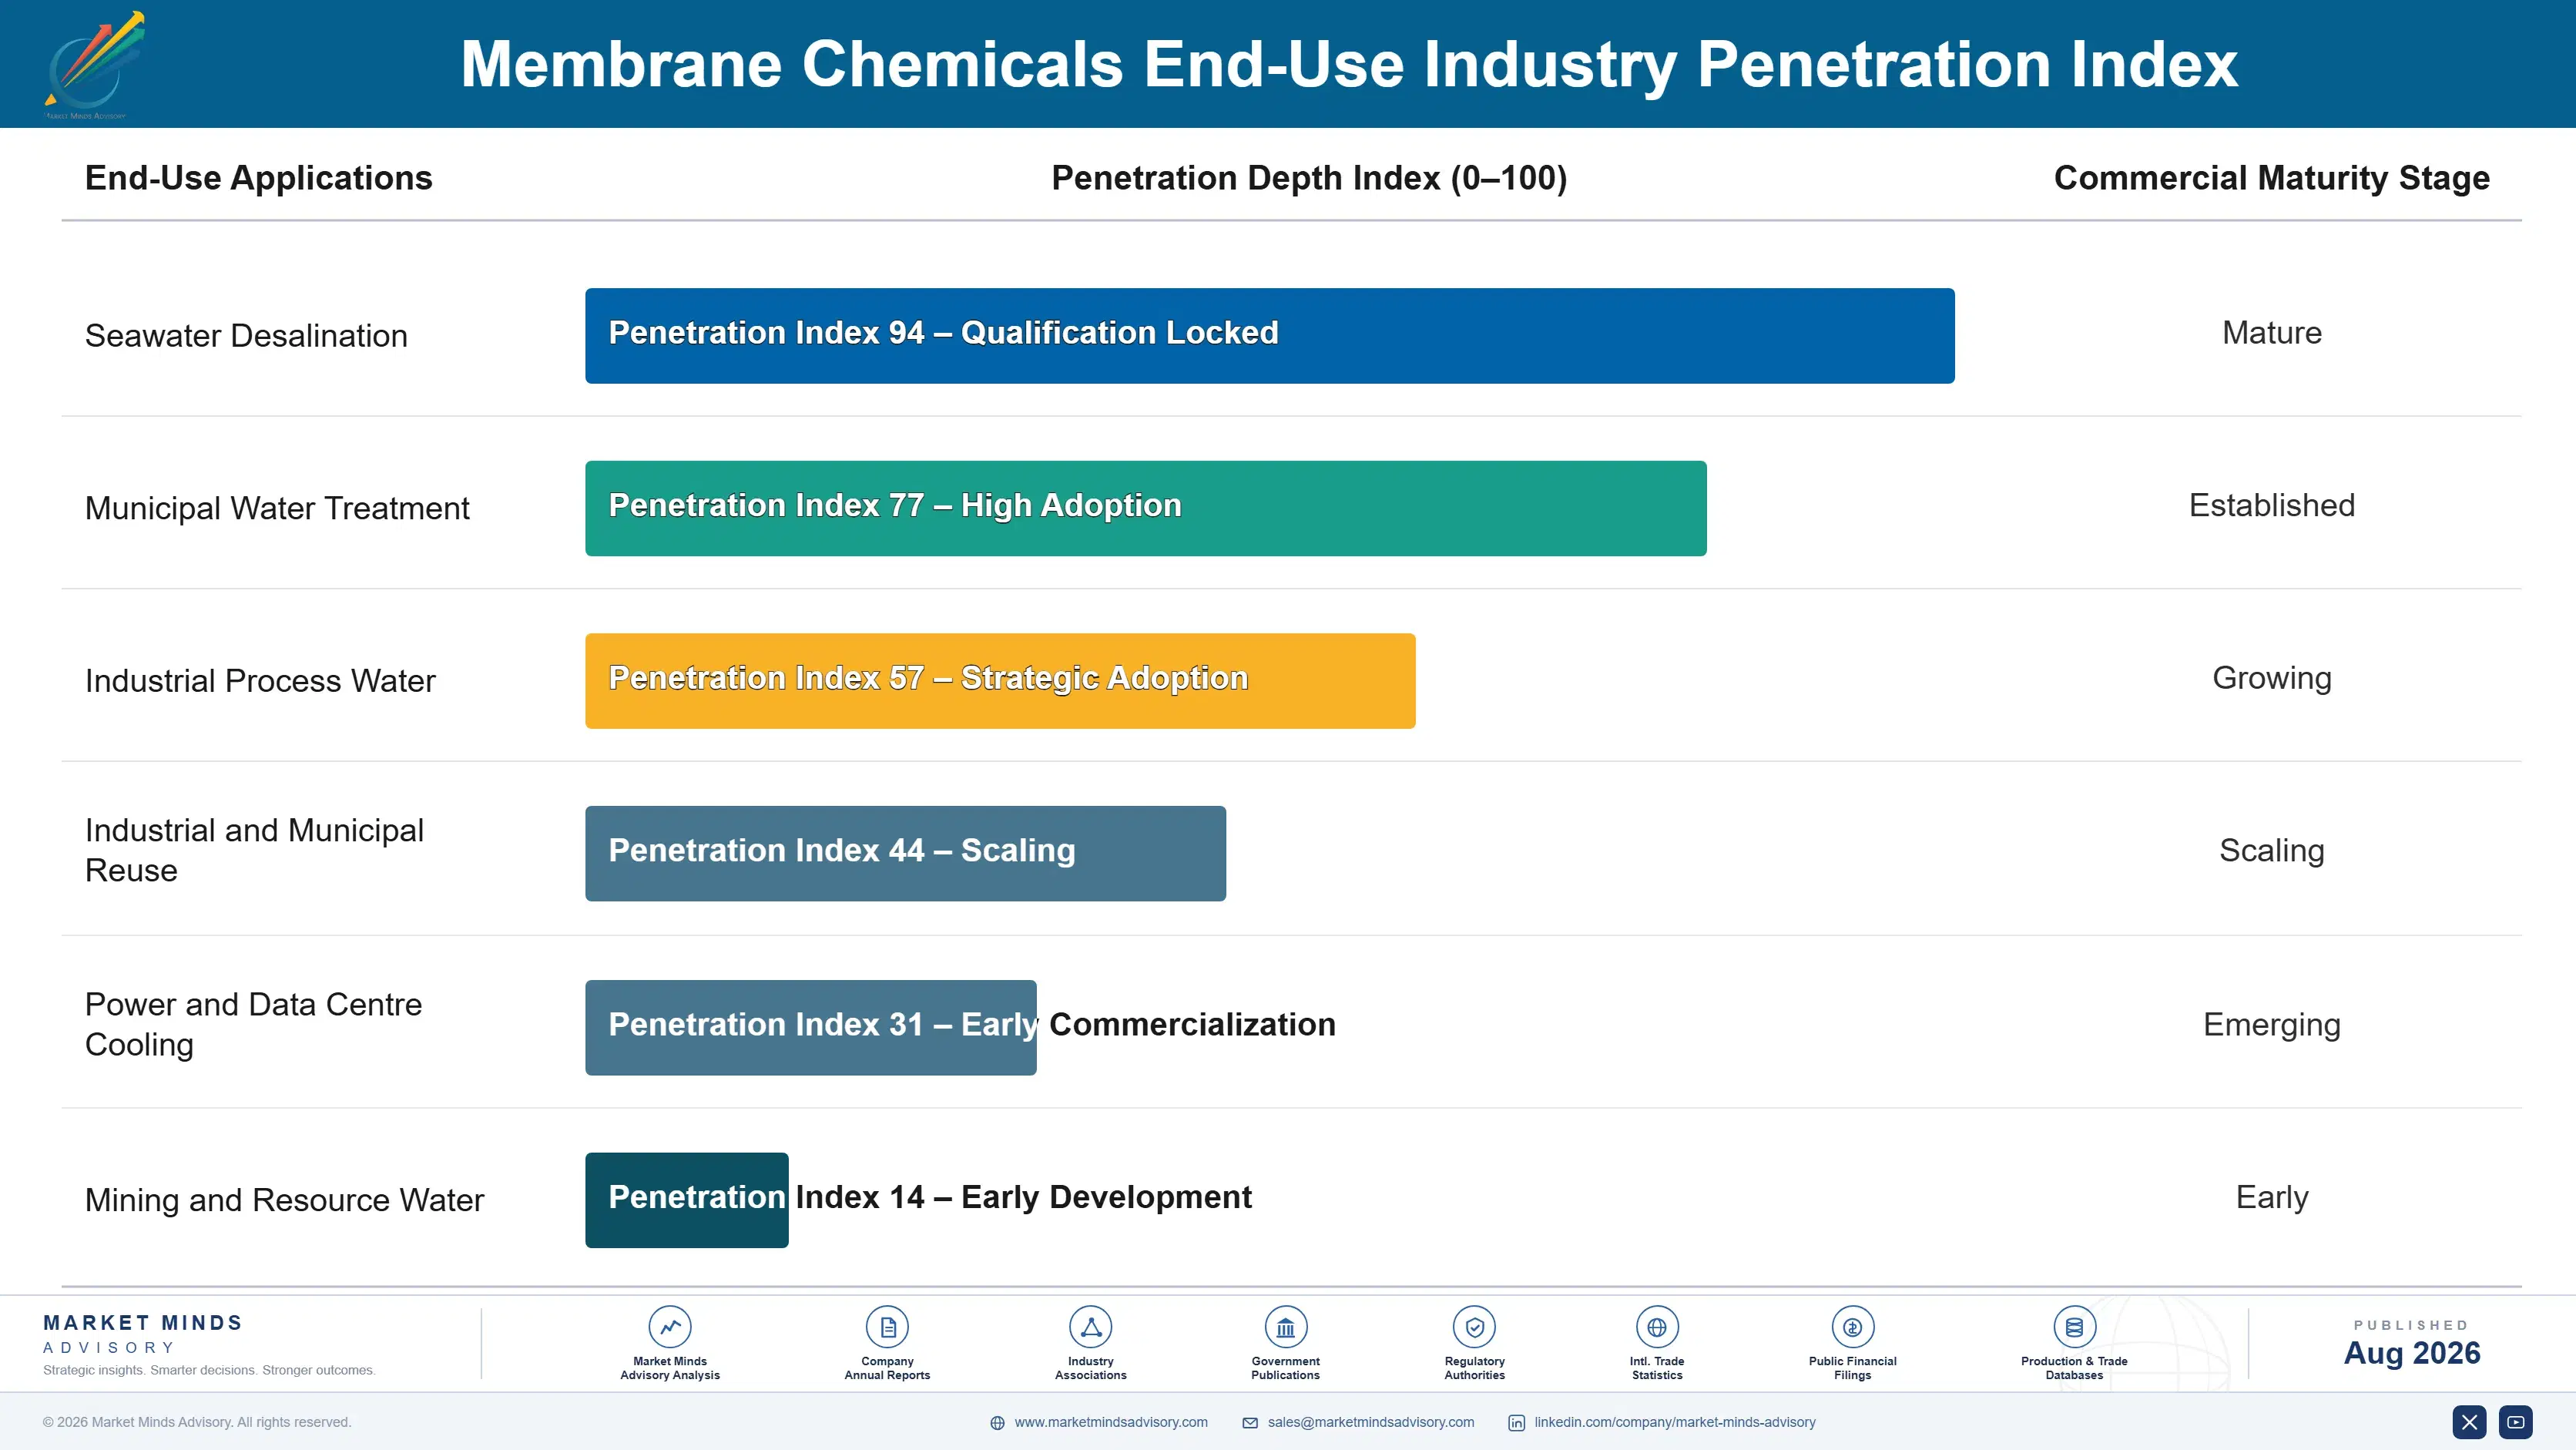
How Chemical Demand Renews

Demand renews continuously rather than on any cycle, which makes this among the most predictable revenue in speciality chemicals. An operating membrane plant consumes antiscalant, cleaner and biocide every hour it runs, for roughly six years until the membranes are replaced and then again afterwards. The purchase is not a decision anybody makes repeatedly, it is a supply obligation somebody set up once. What renews periodically is the contract rather than the requirement.
Stickiness depends entirely on how confidently a customer believes the products are interchangeable. Biocide and specialty cleaning positions hold well, since performance varies with source water and switching risks a fouling event nobody wants to explain. Outcome contracts are stickiest of all, because the supplier carries the membrane risk and the customer has no incentive to reopen. Standard antiscalant supply changes hands at every tender with nothing surviving.

The buyer has moved further from the plant than most suppliers have noticed. Chemical selection sat with plant chemists and operations managers who understood what fouling looked like. It increasingly sits with centralised procurement functions comparing specifications across sites they have never visited, which is exactly the buyer least equipped to value application support.
membrane-chemicals-market-end-use-penetration-index-1787555501152

Where To Place The Bet

These are among the four positions where our research anticipates prominent divergence between winners and laggards over the coming forecast period. Each is grounded in the demand model, the regulatory perimeter, and the announced capacity pipeline.
01 / OUTCOME CONTRACT CONVERSION

Sell membrane life rather than kilogrammes delivered

Membrane chemicals represent roughly 2% of plant operating cost while the membranes they protect cost around 18 times the annual chemical spend, which means the customer is genuinely buying asset protection and procurement is genuinely tendering a commodity. Suppliers accepting that framing compete on unit price against every competitor meeting the identical specification sheet. Suppliers offering membrane life guarantees backed by dosing control and monitoring reprice against the protected asset instead, which transfers a risk the customer wants transferred and escapes an auction nobody wins.
02 / CONVERSION TIMING ADVANTAGE

Start phosphorus trials before the deadline arrives

Phosphorus discharge limits near 1 milligramme per litre catch the phosphonate antiscalants that have dominated membrane treatment for decades, and converting requires dosing trials against each site's specific water chemistry rather than a simple product substitution. Operators facing those limits will convert on a regulatory timetable regardless of whether their incumbent supplier has prepared for it. Suppliers running trials before the customer asks hold the account and price the replacement chemistry above the old, and suppliers waiting to be asked arrive to find competitors already three months ahead.
03 / BIOFOULING APPLICATION DEPTH

Own the problem chlorine cannot solve

Polyamide membranes fail above roughly 0.1 parts per million free chlorine, which removes the cheapest and most dependable biocide in all of water treatment from precisely the application that needs biological control most urgently. Non-oxidising chemistry costs considerably more and behaves less predictably against a living target that shifts with source water, temperature and season. That unpredictability is exactly why this segment resists commodity tendering, and the application knowledge that makes it work takes years of site experience rather than any laboratory programme.
04 / REUSE CUSTOMER DEVELOPMENT

Follow reuse rather than desalination tenders

Industrial and data centre reuse installations consume chemicals continuously across roughly six year membrane lives, and those operators installed the systems to answer community and regulatory pressure about water consumption rather than to optimise any input cost. That makes them dramatically less price sensitive than a desalination utility running an annual tender against published specifications. Reuse installation is growing faster than desalination capacity across North America, Europe and industrial Asia, and most suppliers are still organised entirely around the larger and more punishing customer.

Engagement Snapshot From the Field

A live engagement with an industry participant carrying material or product regulatory and market exposure ahead of a defining policy shift, showing how our research translates into a defensible multi-year portfolio strategy.
MARKET MINDS ADVISORY · CLIENT ENGAGEMENT SUMMARY
Membrane Chemicals Producer Strategic Portfolio Review and Transition Roadmap 2026·Investment Scenario on Membrane Chemicals Exposure Evaluation 2025-26
CLIENT PROFILE
A European water treatment chemical supplier with annual revenue around EUR 105 million (client-reported, unverified by MMA), supplying antiscalants, cleaners and biocides to municipal and industrial membrane operators. Technical service was provided free alongside chemical supply. Roughly 70% of revenue came from annual tender contracts. No outcome-based agreements existed anywhere in the portfolio. Service cost was never measured.
STRATEGIC CHALLENGE
Tender win rates and pricing had both declined across three years (client-reported, unverified by MMA) as regional competitors quoted below the client's cost of serving accounts. Management proposed cutting technical service to match those cost bases. Nobody had asked whether the service was worth more to customers than the price difference they were losing on.
MMA APPROACH
MMA quantified the client's technical service cost per account and compared it against membrane life outcomes at those sites versus sites served by competitors without support. Customer willingness to contract on membrane life was tested directly through the expert interview programme. Phosphonate conversion timing was mapped across the client's customer base, and reuse installation growth was sized separately from desalination demand.
KEY FINDINGS
  1. Sites receiving the client's technical service achieved membrane lives materially longer than comparable sites without it, which no tender comparison had ever captured or valued in any way.
  2. Four of the client's larger customers indicated they would consider membrane life contracting, and none had ever been offered it by the client or anybody else.
  3. Roughly a third of the customer base faced phosphorus discharge limits within three years and none had begun conversion trials with the client or with any competitor.
  4. Industrial reuse installations in the client's territory were growing considerably faster than municipal desalination and were being served almost entirely by competitors.
CLIENT PROFILE
A European water treatment chemical supplier with annual revenue around EUR 105 million (client-reported, unverified by MMA), supplying antiscalants, cleaners and biocides to municipal and industrial membrane operators. Technical service was provided free alongside chemical supply. Roughly 70% of revenue came from annual tender contracts. No outcome-based agreements existed anywhere in the portfolio. Service cost was never measured.
STRATEGIC CHALLENGE
Tender win rates and pricing had both declined across three years (client-reported, unverified by MMA) as regional competitors quoted below the client's cost of serving accounts. Management proposed cutting technical service to match those cost bases. Nobody had asked whether the service was worth more to customers than the price difference they were losing on.
MMA APPROACH
MMA quantified the client's technical service cost per account and compared it against membrane life outcomes at those sites versus sites served by competitors without support. Customer willingness to contract on membrane life was tested directly through the expert interview programme. Phosphonate conversion timing was mapped across the client's customer base, and reuse installation growth was sized separately from desalination demand.
KEY FINDINGS
  1. Sites receiving the client's technical service achieved membrane lives materially longer than comparable sites without it, which no tender comparison had ever captured or valued in any way.
  2. Four of the client's larger customers indicated they would consider membrane life contracting, and none had ever been offered it by the client or anybody else.
  3. Roughly a third of the customer base faced phosphorus discharge limits within three years and none had begun conversion trials with the client or with any competitor.
  4. Industrial reuse installations in the client's territory were growing considerably faster than municipal desalination and were being served almost entirely by competitors.
RECOMMENDED STRATEGY
Phase 1: Phase one: stop cutting technical service and instead price it separately, letting commodity accounts decline it and revealing which customers actually value support. Phase 2: Phase two: offer membrane life contracting to the four customers who indicated interest, transferring replacement risk in exchange for multi-year commitment. Phase 3: Phase three: open phosphonate conversion trials across the affected third of the base before any regulatory deadline forces the question.
OUTCOME
Service pricing was separated and roughly a quarter of accounts declined it, which cut cost without losing volume. Two membrane life contracts are signed. Conversion trials are running at eleven sites, and the client reports tender pricing pressure easing on serviced accounts (client-reported, unverified by MMA).

Frequently Asked Questions

Foundational context covering the market sizes, CAGR, scope, country, region and competition that inform every finding below. This section is provided to cover basics and most often pre-purchase conversations, answered from the MMA Primary Research Dataset.

What is the current size of the Membrane Chemicals Market?

The market was valued at USD 3.2 billion in 2025, rising to an estimated USD 3.43 billion in 2026. East Asia holds the largest regional share at 29% of value.

How large will the Membrane Chemicals Market be by 2036?

MMA forecasts USD 6.88 billion by 2036 under the base case, an expansion multiple of 2.00 times the 2026 value. That represents USD 3.45 billion of incremental value.

What is the CAGR for the Membrane Chemicals Market 2026 to 2036?

The base case runs at 7.2% compound annual growth between 2026 and 2036, with a bull case at 8.4% and a bear case at 6.0%. Historical growth from 2020 to 2025 was 5.8%.

Which segment is growing fastest?

Biodegradable polymer antiscalants lead at 10.8%, half again the market rate, because phosphorus discharge limits now catch the phosphonate chemistry directly. Biocides follow at 8.6%.

Who are the major companies in the Membrane Chemicals Market?

Veolia, Ecolab, Kurita Water Industries, Solenis and BASF hold 47% of supply between them. Application knowledge rather than formulation advantage sustains most of those positions.

Which country is growing fastest?

India leads at 10.2%, driven by zero liquid discharge mandates compelling membrane installation where water economics alone would never have justified the investment at all.

Report Segmentation Architecture

The full report scope spans multiple orthogonal segmentation dimensions, with cross-tabulated demand data provided for each dimension pair. Coverage extends further to regional breakdowns, trend trajectories, and the competitive detail needed to support segment-level decision-making.

By Chemical Function

  • Antiscalants
  • Membrane Cleaners
  • Biocides and Biofouling Control
  • Coagulants and Pretreatment Flocculants
  • Biodegradable Polymer Antiscalants
  • Preservation and Dechlorination Agents

By End-Use Industry

  • Seawater Desalination
  • Municipal Water Treatment
  • Industrial Process Water
  • Industrial and Municipal Reuse
  • Power and Data Centre Cooling
  • Mining and Resource Water

By Supply Arrangement

  • Annual Tender Contract
  • Outcome-Based Life Agreement
  • Chemical Distributor Channel
  • Plant Operator Bundled Supply
  • Direct Industrial Supply

By Region

  • North America
  • Western Europe
  • East Asia
  • South Asia and Pacific
  • Latin America
  • Middle East and Africa
  • Eastern Europe

Scope, Methodology, and Coverage

Every figure in this report is reproducible from documented input assumptions. The scope below maps the historical period, the forecast horizon, the segmentation dimensions, and the countries covered, alongside the underlying primary and qualitative methodology.
Historical Period
2020 to 2025
Forecast Period
2026 to 2036
Base Year
2025 (USD billions; MMA Primary Research Dataset, August 2026)
Market Definition
The market comprises chemicals supplied to operate and maintain filtration membranes across seawater desalination, municipal treatment, industrial process water, reuse, cooling and mining applications, covering antiscalants, membrane cleaners, biocides and biofouling control, coagulants and pretreatment flocculants, biodegradable polymer antiscalants, and preservation and dechlorination agents. Value is measured at chemical supplier level across tender, outcome-based, distributor and direct channels. The membranes themselves, filtration equipment and pressure vessels, general water treatment chemicals without membrane function, ion exchange resins and plant engineering services fall outside scope.
Quantitative Units
USD billions (current prices); thousand tonnes of chemical supplied annually; USD per tonne by chemical function
Segmentation Dimensions
By Chemical Function; By End-Use Industry; By Supply Arrangement; By Region
Regions Covered
North America, Western Europe, East Asia, South Asia and Pacific, Latin America, Middle East and Africa, Eastern Europe
Countries Covered
China, Japan, South Korea, Taiwan, India, Singapore, Australia, Thailand, Indonesia, Vietnam, United States, Canada, Mexico, Germany, Netherlands, Spain, France, United Kingdom, Italy, Belgium, Poland, Czechia, Romania, Hungary, Brazil, Chile, Peru, Saudi Arabia, United Arab Emirates, Israel
Key Companies Profiled
Veolia Water Technologies, Ecolab, Kurita Water Industries, Solenis, BASF, SUEZ, Dow, Avista Technologies, King Lee Technologies, Genesys International, Accepta, Buckman, ChemTreat, Italmatch Chemicals, Aquapharm Chemicals, Kemira, SNF Group, Thermax, Ion Exchange India, Toray Industries
Quantitative Methodology
Primary survey, n=3,800 respondents, Q4 2025, six countries; demand-side model with trade association cross-validation
Qualitative Methodology
47 expert interviews, Q4 2025; applied to validate demand model assumptions, identify emerging dynamics, and assess competitive positioning
Report Format
PDF and XLSX data workbook (Word format preview document)
Publisher
Market Minds Advisory
Report Code
MMA-2026-CHM-635
Published
August 2026
Contact
sales@marketmindsadvisory.com | www.marketmindsadvisory.com

Purchase the full Membrane Chemicals Market Report (2026 to 2036).

The full report sizes the global membrane chemicals market to 2036 across six chemical functions and seven regions, measured on chemical revenue at supplier level. It treats the mismatch between a two percent cost line and the asset it protects as the governing commercial problem and models outcome contracting against tender supply. Competitive analysis covers 20 participants evaluated on chemical revenue, with moat and risk assessment for the two leaders. Phosphorus discharge conversion is mapped against regulatory timetables by geography, since conversion timing decides which supplier holds each account. Four quantified revenue levers close the analysis.
Six-function segment sizing with segment-level growth rates
Seven-region share and growth breakdown to 2036
Twenty-participant competitive map on one revenue basis
Outcome contracting economics modelled against annual tender supply
Phosphorus conversion timetables mapped by regulatory geography
Four quantified revenue levers with commercial impact ranges

Built For The People Who Decide

From boardroom strategy to bench-side execution, this report is read cover-to-cover by leaders shaping the next decade of their industry, turning demand scenarios, market dynamics and valuation benchmarks into decisions.
CXOs/ Presidents/ VPs/ Managers
M&A and Corporate Development
Strategy Teams and R&D Heads
Procurement and Product Directors
Regulatory and Compliance Leaders
Investor Relations and Equity Analysts