Market Minds Advisory
Flocculant and Coagulant Market

Flocculant and Coagulant Market: Separation Chemistry Across Municipal, Mining and Industrial Water, 2026 to 2036

Sludge disposal costs more than the chemistry that reduces it by a third, yet treatment plants still tender polymer on price per tonne and dose it by eye rather than by measurement.

Lead Analyst

Bilal Shaikh

Published

September 2026

Make Smarter Decisions with Customized Research Insights

Request a free sample report and evaluate market opportunities, growth trends, and competitive dynamics relevant to your business needs.

2025 MARKET VALUE$13.2BMarket Size 2025
2036 FORECAST VALUE$25.6BBase Case , 2026 to 2036
CAGR 2026 TO 20366.2 %Bull 7.4% / Bear 5.0%
INCREMENTAL OPPORTUNITY$11.6BNet 10- year value creation
EXPANSION MULTIPLE1.83x2036 value over 2026 base
Strategic Levers
M&A Pipeline
Regional Outlook
Country Rankings
Competitive Intelligence
Segmental Deep-dive
Call-Us : 91 93563 13602

Executive Snapshot and Market Trajectory

The economics of this market sit downstream of the chemical itself, almost entirely. Treatment chemicals account for 18% of a municipal plant's operating cost, while the sludge they help remove costs far more to haul and dispose of, and optimised polymer dosing cuts dewatered cake volume by roughly 35%.
Growth concentrates in cationic polyacrylamide flocculants, expanding at 9.3%, which do the sludge conditioning and dewatering work that drives the disposal saving which inorganic coagulants cannot perform at all. East Asia holds 30% of value, the largest regional share, because Chinese municipal wastewater treatment capacity expanded faster over two decades than anywhere else has ever managed and because industrial discharge standards keep tightening behind that buildout.
The supplier base is moderately fragmented, with the top five holding 34% of chemical tonnage supplied, split between polymer producers carrying acrylonitrile-linked cost positions and inorganic coagulant makers operating purely on regional freight economics. Competition runs on application service and dose optimisation rather than on the chemistry itself, most of which is now entirely generic. Sludge disposal cost is the pressure now reshaping how these products get sold, priced and contracted.
Market Definition
The market comprises coagulation and flocculation chemicals supplied for solid-liquid separation in water and effluent treatment, spanning cationic polyacrylamide flocculants, polyaluminium chloride and prehydrolysed coagulants, anionic and nonionic polyacrylamides, aluminium and iron salt coagulants, and bio-based natural polymer flocculants. Sizing captures chemical revenue at realised delivered price across municipal, mining, oil and gas, pulp and paper, food processing and general industrial treatment. Membrane systems, disinfection chemicals, scale and corrosion inhibitors, ion exchange resins, dosing equipment and treatment plant construction fall outside scope.
Base Year Value
$13.2B in 2025 (MMA Primary Research Dataset, August 2026)
Forecast Period
2026 to 2036, eleven discrete annual values
CAGR
6.2% base case. Bull 7.4%. Bear 5.0%.
Fastest Growth Segment
Cationic Polyacrylamide Flocculants: 9.3% CAGR
Fastest Growth Country
India: 8.8% CAGR
Fastest Growth Region
South Asia and Pacific: 8.4% CAGR
Largest Region
East Asia: 30% of 2025 global value
Market Leaders
SNF Group, Kemira, Solenis, Ecolab, BASF. Source: MMA Analysis based on company annual reports.
Primary Survey
n=3,800 procurement and R&D decision-makers, Q4 2025, six countries
Methodology
Demand-side build-up, cross-validated against public data, 47 expert interviews

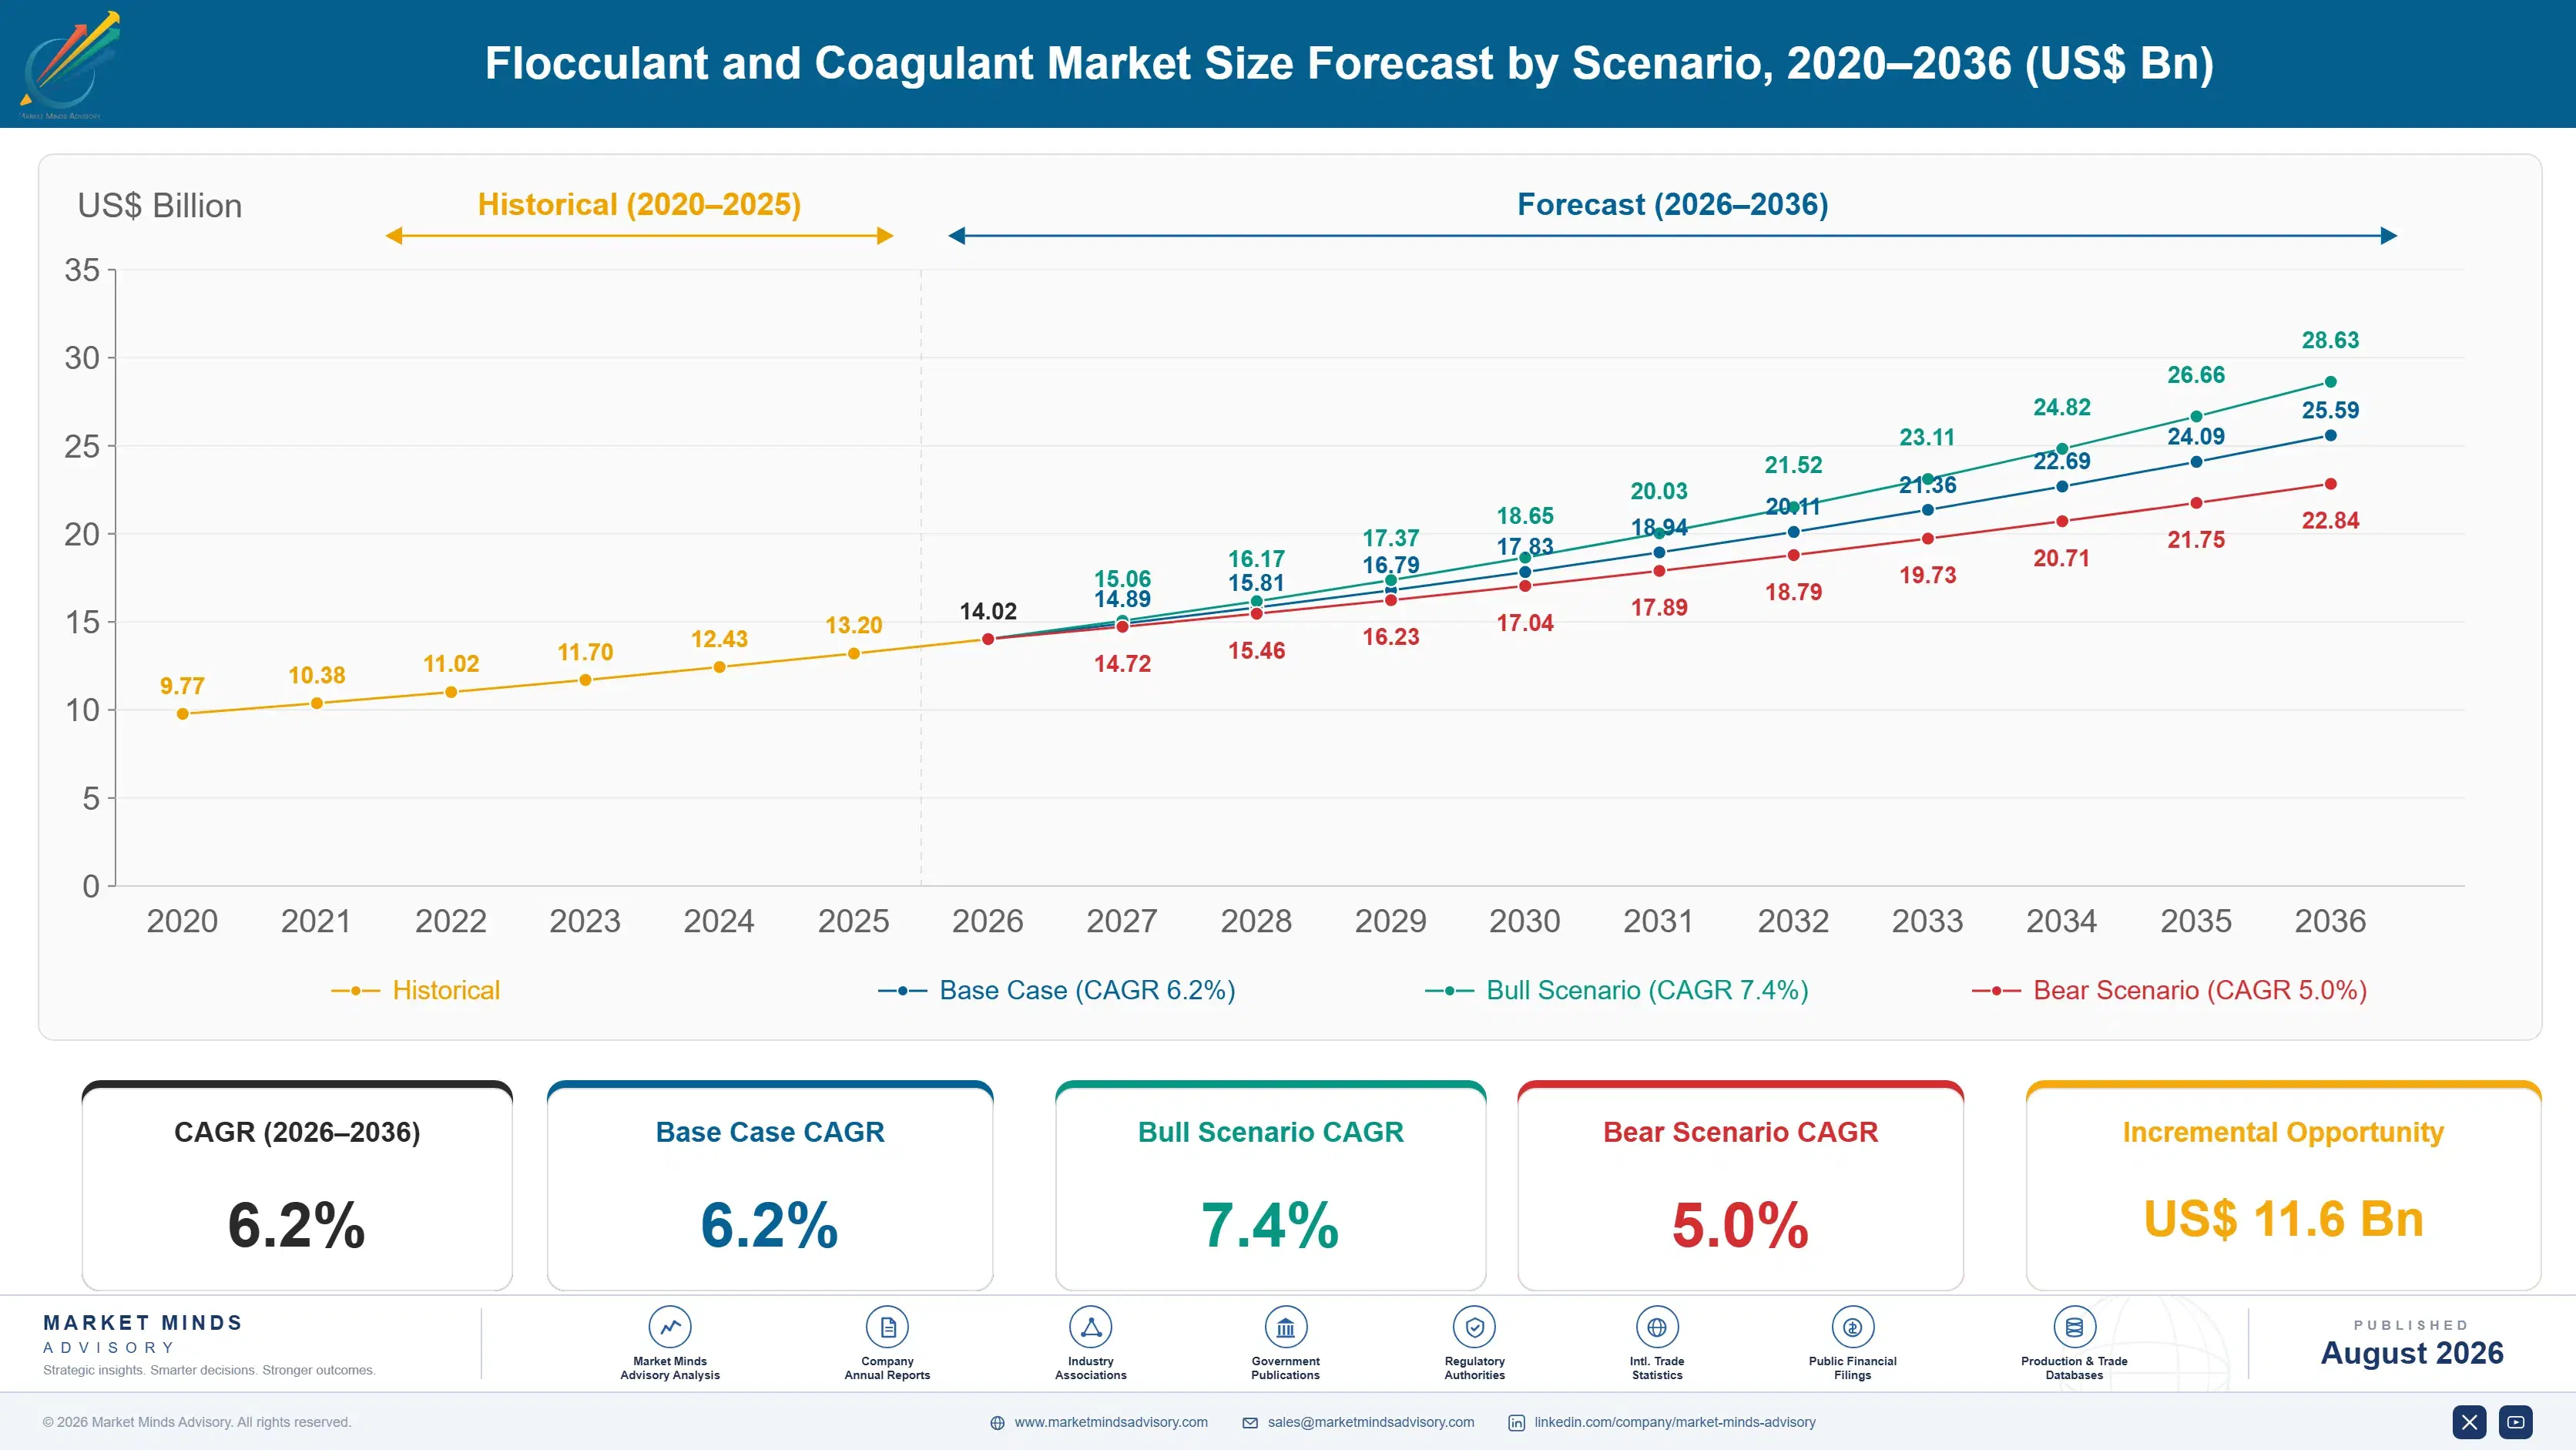
Flocculant and Coagulant Market Forecast Scenarios

flocculant-and-coagulant-market-size-forecast-scenario-1787310286012
Growth of 5.1% across 2020 to 2025 was steadier than most chemical markets managed, because water treatment demand does not pause for recessions. The distortion came from cost rather than volume. Acrylonitrile supply disruption in 2021 and European energy prices through 2022 pushed polymer prices to levels that forced municipal buyers into dose optimisation programmes many had resisted for years, which slowed volume growth while raising realised value.
The base case at 6.2% rests on three mechanisms. Municipal wastewater treatment capacity keeps expanding across Asia, Latin America and the Gulf, each new plant carrying a permanent chemical demand attached to it. Industrial discharge standards tighten across most producing economies, which pushes effluent treatment from optional to mandatory. And sludge disposal costs keep rising as landfill capacity closes and incineration gate fees increase, shifting value toward polymers that reduce cake volume.
The bull case at 7.4% turns on mining demand, where tailings scrutiny after several dam failures has driven investment in thickening and dry stacking that consumes flocculant at high rates. The bear case at 5.0% turns on municipal budgets. Water utilities in mature markets face capital programmes competing against chemical spend, and dose optimisation genuinely reduces volume when implemented properly.

What Determines Treatment Chemical Value

The value in this market is not in the chemical, it is in what the chemical removes. Treatment chemicals are 18% of a municipal plant's operating cost, while sludge haulage and disposal frequently exceed that, and optimised polymer selection and dosing cut dewatered cake volume by roughly 35%. A plant spending more on better polymer usually spends less overall. Very few of them measure the total, which is why so much of this market is still tendered on price per tonne.
TOP FIVE SHARE34%Concentration of treatment chemical tonnage across the largest suppliers
POLYMER FLOCCULANT PRICEUSD 3,400 per tonneDelivered price per tonne of cationic polyacrylamide flocculant
TREATMENT COST SHARE18%Chemical share of total municipal water treatment operating cost
SLUDGE VOLUME REDUCTION35%Dewatered cake volume reduction achieved through optimised polymer dosing
MONOMER COST SHARE54%Acrylonitrile and monomer share of polymer production cost
MUNICIPAL DEMAND SHARE46%Municipal water and wastewater share of total chemical consumption
Two quite different businesses share the same market definition. Inorganic coagulants are commodity chemistry sold on regional freight economics, since shipping dilute aluminium and iron salts any distance is uneconomic. Organic polymers carry monomer-linked cost positions, considerably higher value density, and application service attached to them that inorganic supply rarely justifies.
Application service is where the differentiation genuinely sits. Polymer selection depends on charge density, molecular weight and the specific character of the sludge or effluent, and getting it wrong wastes chemical while producing worse separation. The suppliers who put technical people on site earn on outcomes; those who ship drums compete on price.
"Plant operators will spend an afternoon negotiating four percent off a polymer price and never measure what the dose actually needs to be. I have seen sites overdosing by a third for years, paying for chemical that made the cake wetter, and every one of them believed they were running an efficient operation."
Director, Water Treatment and Process Chemicals Practice · MMA Chemicals and Mat

Market Trends

Sludge Disposal Cost Reframes Polymer Purchasing Entirely

Landfill closures and rising incineration gate fees have pushed sludge disposal costs up sharply across mature markets, with typical municipal disposal now running near USD 95 per wet tonne. That changes the arithmetic on polymer, because a formulation cutting cake volume by 35% saves considerably more in haulage than the chemical premium costs. Utilities that model total cost buy differently from those tendering on chemical price, and the difference is measurable in their operating budgets. Suppliers able to demonstrate cake solids improvement on site are winning contracts that pure price competition previously decided.
Market Impact: Covers 2,900 plants under construct
Tailings Management Scrutiny Drives Mining Flocculant Demand

Dam failures at Mariana and Brumadinho changed how mining companies and their insurers treat tailings storage, and the response has been investment in thickening, paste and dry stacking technologies that consume flocculant at rates conventional wet impoundment never approached. Roughly 240 major operations have committed to thickened or filtered tailings since. Consumption per tonne of ore processed rises substantially under these systems, and the polymer specification is demanding because settling rates in mineral slurries depend on chemistry matched closely to the ore mineralogy rather than on any general-purpose product. Insurers now examine that specification alongside the engineering.
Market Impact: Drives 41% of industrial demand

Market Opportunities and Growth Drivers

Municipal Treatment Capacity Expands Across Developing Economies

Wastewater treatment capacity continues expanding across Asia, Latin America and the Gulf, driven by urbanisation, public health programmes and discharge regulation reaching cities that previously discharged untreated effluent. Roughly 2,900 municipal plants are under construction or commissioning across these regions. Each plant carries a permanent chemical demand for the life of the asset, which makes this the most forecastable demand in the market because construction pipelines are published years ahead. What remains genuinely uncertain is how much of that demand goes to international suppliers rather than to domestic producers building capacity alongside it.
Market Impact: Monomer is 54% of cost

Industrial Discharge Standards Tighten Across Producing Economies

Effluent limits for suspended solids, phosphorus and metals have tightened across China, India, Southeast Asia and Latin America, converting industrial water treatment from a discretionary cost into a licence condition. Around 41% of industrial treatment chemical demand now arises from compliance requirements rather than from process necessity. Compliance-driven demand behaves differently from process demand: it is less price-sensitive, more specification-bound and considerably harder to defer during a downturn, which makes it attractive volume for any supplier able to document performance against a specific permit limit rather than a general specification.
Market Impact: Cuts consumption by 20% typically

Market Restraints and Challenges

Acrylonitrile Price Volatility Passes Straight Into Polymer

Acrylonitrile and monomer account for 54% of polyacrylamide production cost, and the root cause of the exposure is that acrylonitrile is a propylene derivative produced at a small number of large plants concentrated on the United States Gulf Coast and in East Asia. A single unplanned outage moves the price sharply and quickly. Municipal contracts frequently run annually against a monomer that reprices monthly, leaving producers to absorb the gap. Mitigation runs through indexed contracts, monomer supply agreements with multiple producers, and product design delivering equivalent performance at lower active polymer loading.
Market Impact: Disposal near USD 95 per tonne

Dose Optimisation Reduces Volume Even As Value Rises

The commercial argument that wins contracts also shrinks them. Proper dose control, real-time monitoring and polymer selection matched to the sludge routinely cut consumption by 20% or more at sites that were overdosing, which is most of them. The root cause is that dosing has historically been set conservatively and never revisited, so there is genuine fat to remove. Suppliers face an awkward position where their best technical argument reduces the tonnes they ship, and the ones handling it well have moved to service contracts priced on treated volume or on cake solids achieved.
Market Impact: Covers 240 committed mining operati
3 additional market trends, 2 additional growth drivers, and 4 additional restraints and challenges are covered in the full report. Contact sales@marketmindsadvisory.com to access the complete intelligence.

Segment CAGR and Growth Architecture

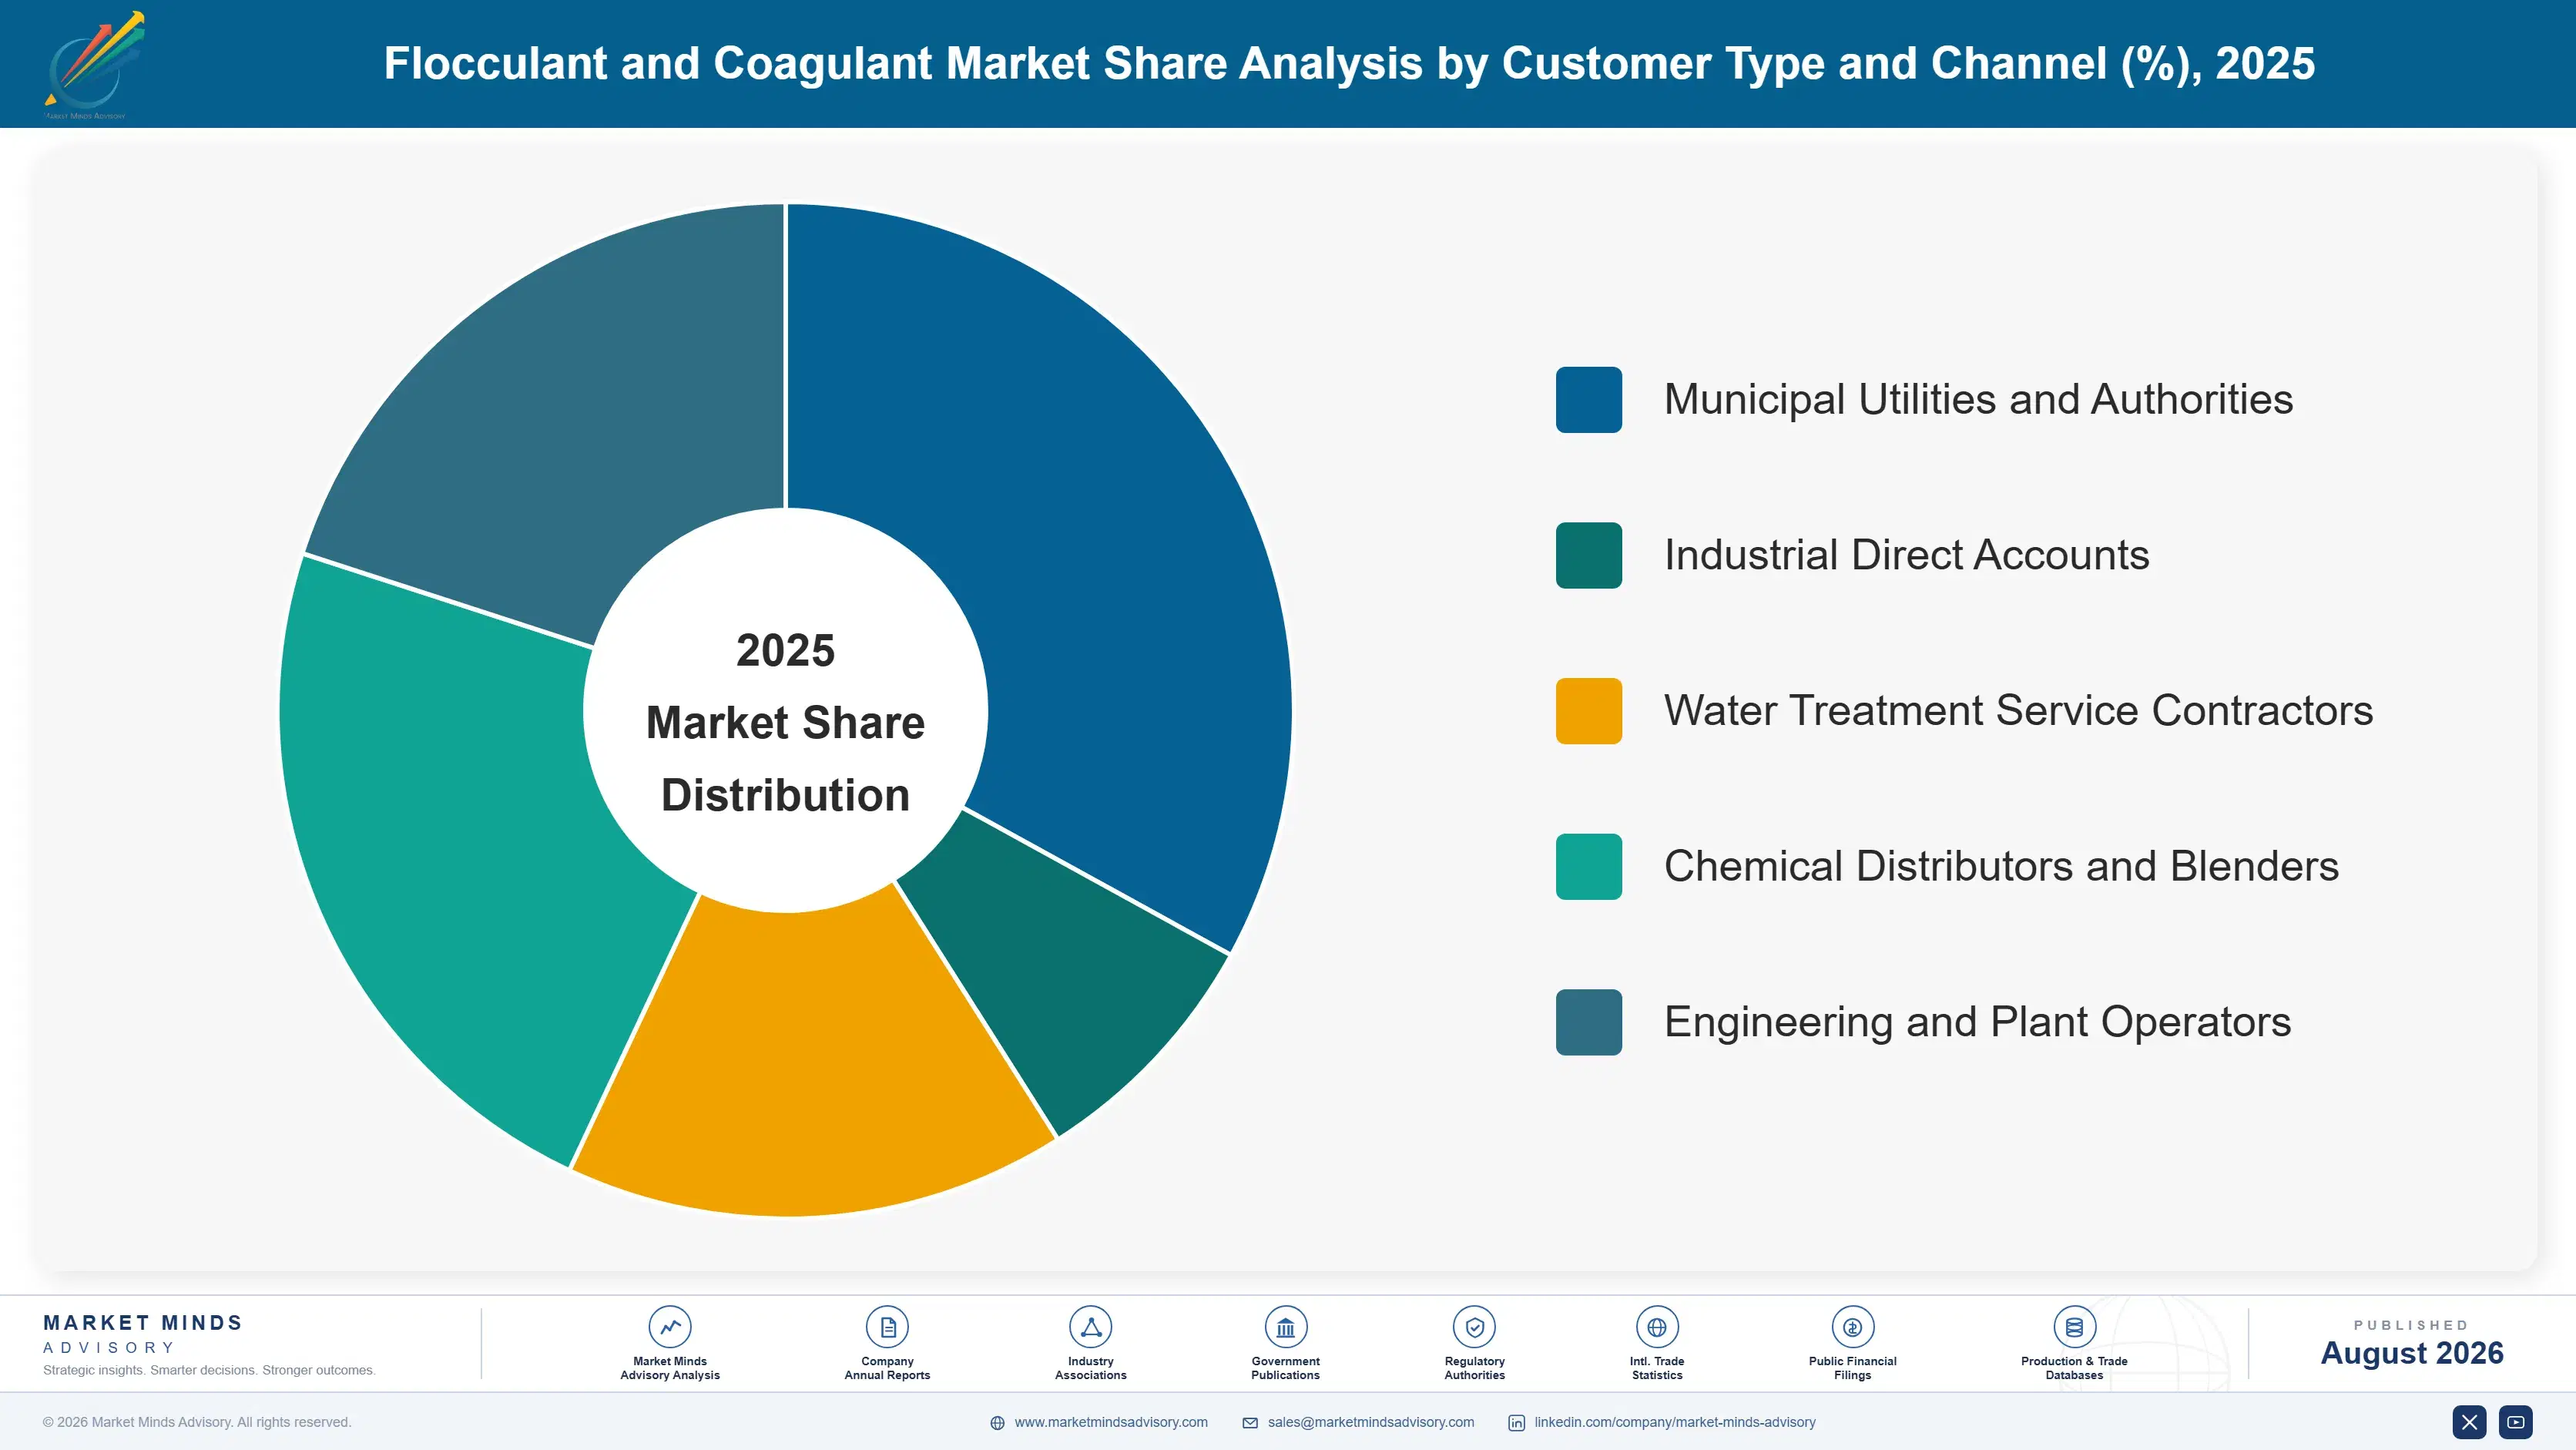
Segmentation follows chemistry class, which is the dimension determining production route, cost structure, value density and the separation duty a product can actually perform. End-use sector and treatment stage cut across every chemistry without separating them commercially, since the same cationic polymer conditions municipal and industrial sludge alike, so both sit in demand analysis instead.
flocculant-and-coagulant-market-market-share-analysis-1787310286544

Cationic Polyacrylamide Flocculants

Growing at 9.3%, exactly 1.50 times the market rate, and the chemistry doing the work that actually saves money downstream. Cationic polymers neutralise the negative charge on organic sludge particles and bridge them into flocs that dewater, which is the duty that cuts cake volume by roughly 35% and reduces disposal haulage accordingly. Charge density and molecular weight have to be matched to the specific sludge, so selection is genuinely technical rather than a catalogue exercise. Value density is high enough that freight economics permit international supply, unlike inorganic coagulants, which broadens considerably who can compete for any given site. Municipal and industrial sludge conditioning duties both sit within this segment.
CAGR 9.3%

Polyaluminium Chloride and Prehydrolysed Coagulants

Expanding at 7.6% as utilities migrate from conventional aluminium sulphate toward prehydrolysed grades that work across a wider pH range, produce less sludge and perform better in cold water, which matters considerably in northern municipal systems through winter. Basicity and aluminium content define the grade, and higher basicity products command meaningful premiums for the reduced alkalinity consumption they deliver. Production is regional because these are dilute aqueous products that ship poorly, so competition happens within freight radius rather than internationally. Bauxite and hydrochloric acid feedstock costs set the floor on what any producer can realistically quote, and that floor moves with alumina and chlor-alkali markets rather than with water treatment demand.
CAGR 7.6%
Full segment breakdown across 5 segments available in the complete report.

Regional Architecture and Country Demand Map

Regional value follows installed treatment capacity and discharge regulation rather than population or water scarcity. A region with severe water stress but limited treatment infrastructure consumes very little separation chemistry, while one with comprehensive treatment coverage consumes a great deal regardless of how much rain falls on it.

East Asia

Thirty percent of value, the largest regional share, rests on treatment capacity built at a pace no other region has matched. Chinese municipal wastewater coverage expanded from a small fraction of urban population to near-universal within two decades, and industrial discharge standards have tightened repeatedly behind that buildout, particularly for suspended solids and phosphorus. Domestic polymer and coagulant producers supply most of that demand at prices international suppliers rarely contest. Japanese and South Korean demand comes from mature municipal systems and from electronics and chemical industry effluent treatment requiring high specification products. Growth of 7.2% runs above the global rate, supported by continued industrial standard tightening rather than by further municipal capacity building.
Share: 30% | CAGR: 7.2% (2026 to 2036)

North America

Twenty-four percent of value from mature municipal systems, substantial mining operations and a large pulp and paper sector that has consumed flocculant heavily for decades. Sludge disposal economics matter more here than almost anywhere, as landfill capacity has tightened and disposal costs near USD 95 per wet tonne make cake solids improvement genuinely valuable to utilities. Municipal procurement nonetheless remains firmly price-focused across most jurisdictions despite that arithmetic. Mining demand from copper, gold and oil sands operations is significant and technically demanding. Growth of 5.5% reflects a mature installed base where value rises faster than volume, driven by product upgrade and service content rather than by any new treatment capacity.
Share: 24% | CAGR: 5.5% (2026 to 2036)
Regional intelligence for 5 additional markets available in the complete report: Western Europe, South Asia and Pacific, Latin America, Middle East and Africa, Eastern Europe. Contact sales@marketmindsadvisory.com.
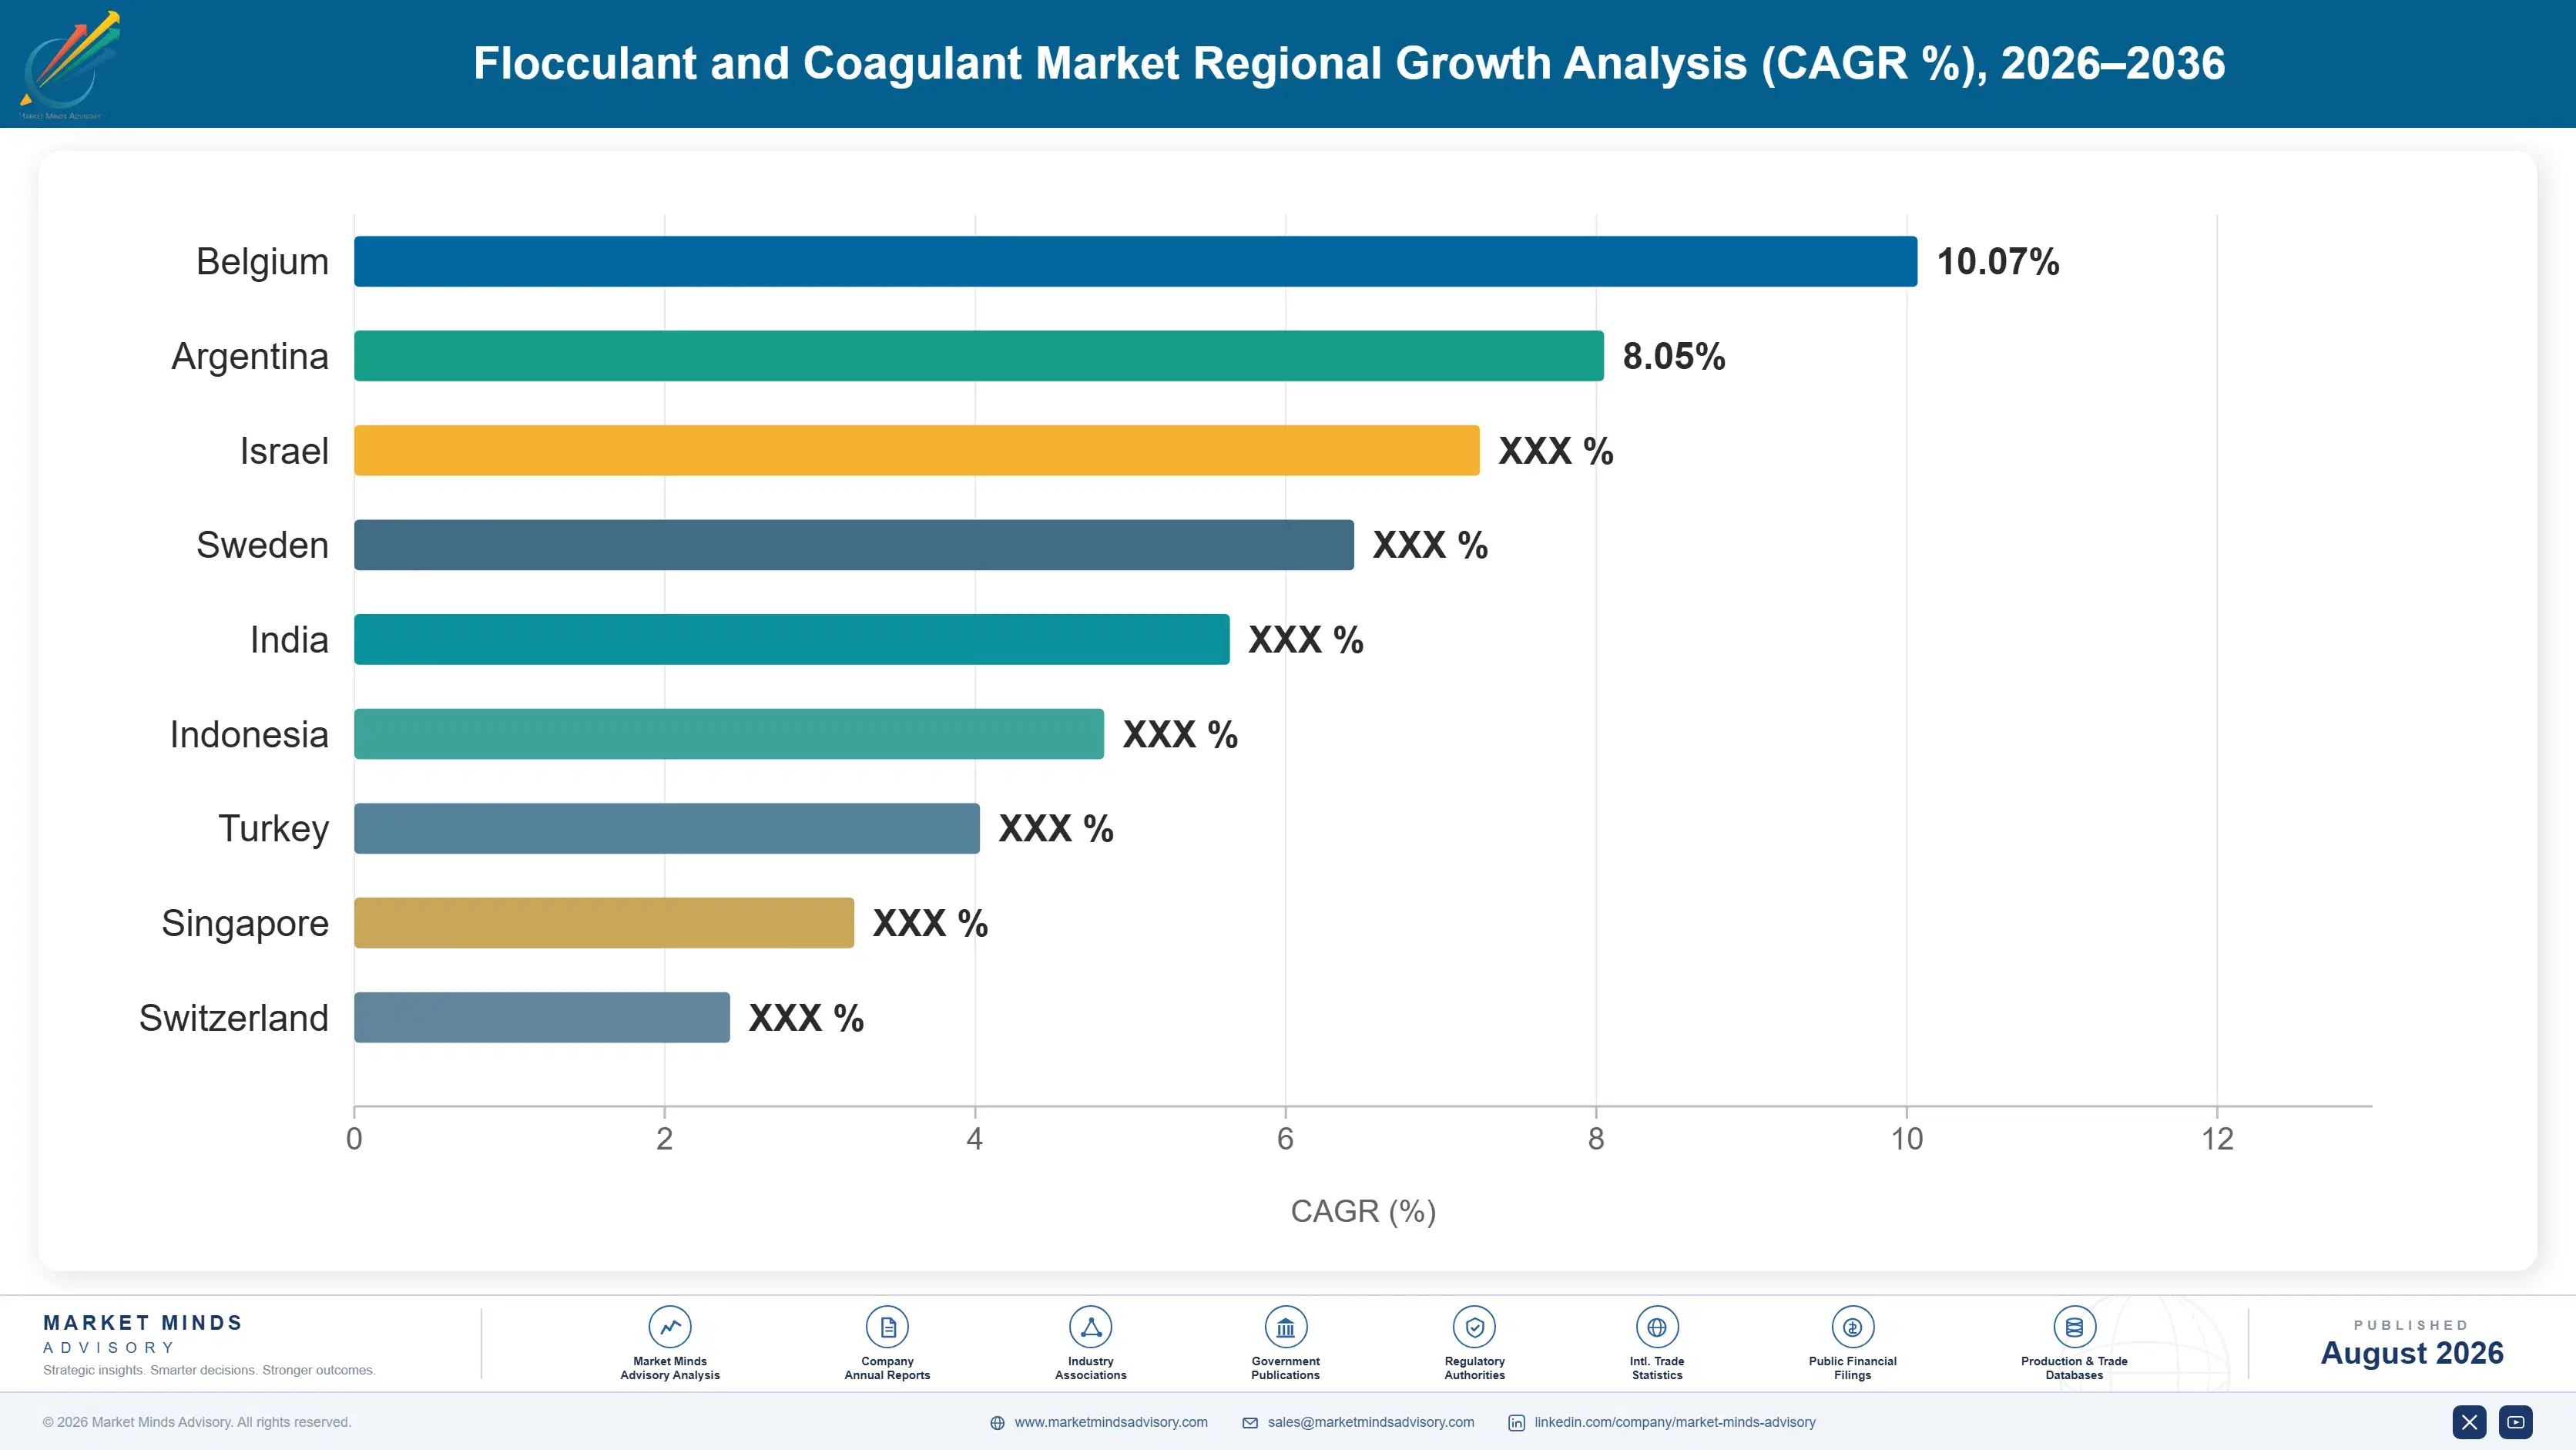
flocculant-and-coagulant-market-country-cagr-analysis-1787310287060

Where Treatment Chemical Suppliers Earn More

Competing on price per tonne in a market where most chemistry is generic and buyers tender annually leaves nothing worth having. The margin available sits in the disposal cost the chemical avoids, in dose control, in mining duties where specification genuinely matters, and in the contract structures that survive a monomer price spike intact.

Sell Sludge Disposal Savings Rather Than Chemical Price

Disposal costs near USD 95 per wet tonne across mature markets, and optimised polymer selection cuts cake volume by roughly 35%, which saves a mid-sized utility far more each year than its entire chemical budget costs. Suppliers who demonstrate cake solids improvement on site and contract against it realise roughly 28% above tendered commodity pricing. The evidence required is a plant trial and a weighbridge, not a laboratory study. Most suppliers never propose it, because the buying relationship sits with procurement while disposal costs land in an entirely different budget line.
Market Impact: Realises roughly 28% above tendered

Contract On Treated Volume Instead Of Tonnes Shipped

Dose optimisation cuts consumption by 20% or more at sites that were overdosing, which puts a supplier's best technical argument directly against its own revenue. Contracting on treated water volume or on cake solids achieved removes that conflict entirely and typically lifts realised revenue per site by roughly 15% while reducing what the customer actually spends. It also makes the relationship annual rather than tendered, since a performance contract is considerably harder to retender than a straightforward chemical supply agreement. The customer has to unpick an outcome rather than swap a product.
Market Impact: Lifts realised revenue per site by

Build Mining Tailings Application Capability Deliberately

Roughly 240 major mining operations have now committed to thickened or filtered tailings, and flocculant consumption per tonne of ore under those systems runs far above what conventional wet impoundment ever needed. Polymer selection has to be matched to ore mineralogy and slurry chemistry precisely, which makes this genuinely technical work commanding roughly 40% above municipal contract pricing. The capability required here is metallurgical rather than chemical, and most water treatment suppliers simply do not employ people who understand mineral processing well enough to compete for the work at all.
Market Impact: Commands roughly 40% above municipa

Index Contracts Against Published Monomer Benchmarks

Acrylonitrile represents 54% of polymer production cost and reprices monthly, while municipal supply contracts typically run for a full year at a fixed price, leaving producers carrying the entire exposure themselves for the duration. Indexation against published acrylonitrile benchmarks protects roughly 18% of realised margin through a spike of the kind seen in 2021. Municipal buyers routinely resist indexation at tender and accept it at renewal, particularly while a recent spike is still fresh in memory, so timing the request matters considerably more than negotiating hard on it ever does.
Market Impact: Protects roughly 18% of realised ma

Who Controls the Margin Pool

Concentration is moderate and reflects two businesses sharing one definition. The top five participants hold 34% of treatment chemical tonnage supplied, the basis used throughout this section, and the gap between SNF and the rest comes from acrylamide monomer integration at a scale nobody else operates. Inorganic coagulant supply is far more fragmented, because dilute aqueous products ship poorly, and every producing region supports local manufacturers competing on freight radius rather than on
Competition currently runs on three dimensions. Monomer cost position decides who survives a spike in polymer supply. Application service decides who wins the contracts where performance is evaluated rather than price. Regional manufacturing footprint decides inorganic coagulant supply outright, since freight economics make anything else uneconomic much beyond a few hundred kilometres from the plant.

Pressure is building from two directions. Chinese and Indian polymer producers are moving from domestic supply into export markets at prices Western producers cannot match on commodity grades. Utilities are professionalising procurement around total cost rather than chemical price. Rankings shift first in municipal polymer supply, where service-led suppliers have been displacing tonnage-only suppliers steadily for several years now.
flocculant-and-coagulant-market-company-positioning-matrix-1787310287580

Competitive Moat and Risk Dimensions

SNF GROUP

Moat: Acrylamide monomer integration scale

Backward integration into acrylamide monomer at a scale no competitor approaches gives a cost position in polyacrylamide that is genuinely difficult to attack, particularly during monomer tightness when non-integrated producers face both price and allocation. Manufacturing presence across every major region removes the freight disadvantage that would otherwise limit a single-origin supplier.
SNF GROUP

Risk: Single chemistry concentration

The business depends overwhelmingly on polyacrylamide chemistry and the acrylonitrile chain behind it, which concentrates exposure to a monomer produced at a small number of plants. Regulatory attention to residual acrylamide monomer in treated water has increased in several jurisdictions, and a tightening there would affect the entire product range at once.
KEMIRA

Moat: Coagulant network and service

A regional manufacturing network for inorganic coagulants combined with polymer supply lets the company serve a utility's whole treatment chain rather than one product line, which matters because coagulant and flocculant selection interact and optimising them together delivers results neither achieves alone. Municipal service relationships built over decades are difficult for a tonnage supplier to displace.
KEMIRA

Risk: European energy cost exposure

A substantial manufacturing base in Europe carries energy and feedstock costs well above Asian and North American competitors, which pressures the commodity end of the portfolio continuously rather than only during a spike. Municipal procurement in several European markets remains firmly price-led, which limits how much of that gap service capability can offset.

Players Tracked

Prominent Players

SNF Group
Kemira
Solenis
Ecolab
BASF

Other Key Players

Feralco
Chemtrade Logistics
USALCO
Buckman
Kurita Water Industries
Organo Corporation
Ixom
Aditya Birla Chemicals
Thermax
Sumitomo Seika Chemicals
ChemTreat
Veolia Water Technologies
Nouryon
Arkema
Sanyo Chemical Industries

Recent Developments

JUNE 2025

Utility awards performance contract on cake solids

A municipal water utility awarded a treatment chemical contract priced against achieved dewatered cake solids rather than tonnes of polymer delivered, following a trial that documented disposal haulage savings substantially exceeding the chemical price premium across a full operating year at the plant concerned across two sludge streams.
Signal: Performance contracting removes the confli
FEBRUARY 2025

Mining operation commissions filtered tailings facility

A large copper mining operation commissioned filtered tailings processing capacity to replace conventional wet impoundment, following sustained regulatory and insurer pressure in the wake of recent dam failures, with flocculant consumption per tonne of ore processed running at several times conventional thickening requirements across the operation.
Signal: Tailings management change is the single l
NOVEMBER 2025

Polyacrylamide capacity expansion commissioned in Asia

Additional polyacrylamide production capacity entered commercial operation in Asia, integrated with regional acrylamide monomer supply, and targeting both municipal and industrial demand across South Asian and Southeast Asian markets where municipal treatment capacity has been expanding considerably faster than domestic chemical supply could serve it.
Signal: Regional integrated capacity erodes the co

What Sits Inside Treatment Chemical Cost

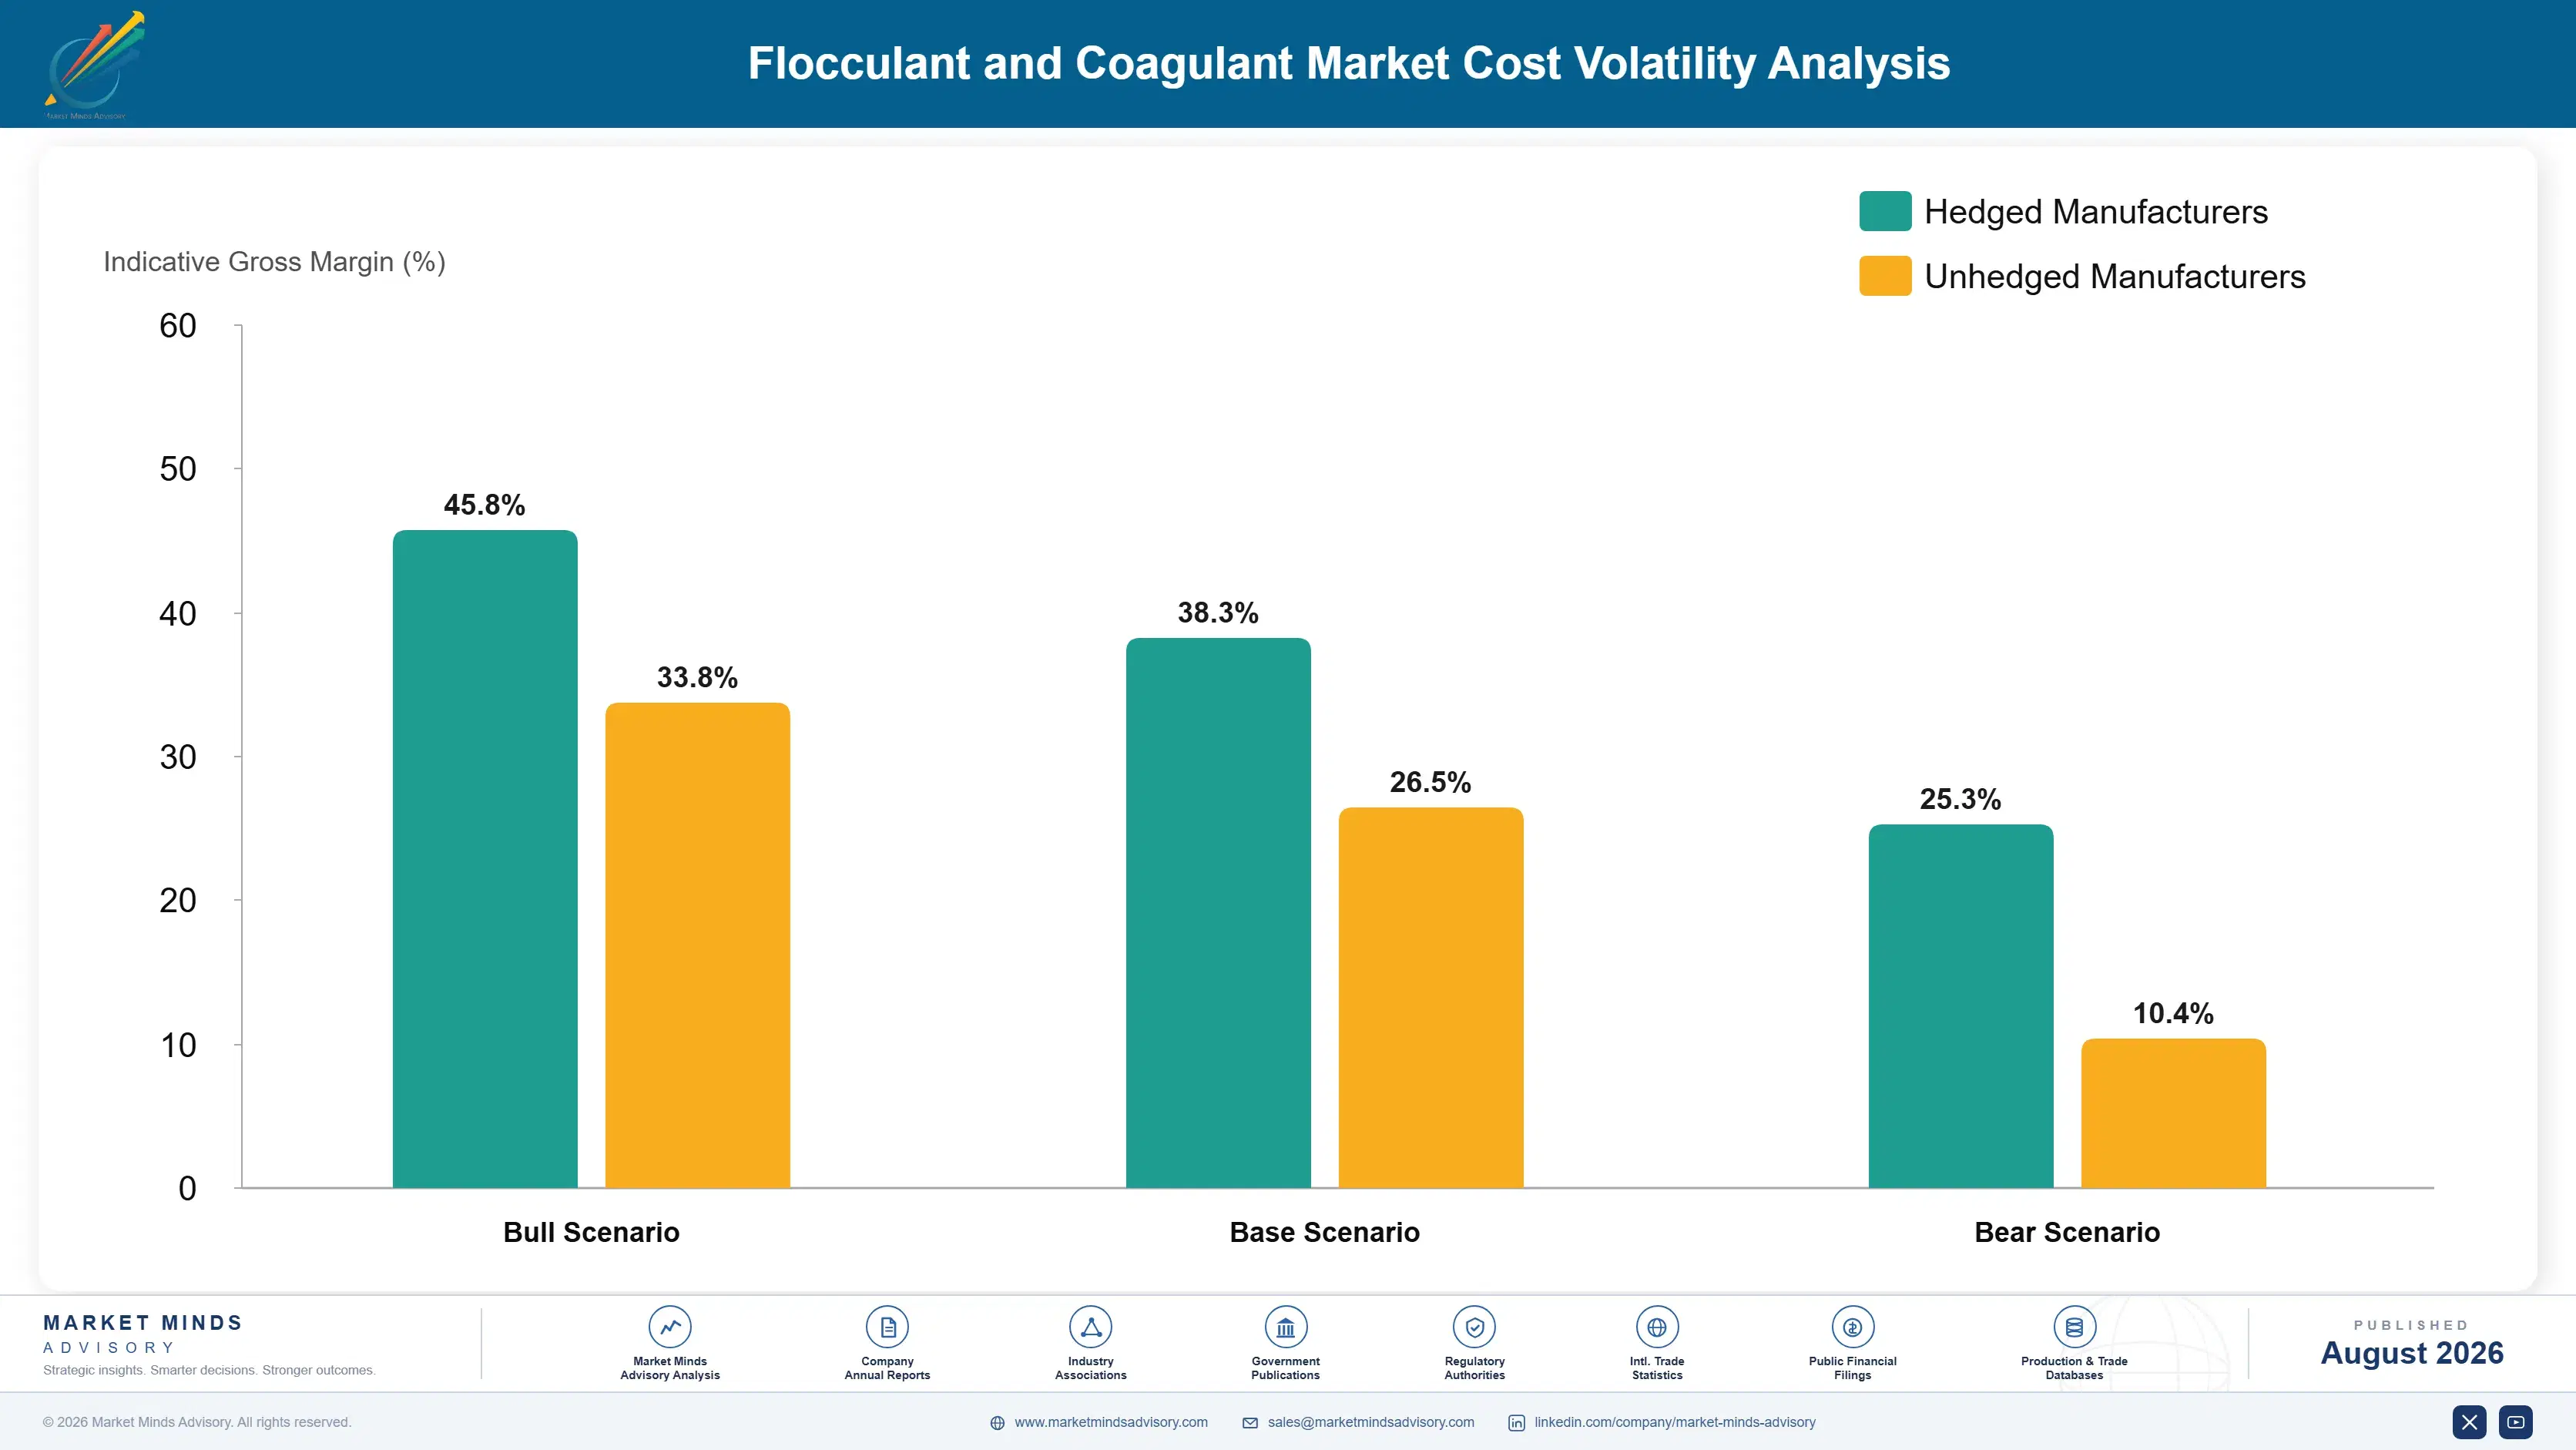
Acrylonitrile and the acrylamide monomer derived from it account for roughly 54% of polyacrylamide production cost, produced at a small number of large plants concentrated on the United States Gulf Coast and across East Asia. For inorganic coagulants the cost structure is entirely different: bauxite, aluminium hydroxide, hydrochloric acid and sulphuric acid together make up around 47%, with freight adding a further 21% because these are dilute aqueous products.
Feedstock supply proved fragile in early 2021. Winter Storm Uri froze United States Gulf Coast petrochemical capacity in February, taking propylene and acrylonitrile production offline across multiple sites at once, and polyacrylamide availability tightened for months. European energy prices through 2022 then raised production costs sharply. Kemira Annual Report 2022 and BASF Annual Report 2022 both recorded elevated raw material and energy costs across their water treatment operations.

The competitive disadvantage mechanism runs through monomer integration rather than purchasing skill. Non-integrated polymer producers buy acrylamide from competitors who also sell finished flocculants, which caps their cost position permanently and exposes them first during allocation. Integrated producers absorb monomer disruption comfortably. For inorganic coagulants the equivalent exposure is freight radius, since a producer outside economic haulage distance cannot compete on any terms.
flocculant-and-coagulant-market-cost-volatility-analysis-1787310287775

Secure multi-source acrylamide monomer supply agreements

Non-integrated producers buying monomer from their own integrated competitors are exposed on both price and allocation, and no amount of purchasing skill changes either exposure during a genuine shortage. Agreements with several monomer producers across separate regions spread that exposure and they secure volume when integrated suppliers quite reasonably serve their own downstream operations first.

Design products delivering performance at lower active loading

A polymer achieving the same separation at reduced active content consumes less monomer per unit of treatment sold, which functions as a permanent hedge rather than a temporary one. The formulation work is genuinely demanding and the commercial argument is straightforward, since customers buy the result rather than the active content they never measure.

Site coagulant production inside customer freight radius

Dilute aqueous coagulants carry freight at roughly a fifth of delivered cost, which makes distance an absolute barrier rather than a disadvantage that scale can overcome. Regional plants sited close to clusters of municipal demand capture business that no distant producer can contest, whatever its own manufacturing cost position happens to be on paper.

Portfolio Architecture for Margin Defence

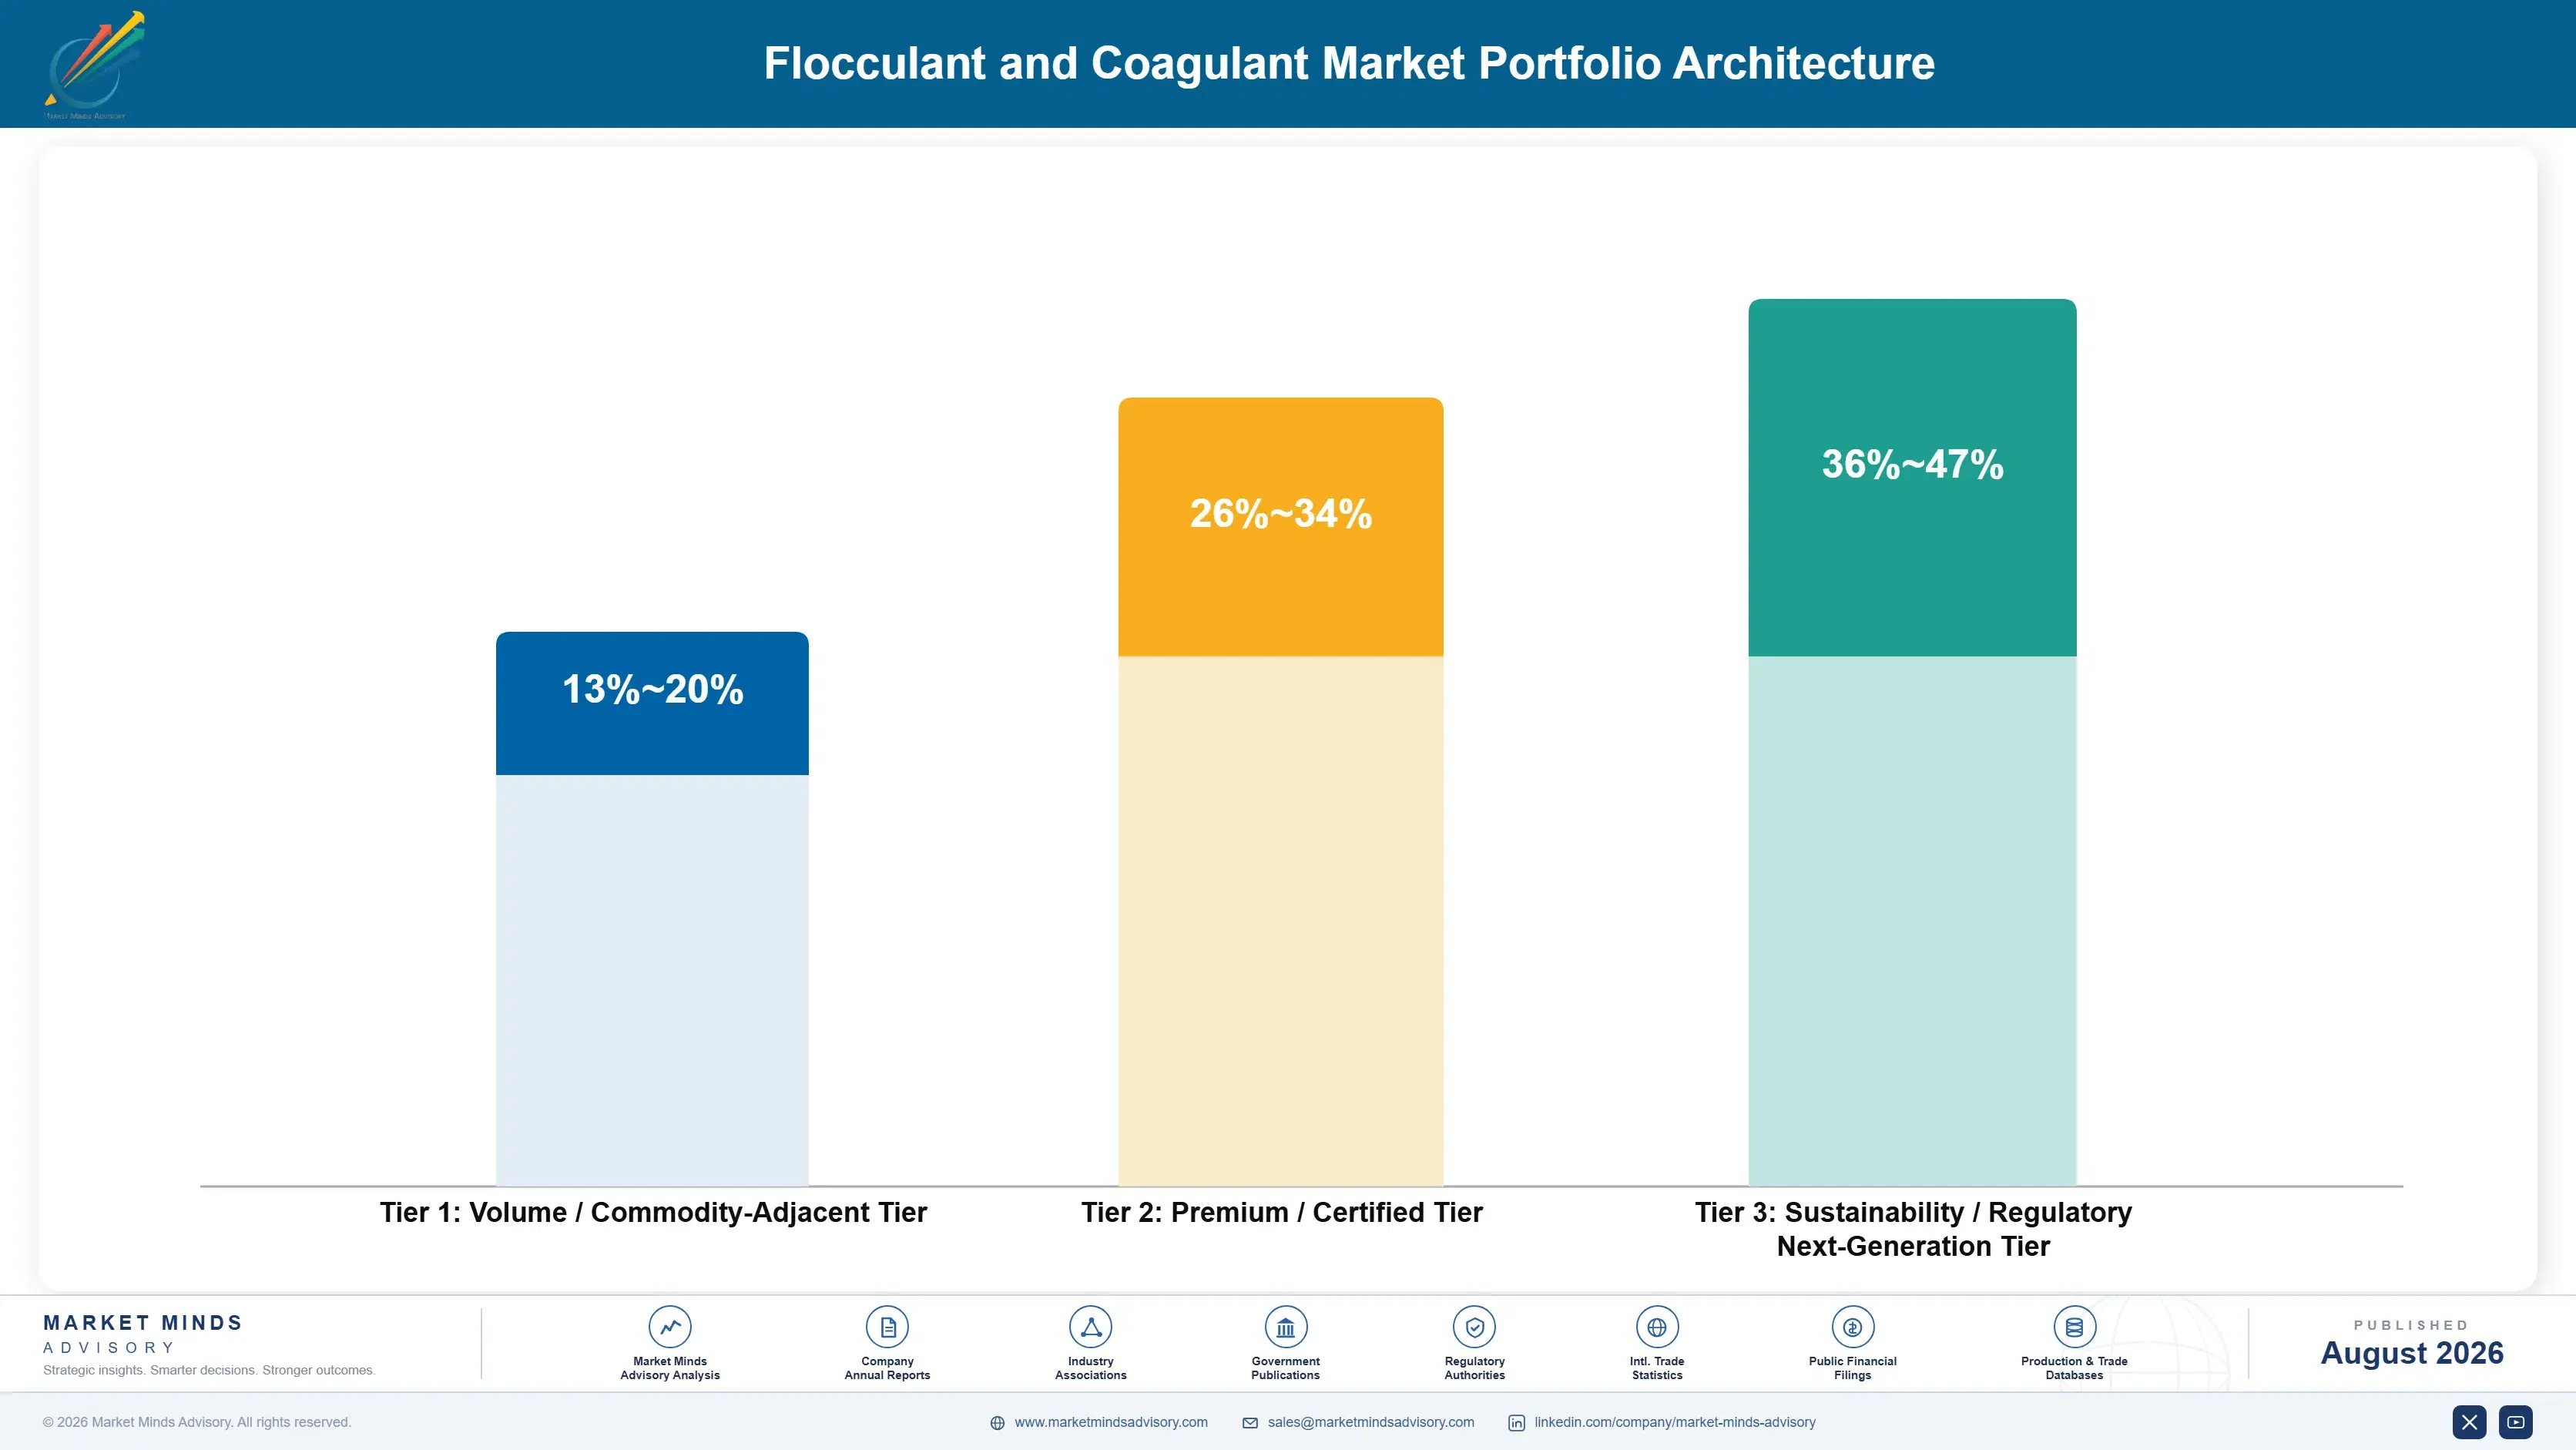
Margin architecture separates by whether the buyer is purchasing a chemical or a treatment outcome. Commodity coagulants and standard polymers sold against specification earn what freight position and monomer integration allow, which is not much and gets less each tender round. Value rises with application service and with performance contracting rather than with tonnage, which is an uncomfortable adjustment for an industry that built its distribution around drums and bulk tankers.
The volume versus premium tension runs between municipal tendering and everything else. Municipal supply carries the tonnage that justifies plants and logistics networks, at prices that annual retendering compresses continuously. Mining tailings duties, high-basicity coagulants and performance contracts earn considerably better on smaller volumes. Suppliers chasing municipal tonnage fund a service organisation from margins that municipal procurement will not support, which is visible now across several mid-sized competitors.

High-value pools concentrate in three places. Mining tailings flocculants command price because selection is metallurgical work few suppliers can perform. Performance contracts earn on outcomes rather than tonnes and resist retendering. And high-basicity prehydrolysed coagulants carry premiums for the alkalinity consumption they save at plants that measure it.

Volume / Commodity-Adjacent Tier

Aluminium sulphate, ferric salts and standard anionic polymers supplied against specification through municipal tender and distribution, where freight position and monomer cost decide whether the tonnage earns anything at all.
Gross Margin: 13-20%

Premium / Certified Tier

High-basicity prehydrolysed coagulants and cationic polymers supplied with application service, jar testing and dose optimisation. Demonstrated performance defends pricing here. Demonstrated results defend it further. The eight-point range reflects supply-only against fully serviced arrangements.
Gross Margin: 26-34%

Sustainability / Regulatory / Next-Generation Tier

Mining tailings flocculants, performance-contracted municipal supply and bio-based polymer systems for discharge-sensitive duties. Technical scarcity and outcome contracting defend pricing strongly. The eleven-point range reflects tailings work against performance contract economics.
Gross Margin: 36-47%
flocculant-and-coagulant-market-portfolio-architecture-1787310288273

High-value Sub-segments and Strategic Watch-out

Mining tailings and thickening flocculants

High value and high growth together, because roughly 240 major operations have now committed to thickened or filtered tailings and polymer selection has to match ore mineralogy and slurry chemistry precisely. The metallurgical capability required keeps the competitive set unusually narrow among water treatment suppliers generally.
Gross Margin: 36-47%

Performance-contracted municipal supply

Strong realised value on genuinely rapid growth, because contracting against achieved cake solids or treated water volume removes the conflict between honest technical advice and shipped tonnage entirely. These arrangements also resist annual retendering far better than any conventional chemical supply agreement has ever managed.
Gross Margin: 30-40%

Commodity coagulant municipal tonnage

The volume core here, justifying regional plants and bulk logistics networks while earning whatever freight position permits once annual tendering has finished compressing the price. Necessary for network and plant utilisation, but this tier will never fund application service capability out of its own margin.
Gross Margin: 13-20%

Bio-based and natural polymer flocculants

The strategic watch-out, because discharge-sensitive duties and residual monomer scrutiny in treated water across several jurisdictions could shift specification quite quickly, and performance against synthetic polymers remains genuinely inconsistent from one sludge type to the next. Development positions taken now will look either prescient or entirely wasted.
Gross Margin: 24-38%

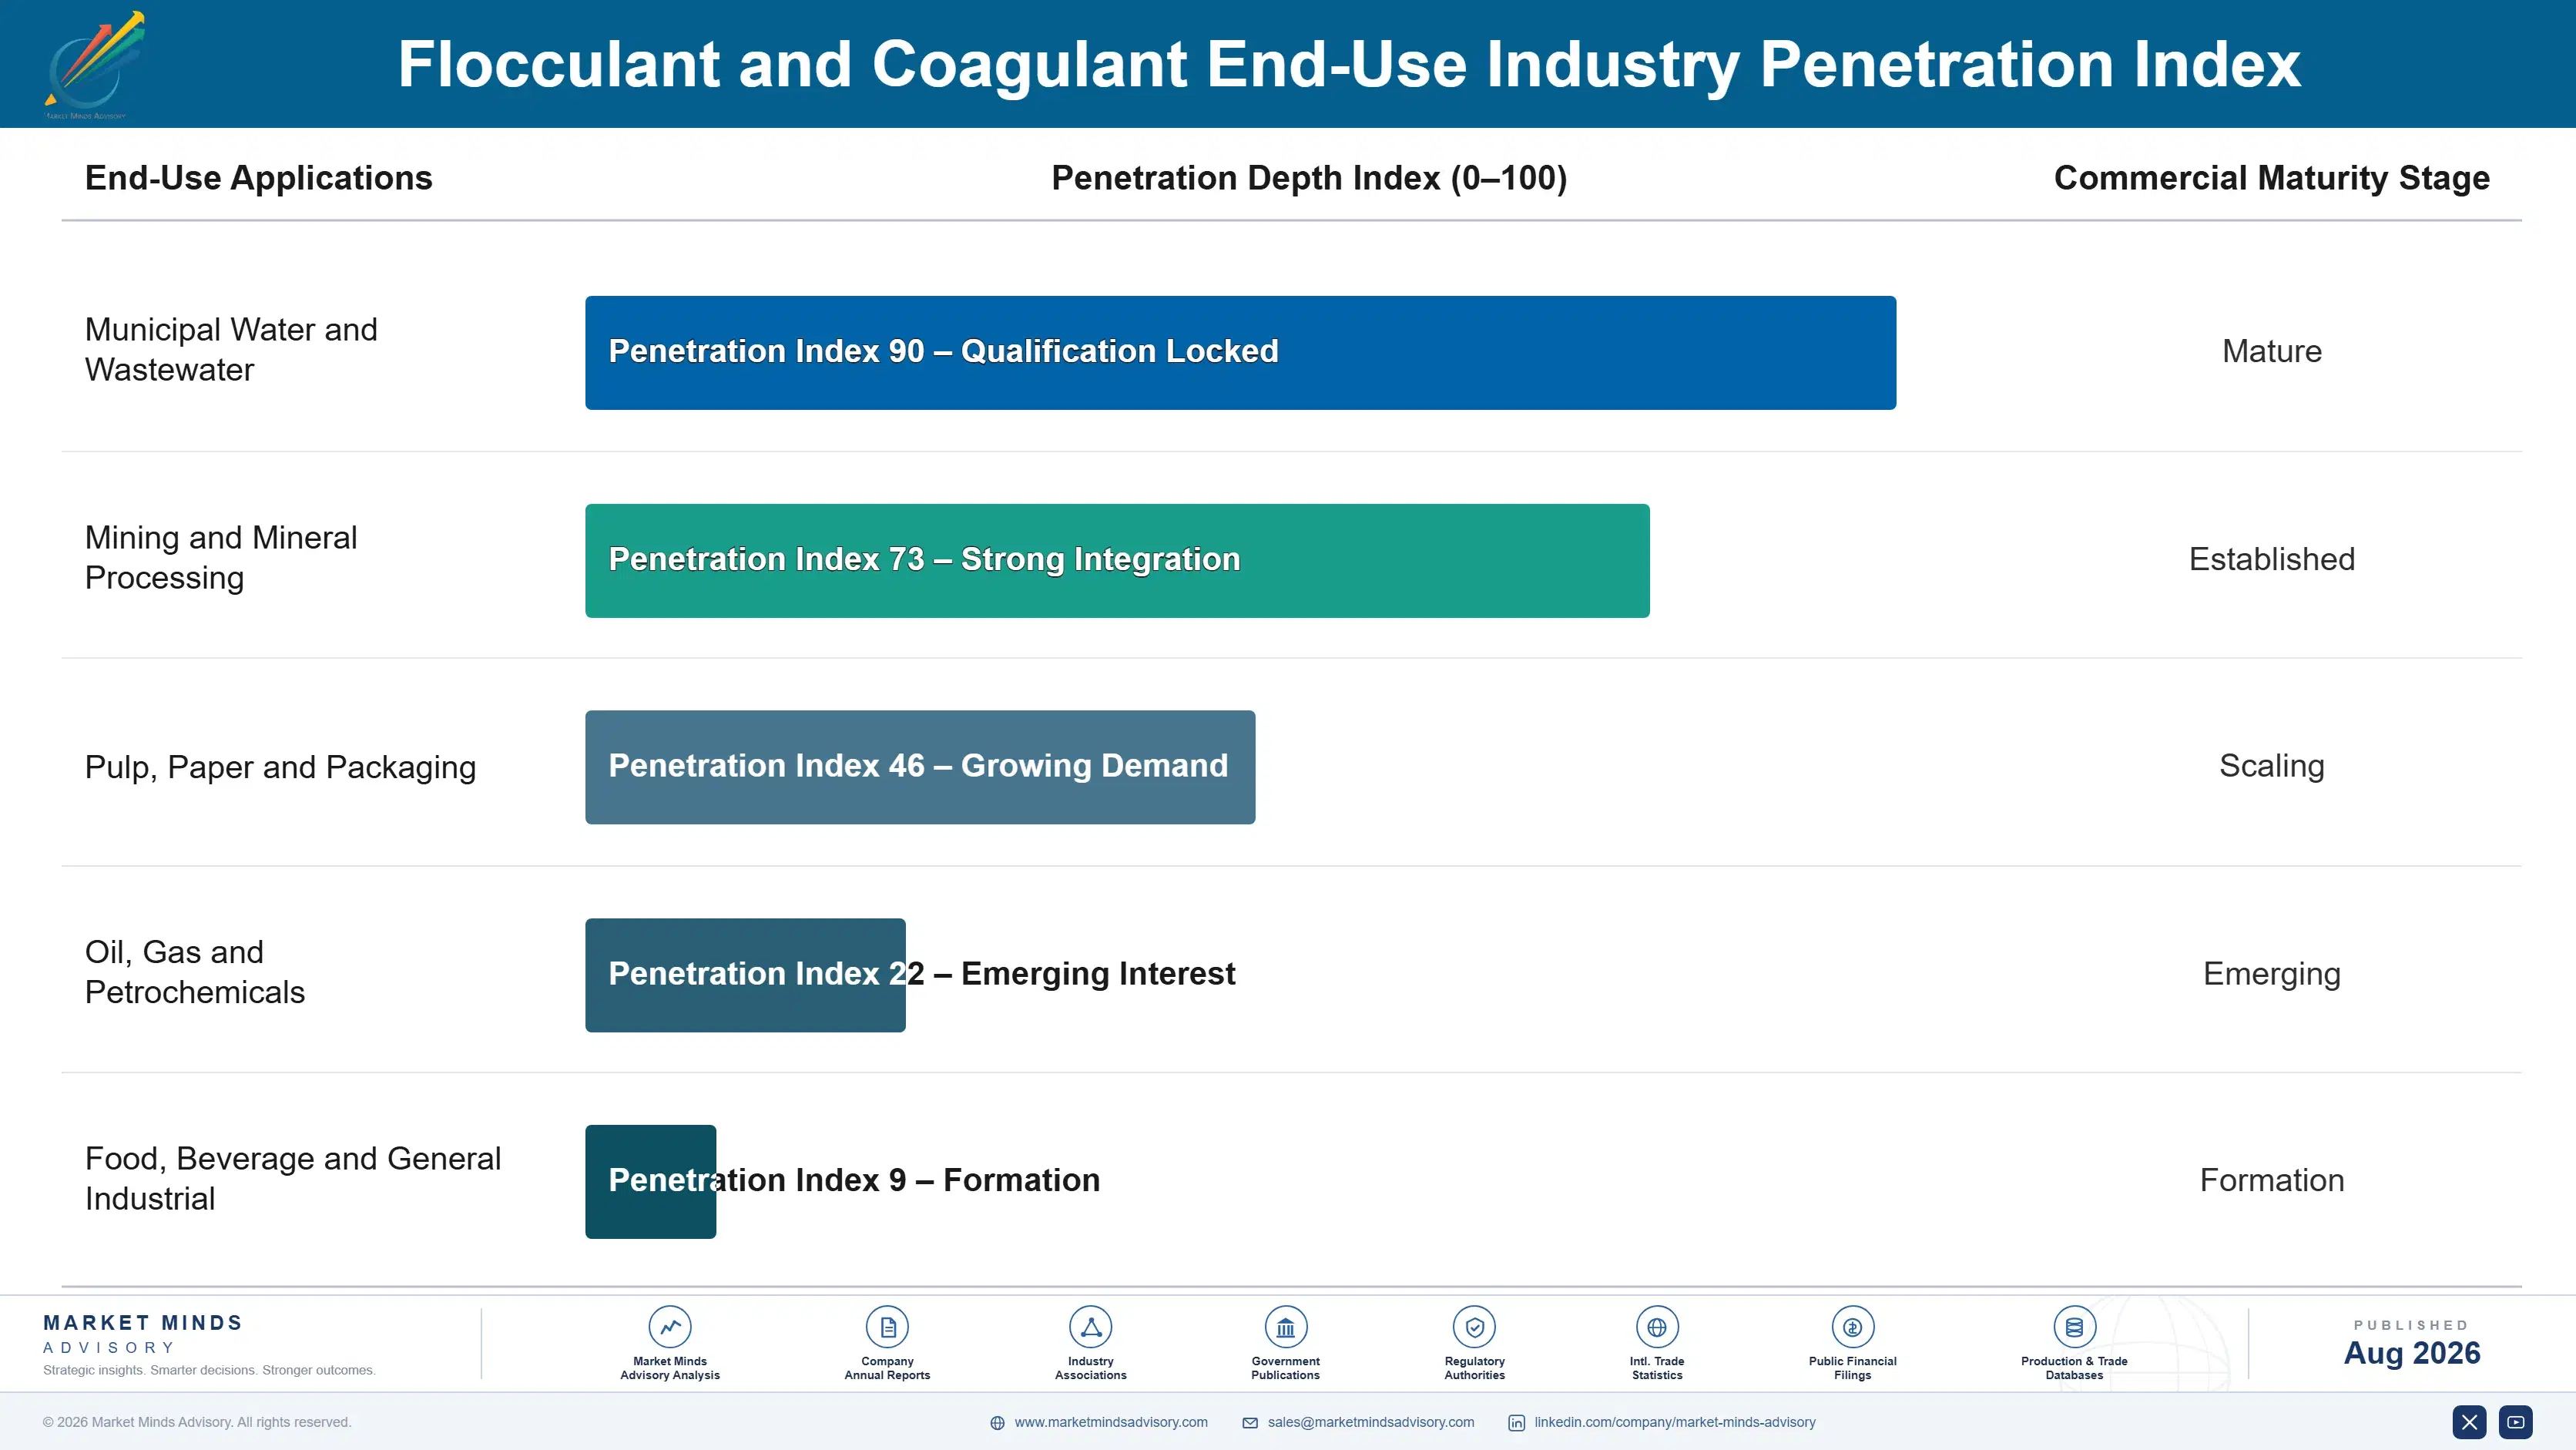
How Treatment Demand Behaves

Demand here is asset-locked annuity revenue in a very literal sense. A treatment plant consumes chemical every day it operates, across the thirty or forty years it exists, at volumes set by throughput and influent quality rather than by purchasing decisions. Winning a plant means winning that consumption until somebody retenders it. Revenue tracks installed treatment capacity, which is planned and published years ahead, making this among the most forecastable chemical markets anywhere.
Stickiness varies sharply by how the relationship is structured. Municipal commodity supply is loosest, retendered annually against specification where any qualified producer can bid and switching costs little more than a schedule change. Serviced polymer supply is tighter, because the supplier's technical people know both the plant and its sludge. Performance contracts and mining tailings work are stickiest of all, where knowledge of a particular ore is difficult to transfer.

The buyer profile is slowly moving away from pure procurement. A decade ago municipal chemical purchasing sat with buyers comparing price per tonne against a specification. Rising disposal costs have pulled operations and finance into that conversation at a growing number of utilities, which favours suppliers able to quantify total cost rather than quote a price.
flocculant-and-coagulant-market-end-use-penetration-index-1787310288761

Where We Land On This

These are among the four positions where our research anticipates prominent divergence between winners and laggards over the coming forecast period. Each is grounded in the demand model, the regulatory perimeter, and the announced capacity pipeline.
01 / DISPOSAL COST SELLING

Sell the sludge saving, not the chemical price

Sludge disposal runs near USD 95 per wet tonne across mature markets, and optimised polymer selection cuts dewatered cake volume by roughly 35%, which saves a mid-sized utility more each year than its entire annual chemical budget costs it. Suppliers demonstrating cake solids improvement on site and contracting against it realise roughly 28% above tendered commodity pricing. The obstacle here is organisational rather than commercial, since procurement holds the supplier relationship while the disposal saving lands entirely in somebody else's operations budget.
02 / OUTCOME CONTRACT STRUCTURE

Contract on treated volume rather than tonnes shipped

Proper dose control cuts consumption by 20% or more at sites that were overdosing, which places a supplier's best technical argument in direct conflict with its own shipped tonnage. Contracting on treated water volume or achieved cake solids removes that conflict and typically lifts realised revenue per site by roughly 15% while reducing what the customer spends overall. Performance contracts also resist annual retendering in a way that straightforward chemical supply agreements never have, because the customer must unpick an outcome rather than swap a product.
03 / MINING APPLICATION CAPABILITY

Build metallurgical capability for tailings flocculant work

Roughly 240 major operations have committed to thickened or filtered tailings after the Mariana and Brumadinho failures, and consumption per tonne of ore under those systems runs far above what conventional wet impoundment ever required. Polymer selection must match ore mineralogy and slurry chemistry precisely, which commands roughly 40% above municipal pricing and requires metallurgical rather than chemical expertise. Most water treatment suppliers simply do not employ anybody who understands mineral processing at that level, which is why so few of them compete.
04 / MONOMER EXPOSURE MANAGEMENT

Index municipal contracts against published monomer benchmarks

Acrylonitrile represents 54% of polyacrylamide production cost and reprices monthly, while municipal supply contracts routinely run a full year at fixed prices that leave producers carrying the entire exposure themselves. Indexation against published monomer benchmarks protects roughly 18% of realised margin through a spike of the kind that 2021 delivered without any warning at all. Municipal buyers refuse indexation at tender and accept it at renewal, so raising it while a recent spike is still fresh matters considerably more than negotiating hard.

Engagement Snapshot From the Field

A live engagement with an industry participant carrying material or product regulatory and market exposure ahead of a defining policy shift, showing how our research translates into a defensible multi-year portfolio strategy.
MARKET MINDS ADVISORY · CLIENT ENGAGEMENT SUMMARY
Flocculant and Coagulant Producer Strategic Portfolio Review and Transition Roadmap 2026·Investment Scenario on Flocculant and Coagulant Exposure Evaluation 2025-26
CLIENT PROFILE
A water treatment chemical producer operating polymer and coagulant manufacturing across Europe and Latin America, supplying municipal utilities, pulp and paper mills and food processing customers through direct sales and distribution. Treatment chemical revenue approached EUR 240 million annually (client-reported, unverified by MMA), roughly two thirds of it in municipal supply won through annual competitive tender.
STRATEGIC CHALLENGE
Municipal margins had declined for four consecutive years and the response had been repeated cost reduction at manufacturing sites, which changed nothing. Mining opportunities in Latin America were being lost without explanation despite the client operating plants nearby. A proposed coagulant capacity expansion assumed municipal tonnage growth would continue absorbing output.
MMA APPROACH
MMA interviewed forty-seven utility operations managers, procurement leads, mine metallurgists and distributors across six markets, reconstructing how chemical selections are actually decided. We modelled total treatment cost including sludge disposal at fourteen representative plants, benchmarked the client's application service against competitors, and reviewed every lost mining tender from the previous three years in detail.
KEY FINDINGS
  1. Total cost modelling at fourteen plants showed the client's premium polymer saving more in disposal haulage than its entire price premium, and nobody had ever presented that calculation to a single customer.
  2. All six lost mining tenders had been decided on metallurgical test work and slurry characterisation, capability the client did not employ anyone to perform anywhere in its organisation.
  3. Only two of nine major municipal contracts carried monomer indexation, against a market norm considerably higher, which accounted for most of the four-year margin decline being investigated.
  4. Serviced accounts delivered markedly better gross margin than tender-only supply on comparable tonnage (client-reported, unverified by MMA), yet represented under a quarter of municipal volume.
CLIENT PROFILE
A water treatment chemical producer operating polymer and coagulant manufacturing across Europe and Latin America, supplying municipal utilities, pulp and paper mills and food processing customers through direct sales and distribution. Treatment chemical revenue approached EUR 240 million annually (client-reported, unverified by MMA), roughly two thirds of it in municipal supply won through annual competitive tender.
STRATEGIC CHALLENGE
Municipal margins had declined for four consecutive years and the response had been repeated cost reduction at manufacturing sites, which changed nothing. Mining opportunities in Latin America were being lost without explanation despite the client operating plants nearby. A proposed coagulant capacity expansion assumed municipal tonnage growth would continue absorbing output.
MMA APPROACH
MMA interviewed forty-seven utility operations managers, procurement leads, mine metallurgists and distributors across six markets, reconstructing how chemical selections are actually decided. We modelled total treatment cost including sludge disposal at fourteen representative plants, benchmarked the client's application service against competitors, and reviewed every lost mining tender from the previous three years in detail.
KEY FINDINGS
  1. Total cost modelling at fourteen plants showed the client's premium polymer saving more in disposal haulage than its entire price premium, and nobody had ever presented that calculation to a single customer.
  2. All six lost mining tenders had been decided on metallurgical test work and slurry characterisation, capability the client did not employ anyone to perform anywhere in its organisation.
  3. Only two of nine major municipal contracts carried monomer indexation, against a market norm considerably higher, which accounted for most of the four-year margin decline being investigated.
  4. Serviced accounts delivered markedly better gross margin than tender-only supply on comparable tonnage (client-reported, unverified by MMA), yet represented under a quarter of municipal volume.
RECOMMENDED STRATEGY
Phase 1: Phase 1 (0 to 9 months): Halt the coagulant expansion and build total treatment cost modelling capability, quantifying disposal savings for every serviced account. Phase 2: Phase 2 (9 to 24 months): Recruit metallurgical application capability for mining tailings work and introduce indexation at every municipal renewal. Phase 3: Phase 3 (24 to 42 months): Migrate serviced municipal accounts toward performance contracting priced on achieved cake solids rather than tonnes.
OUTCOME
The client deferred roughly EUR 45 million of coagulant capacity investment (client-reported, unverified by MMA) and redirected part of it into application service and metallurgical capability. Indexation now covers six of nine major municipal contracts, the first mining tailings contract was won in Chile within twenty months, and municipal margin stabilised for the first time since 2021.

Frequently Asked Questions

Foundational context covering the market sizes, CAGR, scope, country, region and competition that inform every finding below. This section is provided to cover basics and most often pre-purchase conversations, answered from the MMA Primary Research Dataset.

What is the current size of the Flocculant and Coagulant Market?

The market reached USD 13.2 billion in 2025, measured as treatment chemical revenue at realised delivered price. Municipal water and wastewater absorbs 46% of total chemical consumption.

How large will the Flocculant and Coagulant Market be by 2036?

MMA forecasts USD 25.59 billion by 2036, an expansion of 1.83 times the 2026 level. Incremental value across the forecast period reaches USD 11.57 billion.

What is the CAGR for the Flocculant and Coagulant Market 2026 to 2036?

The base case compound annual growth rate is 6.2%, with a bull case of 7.4% and a bear case of 5.0%. Mining tailings investment and municipal dose optimisation separate those scenarios.

Which segment is growing fastest?

Cationic polyacrylamide flocculants grow fastest at 9.3%, exactly 1.50 times the overall market rate. Sludge conditioning and dewatering duty is what drives that demand specifically.

Who are the major companies in the Flocculant and Coagulant Market?

SNF Group, Kemira, Solenis, Ecolab and BASF lead, holding 34% of chemical tonnage between them. Monomer integration and regional manufacturing footprint explain most competitive standing.

Which country is growing fastest?

India grows fastest at 8.8%, driven by municipal treatment capacity expansion under national programmes and by zero liquid discharge requirements across several industrial states. Domestic polymer production has grown alongside.

Report Segmentation Architecture

The full report scope spans multiple orthogonal segmentation dimensions, with cross-tabulated demand data provided for each dimension pair. Coverage extends further to regional breakdowns, trend trajectories, and the competitive detail needed to support segment-level decision-making.

By Chemistry Class

  • Cationic Polyacrylamide Flocculants
  • Polyaluminium Chloride and Prehydrolysed Coagulants
  • Bio-based and Natural Polymer Flocculants
  • Anionic and Nonionic Polyacrylamides
  • Aluminium and Iron Salt Coagulants

By End-Use Industry

  • Municipal Water and Wastewater
  • Mining and Mineral Processing
  • Pulp, Paper and Packaging
  • Oil, Gas and Petrochemicals
  • Food, Beverage and General Industrial

By Customer Type and Channel

  • Municipal Utilities and Authorities
  • Industrial Direct Accounts
  • Water Treatment Service Contractors
  • Chemical Distributors and Blenders
  • Engineering and Plant Operators

By Region

  • North America
  • Western Europe
  • East Asia
  • South Asia and Pacific
  • Latin America
  • Middle East and Africa
  • Eastern Europe

Scope, Methodology, and Coverage

Every figure in this report is reproducible from documented input assumptions. The scope below maps the historical period, the forecast horizon, the segmentation dimensions, and the countries covered, alongside the underlying primary and qualitative methodology.
Historical Period
2020 to 2025
Forecast Period
2026 to 2036
Base Year
2025 (USD billions; MMA Primary Research Dataset, August 2026)
Market Definition
The market comprises coagulation and flocculation chemicals supplied for solid-liquid separation in water and effluent treatment, spanning cationic polyacrylamide flocculants, polyaluminium chloride and prehydrolysed coagulants, bio-based and natural polymer flocculants, anionic and nonionic polyacrylamides, and aluminium and iron salt coagulants. Sizing captures chemical revenue at realised delivered price across municipal water and wastewater, mining and mineral processing, pulp and paper, oil and gas, food processing and general industrial treatment, including chemicals supplied under service and performance contracts. Membrane systems, disinfection chemicals, scale and corrosion inhibitors, ion exchange resins, dosing equipment and treatment plant construction fall outside scope.
Quantitative Units
USD billions (current prices); treatment chemical tonnes supplied annually; USD per tonne at realised delivered price
Segmentation Dimensions
By Chemistry Class; By End-Use Industry; By Customer Type and Channel; By Region
Regions Covered
North America, Western Europe, East Asia, South Asia and Pacific, Latin America, Middle East and Africa, Eastern Europe
Countries Covered
USA, Canada, Mexico, UK, Germany, France, Italy, Spain, Netherlands, Sweden, Finland, Poland, Czech Republic, Romania, Turkey, China, Japan, South Korea, Taiwan, India, Vietnam, Indonesia, Philippines, Thailand, Australia, Brazil, Chile, Peru, Argentina, Saudi Arabia, UAE, Egypt, South Africa, and additional markets relevant to this sector
Key Companies Profiled
SNF Group, Kemira, Solenis, Ecolab, BASF, Feralco, Chemtrade Logistics, USALCO, Buckman, Kurita Water Industries, Organo Corporation, Ixom, Aditya Birla Chemicals, Thermax, Sumitomo Seika Chemicals, ChemTreat, Veolia Water Technologies, Nouryon, Arkema, Sanyo Chemical Industries.
Quantitative Methodology
Primary survey, n=3,800 respondents, Q4 2025, six countries; demand-side model with trade association cross-validation
Qualitative Methodology
47 expert interviews, Q4 2025; applied to validate demand model assumptions, identify emerging dynamics, and assess competitive positioning
Report Format
PDF and XLSX data workbook (Word format preview document)
Publisher
Market Minds Advisory
Report Code
MMA-2026-CHM-431
Published
August 2026
Contact
sales@marketmindsadvisory.com | www.marketmindsadvisory.com

Purchase the full Flocculant and Coagulant Market Report (2026 to 2036).

The full report sizes the flocculant and coagulant market across five chemistry classes, five end-use industries, five customer channels and seven regions, with annual forecasts to 2036 in revenue and chemical tonnes supplied. It models total treatment cost including sludge disposal for representative plant configurations, which is the analysis establishing what better separation chemistry is genuinely worth to an operator. Twenty participants are assessed on a consistent chemical tonnage supplied basis, with application service capability mapped separately from manufacturing footprint. Municipal treatment construction pipelines and mining tailings conversions are tracked project by project.
Five chemistry classes sized and forecast annually
Total treatment cost modelled including sludge disposal
Twenty participants on consistent chemical tonnage supplied basis
Application service capability mapped separately from manufacturing footprint
Municipal treatment construction pipelines tracked project by project
Mining tailings conversions monitored across every producing region

Built For The People Who Decide

From boardroom strategy to bench-side execution, this report is read cover-to-cover by leaders shaping the next decade of their industry, turning demand scenarios, market dynamics and valuation benchmarks into decisions.
CXOs/ Presidents/ VPs/ Managers
M&A and Corporate Development
Strategy Teams and R&D Heads
Procurement and Product Directors
Regulatory and Compliance Leaders
Investor Relations and Equity Analysts