Market Minds Advisory
Water Treatment Chemicals Market

Water Treatment Chemicals Market: Water Treatment Chemicals Market. Specialty Chemistries Reshape Municipal and Industrial Treatment Economics

Utilities and industrial operators are being pushed toward specialty membrane and biocide chemistries as discharge regulations tighten, even as commodity coagulant pricing pressure squeezes formulators competing on cost rather than performance differentiation.

Lead Analyst

Published

August 2026

Make Smarter Decisions with Customized Research Insights

Request a free sample report and evaluate market opportunities, growth trends, and competitive dynamics relevant to your business needs.

2025 MARKET VALUE$38.5BMarket Size 2025
2036 FORECAST VALUE$63.1BBase Case , 2026 to 2036
CAGR 2026 TO 20364.6 %Bull 5.8% / Bear 3.4%
INCREMENTAL OPPORTUNITY$22.9BNet 10- year value creation
EXPANSION MULTIPLE1.57x2036 value over 2026 base
Strategic Levers
M&A Pipeline
Regional Outlook
Country Rankings
Competitive Intelligence
Segmental Deep-dive
Call-Us : 91 93563 13602

Executive Snapshot and Market Trajectory.

Municipal utilities and industrial water users are shifting procurement toward higher-performance biocide and membrane chemistries as discharge permits tighten, even as budget-constrained operators in smaller markets continue prioritizing lowest-cost coagulant treatment this cycle, particularly across desalination and industrial reuse installations.
Industrial wastewater reuse mandates and expanding desalination capacity across the Middle East and South Asia are pulling specialty membrane chemistries and advanced biocides into higher volume even as commodity coagulant demand grows more slowly across mature municipal networks. China and India together account for a growing share of incremental chemical volume, reflecting new capacity additions in power generation, semiconductor fabrication, and municipal wastewater treatment infrastructure across both countries this decade.
Competition remains fragmented across a long tail of regional formulators, though the five largest suppliers increasingly differentiate through proprietary membrane antiscalant chemistries and digital dosing platforms rather than price alone. Tightening discharge limits under national water quality frameworks and rising adoption of zero liquid discharge systems in heavy industry are reshaping which chemistries win specification, favoring producers who pair chemistry with monitoring and control services rather than bulk commodity supply alone across most contract renewals.
Market Definition
This report covers chemicals used to treat, condition, and manage water quality across municipal and industrial water and wastewater systems, including coagulants, flocculants, biocides, corrosion and scale inhibitors, pH adjusters, and specialty membrane chemistries. It excludes water treatment equipment, membrane hardware, filtration media, and digital monitoring software sold independently of chemical formulations.
Base Year Value
$38.5B in 2025 (MMA Primary Research Dataset, August 2026)
Forecast Period
2026 to 2036, eleven discrete annual values
CAGR
4.6% base case. Bull 5.8%. Bear 3.4%.
Fastest Growth Segment
Specialty Membrane Chemicals: 8.5% CAGR
Fastest Growth Country
India: 7.4% CAGR
Fastest Growth Region
South Asia and Pacific: 6.8% CAGR
Largest Region
East Asia: 29% of 2025 global value
Market Leaders
Ecolab Inc, Kemira Oyj, SNF Group, BASF SE, Solenis LLC. Source: MMA Analysis based on company annual reports.
Primary Survey
n=3,800 procurement and R&D decision-makers, Q4 2025, six countries
Methodology
Demand-side build-up, cross-validated against public data, 47 expert interviews

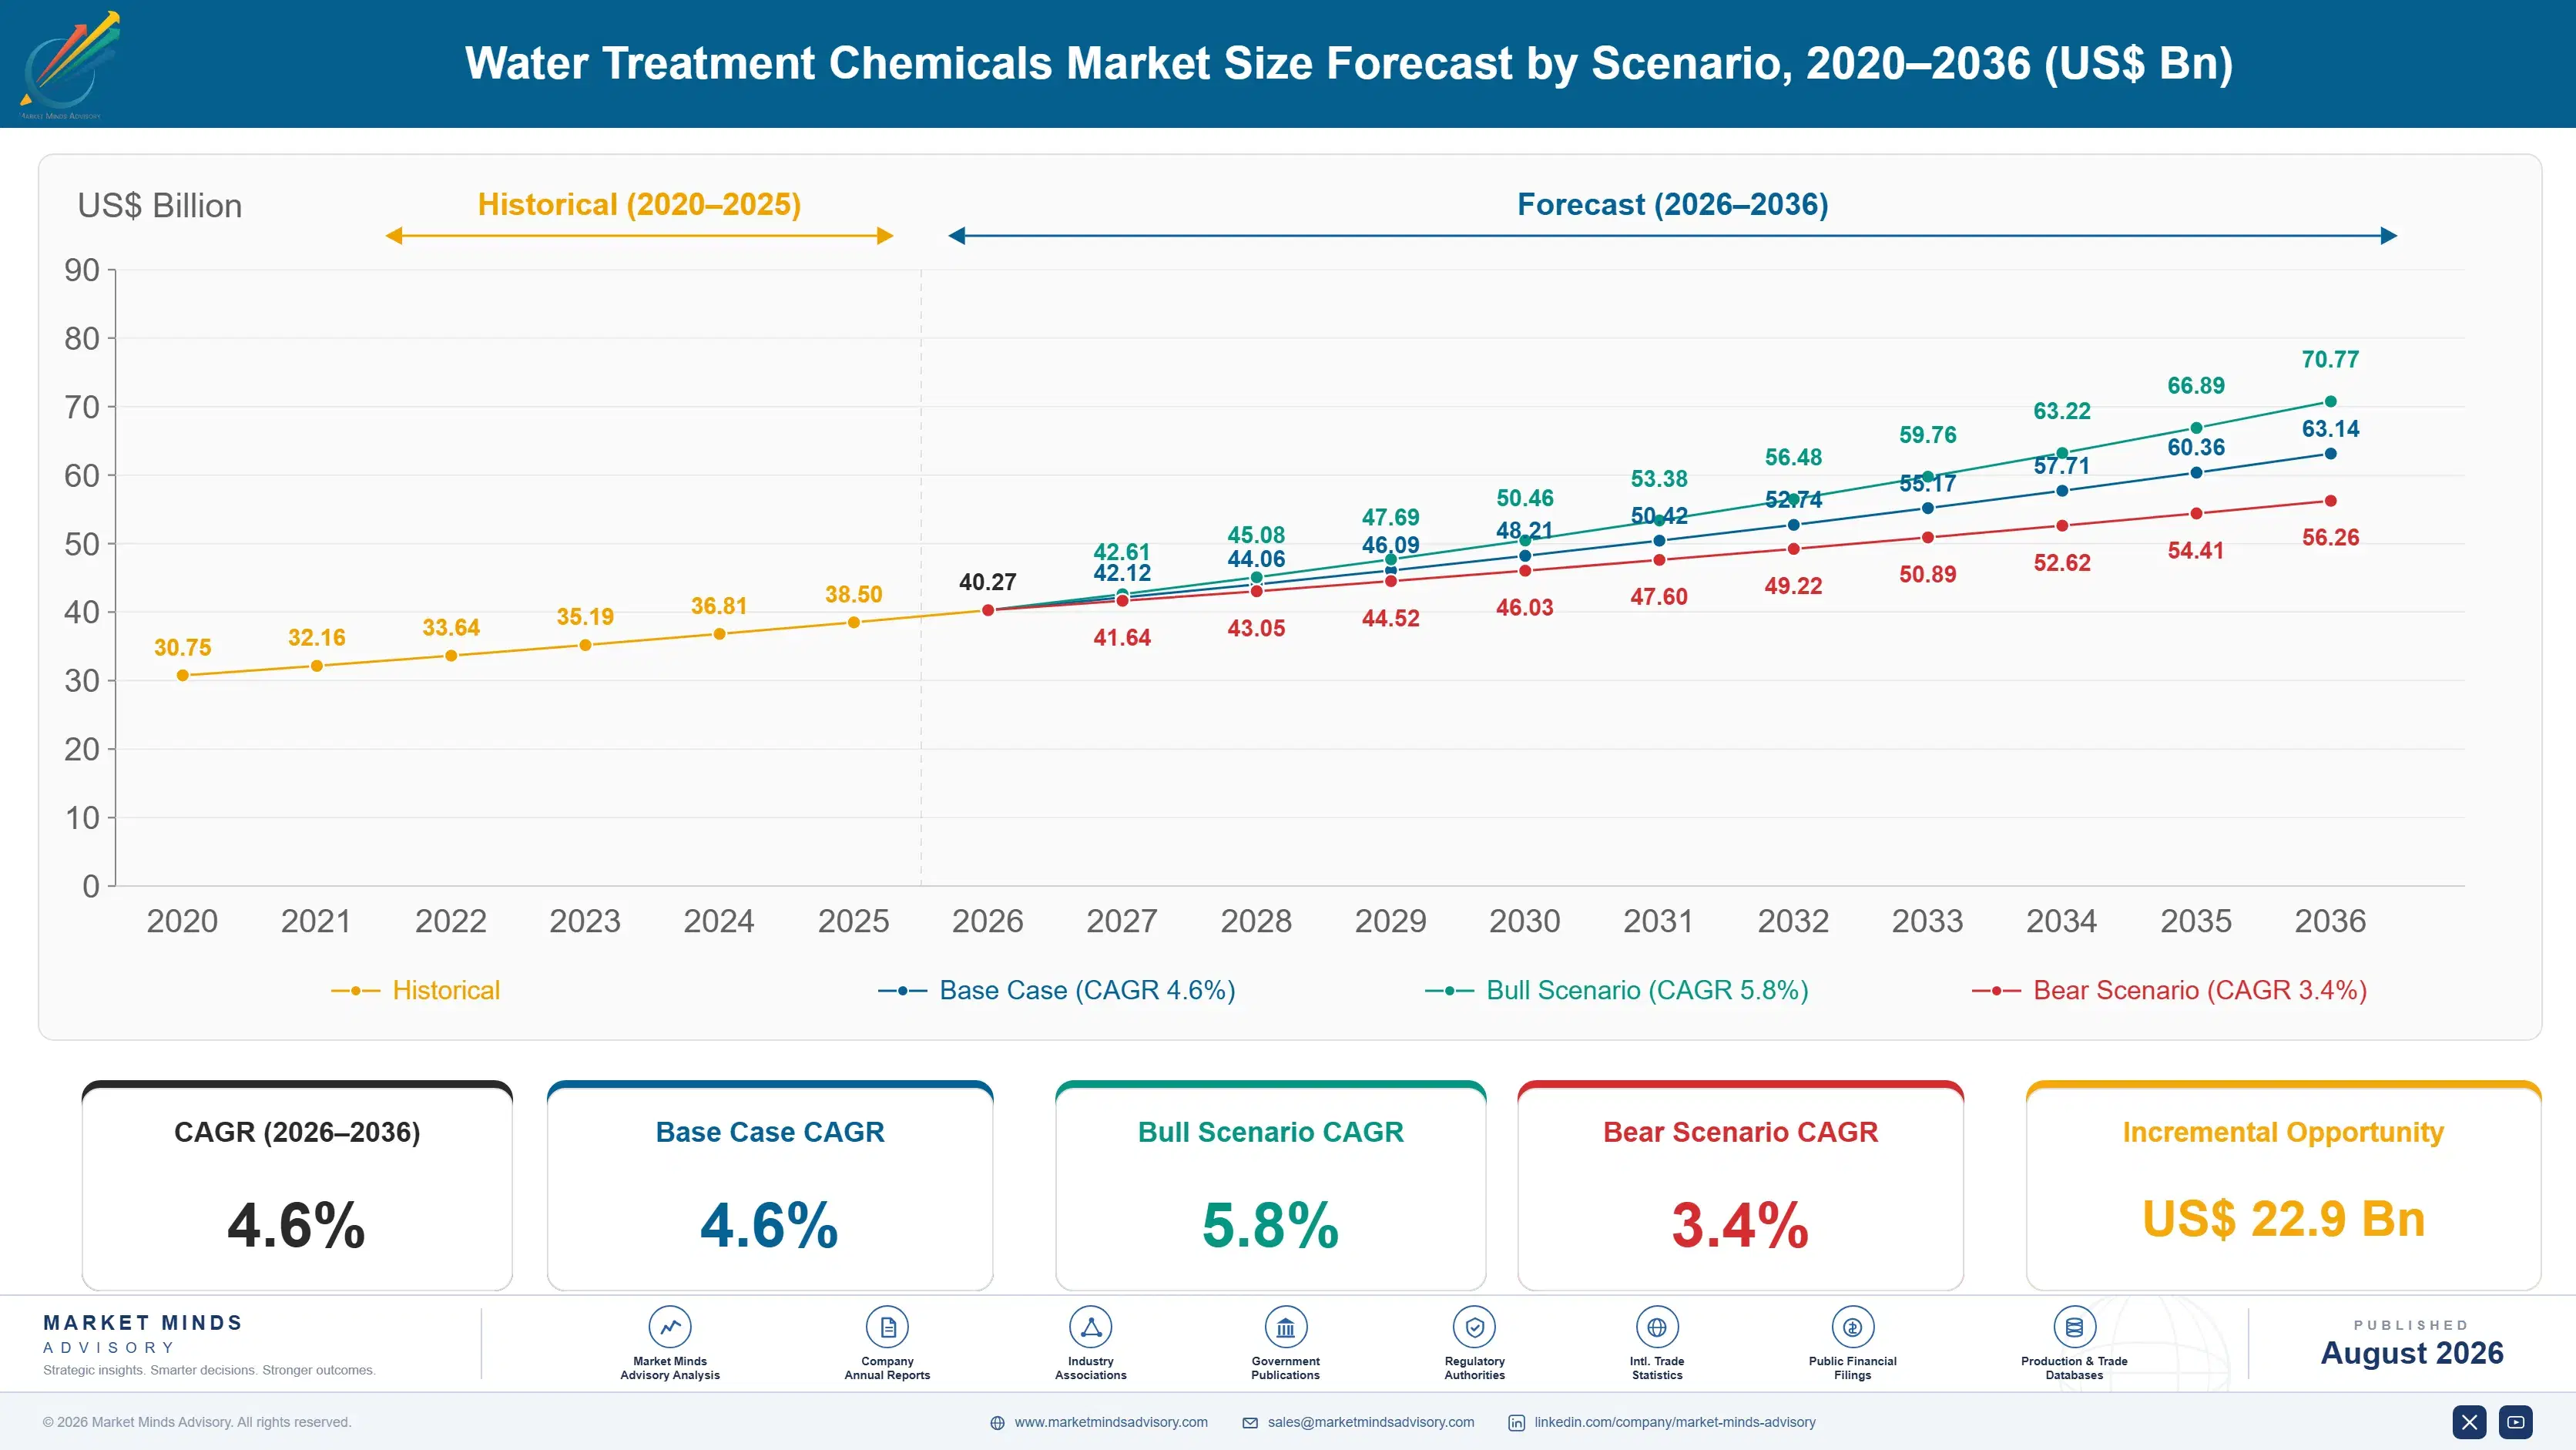
Water Treatment Chemicals Market Forecast Scenarios

water-treatment-chemicals-market-trends-size-forecast-scenario-1787664585361
Water treatment chemical demand grew steadily between 2020 and 2025, expanding at an estimated 4.0 percent historical CAGR as municipal utilities resumed deferred maintenance spending following pandemic-era disruptions and industrial operators expanded wastewater reuse capacity. Demand growth was uneven across regions, with East Asia and South Asia adding capacity considerably faster than mature municipal networks across Western Europe and North America during this period.
MMA's base case assumes 4.6 percent compound annual growth through 2036, anchored to three commercial mechanisms: continued desalination capacity expansion across the Middle East and South Asia, tightening discharge permit limits under national water quality frameworks that favor specialty biocide and antiscalant chemistries, and steady replacement demand from aging municipal infrastructure across North America and Western Europe. Industrial reuse mandates in semiconductor and power generation facilities provide an additional demand source, reinforcing volume growth even where budgets remain constrained.
A bull scenario of 5.8 percent growth assumes accelerated desalination buildout across Saudi Arabia and India alongside faster adoption of zero liquid discharge systems in heavy industry. A bear scenario of 3.4 percent reflects delayed municipal capital spending and prolonged commodity coagulant pricing pressure that erodes formulator margins and slows specialty chemistry conversion across cost-sensitive utility budgets.

Municipal Compliance Pressure Meets Industrial Reuse Economics

Water treatment chemical demand sits at the intersection of two converging forces: tightening regulatory discharge limits and expanding industrial reuse mandates that favor specialty chemistries over commodity coagulants. Utilities historically treated chemical dosing as a fungible commodity purchase, but rising compliance costs are pushing procurement teams toward suppliers who can demonstrate measurable performance improvements and reduce total treatment cost per cubic meter treated. This is forcing suppliers to rethink product development priorities across legacy and specialty lines.
MARKET CONCENTRATION (CR5)32%Top five suppliers hold roughly a third combined
AVERAGE SELLING PRICE$1.85/kg blendedBlended price varies widely by chemistry type and application
TOP PRODUCING COUNTRY SHAREChina, leading capacityChina hosts the largest manufacturing base globally by far
CAPACITY UTILISATION78% averageUtilisation varies by chemistry and regional demand cycle
FEEDSTOCK SHARE OF COGS45-55% rangePetrochemical feedstocks dominate variable cost structure broadly for most producers
TRADE INTENSITYModerate, regional supplyMost chemistries ship regionally due to transport cost
Commercial character varies sharply by end market. Municipal utilities operate on multi-year procurement cycles with limited appetite for premium pricing, while industrial operators facing zero liquid discharge mandates or high-value process water requirements will pay considerably more for chemistries that reduce membrane fouling or extend equipment service life. This bifurcation is reshaping supplier go-to-market strategy across both segments. Suppliers unable to demonstrate this differentiation risk losing share to larger multinationals.
Over the next decade, expect continued consolidation among mid-tier regional formulators unable to match the R&D intensity of the five largest global suppliers, alongside rising adoption of digital dosing and monitoring platforms that bundle chemistry with service contracts rather than bulk supply alone. Consolidation activity is likely to accelerate as this gap widens.
"The utilities buying cheapest-available coagulant today will be the ones paying emergency premiums for specialty biocide capacity in three years, once discharge enforcement catches up with what regulators have already written into permits."
Director, Industrial Water and Chemicals Practice · MMA Chemicals and Materials Practice · August 2026

Market Trends

Zero Liquid Discharge Mandates Expand Across Heavy Industry

Regulators across China, India, and the Middle East are increasingly mandating zero liquid discharge for power generation, textile, and chemical manufacturing facilities, requiring intensive pretreatment chemistry to concentrate and manage waste streams before final disposal. Compliance timelines vary, but facilities facing 2028 to 2030 deadlines are already qualifying antiscalant and biocide formulations capable of handling higher salinity concentrates than conventional treatment trains were designed for. This is pulling specialty chemistry qualification budgets forward by two to three years across affected industrial clusters, ahead of enforcement deadlines that regulators have signaled will not be extended further.
Market Impact: Adds 6% compliance-driven chemistry demand
Desalination Capacity Additions Lift Antiscalant Demand

Saudi Arabia, the United Arab Emirates, and India are each expanding seawater desalination capacity to secure municipal and industrial water supply, with combined announced capacity additions exceeding 15 million cubic meters per day through 2032. Every new reverse osmosis train requires antiscalant and biocide dosing calibrated to local seawater chemistry, creating durable specialty chemical demand that scales directly with installed membrane area rather than population growth alone. Chemical suppliers with regional formulation and technical service capability are winning multi-year antiscalant supply contracts ahead of global competitors lacking local presence across these fast-growing markets.
Market Impact: Adds 10% industrial reuse chemical volume

Market Opportunities and Growth Drivers

Tightening Discharge Permits Raise Compliance Chemistry Spend

National water quality frameworks across the European Union, the United States, and China have progressively lowered permitted discharge limits for nitrogen, phosphorus, and heavy metals over the past five years, forcing municipal utilities and industrial dischargers to adopt more effective coagulant and biocide formulations. Utilities facing the strictest limits are qualifying advanced polymer flocculants that achieve higher removal efficiency at lower dosing rates, reducing sludge disposal costs that had previously offset chemistry savings. Compliance-driven reformulation is expected to continue as remaining jurisdictions tighten limits toward the strictest existing national standards over the next several years.
Market Impact: Cuts 4% commodity segment gross margin

Industrial Water Reuse Mandates Expand Specialty Chemical Volume

Semiconductor fabrication, power generation, and food and beverage manufacturers are expanding water reuse programs to reduce freshwater withdrawal permits and lower long-term water costs, particularly across water-stressed regions in Asia and the Middle East. Reuse systems typically require more sophisticated membrane pretreatment and biocide dosing than single-pass treatment, since recycled water streams concentrate contaminants that would otherwise be diluted through discharge. Chemical suppliers who can demonstrate reliable performance across multiple reuse cycles are winning long-term supply agreements with manufacturers seeking to de-risk water availability for planned expansion projects across several regions.
Market Impact: Delays market entry by 12 months

Market Restraints and Challenges

Commodity Coagulant Pricing Pressure Squeezes Formulator Margins

Aluminum and iron-based coagulants remain price-sensitive commodities traded largely on feedstock cost, and budget-constrained municipal utilities in developing markets continue awarding contracts primarily on lowest delivered price rather than performance. This friction stems from limited utility capital budgets and rate-setting processes that discourage premium chemistry adoption even where it would reduce total treatment cost. The commercial impact falls hardest on formulators without specialty product lines to offset thin commodity margins. Leading suppliers are mitigating exposure by bundling commodity coagulant supply with higher-margin monitoring services and multi-year contracts that smooth pricing volatility across the relationship.
Market Impact: Adds 8% specialty chemistry volume growth

Fragmented Regional Regulation Complicates Multi-Country Product Registration

Water treatment chemical formulations often require country-specific regulatory registration and testing before sale, and requirements vary considerably across the more than thirty countries covered in this report, creating friction for suppliers seeking to standardize product lines globally. The root cause is the absence of harmonized international water treatment chemical standards comparable to those governing food-contact materials. Registration delays of twelve to eighteen months are common in new markets, deferring revenue recognition and raising working capital requirements. Larger suppliers are mitigating this by maintaining regional regulatory affairs teams and pursuing mutual recognition agreements where national regulators permit them.
Market Impact: Adds 15 million cubic meters daily
4 additional market trends, 3 additional growth drivers, and 3 additional restraints and challenges are covered in the full report. Contact sales@marketmindsadvisory.com to access the complete intelligence.

Segment CAGR and Growth Architecture

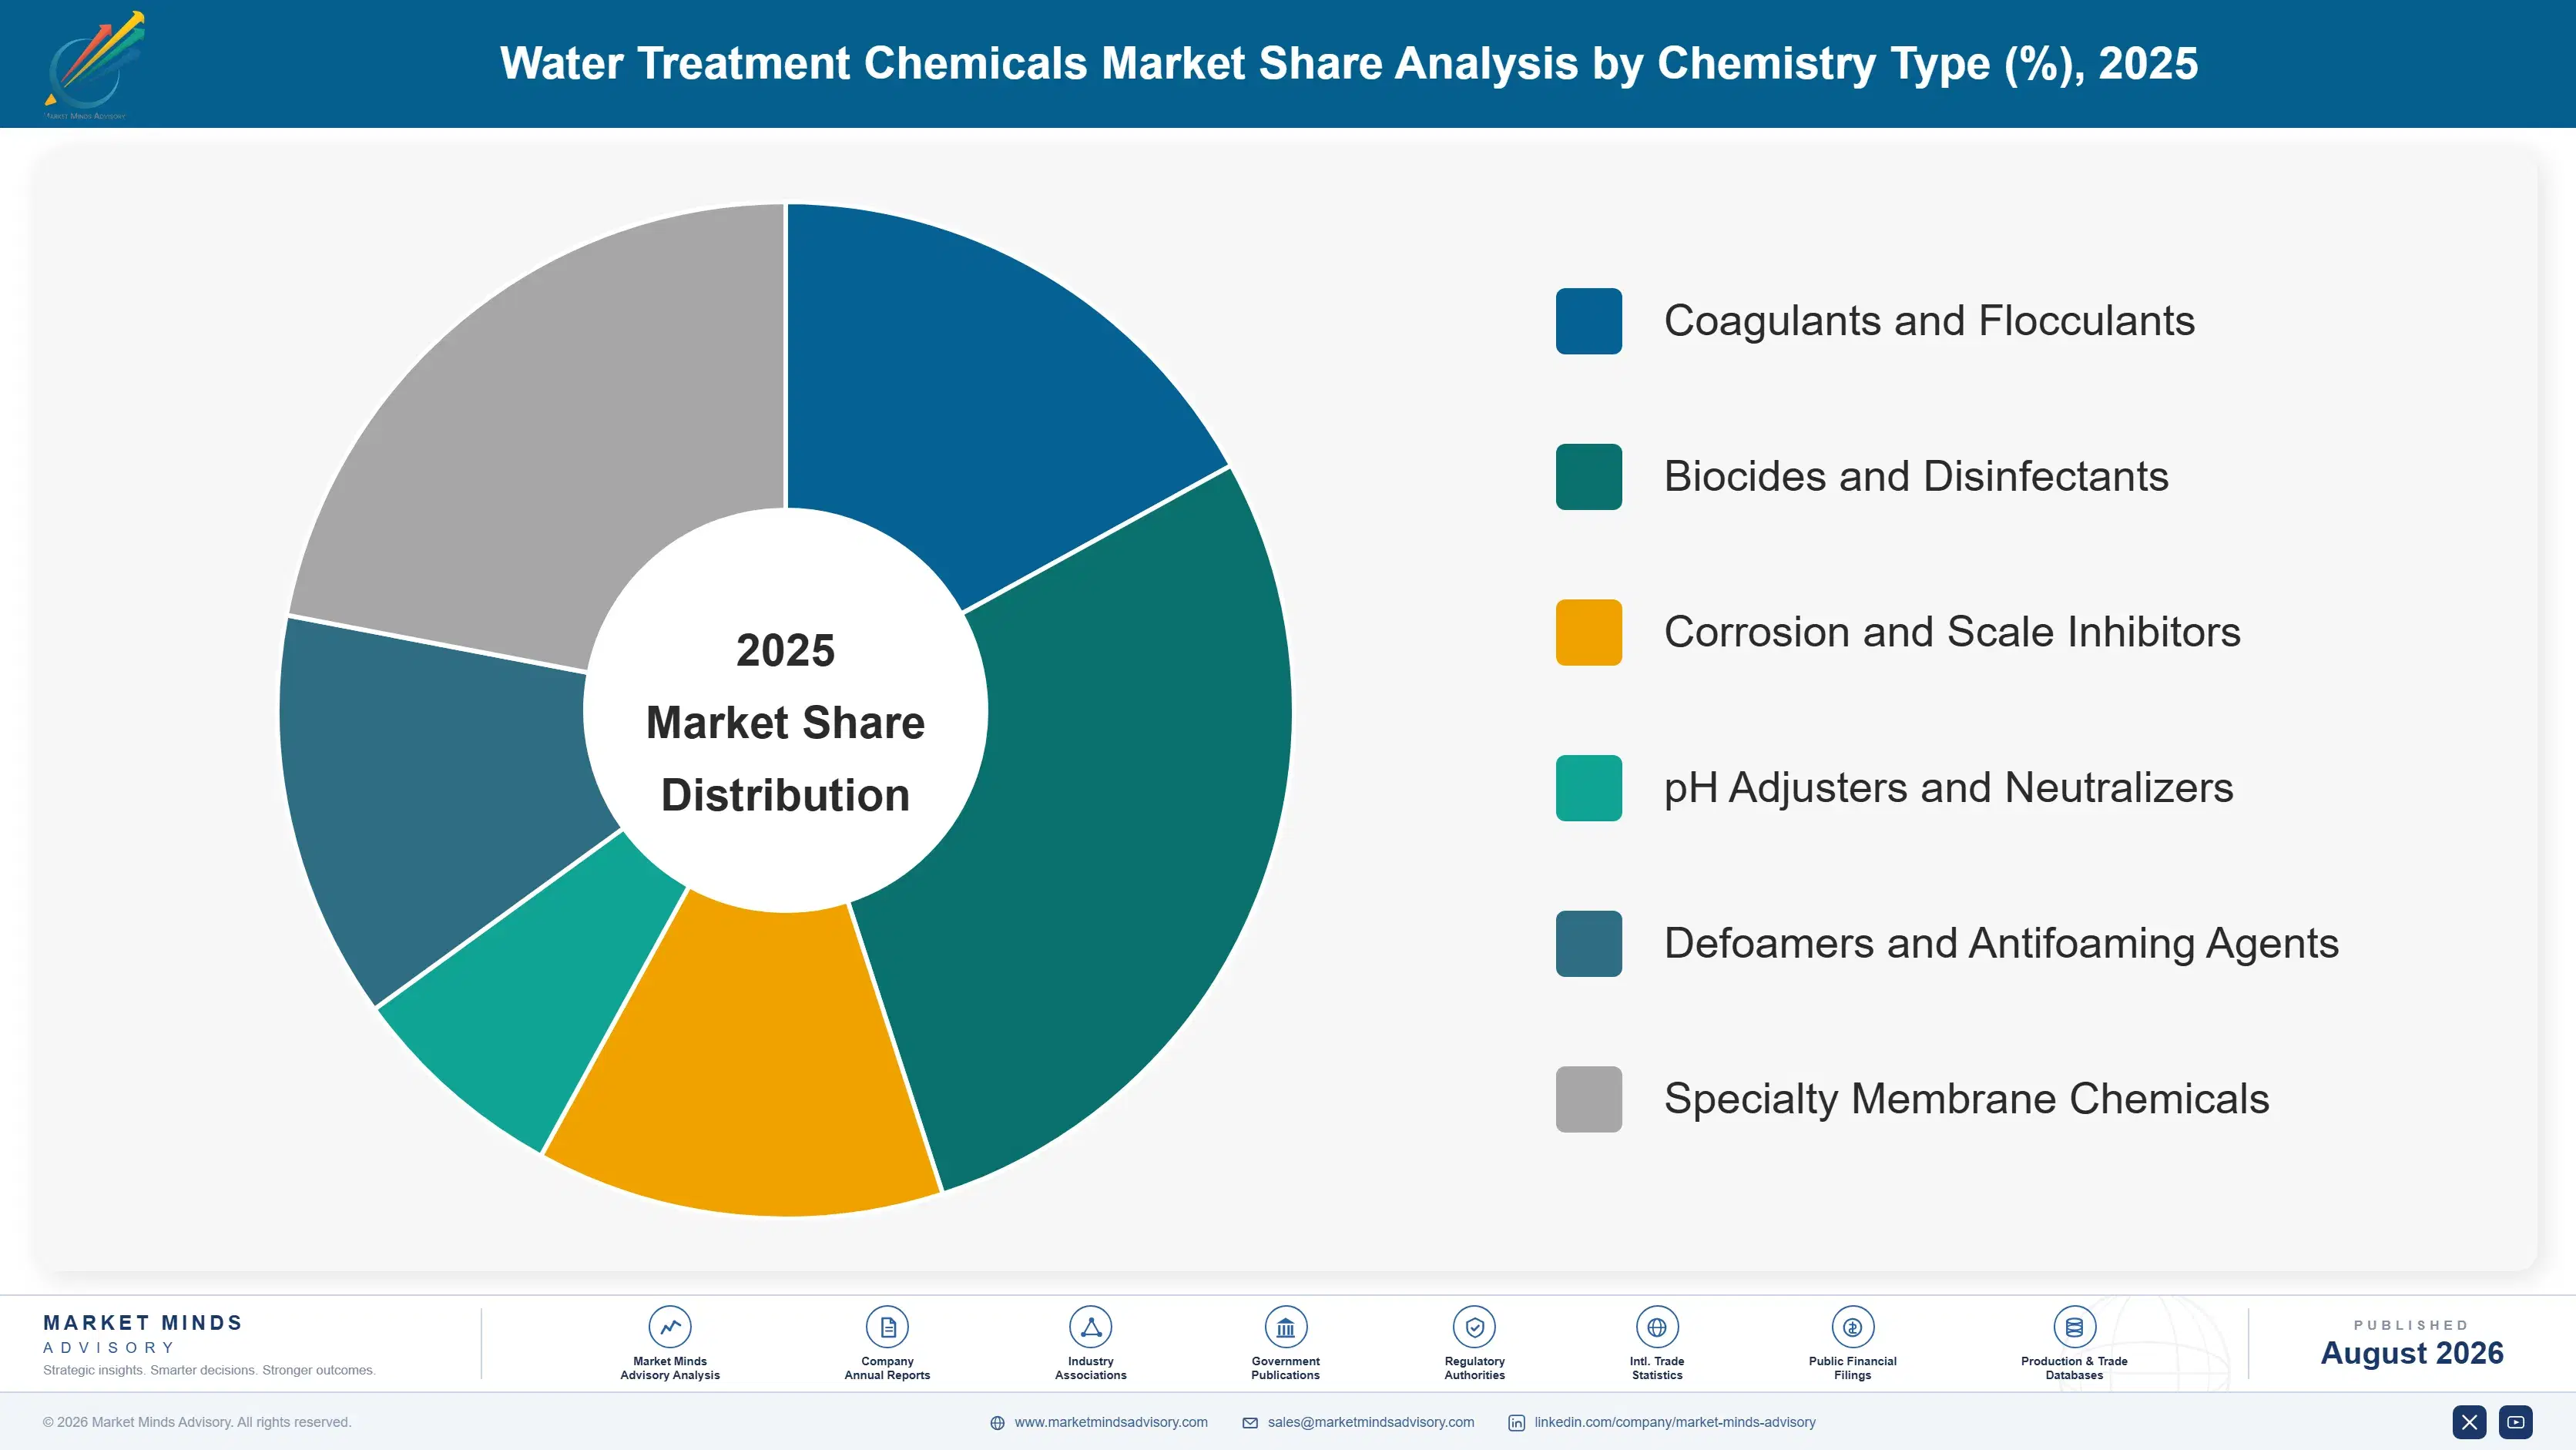
Water treatment chemicals segment most usefully by chemistry and function rather than by end-use application, since the same coagulant or biocide formulation often serves both municipal and industrial customers with only dosing format differing. This report segments the market into six chemistry-based categories reflecting distinct formulation chemistry, regulatory treatment, and competitive dynamics across the value chain.
water-treatment-chemicals-market-trends-market-share-analysis-1787664585962

Specialty Membrane Chemicals

Specialty membrane chemicals, comprising antiscalants, membrane cleaners, and biocides formulated specifically for reverse osmosis and ultrafiltration systems, are the fastest-growing chemistry category as desalination and industrial reuse capacity expand globally. Unlike commodity coagulants, these formulations are engineered against specific feedwater chemistry and require ongoing technical service to prevent membrane fouling and scaling that would otherwise shorten membrane life considerably. Suppliers with strong technical service capability are capturing disproportionate share of new desalination and reuse project specifications, since operators increasingly value suppliers who can troubleshoot fouling events rather than simply deliver chemistry in bulk. Growth is concentrated in the Middle East, India, and China, where new membrane capacity additions are running well ahead of global average installation rates this decade.
CAGR 8.5%

Biocides and Disinfectants

Biocides and disinfectants control microbial growth and biofilm formation across municipal drinking water, industrial cooling systems, and wastewater treatment trains, and represent the second-fastest growing chemistry category behind specialty membrane chemicals. Demand is rising as industrial reuse systems concentrate biological contaminants that would otherwise be diluted through single-pass discharge, requiring more aggressive and more frequently monitored dosing regimes than conventional treatment. Regulatory scrutiny of disinfection byproducts is also pushing utilities toward alternative biocide chemistries with more favorable toxicological profiles than legacy chlorine-based treatment, particularly across markets tightening drinking water quality standards. Suppliers with broad biocide portfolios spanning oxidizing and non-oxidizing chemistries are best positioned to serve utilities navigating this transition across diverse water chemistry conditions and regulatory regimes.
CAGR 6.8%
Full segment breakdown across 6 segments available in the complete report.

Regional Architecture and Country Demand Map

Water treatment chemical demand concentrates in East Asia and North America, reflecting large installed municipal and industrial treatment bases in both regions, while South Asia, the Pacific, and the Middle East are growing fastest on new desalination and industrial reuse capacity across water-stressed geographies worldwide.

North America

North America's water treatment chemical demand rests on one of the world's largest installed municipal and industrial treatment bases, with replacement and upgrade spending outweighing new capacity as the primary growth driver. Aging municipal infrastructure across the United States, much of it installed decades ago, requires ongoing coagulant and disinfectant reformulation to meet progressively tighter discharge permits issued under federal and state water quality frameworks. Industrial demand is concentrated in power generation, oil and gas produced water treatment, and semiconductor fabrication facilities expanding domestic capacity under recent industrial policy incentives. Canada contributes steady municipal demand alongside mining sector wastewater treatment requirements, while Mexico's growing industrial base adds incremental volume tied to manufacturing nearshoring investment across the region.
Share: 27% | CAGR: 4.9% (2026 to 2036)

Western Europe

Regulatory stringency defines Western Europe's water treatment chemical market more than volume growth, since the region's municipal and industrial treatment infrastructure is largely mature and expanding only incrementally. Germany, France, and the United Kingdom drive most regional demand, with utilities steadily reformulating toward biocides and coagulants that meet the European Union's revised drinking water and urban wastewater treatment directives. Industrial demand concentrates in chemical manufacturing, food and beverage processing, and pharmaceutical production, sectors facing some of the strictest discharge limits globally. Scandinavia and the Benelux countries are notable for early adoption of advanced membrane-based treatment, creating a smaller but disproportionately specialty-weighted chemical demand pool relative to the region's overall population and industrial base.
Share: 20% | CAGR: 3.2% (2026 to 2036)
Regional intelligence for 5 additional markets available in the complete report: East Asia, South Asia and Pacific, Latin America, Middle East and Africa, Eastern Europe. Contact sales@marketmindsadvisory.com.
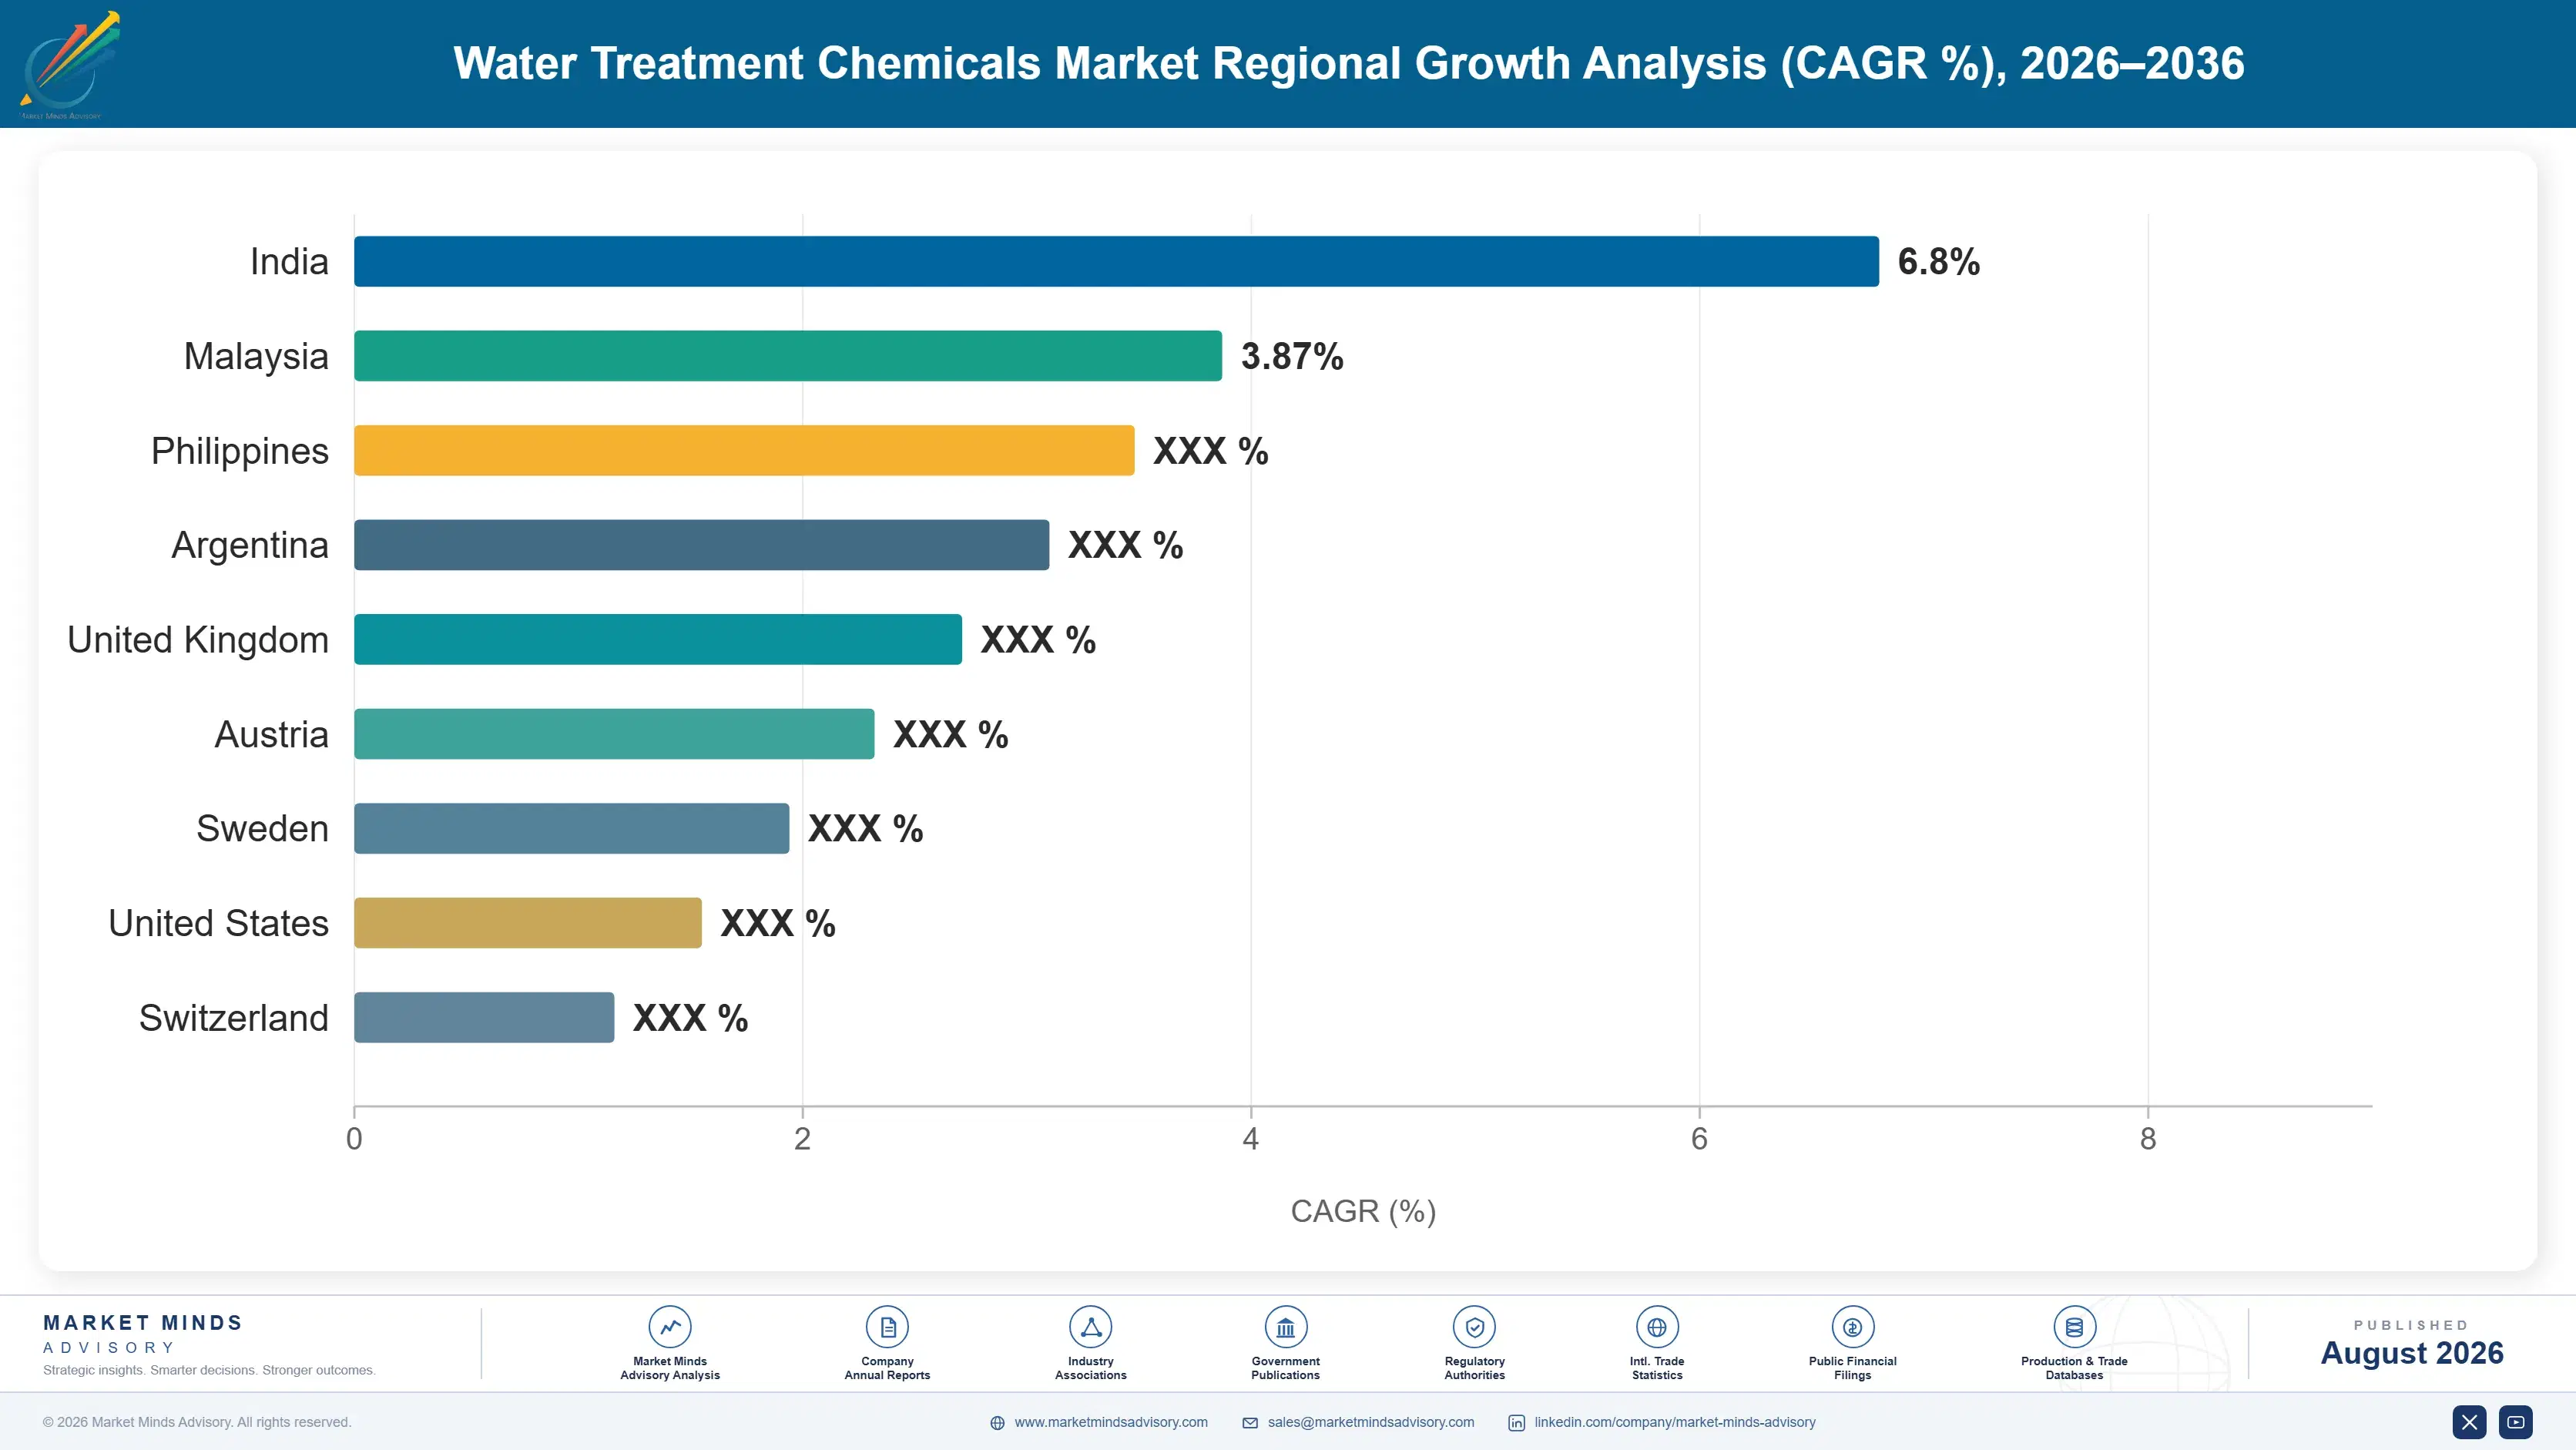
water-treatment-chemicals-market-trends-country-cagr-analysis-1787664586564

Where Water Treatment Chemical Margins Concentrate

Revenue growth in water treatment chemicals depends less on volume expansion than on shifting customer mix toward specialty chemistries and service-based commercial models. The levers below identify where suppliers are capturing disproportionate margin relative to underlying chemical volume growth, drawing on technical service, digital monitoring, and long-term contract structures rather than price increases alone.

Bundling Chemistry With Digital Dosing Monitoring

Suppliers increasingly bundle chemical dosing with remote monitoring platforms that track real-time water chemistry and automatically adjust dosing rates, reducing customer chemical consumption by an estimated 8 to 12 percent while improving compliance consistency. This shift converts a commodity chemical sale into a recurring service relationship with materially higher gross margin, since customers pay for outcomes such as reduced fouling and consistent discharge compliance rather than delivered volume alone. Early adopters among the largest suppliers report service-attached accounts renew at considerably higher rates, reinforcing the case for continued platform investment.
Market Impact: Lifts service-attached account margin by 6 points annually

Qualifying Specialty Chemistry For Desalination Contracts

Winning multi-year antiscalant and biocide supply contracts for new desalination trains requires extensive feedwater-specific qualification testing, but suppliers who complete this qualification typically retain the contract for the eight-to-fifteen-year operating life of the membrane system, generating far more durable revenue than commodity coagulant supply agreements renewed annually on price. Qualification investment runs into the low millions of dollars per project, often 2 to 4 million, but locks in exclusive supply positions that competitors cannot easily displace once membranes are operating, since switching antiscalant chemistry mid-operation risks membrane damage. This dynamic rewards suppliers with strong regional technical service teams.
Market Impact: Secures 10 to 15 year contract terms typically

Expanding Zero Liquid Discharge Pretreatment Contracts

Zero liquid discharge mandates require far more chemistry per unit of treated water than conventional single-pass systems, since concentrate streams must be chemically conditioned repeatedly before final crystallization or disposal, and industrial operators facing 2028 to 2030 compliance deadlines are qualifying suppliers years ahead of enforcement. Suppliers who secure early pretreatment chemistry contracts for these systems typically capture three to five times the chemical volume per facility compared to conventional treatment, since concentrate management demands multiple chemistry stages rather than a single dosing point. This creates outsized revenue opportunity among suppliers with proven expertise across heavy industry verticals.
Market Impact: Multiplies chemical volume 3 to 5 times per facility

Converting Municipal Contracts Into Multi-Year Agreements

Municipal utilities traditionally rebid chemical supply contracts annually or every few years on price, but suppliers who can demonstrate measurable treatment cost savings are increasingly winning three-to-five-year agreements that reduce rebidding frequency and smooth revenue visibility considerably. These longer contracts typically embed modest annual price escalators tied to feedstock indices, protecting margin against commodity input volatility that previously eroded profitability by 3 to 5 points on single-year contracts. Suppliers pursuing this approach must invest upfront in performance guarantees, but the payoff is a more predictable revenue base supporting long-term capacity and R&D planning.
Market Impact: Extends contract terms from 1 to 5 years

Who Controls the Margin Pool

Water treatment chemicals remain a moderately fragmented industry, with the five largest global suppliers holding an estimated 32 percent combined share on a revenue basis. Ecolab and Kemira lead with the broadest specialty portfolios and largest technical service organizations, while the gap to challengers like SNF and Solenis remains meaningful but not insurmountable given how fragmented commodity coagulant supply is.
Current competitive activity centers on three dimensions: expanding specialty portfolios through targeted acquisitions, building digital dosing platforms that convert chemical sales into recurring service relationships, and securing long-term supply qualification for large desalination projects ahead of competitors. Suppliers lacking scale in any of these three areas increasingly struggle to defend share against both larger multinationals and nimble regional specialists.

Emerging pressure comes from Asian regional producers, particularly in China and India, who are steadily improving formulation quality and technical service capability while retaining considerable cost advantages over Western multinationals. Rankings are most likely to shift in the specialty membrane and desalination antiscalant categories, where technical qualification barriers are real but not permanent, and in commodity coagulant supply, where regional producers already compete effectively on price across most developing markets.
water-treatment-chemicals-market-trends-company-positioning-matrix-1787664587129

Competitive Moat and Risk Dimensions

ECOLAB INC

Moat: Global Technical Service Scale

Ecolab operates one of the largest water treatment technical service organizations globally, with field engineers embedded at customer sites across industrial and municipal accounts. This service density lets Ecolab win and retain contracts on measurable outcomes such as reduced fouling, a capability smaller regional competitors cannot easily replicate without comparable field investment.
ECOLAB INC

Risk: Commodity Segment Margin Drag

Ecolab's broad portfolio still includes lower-margin commodity coagulant and flocculant lines that face continuous pricing pressure from regional producers in China and India. Sustaining blended corporate margins increasingly requires shifting mix toward specialty chemistry and services faster than commodity segment erosion, a transition that competes for capital and management attention against faster-growing specialty categories.
KEMIRA OYJ

Moat: Deep Pulp and Paper Ties

Kemira holds long-standing chemistry relationships across the pulp and paper industry that extend naturally into adjacent municipal and industrial water treatment applications, giving it application expertise and customer trust that newer entrants lack. This cross-industry chemistry knowledge supports faster qualification of new specialty formulations across both legacy and emerging customer segments than competitors starting from a narrower application base.
KEMIRA OYJ

Risk: Geographic Concentration in Europe

Kemira's revenue remains more concentrated in Western Europe and North America than faster-growing Asian and Middle Eastern peers, exposing it to slower regional volume growth even as it invests in expanding desalination and reuse chemistry capability elsewhere. Closing this gap requires sustained capital investment in regions where Kemira lacks the technical service density incumbents already have.

Players Tracked

Prominent Players

Ecolab Inc
Kemira Oyj
SNF Group
BASF SE
Solenis LLC

Other Key Players

Kurita Water Industries Ltd
SUEZ Water Technologies and Solutions
Veolia Water Technologies
Lonza Group AG
Buckman Laboratories International Inc
Univar Solutions Inc
Feralco AB
Chembond Chemicals Limited
Thermax Limited
Aditya Birla Chemicals
Shandong Taihe Water Treatment Technologies Co Ltd
Kemipex
Accepta Ltd
Italmatch Chemicals S.p.A
Chengdu Techsen Water Treatment Technology Co Ltd

Recent Developments

FEBRUARY 2026

Ecolab Expands Membrane Chemistry Production Capacity

Ecolab announced expansion of its specialty membrane antiscalant and cleaner production capacity at an existing North American facility, adding output to serve growing desalination and industrial reuse project demand across the region. The expansion follows qualification wins on large-scale reverse osmosis projects across the Middle East and Asia.
Signal: Signals continued specialty membrane chemistry investment ahead of desalination capacity additions across multiple regions. ahead of anticipated regional bidding cycles
SEPTEMBER 2025

Kemira Acquires Regional Biocide Formulator

Kemira completed the acquisition of a mid-sized regional biocide formulator to expand its disinfection chemistry portfolio and strengthen technical service presence across a key growth market, adding formulation capability that complements Kemira's existing pulp and paper and municipal water treatment chemistry lines across multiple customer segments.
Signal: Signals continued acquisition-led expansion of specialty biocide portfolios among leading global suppliers. as consolidation continues across regional formulators
MAY 2025

SNF Group Commissions New Polymer Flocculant Plant

SNF Group commissioned a new polymer flocculant production plant to expand global capacity for advanced coagulant and flocculant chemistries used in municipal and industrial wastewater treatment, supporting growing demand from utilities transitioning toward higher-performance polymer chemistries across legacy treatment facilities, reinforcing SNF's position in the category.
Signal: Signals expanding global polymer flocculant capacity ahead of rising municipal compliance-driven demand. as utilities transition toward higher-performance chemistries

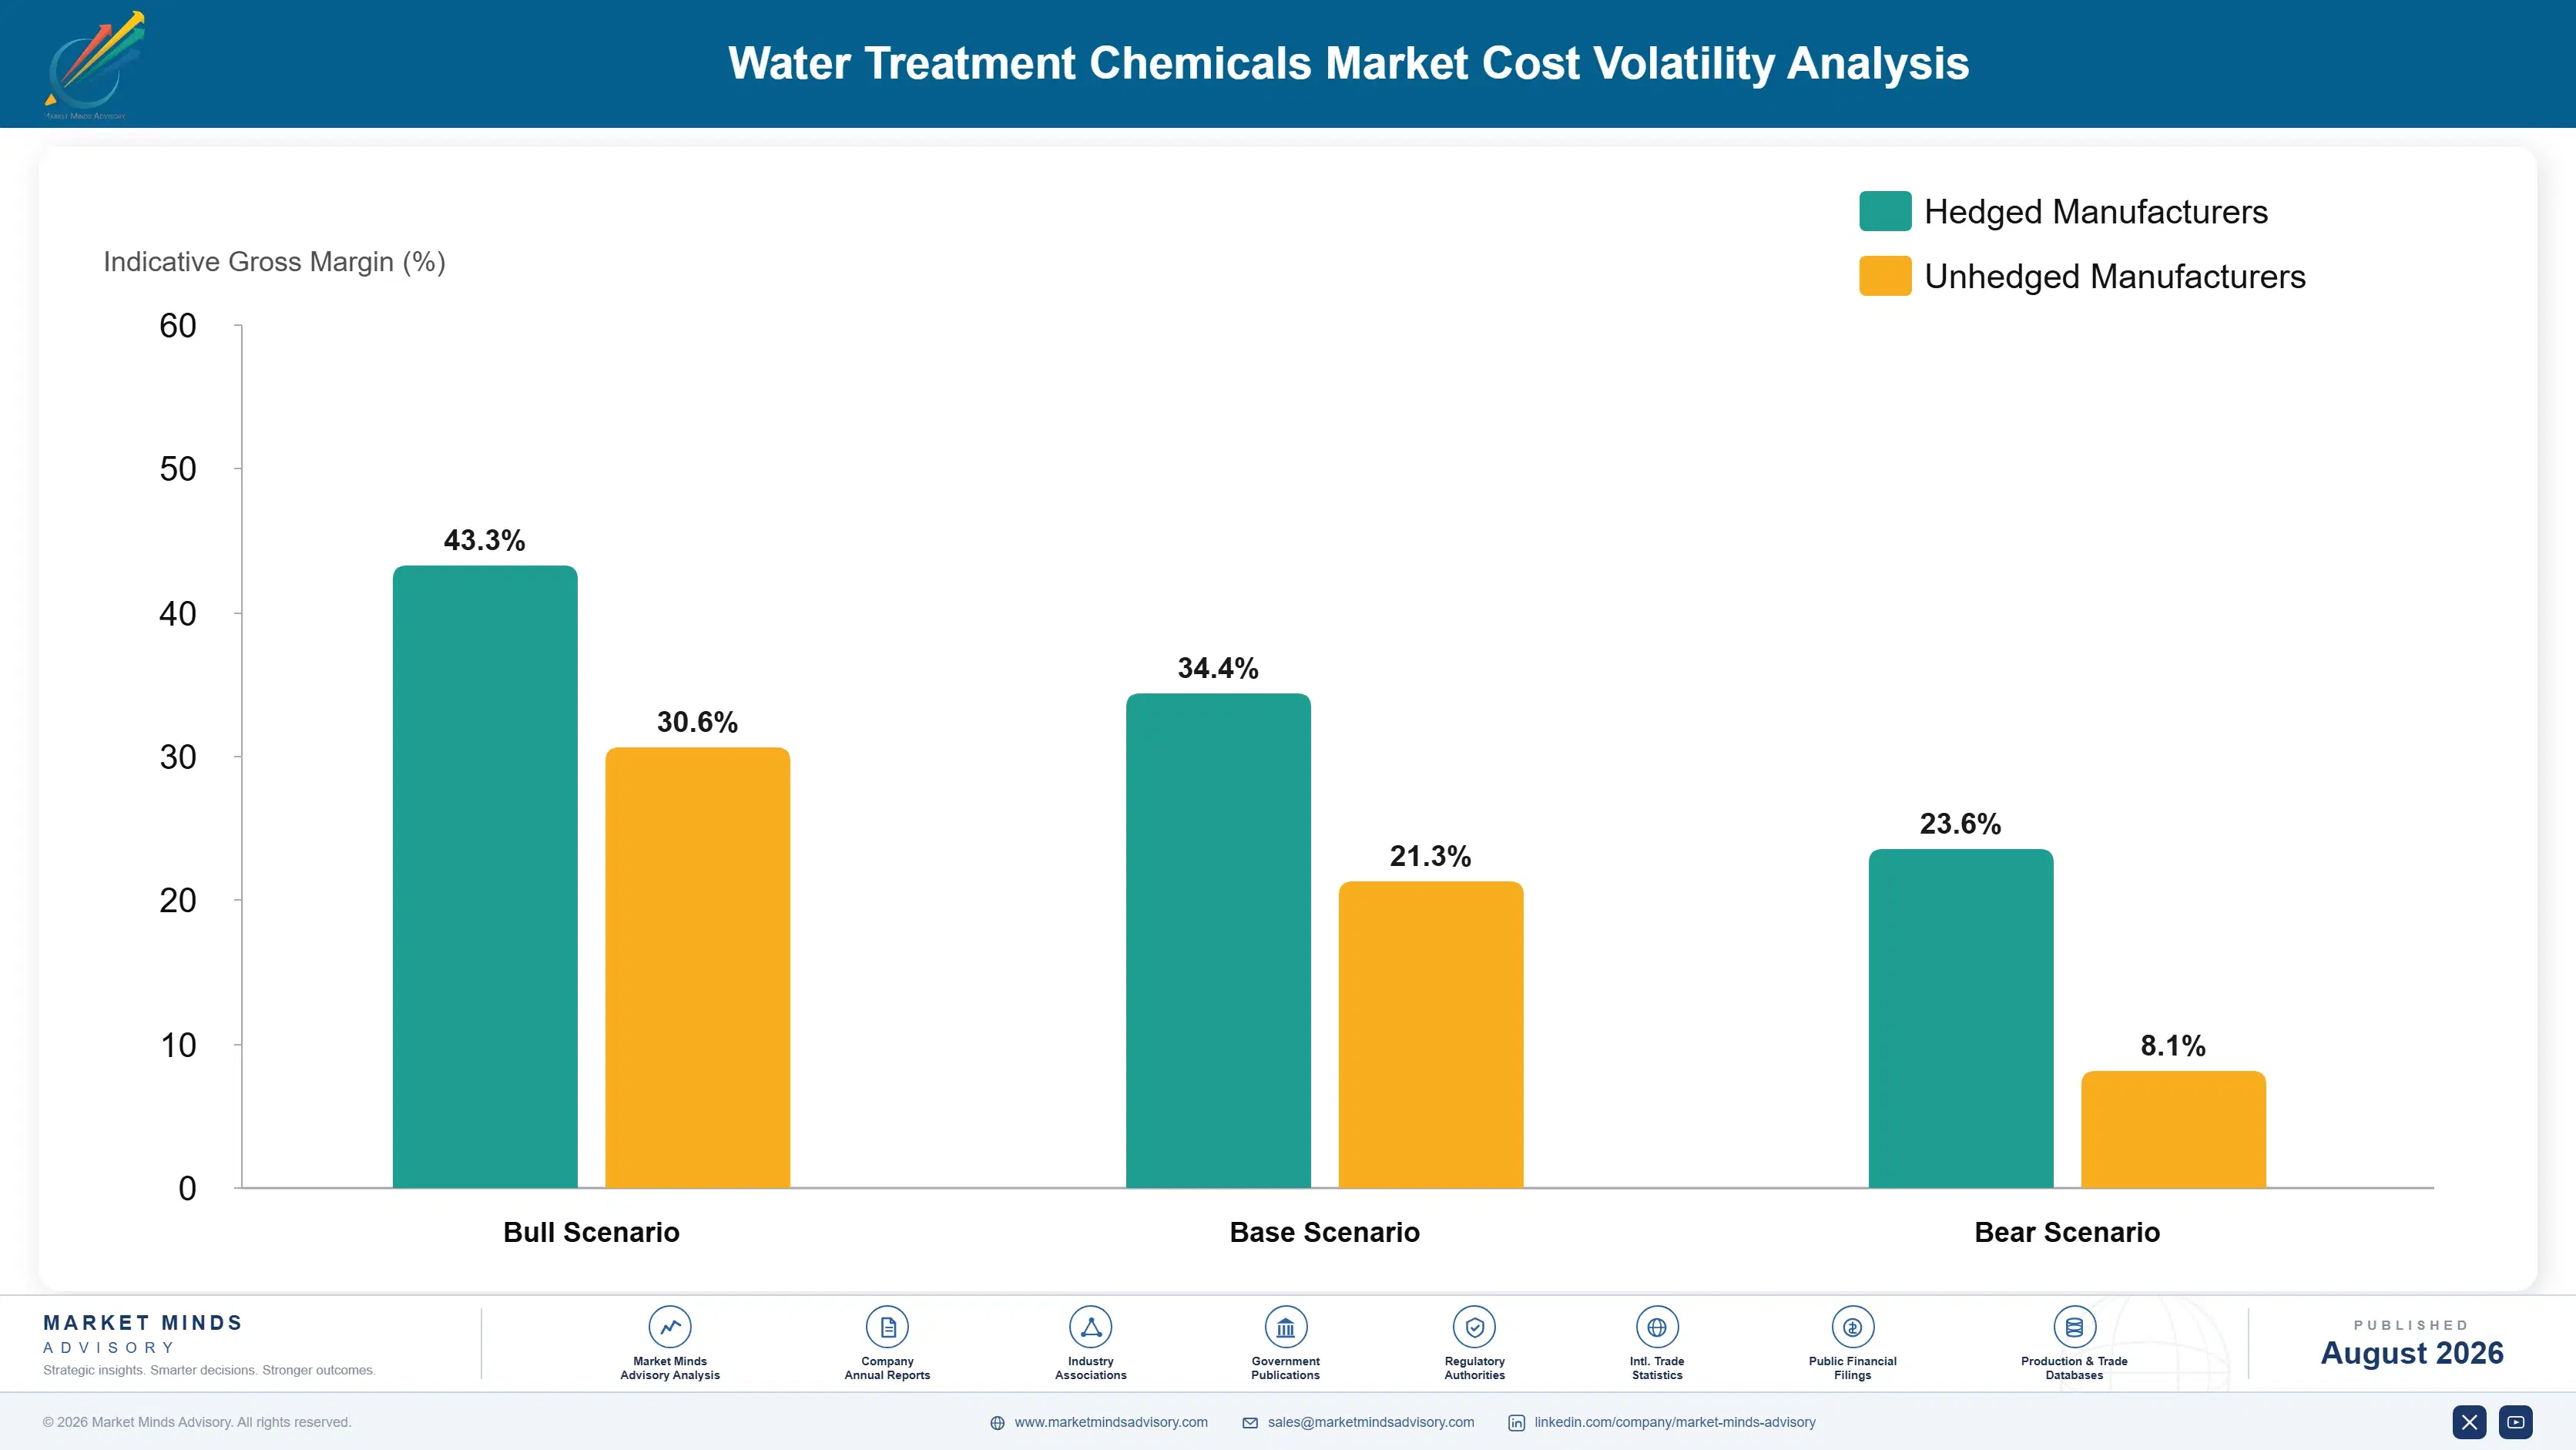
Petrochemical Feedstock Exposure and Volatility

Petrochemical-derived intermediates account for an estimated 45 to 55 percent of cost of goods sold across most water treatment chemical categories, with acrylamide, epichlorohydrin, and various surfactant intermediates sourced primarily from large petrochemical complexes across the United States, China, and the Middle East. Aluminum and iron ore inputs for coagulant production add a second significant cost category, sourced from a smaller number of concentrated mining and refining operations globally.
Acrylamide pricing spiked considerably during 2022 following unplanned outages at several major Asian production facilities, according to IEA industrial feedstock tracking data, forcing several mid-sized flocculant producers to temporarily ration allocation to existing customers rather than accept new contracts. The disruption illustrated how concentrated upstream acrylamide capacity remains, with a handful of large-scale plants across China and the United States supplying most global merchant volume for this flocculant intermediate.

Smaller regional formulators carry disproportionately higher feedstock cost exposure than the five largest global suppliers, who benefit from long-term supply contracts and greater purchasing scale that smooths input cost volatility across multiple product lines. This disadvantage becomes acute during feedstock price spikes, when regional producers must absorb margin compression or pass costs through to price-sensitive municipal customers.
water-treatment-chemicals-market-trends-cost-volatility-analysis-1787664587327

Diversifying Acrylamide and Epichlorohydrin Sourcing

Leading suppliers are qualifying multiple regional acrylamide and epichlorohydrin sources rather than relying on single-region supply, reducing exposure to any one facility outage or export restriction. This diversification requires additional qualification testing and inventory carrying costs but meaningfully reduces the risk of allocation-driven supply disruption during periods of tight global feedstock capacity. Larger suppliers pursue this most aggressively.

Locking Long-Term Feedstock Supply Agreements

Larger suppliers increasingly negotiate multi-year feedstock supply agreements with price collars that limit exposure to short-term spot market volatility, trading some upside flexibility for greater cost predictability. This approach requires meaningful purchasing scale to negotiate favorable terms, an advantage smaller regional formulators generally cannot access given their comparatively limited annual purchase volumes. Smaller producers often lack this negotiating position.

Passing Costs Through Indexed Contract Pricing

Suppliers are increasingly embedding feedstock price indices directly into municipal and industrial supply contracts, allowing periodic price adjustments tied to published petrochemical benchmark pricing rather than absorbing volatility entirely. Utilities generally accept indexed pricing in exchange for greater supply security, though negotiating acceptable index formulas remains a recurring point of contract friction. Larger contracts increasingly favor this approach.

Portfolio Architecture for Margin Defence

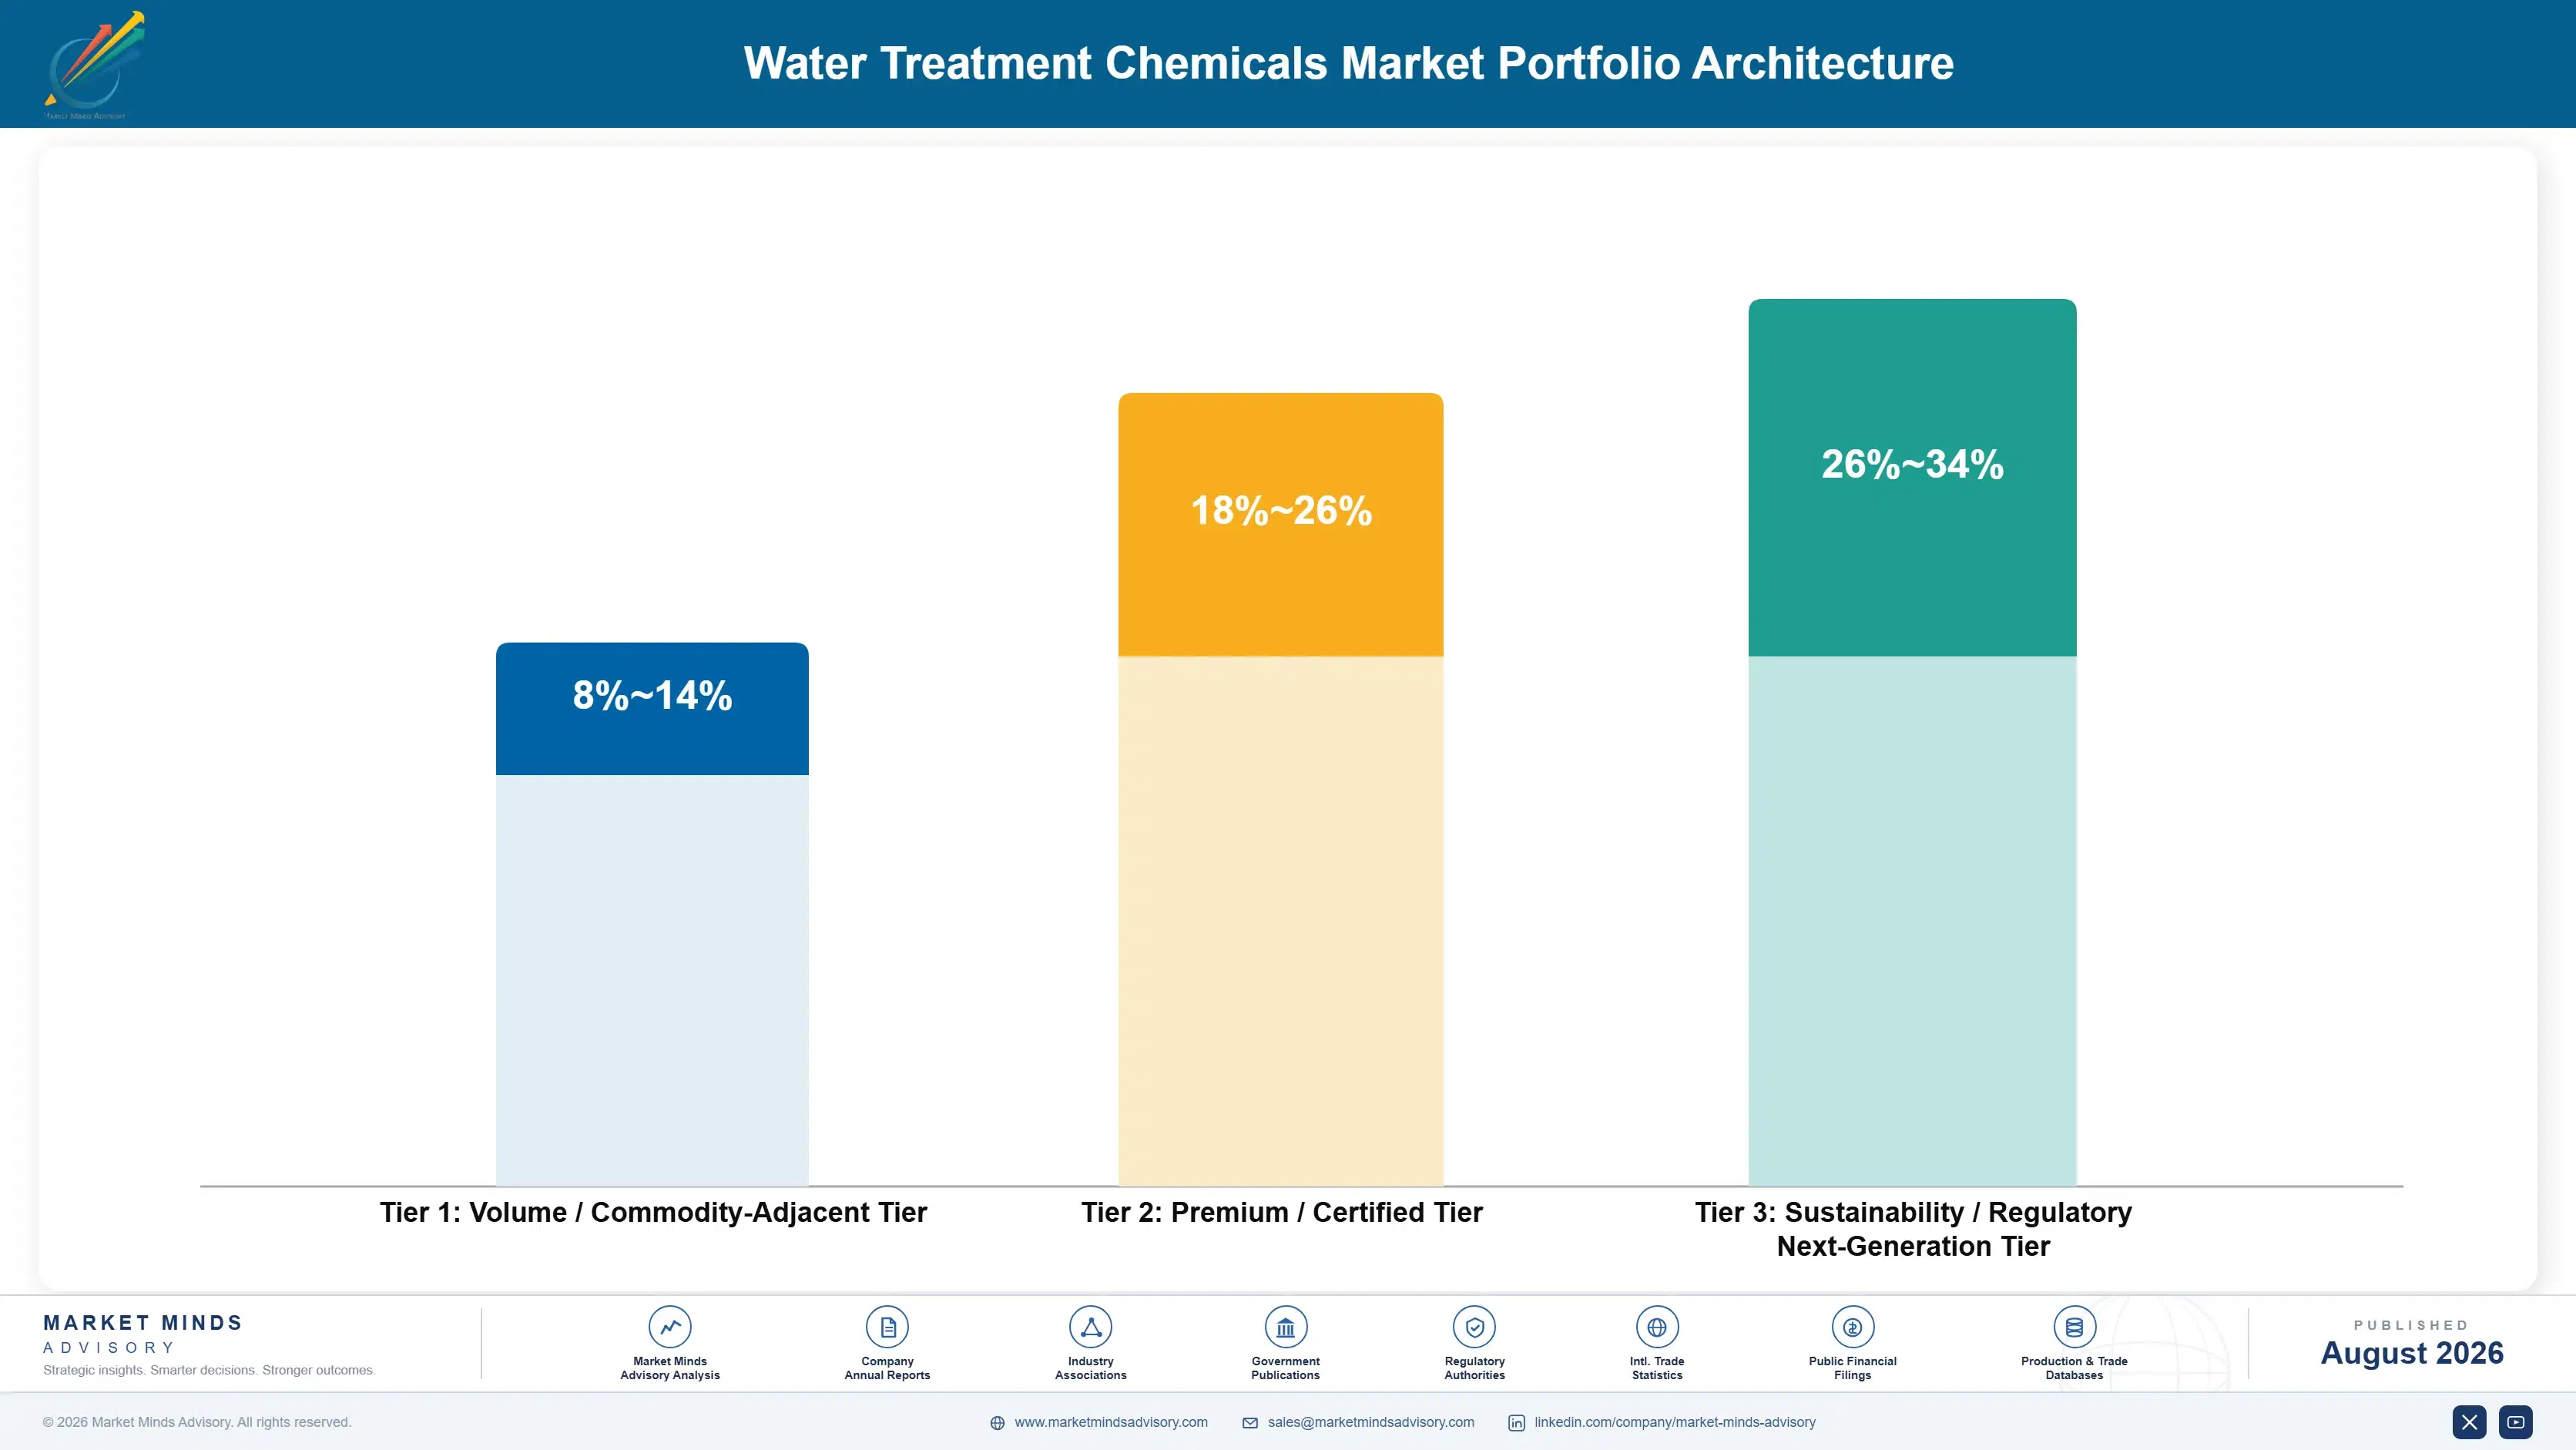
Water treatment chemical portfolios span three distinct tiers, from commodity-adjacent coagulants and flocculants sold largely on price, through premium and certified specialty chemistries that command meaningful price premiums for measurable performance improvements, to next-generation sustainability-oriented formulations designed for zero liquid discharge and advanced reuse applications. Gross margins vary dramatically across these tiers, reflecting differences in formulation complexity, regulatory certification requirements, and the technical service intensity required to support each product category.
The volume versus premium tension is stark: commodity tier products account for the majority of chemical volume shipped globally but a comparatively modest share of industry gross profit, while premium and next-generation tiers represent a smaller volume share but disproportionate profitability. Suppliers face continuous pressure to shift portfolio mix upward without abandoning the commodity volume base that funds much of their manufacturing scale and distribution infrastructure.

High-value margin pools concentrate most heavily in desalination antiscalants, zero liquid discharge pretreatment chemistry, and biocides serving industrial reuse applications, categories where technical qualification barriers and switching costs protect established suppliers from pure price competition across most major markets. Suppliers investing early in these categories are best placed to capture disproportionate share of industry profit growth over the coming decade.

Volume / Commodity-Adjacent Tier

Coagulants, basic flocculants, and standard pH adjusters sold primarily to price-sensitive municipal utilities and smaller industrial accounts, competing mainly on delivered cost and reliable supply availability. Margins remain thin given intense price competition among numerous regional producers.
Gross Margin: 8-14%

Premium / Certified Tier

Advanced polymer flocculants, specialty biocides, and membrane antiscalants that meet stringent performance certification requirements, commanding meaningful price premiums for demonstrated fouling reduction and compliance consistency. These formulations require ongoing technical service support to maintain customer relationships.
Gross Margin: 18-26%

Sustainability / Regulatory / Next-Generation Tier

Zero liquid discharge pretreatment chemistries, advanced reuse-specific formulations, and next-generation low-toxicity biocides designed for the strictest emerging regulatory frameworks and highest-value industrial reuse applications. Adoption is accelerating as compliance deadlines approach across major industrial markets.
Gross Margin: 26-34%
water-treatment-chemicals-market-trends-portfolio-architecture-1787664587850

High-value Sub-segments and Strategic Watch-out

Zero Liquid Discharge Pretreatment Chemistry

Zero liquid discharge pretreatment chemistry combines high per-facility chemical volume with premium technical service pricing, driven by expanding compliance mandates across China, India, and the Middle East. Suppliers with proven concentrate management expertise are capturing outsized share of this rapidly expanding, high-margin segment ahead of slower-moving competitors.
Gross Margin: 28-36%

Desalination Antiscalant Chemistry

Desalination antiscalant chemistry commands premium pricing and long contract durations tied to membrane operating life, though growth has moderated somewhat as the largest Gulf desalination buildout phase matures relative to the rapid capacity additions seen earlier this decade across the region. Suppliers are extending into reuse chemistry to sustain growth.
Gross Margin: 24-32%

Municipal Coagulants and Flocculants

Municipal coagulants and flocculants remain the volume core of the industry, generating steady but slow-growing revenue from multi-year utility contracts that prioritize reliable supply and competitive pricing over performance differentiation across most developed and developing markets alike. Suppliers here compete mainly on reliability and price rather than innovation.
Gross Margin: 10-16%

Low-Cost Asian Coagulant Exports

Low-cost Asian coagulant exports are expanding into markets previously served by regional Western producers, pressuring commodity segment pricing further and forcing established suppliers to accelerate their shift toward specialty chemistry and service-based revenue models to protect margin over time. This threat merits close ongoing monitoring by established regional producers.
Gross Margin: 6-12%

Compliance-Driven Recurring Chemical Demand

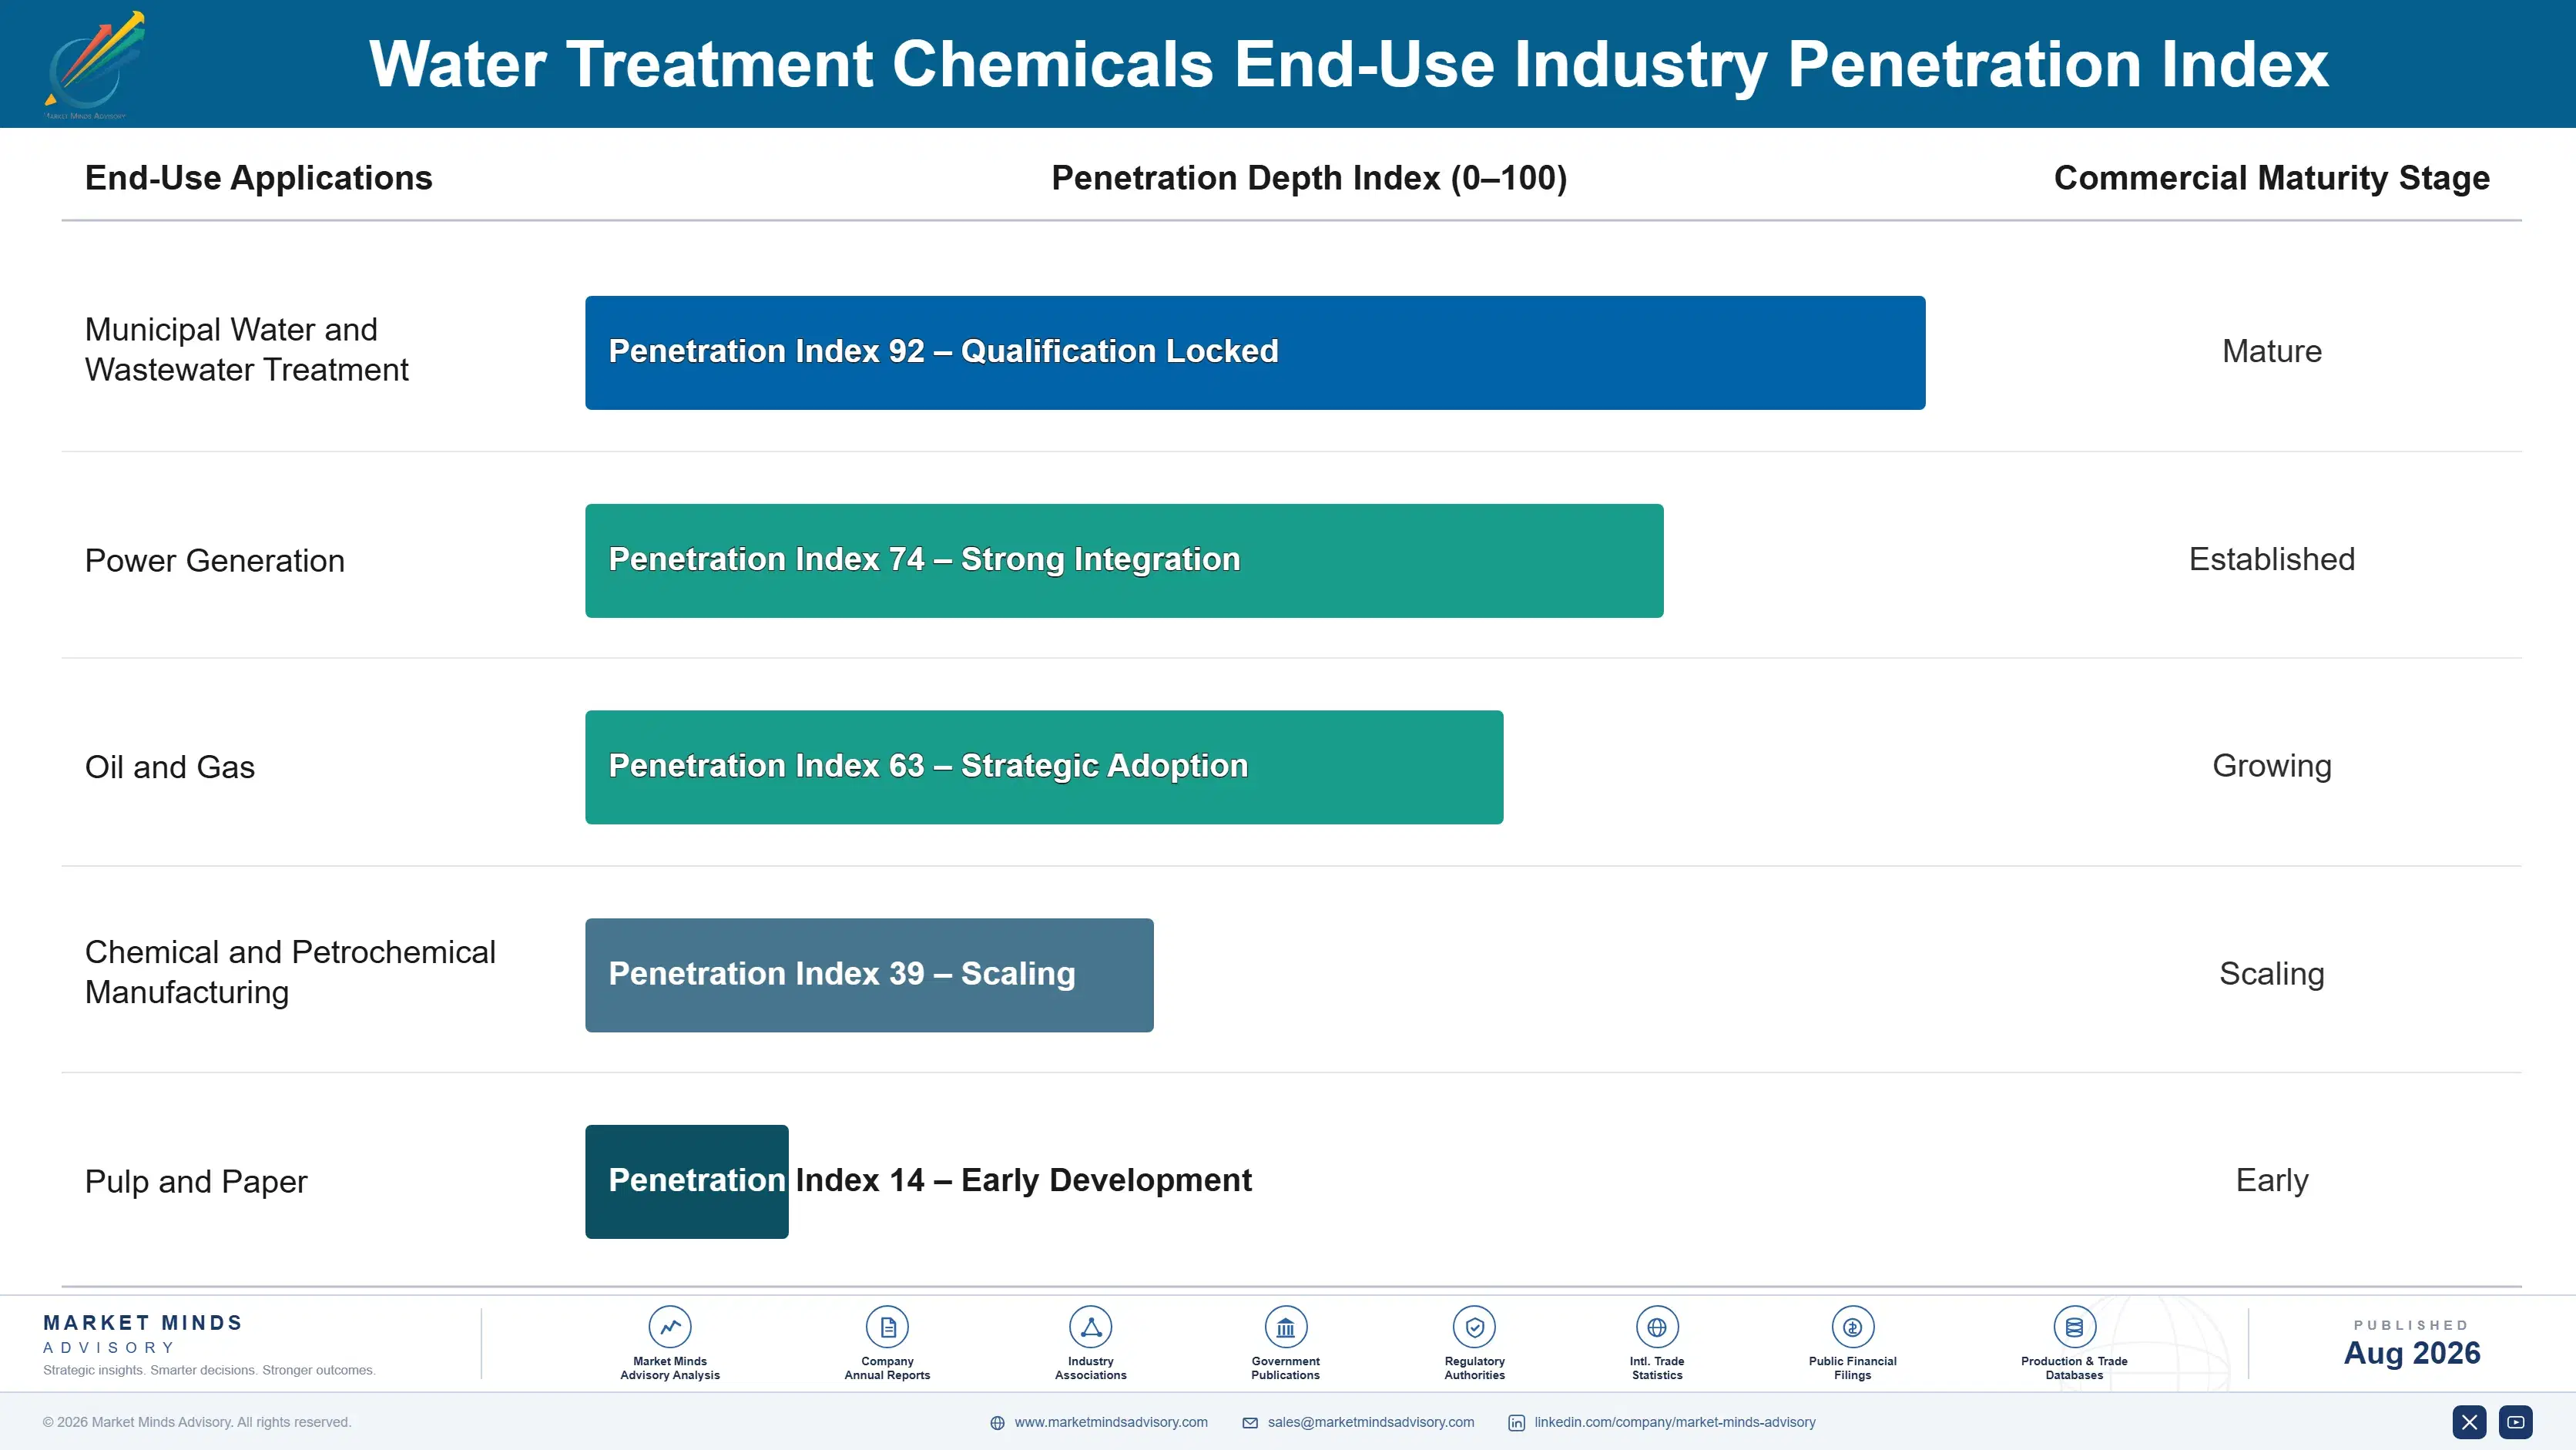
Water treatment chemical demand carries strong annuity characteristics because dosing is continuous and non-discretionary. Once a treatment facility qualifies a chemistry, switching suppliers requires requalification testing that most operators avoid absent a compelling cost or performance reason, giving incumbent suppliers durable, recurring revenue streams that persist for the operating life of the underlying treatment facility.
Adoption depth varies considerably by end-use vertical. Municipal utilities show the highest switching resistance given regulatory qualification burdens and risk-averse procurement culture, while industrial verticals facing aggressive reuse or zero liquid discharge mandates show faster willingness to adopt new chemistry when it demonstrably reduces total treatment cost or compliance risk. Semiconductor and power generation facilities, in particular, increasingly co-develop chemistry specifications directly with suppliers rather than purchasing from a standard catalog.

A generational shift in buyer profile is underway as utility and industrial procurement teams increasingly include engineers with digital monitoring and sustainability expertise rather than purely cost-focused purchasing staff. These buyers are more receptive to service-based commercial models and multi-year performance contracts than the purchasing generation they are replacing, gradually easing the path for suppliers pursuing higher-margin, service-attached revenue models across both segments.
water-treatment-chemicals-market-trends-end-use-penetration-index-1787664588365

Where Water Treatment Suppliers Should Focus

These are among the four positions where our research anticipates prominent divergence between winners and laggards over the coming forecast period. Each is grounded in the demand model, the regulatory perimeter, and the announced capacity pipeline.
01 / SPECIALTY CHEMISTRY INVESTMENT

Prioritize membrane and biocide chemistry over commodity coagulant expansion

Suppliers still expanding commodity coagulant capacity are chasing the slowest-growing and lowest-margin segment of this industry, while specialty membrane and biocide chemistries are growing nearly twice as fast and command considerably higher margins. Capital allocated toward commodity expansion today will likely underperform relative to capital directed at specialty qualification programs for desalination and industrial reuse customers. The suppliers best positioned five years from now will be those redirecting R&D and capital expenditure toward membrane chemistry now, well ahead of when commodity margin compression forces the same decision on slower-moving competitors.
02 / DESALINATION CONTRACT POSITIONING

Secure early antiscalant qualification ahead of new desalination capacity

Desalination antiscalant contracts run for the entire operating life of a reverse osmosis membrane system, typically eight to fifteen years, making early qualification wins far more valuable than they initially appear on a per-contract revenue basis. Suppliers who wait until capacity is already operating will find switching costs and technical risk aversion locking them out of contracts for over a decade in many cases. Given more than 15 million cubic meters of daily desalination capacity is under development through 2032, the qualification window for late entrants is closing fast.
03 / DIGITAL SERVICE BUNDLING

Bundle chemistry with monitoring platforms to defend margin

Suppliers bundling chemical dosing with digital monitoring platforms are converting commodity chemical sales into recurring service relationships with meaningfully higher gross margin, since customers increasingly pay for measurable outcomes rather than delivered volume alone. This shift also raises switching costs considerably, since customers integrated with a supplier's monitoring platform face real operational disruption when changing vendors mid-contract. Suppliers who delay this investment risk losing higher-margin service revenue to competitors who move first, particularly among industrial customers already comfortable with digital operations tools across other parts of their business.
04 / REGIONAL MANUFACTURING PRESENCE

Build regional formulation capacity to compete with Asian exporters

Low-cost Asian coagulant exports are steadily expanding into markets previously served by regional Western producers, and this pressure will only intensify as Asian formulators improve quality and technical service capability over the coming years. Producers without meaningful regional manufacturing presence in contested markets risk losing volume on price alone, regardless of underlying formulation quality or service reputation built over decades. Building regional capacity now, even at a modest capital cost, positions suppliers to defend commodity volume while specialty chemistry investment compounds returns over the following decade.

Engagement Snapshot From the Field

A live engagement with an industry participant carrying material or product regulatory and market exposure ahead of a defining policy shift, showing how our research translates into a defensible multi-year portfolio strategy.
MARKET MINDS ADVISORY · CLIENT ENGAGEMENT SUMMARY
Water Treatment Chemicals Producer Strategic Portfolio Review and Transition Roadmap 2026·Investment Scenario on Water Treatment Chemicals Exposure Evaluation 2025-26
CLIENT PROFILE
A regional municipal water utility group serving several mid-sized cities across the southeastern United States approached MMA seeking guidance on modernizing its coagulant and disinfectant chemistry ahead of tightening state discharge permit renewals. The utility group operated on a legacy multi-year supply contract with a single incumbent supplier and had limited internal technical capability to evaluate alternative chemistry options independently before committing to a new procurement cycle.
STRATEGIC CHALLENGE
Utility leadership needed to determine whether switching chemistry suppliers or renegotiating with the incumbent would better position the group to meet new discharge limits taking effect within eighteen months, without triggering costly requalification delays or risking non-compliance penalties during the transition period across its several treatment facilities. Board members were also wary of disrupting service continuity for residents during the transition.
MMA APPROACH
MMA benchmarked the incumbent supplier's chemistry performance against three alternative formulations already qualified in comparable municipal systems, drawing on proprietary survey data from utility operators managing similar discharge requirements. The engagement team modeled total treatment cost, not just chemical price, across each option before presenting recommendations to the utility group's board.
KEY FINDINGS
  1. The incumbent supplier's legacy coagulant formulation would require costly dosing increases to meet new discharge limits reliably. This gap widened further as flow variability increased during seasonal peak demand periods.
  2. An alternative polymer flocculant formulation already qualified in comparable systems met new limits at lower total dosing volume. Operators in comparable systems reported no adverse effects on treated water quality.
  3. Switching suppliers entirely would trigger an estimated nine-month requalification process, risking a compliance gap before deadline. This risk was considered unacceptable given the utility's compliance deadline constraints.
  4. Renegotiating the incumbent contract to include the alternative formulation avoided requalification delay while still meeting new limits. This approach preserved existing supplier relationships while meeting new requirements.
CLIENT PROFILE
A regional municipal water utility group serving several mid-sized cities across the southeastern United States approached MMA seeking guidance on modernizing its coagulant and disinfectant chemistry ahead of tightening state discharge permit renewals. The utility group operated on a legacy multi-year supply contract with a single incumbent supplier and had limited internal technical capability to evaluate alternative chemistry options independently before committing to a new procurement cycle.
STRATEGIC CHALLENGE
Utility leadership needed to determine whether switching chemistry suppliers or renegotiating with the incumbent would better position the group to meet new discharge limits taking effect within eighteen months, without triggering costly requalification delays or risking non-compliance penalties during the transition period across its several treatment facilities. Board members were also wary of disrupting service continuity for residents during the transition.
MMA APPROACH
MMA benchmarked the incumbent supplier's chemistry performance against three alternative formulations already qualified in comparable municipal systems, drawing on proprietary survey data from utility operators managing similar discharge requirements. The engagement team modeled total treatment cost, not just chemical price, across each option before presenting recommendations to the utility group's board.
KEY FINDINGS
  1. The incumbent supplier's legacy coagulant formulation would require costly dosing increases to meet new discharge limits reliably. This gap widened further as flow variability increased during seasonal peak demand periods.
  2. An alternative polymer flocculant formulation already qualified in comparable systems met new limits at lower total dosing volume. Operators in comparable systems reported no adverse effects on treated water quality.
  3. Switching suppliers entirely would trigger an estimated nine-month requalification process, risking a compliance gap before deadline. This risk was considered unacceptable given the utility's compliance deadline constraints.
  4. Renegotiating the incumbent contract to include the alternative formulation avoided requalification delay while still meeting new limits. This approach preserved existing supplier relationships while meeting new requirements.
RECOMMENDED STRATEGY
Phase 1: Phase one negotiated incumbent contract amendments to introduce the alternative flocculant formulation without full requalification. across all facilities within the utility group's service territory. Phase 2: Phase two piloted the new formulation at one treatment facility before expanding rollout across remaining utility sites. to validate performance before committing to full-scale deployment. Phase 3: Phase three renegotiated contract pricing terms to reflect the utility's now-lower total dosing volume requirements. reflecting realized savings from lower dosing volumes.
OUTCOME
The utility group met its new discharge limits four months ahead of the compliance deadline and reported (client-reported, unverified by MMA) an estimated 11 percent reduction in annual chemical spending following the formulation change. Leadership credited the phased contract amendment approach with avoiding both compliance risk and costly full requalification delays.

Frequently Asked Questions

Foundational context covering the market sizes, CAGR, scope, country, region and competition that inform every finding below. This section is provided to cover basics and most often pre-purchase conversations, answered from the MMA Primary Research Dataset.

What is the current size of the Water Treatment Chemicals Market?

The global water treatment chemicals market reached an estimated 38.5 billion US dollars in 2025. Growth is driven by tightening discharge regulations and expanding desalination and industrial reuse capacity worldwide.

How large will the Water Treatment Chemicals Market be by 2036?

MMA projects the market will reach approximately 63.1 billion US dollars by 2036. This reflects sustained demand for specialty membrane chemistries and continued municipal infrastructure replacement spending.

What is the CAGR for the Water Treatment Chemicals Market 2026 to 2036?

The market is forecast to grow at a compound annual growth rate of 4.6 percent between 2026 and 2036. Bull and bear scenarios range from 5.8 percent to 3.4 percent depending on capital spending pace.

Which segment is growing fastest?

Specialty membrane chemicals are growing fastest, at an estimated 8.5 percent CAGR through 2036. Expanding desalination and industrial reuse capacity are the primary drivers behind this shift away from commodity coagulants.

Who are the major companies in the Water Treatment Chemicals Market?

Leading participants include Ecolab Inc, Kemira Oyj, SNF Group, BASF SE, and Solenis LLC. These five companies collectively hold an estimated 32 percent combined market share on a revenue basis.

Which country is growing fastest?

India is the fastest-growing country market, expanding at an estimated 7.4 percent CAGR through 2036. Rapid municipal wastewater treatment expansion and industrial growth are driving this acceleration.

Report Segmentation Architecture

The full report scope spans multiple orthogonal segmentation dimensions, with cross-tabulated demand data provided for each dimension pair. Coverage extends further to regional breakdowns, trend trajectories, and the competitive detail needed to support segment-level decision-making.

By Chemistry Type

  • Coagulants and Flocculants
  • Biocides and Disinfectants
  • Corrosion and Scale Inhibitors
  • pH Adjusters and Neutralizers
  • Defoamers and Antifoaming Agents
  • Specialty Membrane Chemicals

By End-Use Industry

  • Municipal Water and Wastewater Treatment
  • Power Generation
  • Oil and Gas
  • Chemical and Petrochemical Manufacturing
  • Pulp and Paper

By Commercial Dimension

  • Direct Utility Supply
  • Distributor and Reseller Channel
  • Long-Term Service Contracts
  • Project-Based Desalination Supply

By Region

  • North America
  • Western Europe
  • East Asia
  • South Asia and Pacific
  • Latin America
  • Middle East and Africa
  • Eastern Europe

Scope, Methodology, and Coverage

Every figure in this report is reproducible from documented input assumptions. The scope below maps the historical period, the forecast horizon, the segmentation dimensions, and the countries covered, alongside the underlying primary and qualitative methodology.
Historical Period
2020 to 2025
Forecast Period
2026 to 2036
Base Year
2025 (USD billions; MMA Primary Research Dataset, August 2026)
Market Definition
This report covers chemicals used to treat, condition, and manage water quality across municipal and industrial water and wastewater systems, including coagulants, flocculants, biocides, corrosion and scale inhibitors, pH adjusters, and specialty membrane chemistries. It excludes water treatment equipment, membrane hardware, filtration media, and digital monitoring software sold independently of chemical formulations.
Quantitative Units
USD billions (current prices); metric tons (volume, where cited)
Segmentation Dimensions
Chemistry Type; End-Use Industry; Commercial Dimension; By Region
Regions Covered
North America, Western Europe, East Asia, South Asia and Pacific, Latin America, Middle East and Africa, Eastern Europe
Countries Covered
USA, China, Germany, France, UK, Japan, South Korea, India, Australia, Canada, Brazil, Mexico, Indonesia, Vietnam, Thailand, Malaysia, UAE, Saudi Arabia, South Africa, Nigeria, Turkey, Poland, Netherlands, Italy, Spain, Sweden, Switzerland, Argentina, Colombia, Singapore, and additional markets relevant to this sector
Key Companies Profiled
Ecolab Inc, Kemira Oyj, SNF Group, BASF SE, Solenis LLC, Kurita Water Industries Ltd, SUEZ Water Technologies and Solutions, Veolia Water Technologies, Lonza Group AG, Buckman Laboratories International Inc, Univar Solutions Inc, Feralco AB, Chembond Chemicals Limited, Thermax Limited, Aditya Birla Chemicals, Shandong Taihe Water Treatment Technologies Co Ltd, Kemipex, Accepta Ltd, Italmatch Chemicals S.p.A, Chengdu Techsen Water Treatment Technology Co Ltd
Quantitative Methodology
Primary survey, n=3,800 respondents, Q4 2025, six countries; demand-side model with trade association cross-validation
Qualitative Methodology
47 expert interviews, Q4 2025; applied to validate demand model assumptions, identify emerging dynamics, and assess competitive positioning
Report Format
PDF and XLSX data workbook (Word format preview document)
Publisher
Market Minds Advisory
Report Code
MMA-2026-CHM-101
Published
August 2026
Contact
sales@marketmindsadvisory.com | www.marketmindsadvisory.com

Purchase the full Water Treatment Chemicals Market Report (2026 to 2036).

This report delivers a complete strategic assessment of the global water treatment chemicals market, covering sizing, segmentation, regional dynamics, and competitive positioning through 2036. It draws on MMA's proprietary primary survey of 3,800 respondents and 47 expert interviews conducted in the fourth quarter of 2025 across six countries. Analysts translate these findings into actionable guidance on specialty chemistry investment, desalination contract positioning, and feedstock cost risk management for participants across the value chain. The report is designed for executives evaluating capital allocation decisions across the water treatment chemical category.
Detailed six-segment MECE chemistry-based market segmentation
Full seven-region demand architecture with growth drivers
Competitive benchmarking across twenty tracked global producers
Feedstock cost exposure and mitigation pathway analysis
Portfolio tiering and margin economics by product tier
Anonymized client case study with strategic recommendations

Built For The People Who Decide

From boardroom strategy to bench-side execution, this report is read cover-to-cover by leaders shaping the next decade of their industry, turning demand scenarios, market dynamics and valuation benchmarks into decisions.
CXOs/ Presidents/ VPs/ Managers
M&A and Corporate Development
Strategy Teams and R&D Heads
Procurement and Product Directors
Regulatory and Compliance Leaders
Investor Relations and Equity Analysts