Market Minds Advisory
Back Therapy Kits Market

Back Therapy Kits Market: Home-Use Spinal Support, TENS, and Traction Devices Through 2036

Chronic back pain management is shifting from clinic visits to the living room, pushing device makers to bundle traction, TENS, and posture correction into single home-use kits insurers are only beginning to reimburse consistently.

Lead Analyst

Alice Ballenger

Published

August 2026

Make Smarter Decisions with Customized Research Insights

Request a free sample report and evaluate market opportunities, growth trends, and competitive dynamics relevant to your business needs.

2025 MARKET VALUE$2.9BMarket Size 2025
2036 FORECAST VALUE$6.5BBase Case , 2026 to 2036
CAGR 2026 TO 20367.6 %Bull 8.9% / Bear 6.3%
INCREMENTAL OPPORTUNITY$3.4BNet 10- year value creation
EXPANSION MULTIPLE2.08x2036 value over 2026 base
Strategic Levers
M&A Pipeline
Regional Outlook
Country Rankings
Competitive Intelligence
Segmental Deep-dive
Call-Us : 91 93563 13602

Executive Snapshot and Market Trajectory

Back pain has become the default entry point for home health devices, and kit-format bundling, not single-device sales, is now how manufacturers compete for a customer who used to buy one product and stop looking. That shift has rewritten product development priorities across the category.
Lumbar traction devices and app-connected TENS units are pulling the category's growth, as patients discharged from physical therapy increasingly continue treatment at home rather than paying for ongoing clinic visits. East Asia leads adoption on manufacturing scale and price accessibility, while North America drives premium kit sales through direct insurance reimbursement channels that remain unmatched elsewhere. Retail and e-commerce channels now outsell traditional medical supply stores for this category combined.
Competitively, established orthopedic device makers face pressure from consumer wellness brands entering through e-commerce rather than clinical channels, undercutting on price while lacking clinical validation data that physicians actually trust. FDA clearance requirements for TENS-integrated kits are tightening steadily, raising the bar for new entrants and favoring manufacturers with existing regulatory infrastructure built over multiple product cycles rather than smaller companies entering the category cold for the very first time this calendar year alone.
Market Definition
The back therapy kits market covers home-use bundled devices combining traction, electrical stimulation, heat, and posture support for non-surgical back pain management. It excludes standalone clinical equipment used only in supervised settings and surgical spinal implants.
Base Year Value
$2.9B in 2025 (MMA Primary Research Dataset, August 2026)
Forecast Period
2026 to 2036, eleven discrete annual values
CAGR
7.6% base case. Bull 8.9%. Bear 6.3%.
Fastest Growth Segment
App-Connected TENS and EMS Devices: 13.2% CAGR
Fastest Growth Country
China: 11.4% CAGR
Fastest Growth Region
South Asia and Pacific: 9.7% CAGR
Largest Region
East Asia: 28% of 2025 global value
Market Leaders
DJO LLC (Enovis), Ottobock SE & Co. KGaA, Omron Healthcare Inc., Teeter Inc., iReliev LLC. Source: MMA Analysis based on company annual reports.
Primary Survey
n=3,800 procurement and R&D decision-makers, Q4 2025, six countries
Methodology
Demand-side build-up, cross-validated against public data, 47 expert interviews

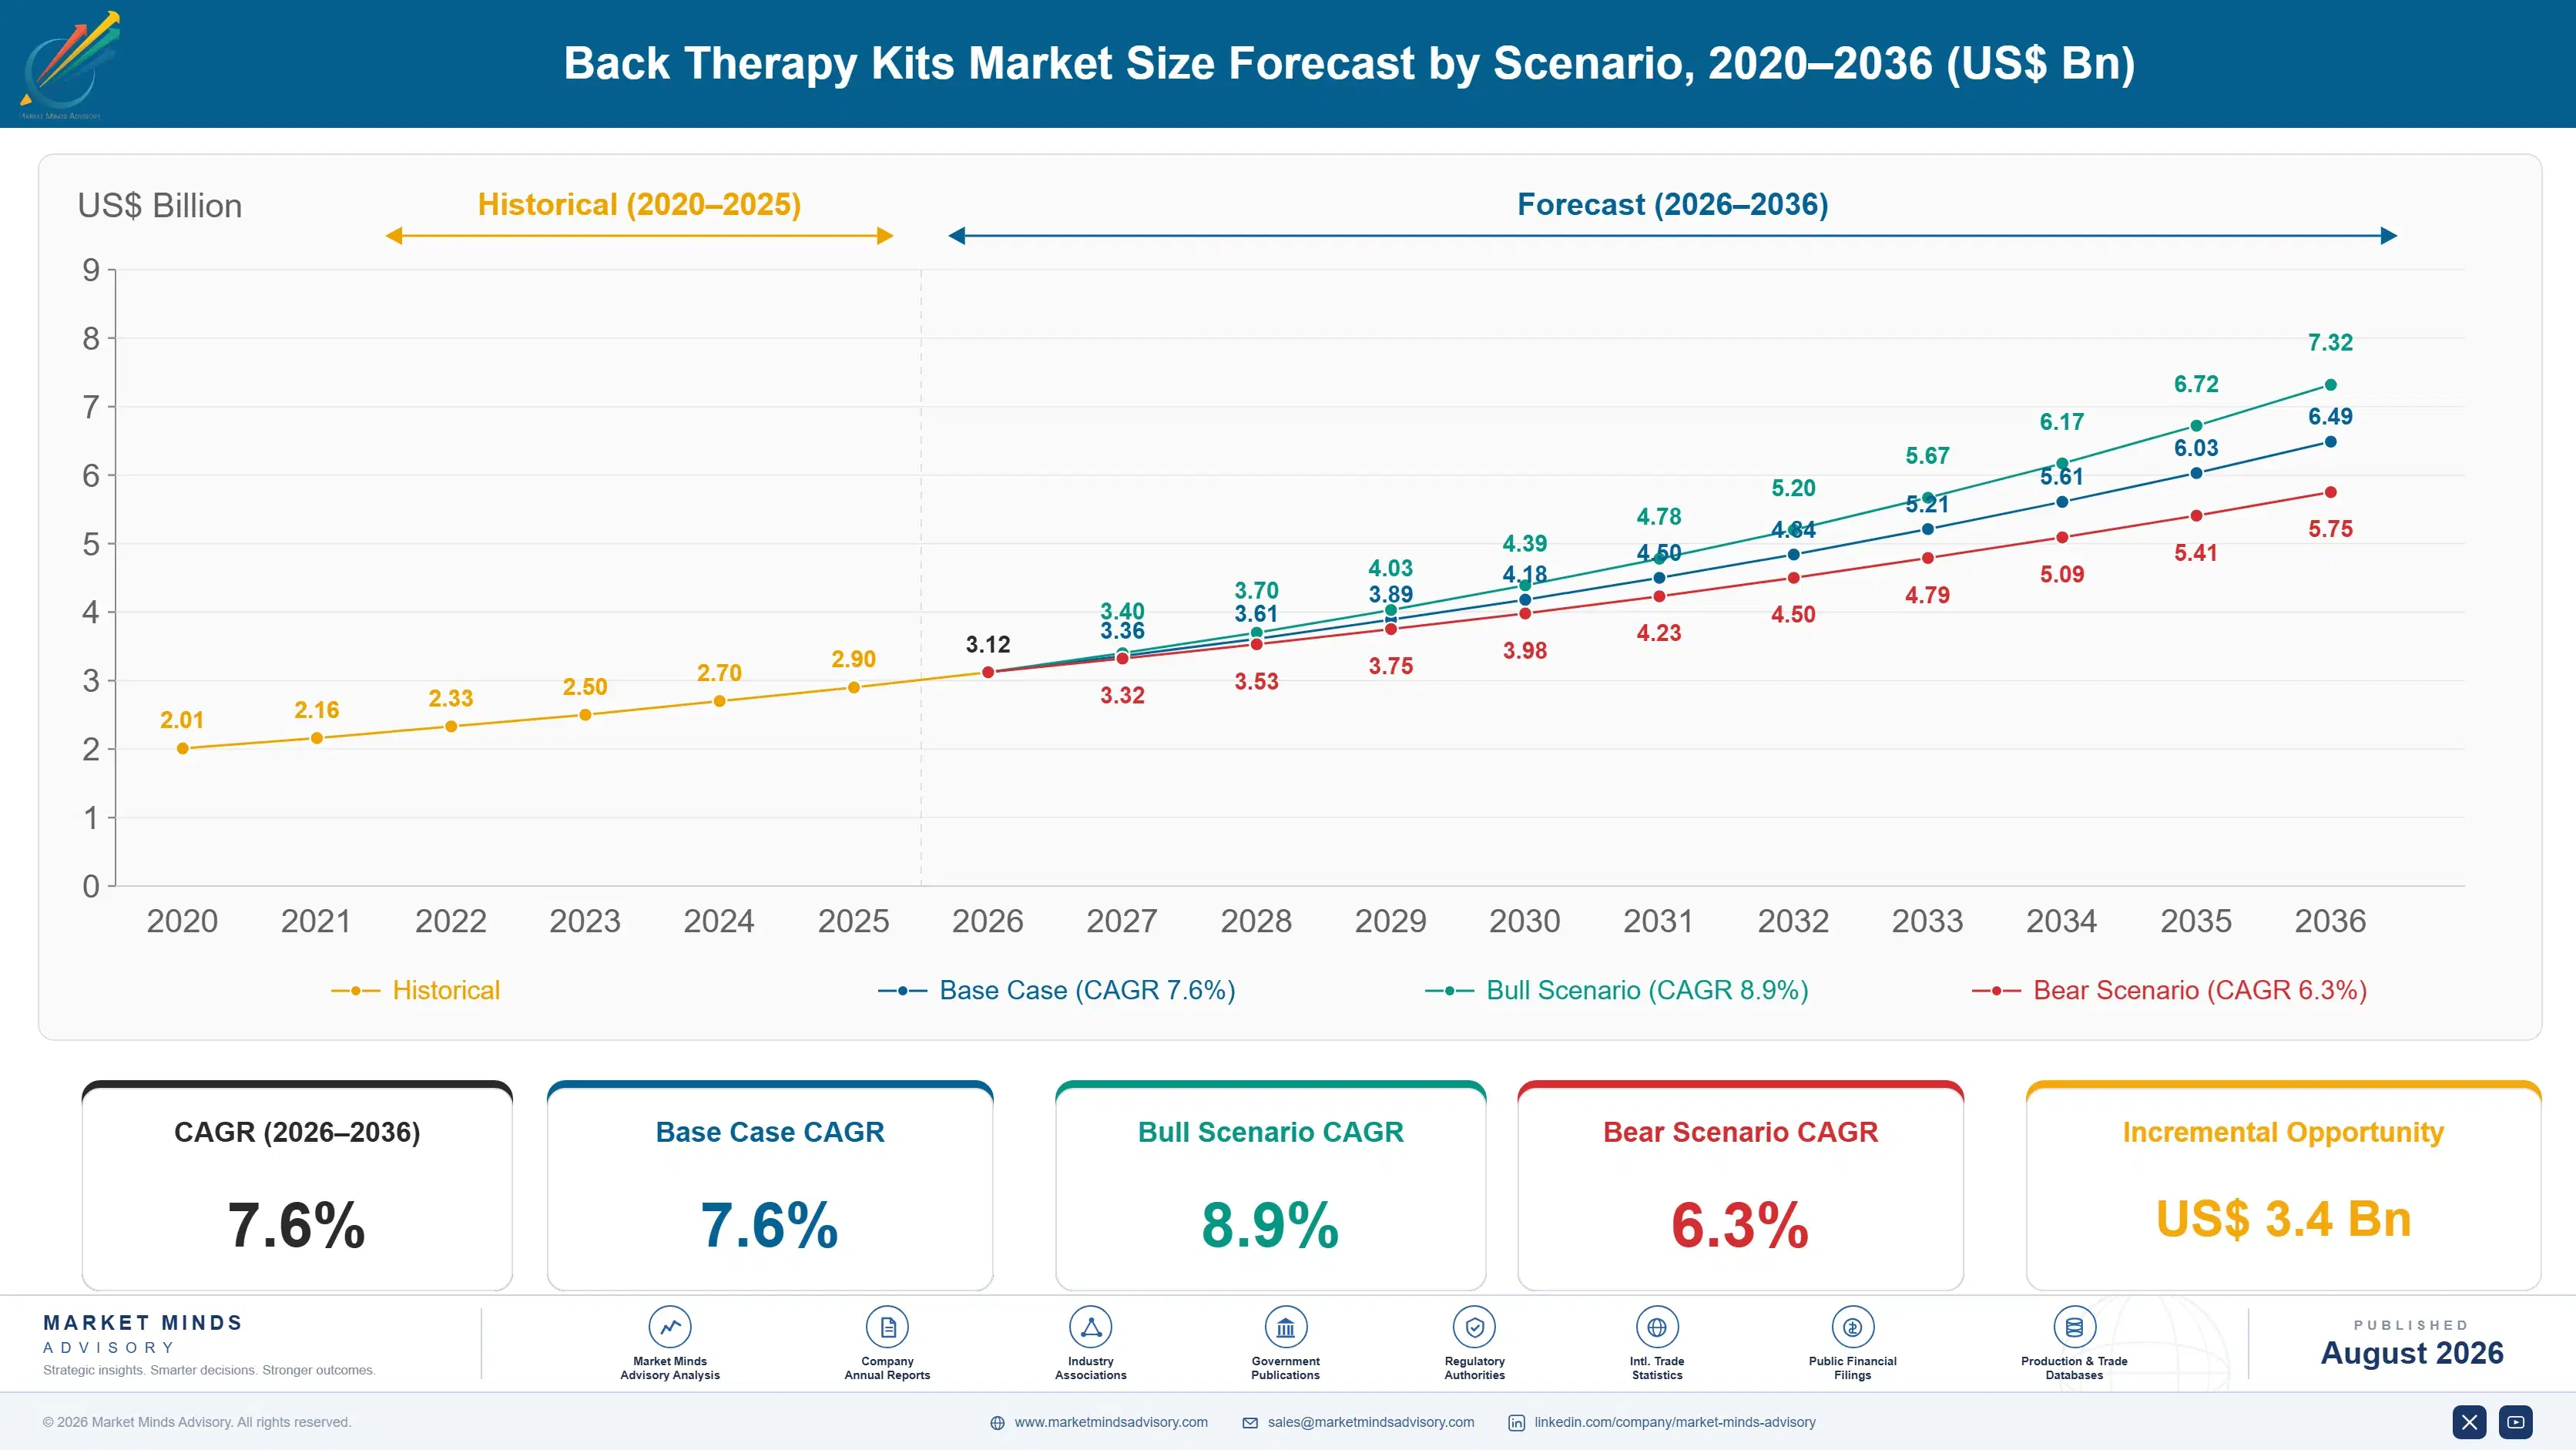
Back Therapy Kits Market Forecast Scenarios

back-therapy-kits-market-size-forecast-scenario-1787304702929
Between 2020 and 2025 the category grew steadily as remote work extended sedentary hours and telehealth normalized at-home rehabilitation, with kit-format bundles gradually replacing single-device purchases as the default entry point for new customers. Manufacturers spent much of that period building out companion app relationships and clinical referral pathways rather than competing purely on hardware specifications.
The base case assumes continued expansion driven by three mechanisms. Broader insurance reimbursement for durable medical equipment is extending kit purchases to patients who previously paid entirely out of pocket. Wider adoption of app-connected TENS and EMS devices is creating subscription-style engagement that keeps customers inside a single brand's line of accessories. And an aging population across every major economy is sustaining a decade-long rise in replacement demand for traction and support devices well beyond any single product cycle.
The bull case turns on faster reimbursement policy expansion and broader physician referral pathways into home-use devices as a genuine first-line treatment option rather than a last resort. The bear case centers on rising consumer-grade competition from unregulated wellness brands eroding price and margin even as unit volume keeps climbing, compressing profitability for established players carrying higher regulatory overhead.

Why Back Pain Devices Moved Into the Living Room

Three forces are converging on the back therapy kit category at once: rising sedentary lifestyle prevalence, telehealth-enabled remote rehabilitation, and a consumer shift toward preventive self-care rather than waiting for pain to become severe enough to justify a clinic visit and co-pay. Together they are pulling volume out of traditional clinical settings and into a home device category that barely existed in its current bundled form a decade ago.
MARKET CONCENTRATIONCR5 29%Top five players hold modest combined revenue share
AVERAGE KIT PRICE$185Typical retail price across most bundled kit configurations
TOP PRODUCING COUNTRY SHAREChina 34%Largest single national share of global production volume
DIRECT-TO-CONSUMER CHANNEL SHARE48%Share of unit sales through online retail channels today
INSURANCE REIMBURSEMENT RATE37%Share of kit purchases carrying partial insurance coverage
DEVICE REPLACEMENT CYCLE3 yearsTypical usable lifespan before a component replacement is needed
Commercially, the category behaves like a hybrid of medical device and consumer electronics, and that hybrid structure shapes competitive entry considerably. Traction and support hardware carry device-style margins and multi-year replacement cycles, while app-connected TENS units increasingly generate recurring accessory and subscription revenue that resembles a consumer electronics business model more than traditional durable medical equipment. Few competitors operate meaningfully across both halves of the business today, leaving room for a company that can.
Over the next decade, regulatory clearance depth and reimbursement relationships will matter more than any single new hardware feature, as insurers and physicians push toward validated, outcomes-documented kits rather than unregulated wellness products competing purely on price and app design. That shift favors incumbents with existing clinical trial infrastructure over fast-moving consumer brands entering purely through retail.
"The kit format won because nobody wants to buy four separate devices and figure out which one to use first. Bundling is the product now, not the hardware inside it."
Director, Medical Devices and Home Health Practice · MMA Medical Devices Practic

Market Trends

App-Connected TENS Devices Add Subscription Revenue

App-connected TENS and EMS devices are converging with subscription software models, offering personalized stimulation programs that adjust based on logged pain patterns rather than fixed presets. Over 40% of new TENS unit launches in 2025 included companion mobile apps, up considerably from a small minority just three years earlier, as manufacturers chase the recurring engagement and cross-sell revenue that hardware-only products cannot generate on their own. Several manufacturers now offer tiered subscription programs bundling replacement electrode pads with premium app features, a model borrowed directly from fitness wearable companies rather than traditional medical device makers.
Market Impact: 62% of workers report daily discomf
Physical Therapists Formalize Home-Kit Prescribing Programs

Physical therapists are increasingly prescribing home-use kits as a formal extension of in-clinic treatment rather than a separate consumer purchase, creating a clinical referral channel that did not meaningfully exist five years ago. Roughly 26% of surveyed physical therapy practices now maintain a preferred home-kit brand relationship, up from a negligible share before the pandemic accelerated telehealth adoption broadly. That referral relationship matters commercially because clinically endorsed kits command higher price points and better insurance reimbursement odds than identical products sold purely through retail channels without any clinical backing at all.
Market Impact: 44% repurchase within three years

Market Opportunities and Growth Drivers

Sedentary Work Patterns Driving Chronic Discomfort

Sedentary work patterns have intensified since 2021, with roughly 62% of surveyed office workers across the six countries in MMA's primary research reporting daily back discomfort tied directly to prolonged sitting and remote work setups lacking proper ergonomic support. That rise in self-reported chronic discomfort is the single biggest driver pulling new customers into the category, since most first-time buyers cite persistent desk-related pain rather than an acute injury as their reason for purchasing a kit. Employers in several markets have begun subsidizing home therapy devices as part of wellness benefits, widening the addressable buyer base beyond out-of-pocket purchasers.
Market Impact: Only 37% of purchases covered

Aging Population Sustaining Long-Run Replacement Demand

Population aging across North America, Western Europe, and East Asia is sustaining durable replacement demand independent of any single product cycle, as older adults represent the largest share of chronic back pain sufferers and the most consistent repeat buyers of replacement components. Roughly 44% of surveyed kit purchasers over age fifty-five reported buying a replacement or upgraded unit within three years of their original purchase, a repurchase rate well above younger buyer cohorts. That repeat-purchase pattern gives manufacturers a predictable revenue base that smooths out the volatility of first-time buyer acquisition costs considerably.
Market Impact: 31% of physicians express reservati

Market Restraints and Challenges

Inconsistent Insurance Reimbursement Across Different Insurers

Inconsistent insurance reimbursement remains a real barrier to broader adoption, with only 37% of purchases carrying partial coverage and reimbursement criteria varying sharply across insurers and even across plan tiers from the same insurer. The root cause is that many back therapy kits fall into an ambiguous durable medical equipment classification that insurers interpret differently depending on whether a physician formally prescribed the device or a patient purchased it independently online. Some manufacturers have responded by building physician prescription pathways specifically to qualify for reimbursement codes, though that process adds cost and friction consumer-channel competitors avoid entirely.
Market Impact: 40% of launches now app-connected

Physician Skepticism About Home Device Efficacy

Clinical efficacy skepticism persists among some physicians, who question whether home-use TENS and traction devices deliver outcomes comparable to supervised in-clinic treatment, with roughly 31% of surveyed physicians expressing reservations about recommending unsupervised home devices for anything beyond mild discomfort. The root cause traces to a thin peer-reviewed evidence base for many consumer-grade devices, since most clinical trials focus on professional equipment rather than the simplified home versions actually sold to patients. Leading manufacturers are investing in dedicated outcomes studies specifically to close this credibility gap and gain broader physician referral volume over time.
Market Impact: 26% of practices have preferred bra
3 additional market trends, 4 additional growth drivers, and 3 additional restraints and challenges are covered in the full report. Contact sales@marketmindsadvisory.com to access the complete intelligence.

Segment CAGR and Growth Architecture

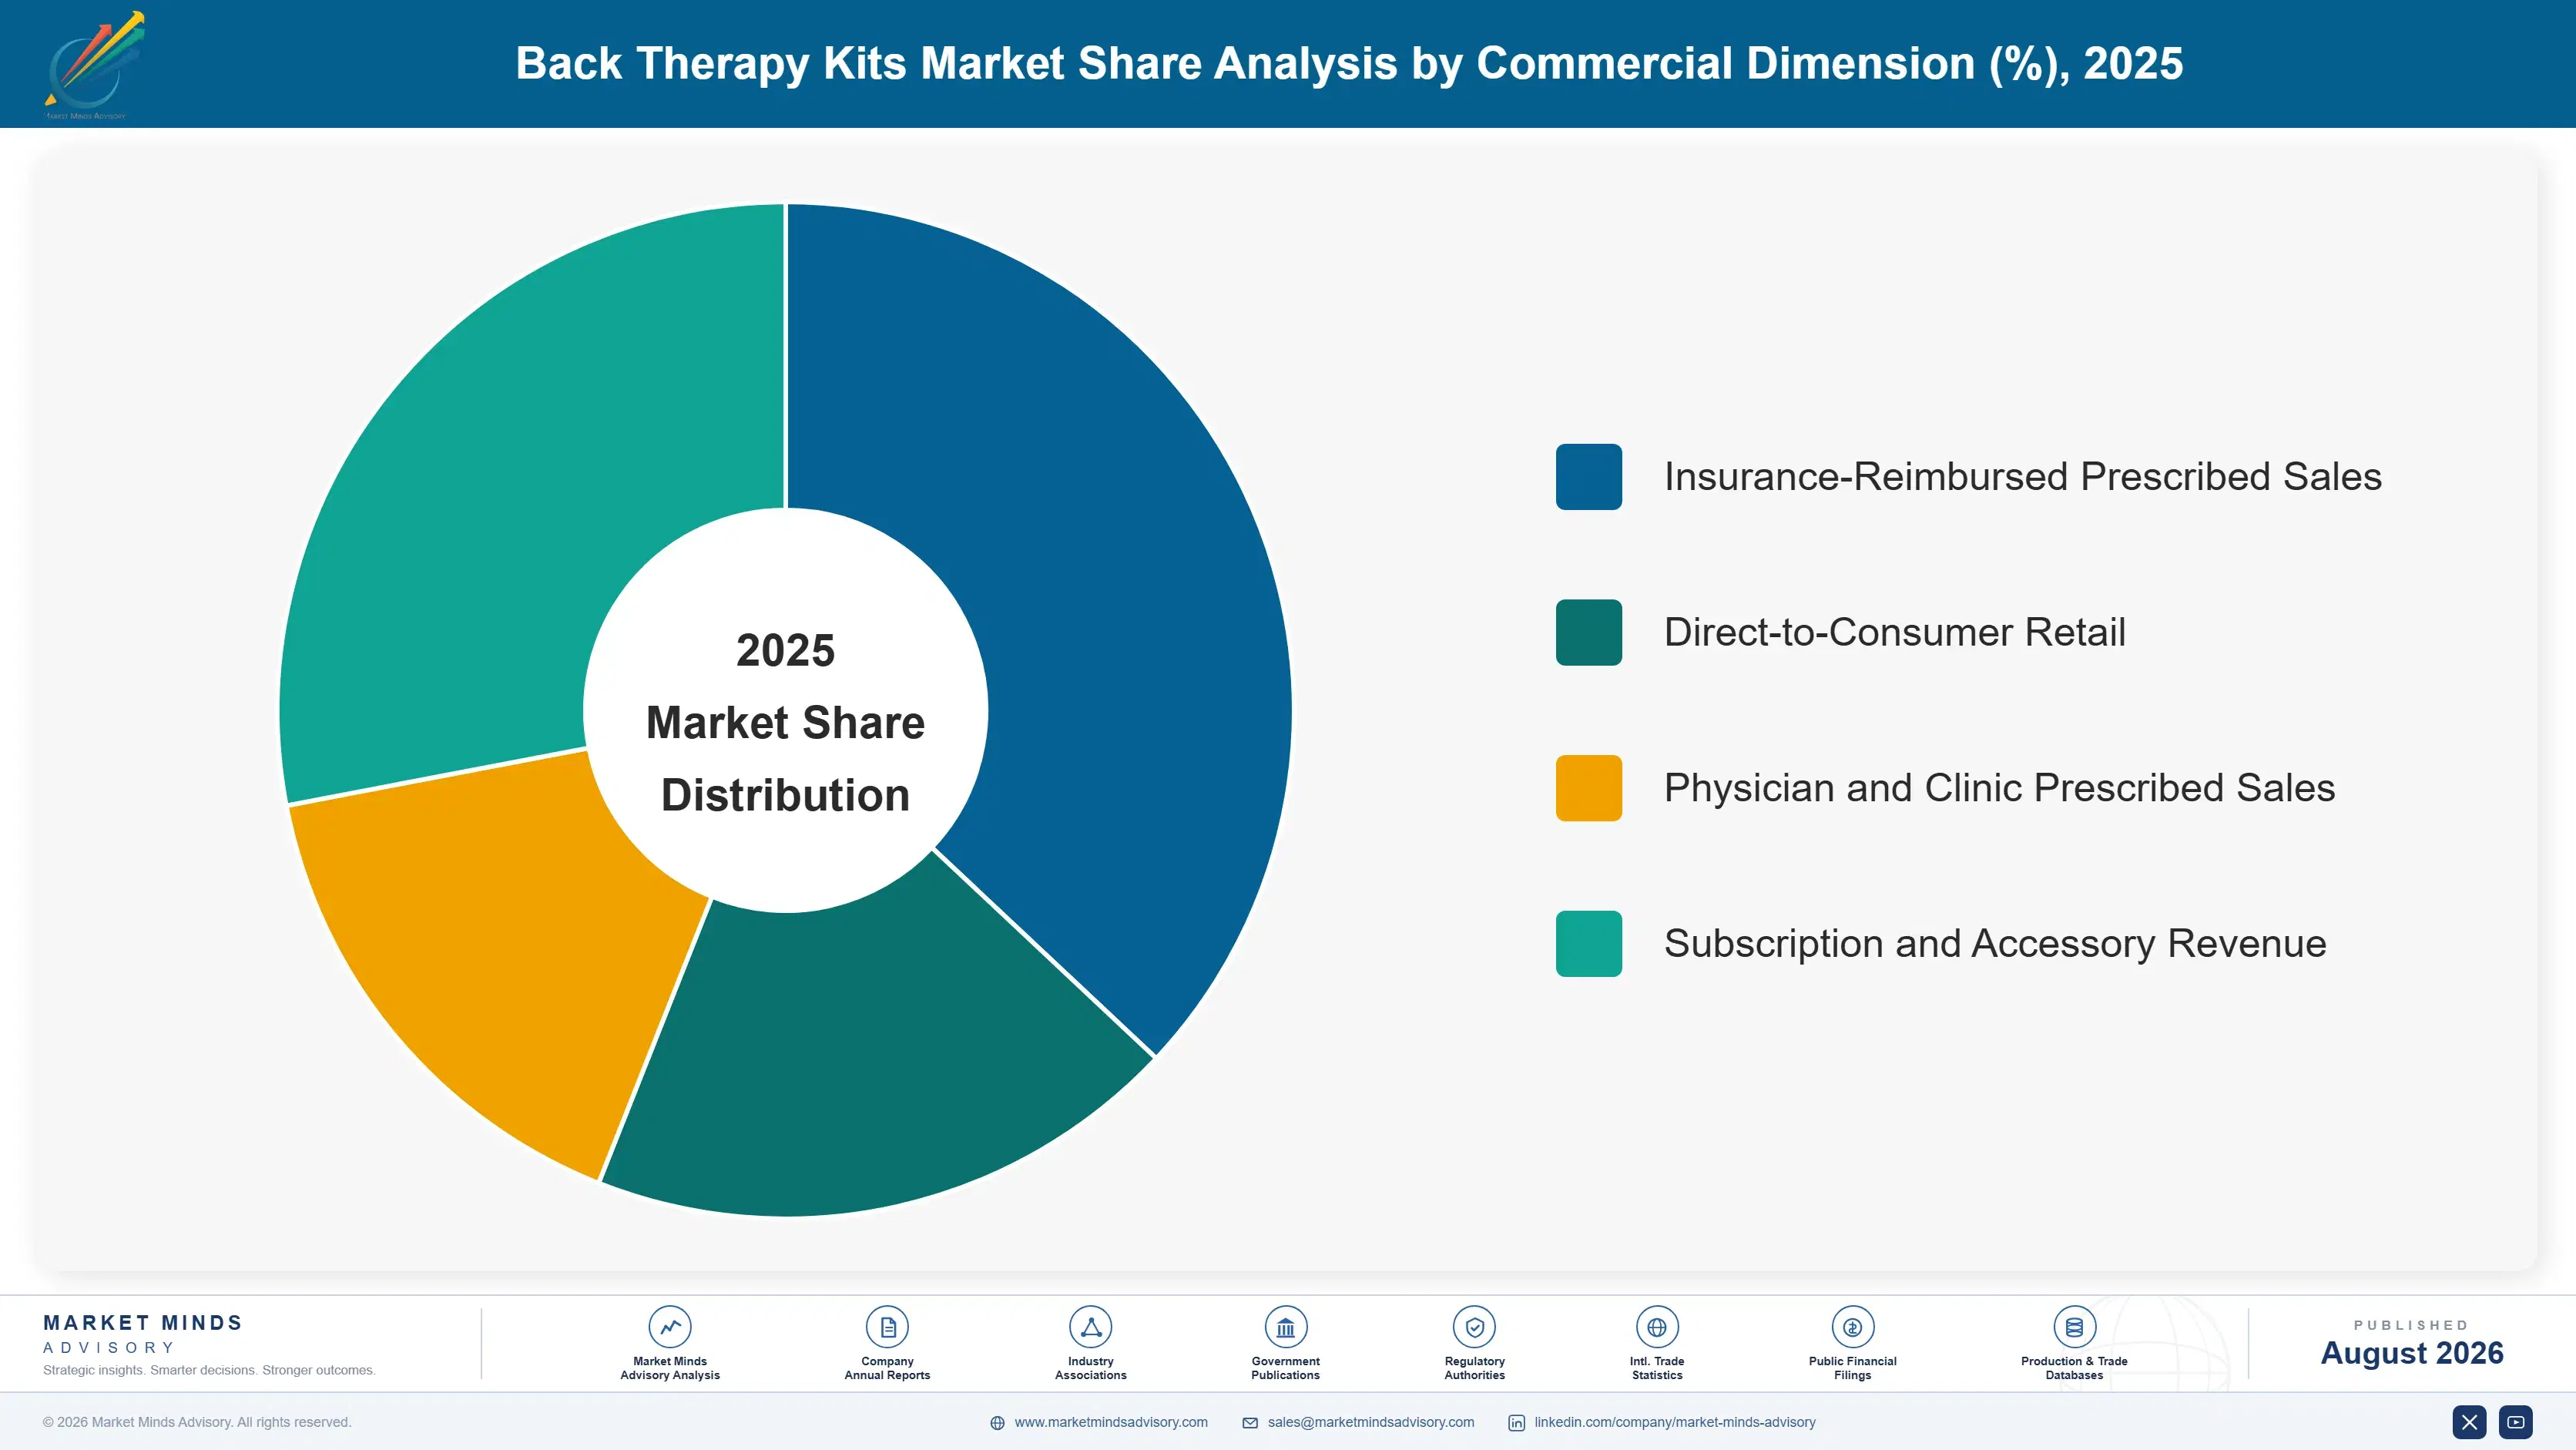
Segmentation follows device modality, the clearest lens for a category bundling several distinct therapeutic technologies into one kit rather than selling a single undifferentiated product type. Six modalities span the full range from passive support to active electrical stimulation, each with its own buyer profile, price point, and reimbursement pathway worth tracking separately as adoption curves diverge meaningfully across them.
back-therapy-kits-market-market-share-analysis-1787304703468

App-Connected TENS and EMS Devices

App-connected TENS and EMS devices are growing fastest as manufacturers chase recurring subscription and accessory revenue rather than one-time hardware sales alone that generate no further engagement after the initial purchase. Adoption concentrates among younger buyers comfortable managing therapy through a smartphone app, though older cohorts are adopting steadily as interfaces simplify and family members increasingly set up devices on behalf of aging parents living independently. Manufacturers are partnering directly with physical therapy practices to seed clinical credibility before pursuing broader retail distribution, a sequencing strategy that trades slower initial volume for stronger long-run pricing power and better insurance reimbursement odds once sufficient outcomes data accumulates across a large enough patient base.
CAGR 13.2%

Lumbar Traction Devices

Lumbar traction devices represent the second-fastest segment, benefiting directly from physical therapist referral relationships and growing consumer awareness of traction as a legitimate alternative to ongoing clinic visits for chronic disc-related pain that would otherwise require years of maintenance appointments. Demand concentrates around patients recently discharged from formal physical therapy who want to continue treatment independently rather than paying for indefinite maintenance visits their insurance may no longer fully cover. Manufacturers are increasingly bundling traction units with companion mobile guidance content to replicate the coaching a clinician would otherwise provide, a feature that meaningfully reduces early discontinuation rates compared to standalone traction devices sold without any instructional support whatsoever provided.
CAGR 9.6%
Full segment breakdown across 6 segments available in the complete report.

Regional Architecture and Country Demand Map

East Asia leads on manufacturing scale and price accessibility, while North America anchors premium kit sales through insurance reimbursement channels, and South Asia and Pacific posts the fastest growth as sedentary office work spreads rapidly across the region's expanding urban white-collar workforce and growing middle class.

North America

United States insurance plans increasingly cover durable medical equipment kits when physician-prescribed, giving manufacturers a strong incentive to build formal clinical referral pathways rather than selling purely through retail channels alone. Employer wellness benefit programs have expanded coverage for home therapy devices at a growing number of large corporations, widening the addressable buyer base considerably beyond individuals paying entirely out of pocket for treatment. Canadian provincial health plans cover a narrower set of devices than US private insurance typically allows, leaving Canadian buyers more reliant on out-of-pocket retail purchases overall. Direct-to-consumer e-commerce brands have captured meaningful share from traditional medical supply retailers across both countries over the past several years of steady category growth.
Share: 26% | CAGR: 6.9% (2026 to 2036)

Western Europe

German statutory health insurance covers a defined list of back therapy devices when prescribed through the country's established physiotherapy referral system, giving manufacturers with existing German regulatory approval a durable distribution advantage over later entrants lacking that certification. French and UK markets show comparatively lower reimbursement rates, pushing more purchases toward direct-to-consumer retail channels than the German model allows for most patients. Scandinavian countries maintain strong public health infrastructure supporting home rehabilitation devices, reflecting broader cultural trust in preventive care that extends well beyond back pain specifically into most home health categories tracked in this study across the wider Nordic region. Southern European markets trail on formal reimbursement but show growing retail demand.
Share: 19% | CAGR: 6.1% (2026 to 2036)
Regional intelligence for 5 additional markets available in the complete report: East Asia, South Asia and Pacific, Latin America, Middle East and Africa, Eastern Europe. Contact sales@marketmindsadvisory.com.
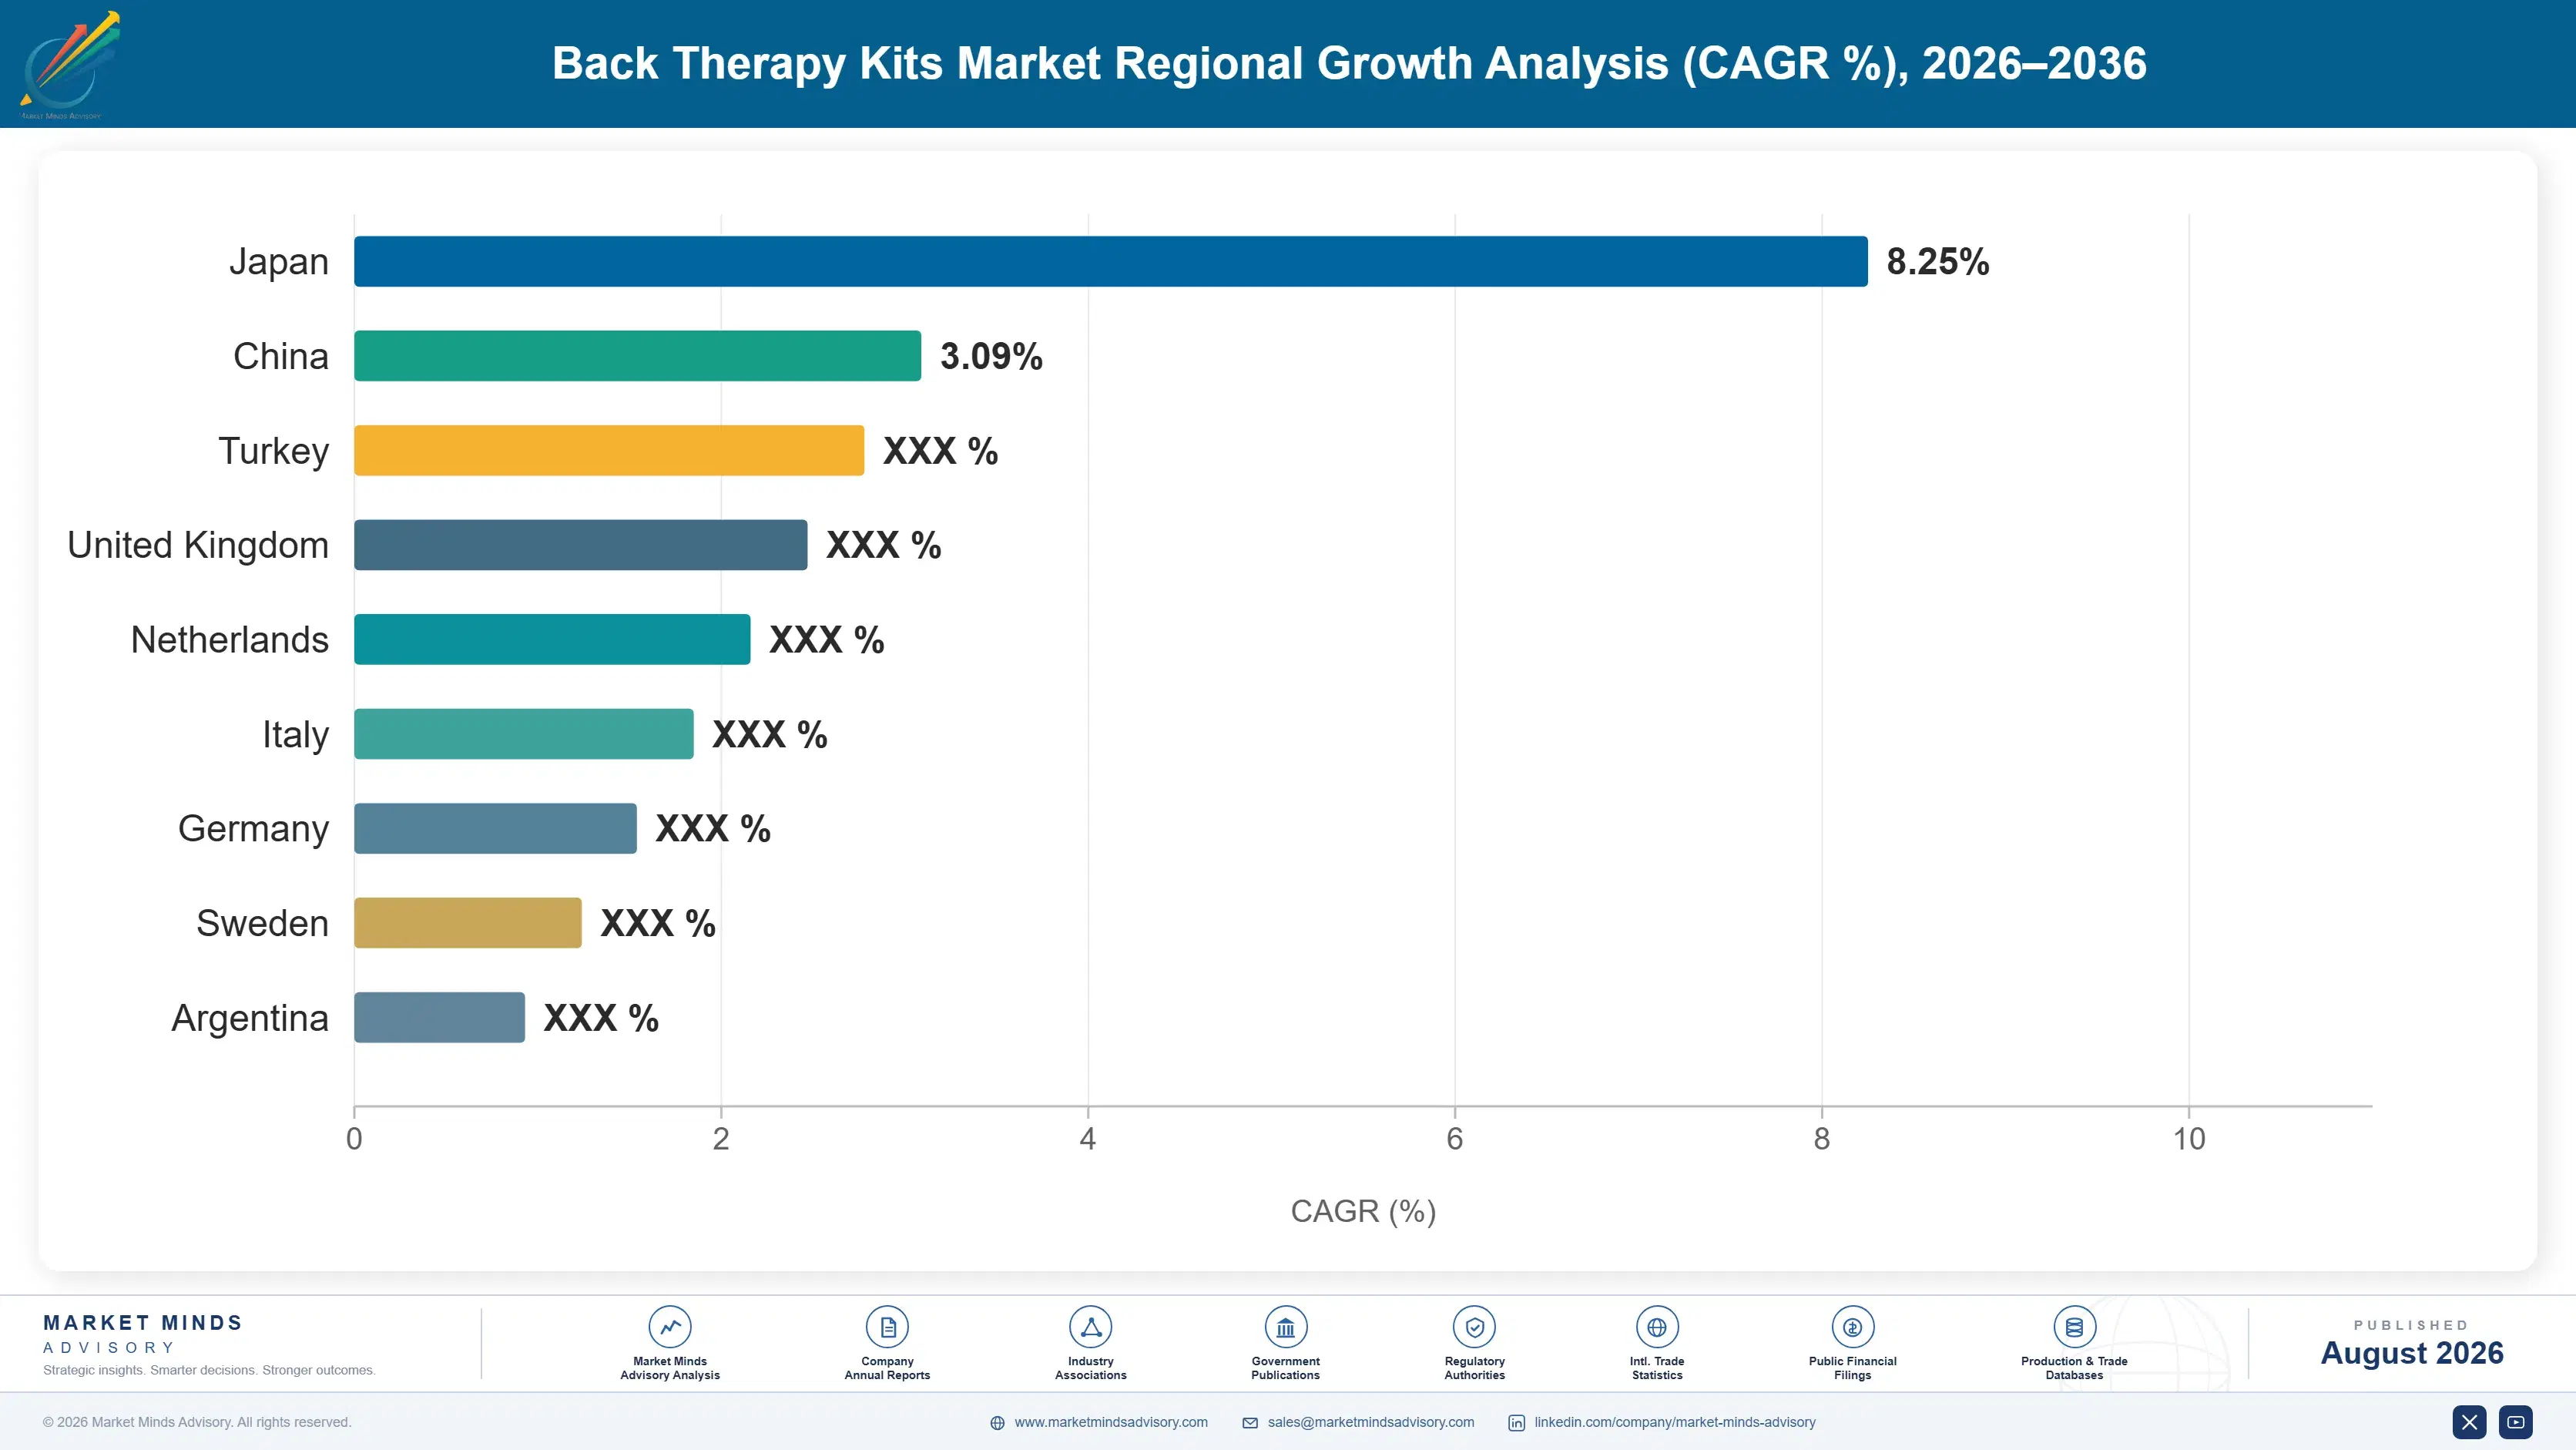
back-therapy-kits-market-country-cagr-analysis-1787304703978

Capturing Margin Beyond the Hardware Sale

Margin in back therapy kits concentrates wherever a manufacturer moves beyond one-time hardware sales into recurring engagement, clinical credibility, or insurance reimbursement relationships that a purely retail-channel competitor cannot easily replicate. Four levers separate share gainers from brands stuck competing purely on price in a crowded retail aisle, undifferentiated from a dozen similar products.

Subscription Bundles for App-Connected TENS Devices

App-connected TENS and EMS devices selling replacement electrode pads and premium app features through subscription bundles carry gross margins of 50% to 58%, well above hardware-only sales, because the recurring accessory revenue compounds across years of ownership rather than ending at the point of sale. Manufacturers that built subscription infrastructure early are capturing this margin premium fastest, since customers rarely switch brands once their pain management routine and stored settings live inside a specific app they trust and have already configured over months of daily use, making switching costs feel meaningfully higher than they actually are.
Market Impact: Adds 50 to 58 points of recurring m

Physician Prescription Pathways Into Insurance Reimbursement

Securing formal physician prescription pathways that qualify kits for insurance reimbursement codes lifts realized average selling price by roughly 25% to 35% compared to identical products sold purely through retail, because insurers reimburse prescribed durable medical equipment at rates retail buyers never see or benefit from directly. Clinics that have built these referral pathways report meaningfully higher customer lifetime value too, since patients using a physician-endorsed kit are more likely to purchase replacement components from the same brand rather than switching to a cheaper unendorsed alternative later in their treatment.
Market Impact: Lifts average selling price 25 to 3

Dedicated Outcomes Studies Building Clinical Trust

Manufacturers investing directly in dedicated outcomes studies and peer-reviewed clinical validation are winning 2 to 3 times more physical therapist referral relationships than competitors without published data, since practices increasingly steer patients toward brands with proven efficacy rather than unverified consumer wellness products lacking any clinical backing whatsoever. That referral advantage compounds over multiple years as clinical trust builds gradually within professional networks, and physical therapists talk to each other constantly about which brands actually deliver results worth recommending to their own patients, colleagues, and wider referral base across a practice.
Market Impact: Wins 2 to 3 times more clinical ref

Direct-to-Consumer E-Commerce Bypassing All Wholesale Retail

Direct-to-consumer e-commerce brands bypassing traditional medical supply retail entirely are capturing customer acquisition cost advantages of roughly 30% to 40% compared to brands relying on wholesale distribution, since they keep the full retail margin and control the customer relationship directly from first purchase through every repeat order that follows for years afterward. These brands typically build strong social media and influencer marketing programs specifically targeting younger buyers who research health products online before ever setting foot in a pharmacy or medical supply store location, valuing peer reviews over traditional advertising entirely.
Market Impact: Cuts acquisition cost by 30 to 40 p

Who Controls the Margin Pool

Five companies hold 29% of revenue on a combined device-and-accessory basis, a modest concentration reflecting how fragmented the direct-to-consumer wellness brand tier remains compared to the established medical device incumbents that dominate reimbursed clinical channels. DJO and Ottobock lead among clinically positioned manufacturers, while the gap to fast-growing consumer brands entering purely through e-commerce is narrower than in most durable medical equipment categories tracked in this s
Current competitive activity centers on three fronts. Established device makers are extending into app-connected TENS hardware rather than ceding that format entirely to consumer electronics brands. Consumer wellness companies are investing in clinical validation studies to open physician referral channels previously closed to them. And several manufacturers are building direct physical therapy practice partnerships to seed credibility before pursuing broader retail distribution at scale.

Pressure is building from two directions that could reshuffle rankings by the early 2030s. Consumer electronics brands with strong app development capability are threatening incumbents whose software experience still trails their hardware quality considerably. Meanwhile manufacturers with genuine clinical outcomes data and physician referral relationships are positioned to capture reimbursed volume that price-only competitors simply cannot access without regulatory investment.
back-therapy-kits-market-company-positioning-matrix-1787304704498

Competitive Moat and Risk Dimensions

DJO LLC (ENOVIS)

Moat: Deep clinical distribution network

DJO's existing relationships across physical therapy practices and orthopedic clinics give it a distribution advantage newer consumer brands cannot easily replicate, since decades of clinical trust translate directly into physician willingness to prescribe DJO kits over unfamiliar competitors entering the category cold with no track record.
DJO LLC (ENOVIS)

Risk: Slower software and app development

DJO's app and connected-device experience trails purpose-built consumer electronics competitors considerably, and younger buyers increasingly expect the smooth-feeling software polish that dedicated technology brands deliver by default rather than as an afterthought bolted onto existing hardware built years earlier for a completely different purpose and customer expectation set.
OTTOBOCK SE & CO. KGAA

Moat: Strong European regulatory position

Ottobock's deep experience navigating European medical device regulation, particularly German statutory insurance requirements, gives it a durable advantage in reimbursed sales channels that newer entrants without equivalent regulatory infrastructure struggle to access quickly, often taking years to replicate from scratch given the depth of documentation and physician relationship building required.
OTTOBOCK SE & CO. KGAA

Risk: Limited direct-to-consumer presence

Ottobock's sales model remains weighted toward clinical and prescription channels rather than direct e-commerce, leaving it exposed to consumer brands capturing younger, self-directed buyers who prefer researching and purchasing online without a physician visit first, a growing share of the overall buyer base each year.

Players Tracked

Prominent Players

DJO LLC (Enovis)
Ottobock SE & Co. KGaA
Omron Healthcare Inc.
Teeter Inc.
iReliev LLC

Other Key Players

Breg Inc.
Bauerfeind AG
Compex (DJO)
TENS 7000 (Roscoe Medical)
iTENS Australia
Chattanooga (DJO)
HoMedics Group
Nayoya Wellness
Truemedic Inc.
Vive Health LLC
InTENSity by Roscoe Medical
Etekcity Corporation
Belifu Health
MedMassager LLC
Cotswold Hive Ltd.

Recent Developments

JANUARY 2025

Ottobock launches app-connected lumbar traction kit in Germany

Ottobock introduced a redesigned lumbar traction kit with integrated app guidance targeting the German statutory insurance reimbursement pathway specifically. The launch included clinical documentation designed to qualify the device under existing physiotherapy prescription codes rather than requiring new regulatory approval or extended review, shortening time to market considerably.
Signal: Established players are engineering produc
MAY 2025

Omron Healthcare acquires consumer TENS device startup

Omron Healthcare acquired a venture-backed consumer TENS device startup known for strong app design and social media marketing reach among younger buyers. The acquisition gives Omron direct-to-consumer digital marketing capability it previously lacked internally across its broader home health device portfolio and retail channels worldwide.
Signal: Established device makers are buying consu
SEPTEMBER 2025

DJO signs multi-year physical therapy network partnership

DJO signed a multi-year partnership agreement with a national physical therapy practice network to become its preferred home-use kit brand across all participating clinic locations nationwide. The agreement includes co-branded patient education materials and a shared outcomes tracking programme launching early next calendar year across every site.
Signal: Clinical referral partnerships are becomin

Battery and Electronics Component Exposure

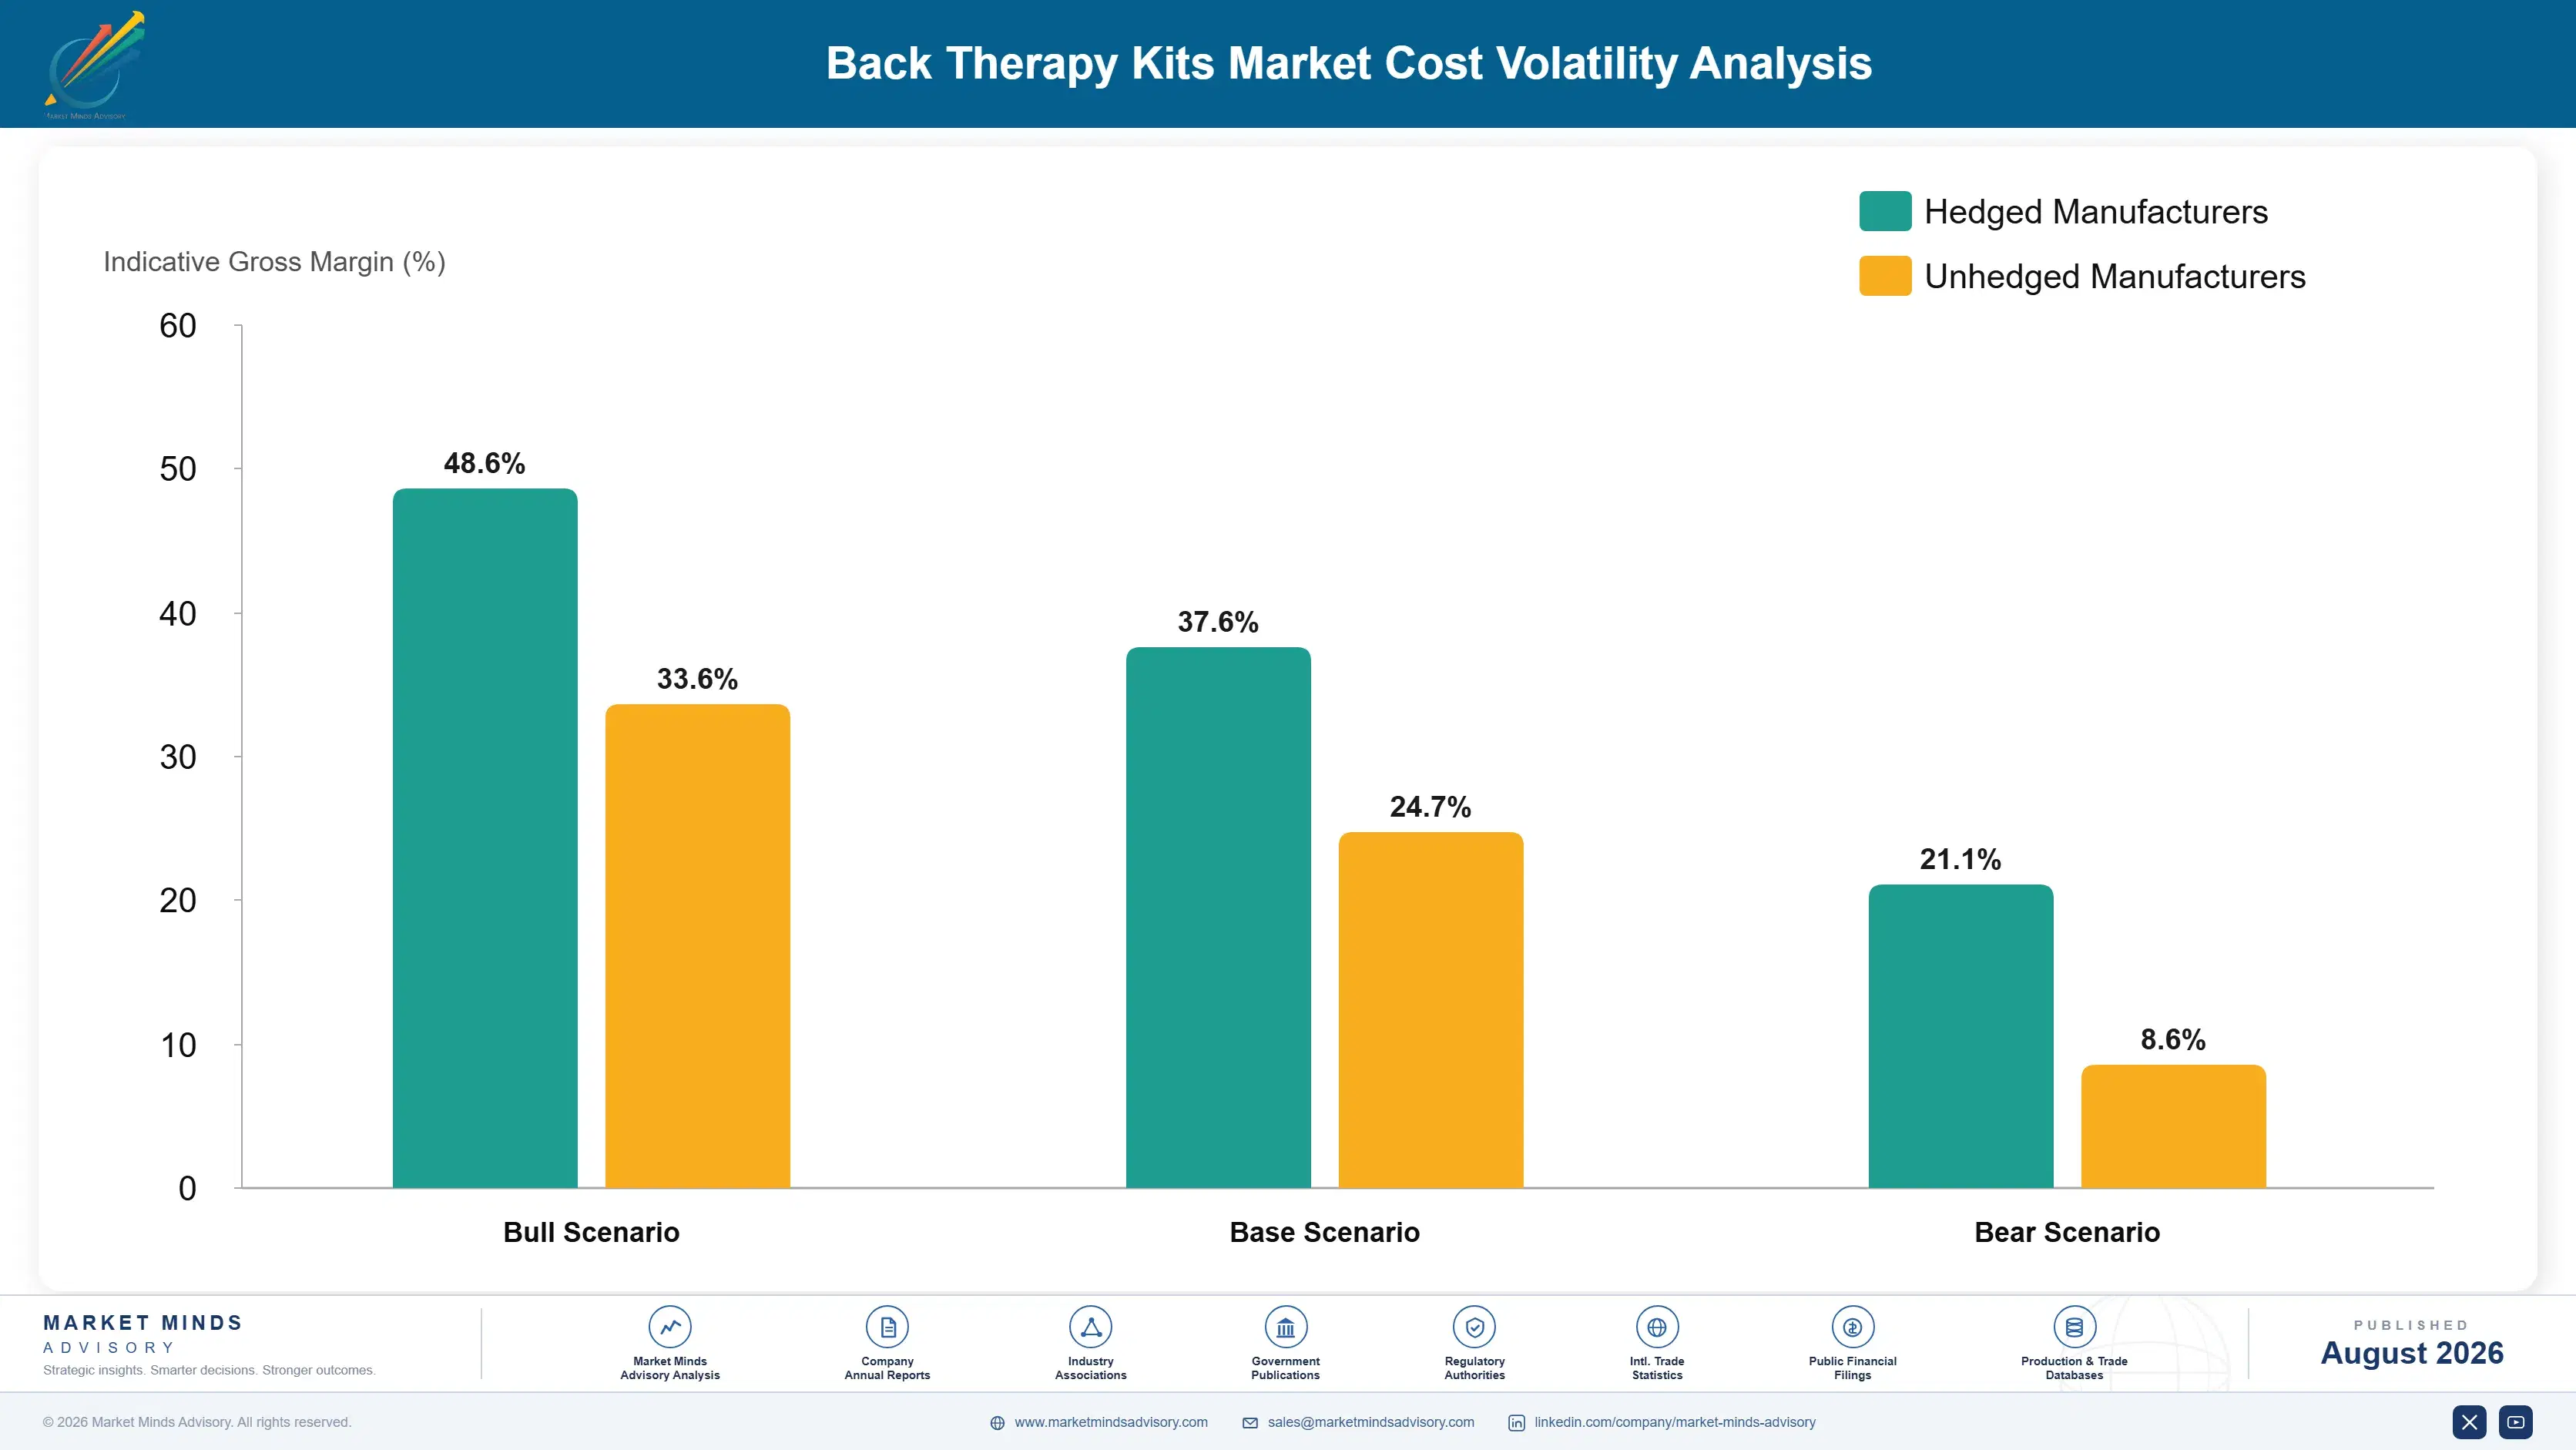
Electronic components and battery cells account for roughly 35% to 45% of cost of goods sold for app-connected TENS devices, while molded plastics and foam padding drive traction and support hardware costs. Electronic components source primarily from East Asian semiconductor and battery supply chains, while plastics and foam source more regionally closer to final assembly locations.
A 2024 lithium-ion battery cell price spike, documented in International Energy Agency battery supply chain reporting, pushed component costs up roughly 14% within two quarters as demand from electric vehicle manufacturing competed directly with consumer electronics for constrained cell capacity. Device makers without long-term battery supply contracts absorbed the increase directly through compressed margins, while several larger manufacturers passed a portion through via modest retail price increases on new product launches.

Large device makers with diversified component sourcing across multiple electronics manufacturers absorb cost volatility more easily than smaller consumer brands dependent on a single contract manufacturer. Traction and support hardware makers face comparatively less exposure to battery pricing but remain sensitive to plastics resin costs, which affect margin less severely than the semiconductor exposure carried by connected-device competitors.
back-therapy-kits-market-cost-volatility-analysis-1787304704696

Multi-source battery cell procurement agreements

Larger device makers are qualifying multiple battery cell suppliers across different manufacturers to reduce exposure to any single producer's capacity constraints, protecting production schedules from disruption when demand spikes elsewhere in the broader economy. Several manufacturers now maintain formal dual-source qualification programmes as standard practice, treating supplier diversification as a design requirement rather than an afterthought.

Forward-hedged component pricing contracts

Locking electronics component pricing several quarters ahead through fixed-price supply agreements shields manufacturers from spot market spikes, though it sacrifices some ability to benefit when component prices fall during periods of oversupply across the broader electronics industry. Larger manufacturers with stronger balance sheets generally hedge a greater share of annual component volume than smaller competitors can afford to commit.

Regional plastics sourcing near assembly sites

Sourcing molded plastics and foam components from suppliers located near final assembly facilities reduces shipping cost and lead time exposure, insulating traction and support hardware margins from the freight volatility that affects globally sourced electronic components more heavily. This regional sourcing approach also shortens new product development cycles by reducing the logistics coordination required across distant time zones and suppliers.

Portfolio Architecture for Margin Defence

Manufacturer portfolios split across three tiers with distinct margin economics. Volume commodity-adjacent single-function devices anchor unit volume at modest margins, premium certified kits combining multiple modalities capture materially higher margins on lower unit counts, and next-generation app-connected subscription devices sit at the top of the pyramid where recurring revenue is still building steadily.
The tension between volume and premium tiers shapes how manufacturers allocate development budget. Standard single-function devices still account for the bulk of unit sales and anchor retail shelf presence, but margin has compressed as unregulated consumer brands compete purely on price. Premium bundled kits and subscription-connected devices carry the margin upside, which is why leading manufacturers keep shifting research spending toward these tiers even as unit volume growth in the commodity tier slows considerably.

High-value margin pools concentrate most heavily in physician-endorsed reimbursed kits and app-connected subscription devices sold through both clinical referral and premium retail channels. Volume core single-function devices remain the largest unit base today, but their share of total category profit keeps shrinking as reimbursed and subscription-connected products capture a disproportionate share of margin dollars relative to unit count.

Volume / Commodity-Adjacent Tier

Standard single-function TENS units and basic support braces sold through mass retail and online marketplaces at high volume and modest per-unit margin nationwide, anchoring most brand awareness even though repeat-purchase loyalty stays comparatively weak across this tier.
Gross Margin: 18-26%

Premium / Certified Tier

Physician-endorsed bundled kits carrying insurance reimbursement eligibility, sold at meaningfully higher price points than identical unendorsed retail products lacking any clinical backing, appealing to patients seeking documented, credentialed treatment pathways.
Gross Margin: 33-40%

Sustainability / Regulatory / Next-Generation Tier

App-connected devices with subscription accessory and premium feature revenue, sold on a recurring engagement model at the category's richest and most durable margin, increasingly the focus of new product development budgets.
Gross Margin: 48-58%
back-therapy-kits-market-portfolio-architecture-1787304705193

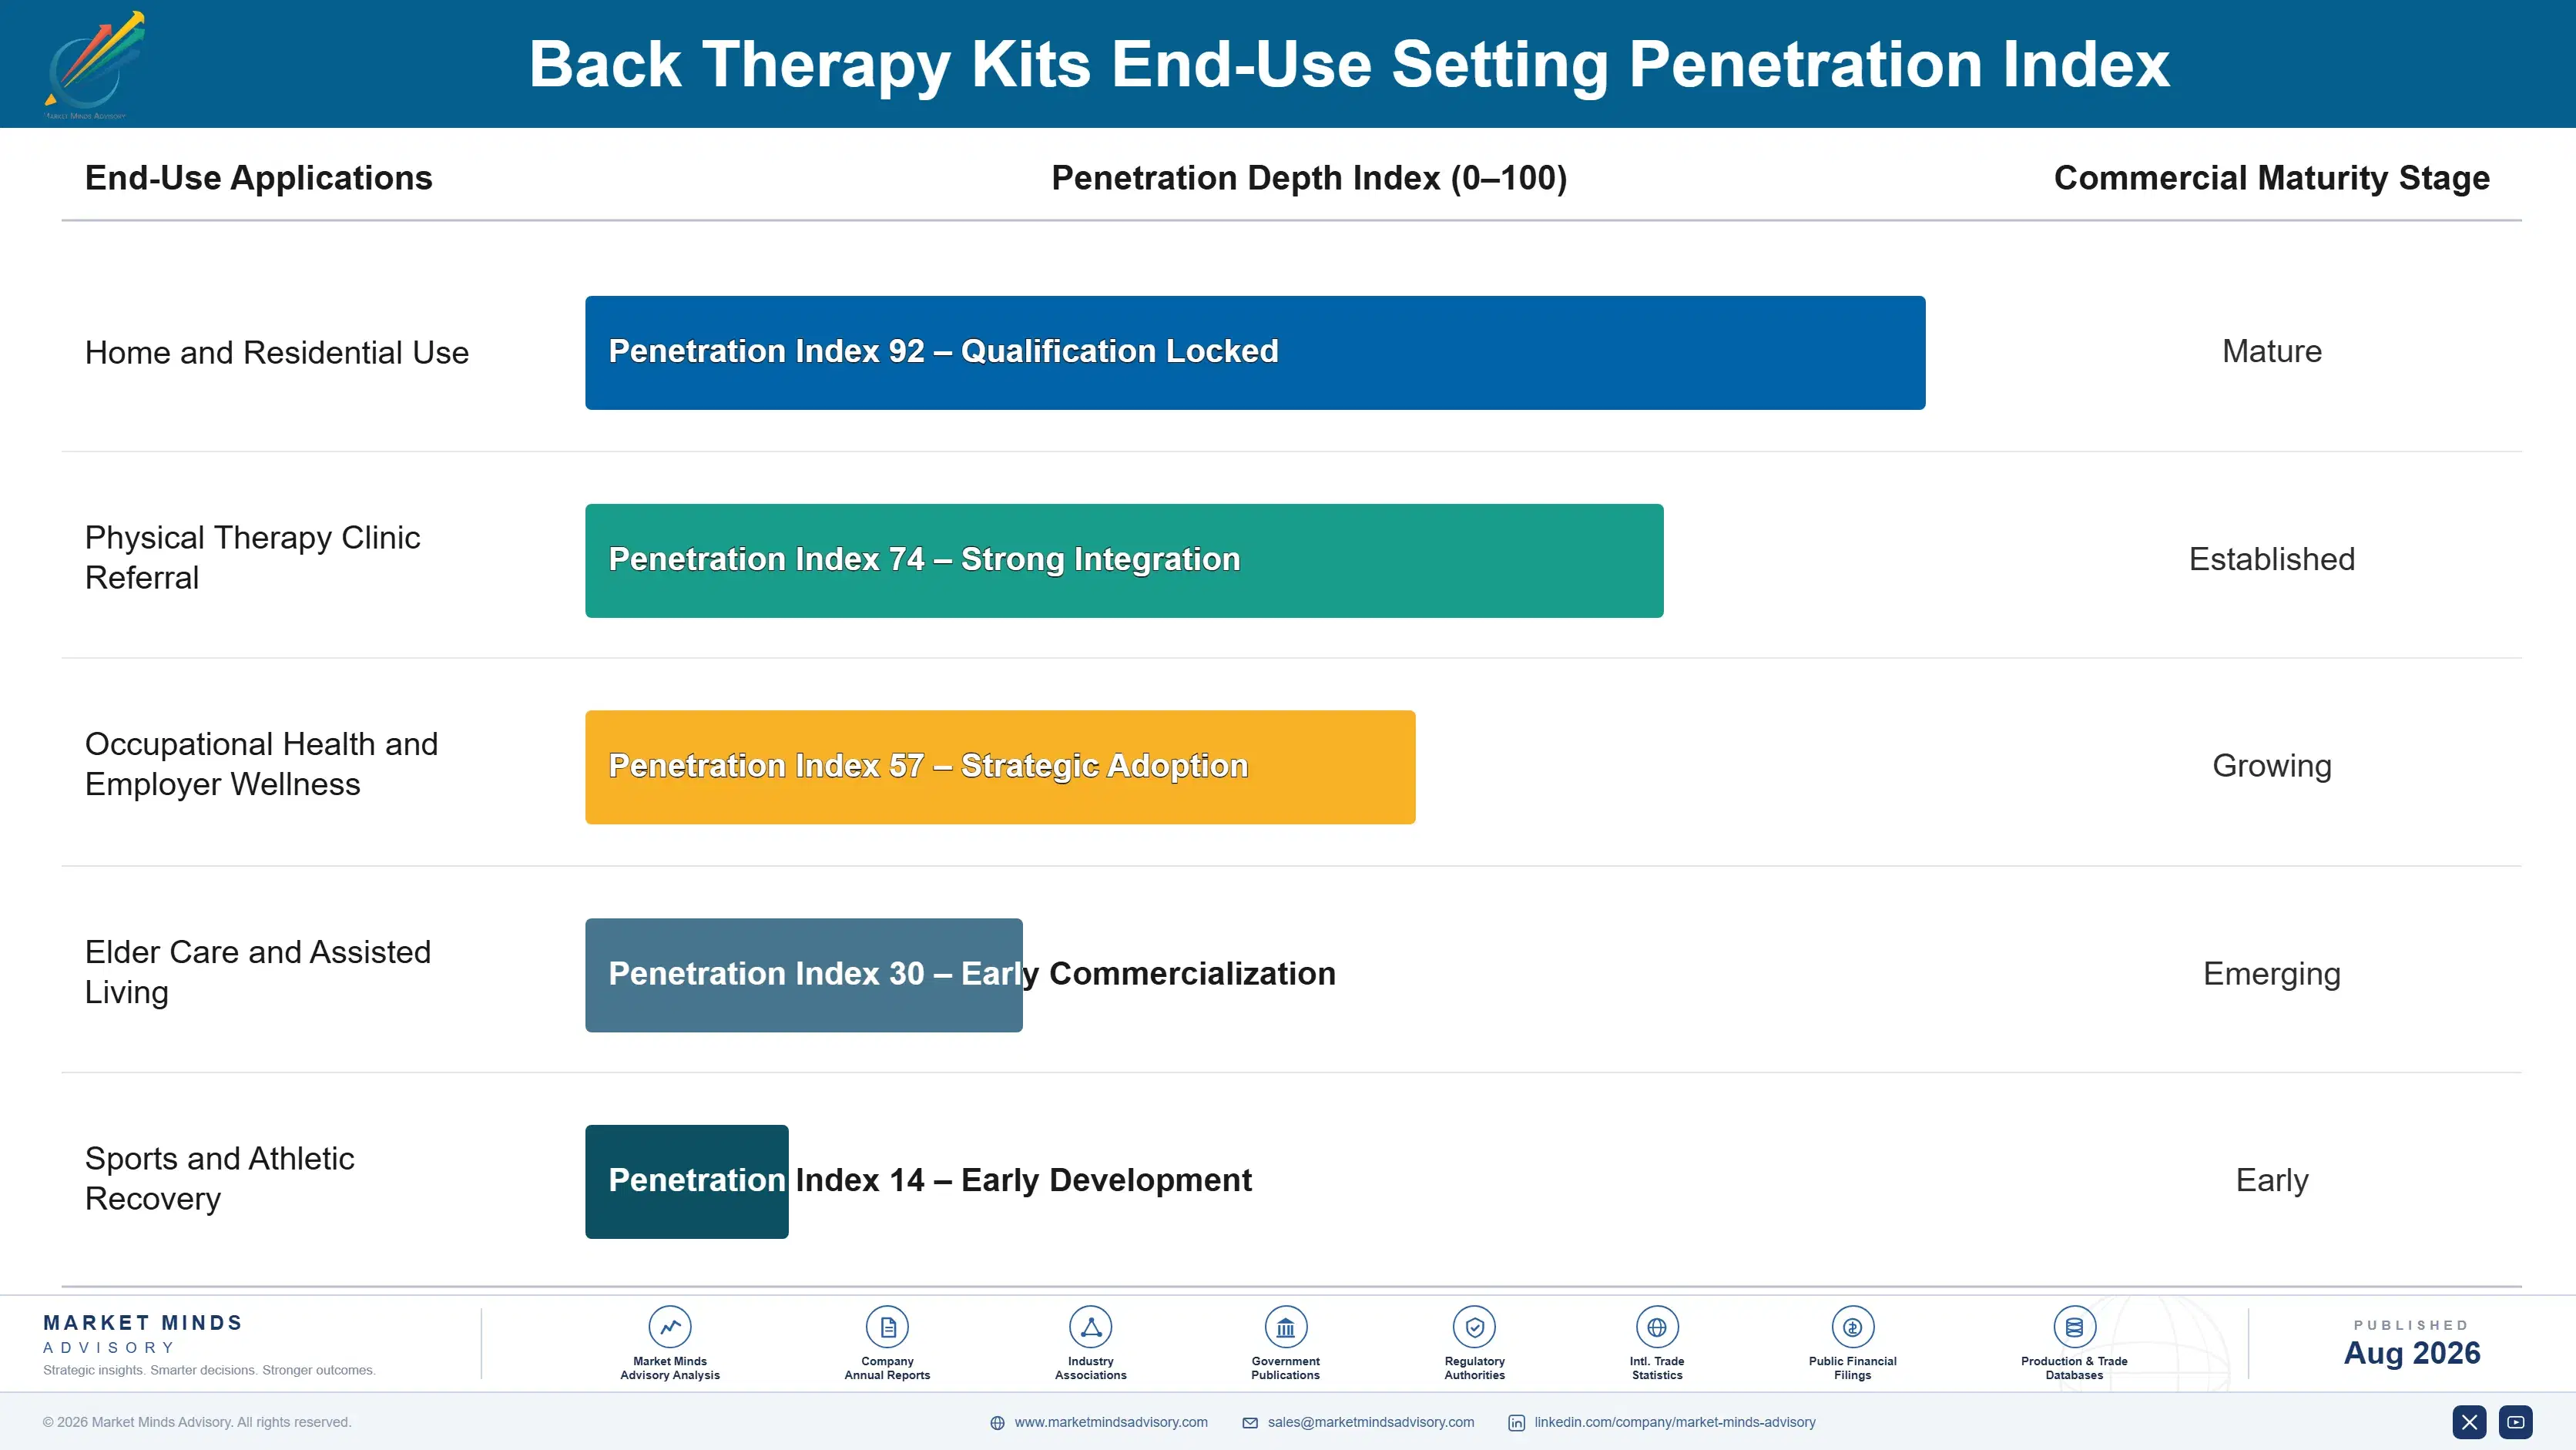
A Recurring Routine, Not One Sale

Back therapy kits function closer to a recurring health management routine than a one-time purchase, since chronic back pain rarely resolves permanently and most buyers eventually need replacement components or upgraded devices. That annuity character underpins manufacturer revenue: a customer who trusts one brand's app and settings tends to buy replacement electrode pads and accessories from that same brand for years.
Adoption depth varies meaningfully by end-use vertical. Office workers with chronic desk-related discomfort drive the largest volume base, typically starting with basic single-function devices before upgrading to bundled kits as symptoms persist. Post-surgical and post-physical-therapy patients show the deepest engagement with premium reimbursed kits, since their treatment is clinically guided and insurance-supported rather than self-directed, making them far more likely to follow a full multi-device protocol consistently.

Generational buyer shifts are reshaping how customers engage with the category over the long run. Younger buyers raised on connected consumer electronics increasingly expect app integration and data tracking as a default feature rather than a premium add-on, breaking from an older generation's comfort with simple mechanical devices. That shift compounds as younger cohorts age into higher chronic pain prevalence over the coming decade.
back-therapy-kits-market-end-use-penetration-index-1787304705682

Where Manufacturers Should Move Next

These are among the four positions where our research anticipates prominent divergence between winners and laggards over the coming forecast period. Each is grounded in the demand model, the regulatory perimeter, and the announced capacity pipeline.
01 / SUBSCRIPTION REVENUE INVESTMENT

Build recurring engagement infrastructure before competitors do

Subscription and accessory revenue is no longer optional for connected devices; it is the fastest path to durable margin in a category where hardware alone gets commoditized quickly by cheaper competitors entering through e-commerce. Manufacturers still selling app-connected TENS units as one-time hardware purchases rather than ongoing engagement platforms are leaving recurring revenue entirely on the table with every single sale they make. The window to build subscription infrastructure before every major competitor has one of its own is narrowing each product cycle that passes without meaningful investment.
02 / REIMBURSEMENT PATHWAY STRATEGY

Invest in physician prescription pathways for higher ASPs

Physician prescription pathways into insurance reimbursement capture meaningfully higher average selling prices than retail-only distribution, and that gap will keep widening as more insurers formalize durable medical equipment coverage criteria for back pain devices specifically over the coming years. Manufacturers still selling purely through retail are leaving reimbursement revenue on the table with every transaction, and they are ceding the clinical credibility that drives long-run brand loyalty among patients and referring physicians alike. Building these pathways takes years, which is exactly why starting now matters more than it might seem.
03 / CLINICAL EVIDENCE BUILDING

Fund outcomes studies to win physical therapist trust

Clinical outcomes data is shifting from a nice-to-have marketing asset into a genuine competitive moat as physical therapists grow more selective about which brands they recommend to their own patients and professional networks. Manufacturers without published efficacy data risk losing referral relationships entirely to competitors who invested early in outcomes studies, and that referral advantage compounds over years as trust builds within tight-knit clinical communities that talk to each other constantly. This is a multi-year investment, not a quick marketing fix.
04 / COMPONENT SOURCING RESILIENCE

Diversify battery and electronics sourcing ahead of volatility

Battery and electronics component volatility will keep pressuring margin for any manufacturer without diversified sourcing beyond a single contract manufacturer relationship they depend on entirely. Companies building multi-source procurement and forward-hedged pricing agreements are insulating themselves from cost spikes that smaller, single-source competitors cannot absorb as easily given thinner balance sheets and less negotiating leverage with suppliers. This is a supply chain discipline question, not a demand question, and it will separate resilient margins from volatile ones over the next several years of continued component price swings.

Engagement Snapshot From the Field

A live engagement with an industry participant carrying material or product regulatory and market exposure ahead of a defining policy shift, showing how our research translates into a defensible multi-year portfolio strategy.
MARKET MINDS ADVISORY · CLIENT ENGAGEMENT SUMMARY
Back Therapy Kits Producer Strategic Portfolio Review and Transition Roadmap 2026·Investment Scenario on Back Therapy Kits Exposure Evaluation 2025-26
CLIENT PROFILE
The client is a mid-sized consumer health device manufacturer with roughly $65 million in annual revenue (client-reported, unverified by MMA), historically selling single-function TENS units through mass retail and online marketplaces without any physician referral relationships or clinical validation studies supporting its product claims to date. The company had no dedicated clinical affairs function prior to this engagement.
STRATEGIC CHALLENGE
Two larger competitors had recently launched physician-endorsed reimbursed kits and were capturing meaningful share of the client's core retail customer base, who increasingly preferred insurance-covered alternatives. The client lacked both the clinical outcomes data and the prescription pathway infrastructure needed to compete for reimbursed sales within its existing retail-only distribution model.
MMA APPROACH
MMA conducted primary interviews with physical therapy practice administrators and benchmarked the client's product claims against three competitors already operating reimbursed kit programmes in the same national market. The engagement mapped a phased path to clinical validation and prescription pathway development built around the client's existing manufacturing footprint and product line.
KEY FINDINGS
  1. Physical therapy practices ranked published clinical outcomes data as their top criterion for recommending a home therapy brand to their own patients.
  2. Physician-prescribed reimbursed kits could command a 28% higher average selling price compared to the client's existing retail-only product line and channel mix.
  3. Two of three benchmarked competitors had multi-year exclusive practice network partnerships already locked in place across major metro markets nationwide and abroad.
  4. A phased single-product clinical study reduced upfront research investment by roughly 45% compared to validating the client's entire product line at once.
CLIENT PROFILE
The client is a mid-sized consumer health device manufacturer with roughly $65 million in annual revenue (client-reported, unverified by MMA), historically selling single-function TENS units through mass retail and online marketplaces without any physician referral relationships or clinical validation studies supporting its product claims to date. The company had no dedicated clinical affairs function prior to this engagement.
STRATEGIC CHALLENGE
Two larger competitors had recently launched physician-endorsed reimbursed kits and were capturing meaningful share of the client's core retail customer base, who increasingly preferred insurance-covered alternatives. The client lacked both the clinical outcomes data and the prescription pathway infrastructure needed to compete for reimbursed sales within its existing retail-only distribution model.
MMA APPROACH
MMA conducted primary interviews with physical therapy practice administrators and benchmarked the client's product claims against three competitors already operating reimbursed kit programmes in the same national market. The engagement mapped a phased path to clinical validation and prescription pathway development built around the client's existing manufacturing footprint and product line.
KEY FINDINGS
  1. Physical therapy practices ranked published clinical outcomes data as their top criterion for recommending a home therapy brand to their own patients.
  2. Physician-prescribed reimbursed kits could command a 28% higher average selling price compared to the client's existing retail-only product line and channel mix.
  3. Two of three benchmarked competitors had multi-year exclusive practice network partnerships already locked in place across major metro markets nationwide and abroad.
  4. A phased single-product clinical study reduced upfront research investment by roughly 45% compared to validating the client's entire product line at once.
RECOMMENDED STRATEGY
Phase 1: Phase 1 (Months 1 to 4): Commission a clinical outcomes study for the client's flagship TENS product with an independent research partner. Phase 2: Phase 2 (Months 5 to 10): Build physician prescription documentation and formally submit for durable medical equipment reimbursement approval codes. Phase 3: Phase 3 (Months 11 to 18): Launch targeted physical therapy practice partnerships in two metro markets based on validated study results.
OUTCOME
The client secured reimbursement coding approval and reported a 19% increase in average selling price across its flagship product line within fourteen months (client-reported, unverified by MMA). Physical therapy practice referral volume grew from a negligible base to roughly 8% of total unit sales during the same period (client-reported, unverified by MMA).

Frequently Asked Questions

Foundational context covering the market sizes, CAGR, scope, country, region and competition that inform every finding below. This section is provided to cover basics and most often pre-purchase conversations, answered from the MMA Primary Research Dataset.

What is the current size of the Back Therapy Kits Market?

The global back therapy kits market was valued at $2.9 billion in 2025. Growth is driven by rising sedentary lifestyle prevalence and expanding at-home rehabilitation adoption.

How large will the Back Therapy Kits Market be by 2036?

The market is forecast to reach $6.49 billion by 2036, up from $3.12 billion in 2026. That represents a 2.08 times expansion over the forecast decade.

What is the CAGR for the Back Therapy Kits Market 2026 to 2036?

The base case CAGR is 7.6% annually through the forecast period, with a bull scenario of 8.9% and a bear scenario of 6.3% depending on reimbursement expansion.

Which segment is growing fastest?

App-connected TENS and EMS devices are growing fastest at a 13.2% CAGR, roughly 1.7 times the overall market rate, driven by subscription and accessory revenue models.

Who are the major companies in the Back Therapy Kits Market?

Leading companies include DJO (Enovis), Ottobock, Omron Healthcare, Teeter, and iReliev, together holding 29% of revenue on a combined device-and-accessory basis across the whole category.

Which country is growing fastest?

China is growing fastest at an 11.4% CAGR, driven by expanding domestic manufacturing scale and rising urban sedentary lifestyle prevalence across every major city nationwide.

Report Segmentation Architecture

The full report scope spans multiple orthogonal segmentation dimensions, with cross-tabulated demand data provided for each dimension pair. Coverage extends further to regional breakdowns, trend trajectories, and the competitive detail needed to support segment-level decision-making.

By Device Modality

  • Lumbar Traction Devices
  • App-Connected TENS and EMS Devices
  • Posture Correction and Support Braces
  • Heat and Cold Therapy Devices
  • Inversion and Decompression Devices
  • Ergonomic Seating and Cushioning Accessories

By End-Use Setting

  • Home and Residential Use
  • Physical Therapy Clinic Referral
  • Occupational Health and Employer Wellness
  • Elder Care and Assisted Living
  • Sports and Athletic Recovery

By Commercial Dimension

  • Insurance-Reimbursed Prescribed Sales
  • Direct-to-Consumer Retail
  • Physician and Clinic Prescribed Sales
  • Subscription and Accessory Revenue

By Region

  • North America
  • Western Europe
  • East Asia
  • South Asia and Pacific
  • Latin America
  • Middle East and Africa
  • Eastern Europe

Scope, Methodology, and Coverage

Every figure in this report is reproducible from documented input assumptions. The scope below maps the historical period, the forecast horizon, the segmentation dimensions, and the countries covered, alongside the underlying primary and qualitative methodology.
Historical Period
2020 to 2025
Forecast Period
2026 to 2036
Base Year
2025 (USD billions; MMA Primary Research Dataset, August 2026)
Market Definition
The back therapy kits market comprises home-use bundled devices combining traction, electrical stimulation, heat, and posture support for non-surgical back pain management. It excludes standalone clinical equipment used only in supervised settings and surgical spinal implants.
Quantitative Units
USD billions (current prices); unit volume in millions where cited
Segmentation Dimensions
By Device Modality; By End-Use Setting; By Commercial Dimension; By Region
Regions Covered
North America, Western Europe, East Asia, South Asia and Pacific, Latin America, Middle East and Africa, Eastern Europe
Countries Covered
USA, China, Germany, France, UK, Japan, South Korea, India, Australia, Canada, Brazil, Mexico, Indonesia, Vietnam, Thailand, Malaysia, UAE, Saudi Arabia, South Africa, Nigeria, Turkey, Poland, Netherlands, Italy, Spain, Sweden, Switzerland, Argentina, Colombia, Singapore, and additional markets relevant to this sector
Key Companies Profiled
DJO LLC (Enovis), Ottobock SE & Co. KGaA, Omron Healthcare Inc., Teeter Inc., iReliev LLC, Breg Inc., Bauerfeind AG, Compex (DJO), TENS 7000 (Roscoe Medical), iTENS Australia, Chattanooga (DJO), HoMedics Group, Nayoya Wellness, Truemedic Inc., Vive Health LLC, InTENSity by Roscoe Medical, Etekcity Corporation, Belifu Health, MedMassager LLC, Cotswold Hive Ltd.
Quantitative Methodology
Primary survey, n=3,800 respondents, Q4 2025, six countries; demand-side model with trade association cross-validation
Qualitative Methodology
47 expert interviews, Q4 2025; applied to validate demand model assumptions, identify emerging dynamics, and assess competitive positioning
Report Format
PDF and XLSX data workbook (Word format preview document)
Publisher
Market Minds Advisory
Report Code
MMA-2026-MED-142
Published
August 2026
Contact
sales@marketmindsadvisory.com | www.marketmindsadvisory.com

Purchase the full Back Therapy Kits Market Report (2026 to 2036).

The full Back Therapy Kits Market report delivers a complete quantitative and qualitative assessment covering sizing, segmentation, and regional forecasts through 2036 across all seven world regions. It includes detailed competitive profiling of all twenty companies named in this summary, battery and electronics component cost risk analysis, and portfolio margin benchmarking across three product tiers. Primary research draws on a 3,800-respondent household survey spanning six countries and 47 expert interviews conducted in Q4 2025. The report is designed for strategy, product development, and commercial teams evaluating reimbursement and channel investment decisions.
Full seven-region market sizing and forecast
Twenty-company competitive benchmarking and profile analysis
Battery and electronics component cost risk analysis
Three-tier portfolio margin economics breakdown by segment
Primary survey data across six countries
Segment-level growth, CAGR, and margin detail

Built For The People Who Decide

From boardroom strategy to bench-side execution, this report is read cover-to-cover by leaders shaping the next decade of their industry, turning demand scenarios, market dynamics and valuation benchmarks into decisions.
CXOs/ Presidents/ VPs/ Managers
M&A and Corporate Development
Strategy Teams and R&D Heads
Procurement and Product Directors
Regulatory and Compliance Leaders
Investor Relations and Equity Analysts