Market Minds Advisory
X-Ray Photoelectron Spectroscopy (XPS) Market

X-Ray Photoelectron Spectroscopy (XPS) Market: Ten Nanometres Under Ultra-High Vacuum

The technique sees roughly ten nanometres and needs fourteen hours of pumping to see them, which decides everything about who buys these instruments and what they are willing to pay.

Lead Analyst

Published

September 2026

Make Smarter Decisions with Customized Research Insights

Request a free sample report and evaluate market opportunities, growth trends, and competitive dynamics relevant to your business needs.

2025 MARKET VALUE$0.7BMarket Size 2025
2036 FORECAST VALUE$1.5BBase Case , 2026 to 2036
CAGR 2026 TO 20367.0 %Bull 8.2% / Bear 5.8%
INCREMENTAL OPPORTUNITY$0.7BNet 10- year value creation
EXPANSION MULTIPLE1.96x2036 value over 2026 base
Strategic Levers
M&A Pipeline
Regional Outlook
Country Rankings
Competitive Intelligence
Segmental Deep-dive
Call-Us : 91 93563 13602

Executive Snapshot and Market Trajectory

This technique measures the outer ten nanometres of a surface and nothing beneath them. That limitation is also its entire purpose, since surface chemistry decides adhesion, corrosion, catalysis and how an atomic-layer film behaves in a transistor. Nothing else measures exactly that layer directly.
East Asia takes 30% of value, leading because advanced semiconductor fabs across Taiwan, Korea, China and Japan have moved the instrument from a research bench toward process control, and because three of the significant manufacturers are Japanese. Semiconductor metrology systems grow at 10.5%, half again the market rate of 7.0%, and they are a different product from the research instrument entirely. Research laboratory systems meanwhile grow at less than half of that pace entirely.
Concentration reaches 76%, among the highest in analytical instrumentation, because building an ultra-high vacuum spectrometer is genuinely difficult. Instruments last around 22 years, so 41% of category revenue comes from service and upgrades rather than from new systems, which is not how anybody sells them. Roughly 38% of published spectra carry peak assignments that reviewers later dispute, which is a credibility problem the whole field quietly carries around with it.
Market Definition
The market covers X-ray photoelectron spectroscopy instruments, components, consumables and associated services, spanning research laboratory XPS systems, semiconductor metrology XPS systems, ambient pressure and in-situ XPS systems, detectors analysers and source upgrades, consumables vacuum components and spares, and data analysis software with peak fitting services. Other surface analysis techniques including Auger and secondary ion mass spectrometry, electron microscopy, synchrotron beamline instrumentation, and general laboratory vacuum equipment sold outside this application are excluded from scope.
Base Year Value
$0.7B in 2025 (MMA Primary Research Dataset, August 2026)
Forecast Period
2026 to 2036, eleven discrete annual values
CAGR
7.0% base case. Bull 8.2%. Bear 5.8%.
Fastest Growth Segment
Semiconductor Metrology XPS Systems: 10.5% CAGR
Fastest Growth Country
India: 9.0% CAGR
Fastest Growth Region
South Asia and Pacific: 9.2% CAGR
Largest Region
East Asia: 30% of 2025 global value
Market Leaders
Thermo Fisher Scientific, Kratos Analytical, ULVAC-PHI, JEOL, Scienta Omicron. Source: MMA Analysis based on disclosed surface analysis instrument and service revenue, company annual reports 2025.
Primary Survey
n=3,800 procurement and R&D decision-makers, Q4 2025, six countries
Methodology
Demand-side build-up, cross-validated against public data, 47 expert interviews

X-Ray Photoelectron Spectroscopy (XPS) Market Forecast Scenarios

x-ray-photoelectron-spectroscopy-xps-market-size-forecast-scenario-1787716010262
Growth from 2020 to 2025 ran at 5.8% and the customer changed underneath it. Academic and government laboratory purchasing stayed roughly flat against research budgets that did not expand, while semiconductor manufacturers began specifying surface chemistry metrology into process control for atomic-layer deposition and high-permittivity gate stacks. A category that had sold to professors for forty years started selling to fabs, and the two buyers want quite different machines.
The 7.0% base case rests on three mechanisms. Semiconductor metrology demand keeps growing as film thicknesses approach the sampling depth of the technique itself. Ambient pressure and in-situ systems keep expanding catalysis and battery research into conditions ultra-high vacuum never permitted. And Asian materials research capacity keeps building, particularly across Chinese and Indian institutions equipping laboratories that had no surface analysis capability whatsoever. None of the three depends on a better analyser.
The bull case at 8.2% assumes fab process control adoption broadens beyond leading-edge nodes into wider manufacturing use, which would change unit volumes materially. The bear case at 5.8% is research budgets staying flat while a 22 year installed base absorbs demand through upgrades rather than replacement, which produces revenue at service margins instead of instrument ones.

Vacuum, Depth And Interpretation

Two physical constraints define this entire market. The technique detects photoelectrons escaping from roughly the outer ten nanometres, so it answers questions about surfaces and none at all about bulk material. And it requires ultra-high vacuum, because those photoelectrons must reach the analyser without colliding with anything, which means about fourteen hours of pumping and an instrument that cannot examine anything wet or volatile.
FIVE-FIRM CONCENTRATION76%Share of category revenue held by the largest instrument makers
SAMPLING DEPTH10 nmDepth of material the technique can actually see
PUMP-DOWN TIME14 hoursTime to reach operating vacuum from atmospheric pressure
INSTRUMENT SERVICE LIFE22 yearsYears a system remains in productive laboratory use
SERVICE REVENUE SHARE41%Category revenue from support rather than new systems
PUBLISHED SPECTRA ERROR RATE38%Papers reporting peak assignments that reviewers later dispute
The buyer changed and most suppliers are still catching up. For forty years this was a research instrument sold to professors on capability. Semiconductor manufacturers now specify it into process control, because atomic-layer films and gate dielectric interfaces sit precisely within the sampling depth, and a fab wants throughput, automation and uptime rather than flexibility. Those are different machines, and a research system will not do fab work.
Then there is the awkward matter of interpretation. A spectrum is fitted to component peaks by an operator making judgements about lineshape, background and chemical assignment, and roughly 38% of published spectra carry assignments that reviewers subsequently dispute. The instrument records the data correctly and the conclusion may still be wrong. That places real commercial value in software, databases and training that instrument makers treat as afterthoughts.
"You can buy the best spectrometer ever built and still publish nonsense, because the hard part happens after the measurement. Nobody sells a peak fitting course, and somebody probably should."
Director, Analytical Instrumentation Practice · MMA Analytical and Surface Science Instrumentation Practice · August 2026

Market Trends

Fab Metrology Turns A Research Tool Industrial

Atomic-layer deposition films and gate dielectric interfaces sit within the ten nanometre sampling depth, which makes surface chemistry a process control parameter rather than a research curiosity. Growth at 10.5% follows fab adoption directly. What a fab wants is throughput, automation, wafer handling and uptime measured in months, none of which a research instrument was designed to deliver. Suppliers who built a separate product line for this are winning it, and those adapting research systems mostly are not. Fab qualification cycles run for years and close the position to whoever arrives late.
Market Impact: Generates 41% from service revenue

Ambient Pressure Systems Escape The Vacuum Constraint

Differentially pumped analysers now permit measurement at millibar pressures rather than ultra-high vacuum, which opens catalysis under working conditions, battery interfaces and electrochemistry that the technique simply could not reach before. Growth at 9.0% follows that expansion of what is measurable at all. The engineering is genuinely difficult and the systems cost considerably more, which confines them to well-funded research groups and a small number of industrial catalysis laboratories worldwide. Signal intensity falls sharply with pressure, so the practical operating window is considerably narrower than any specification sheet suggests it will be.
Market Impact: Grows India fastest at 9.0%

Market Opportunities and Growth Drivers

Installed Base Of Twenty-Two Years Funds Everything

These instruments remain productive for around 22 years, so the installed base vastly exceeds annual shipments and 41% of category revenue comes from service contracts, detector upgrades, source replacements and software rather than from new systems. Laboratories retrofit rather than replace because a chamber and analyser age slowly while electronics and detectors do not. Suppliers organised around instrument sales consistently underinvest in the half of their revenue that actually recurs. A supplier without an aftermarket commercial function is leaving half its own revenue to arrive by accident rather than by design.
Market Impact: Requires 14 hours pumping down

Asian Research Capacity Equips From Nothing

Chinese and Indian universities and national institutes are commissioning surface analysis laboratories that previously had no capability at all, frequently as part of materials and energy research programmes with dedicated equipment funding. India grows fastest of any country at 9.0%. First-time buyers behave differently from replacement buyers, weighing training, applications support and local service far above specification, because nobody in the building has operated one of these instruments before. Applications training and local engineer availability decide these purchases far more often than any published specification comparison ever quite manages to.
Market Impact: Disputes 38% of published assignments

Market Restraints and Challenges

Ultra-High Vacuum Excludes Most Interesting Samples

Anything wet, volatile, biological or outgassing cannot enter the chamber, and reaching operating vacuum takes roughly fourteen hours from atmosphere, which caps throughput regardless of how fast the analyser is. Root cause is that photoelectrons collide with gas molecules and never reach the detector. Commercial impact is a technique excluded from whole application areas. Mitigation runs through ambient pressure systems and better load-lock design, which improves throughput more than analyser performance ever does. Users judge these instruments by samples per week, and suppliers persist in competing on counts per second.
Market Impact: Measures films within 10 nanometres

Interpretation Errors Undermine Confidence In Results

Peak fitting involves operator judgement about lineshape, background subtraction and chemical assignment, and roughly 38% of published spectra carry assignments that reviewers later dispute. Root cause is that the technique is taught as instrument operation rather than as data interpretation. Commercial impact is a credibility problem the whole field carries. Mitigation involves reference databases, guided fitting software and genuine training, which a few suppliers now provide and most still do not. The instrument records the data perfectly well and the published conclusion can still turn out entirely wrong afterwards anyway.
Market Impact: Operates above 1 millibar pressure
3 additional market trends, 2 additional growth drivers, and 4 additional restraints and challenges are covered in the full report. Contact sales@marketmindsadvisory.com to access the complete intelligence.

Segment CAGR and Growth Architecture

Segmentation follows system and product type: what is being sold, whether an instrument, a component, a consumable or an interpretation service. Six categories cover the market without overlap. Application field, customer type and funding source are treated as separate commercial dimensions throughout this report rather than as segmentation logic in their own right entirely.
x-ray-photoelectron-spectroscopy-xps-market-market-share-analysis-1787716010545

Semiconductor Metrology XPS Systems

Fab-configured systems with wafer handling, automation and process control integration grow at 10.5%, half again the market rate of 7.0%, because atomic-layer films and gate dielectric interfaces sit precisely within the ten nanometre sampling depth the technique offers. A fab values throughput, uptime measured in months and repeatability across shifts, none of which a research instrument was ever designed around. Suppliers who built a dedicated line are taking this segment, while those adapting research systems find that automation and cleanroom compatibility cannot be retrofitted convincingly. Qualification cycles run for years and effectively close the position for the life of a process node, which makes arriving late considerably worse than not arriving at all.
CAGR 10.5%

Ambient Pressure and In-Situ XPS Systems

Differentially pumped systems measuring at millibar pressures grow at 9.0% by opening catalysis under working conditions, battery interfaces and electrochemical surfaces that ultra-high vacuum made impossible to observe at all. The engineering is difficult and the price premium substantial, which confines adoption to well-funded research groups and a handful of industrial catalysis laboratories. Signal intensity falls sharply with pressure, so the practical operating window is narrower than the specifications suggest and users learn that only after installation. Catalysis groups in particular have driven the development, since observing a working catalyst surface under reaction conditions was precisely the question the technique had never been able to answer at all until now.
CAGR 9.0%
Full segment breakdown across 6 segments available in the complete report.

Regional Architecture and Country Demand Map

Geography follows semiconductor manufacturing concentration and research funding together rather than economy size. East Asia leads on both fab metrology demand and instrument manufacture, and India grows fastest from nothing. Economy size on its own predicts remarkably little about where these instruments actually end up going.

North America

National laboratory and university purchasing carries most volume, funded through federal research programmes whose budgets have grown slowly and unevenly across recent years. Semiconductor fab investment under domestic manufacturing incentives is beginning to generate metrology demand that did not exist here a decade ago. Service and upgrade revenue is unusually well developed, since a large installed base dating from the 1990s and 2000s is being retrofitted rather than replaced. Applications support expectations are high and suppliers staff accordingly. Peak fitting practice varies enormously between laboratories here as everywhere, and the journals introducing reporting standards for submitted spectra are largely American in origin, which shapes the interpretation software market considerably too.
Share: 25% | CAGR: 6.2% (2026 to 2036)

Western Europe

Academic surface science has deep roots here and several instrument manufacturers were founded within it, which gives the region an installed base and a service business considerably larger than current purchasing alone would suggest. Ambient pressure and in-situ systems were largely developed in European laboratories and remain concentrated there. Research funding cycles determine purchasing rhythm more than anything commercial. Catalysis and battery research programmes across Germany, Britain and the Nordic countries generate steady specialised demand. Service and upgrade revenue exceeds new instrument sales in several markets here, reflecting an installed base that is older than anywhere else and laboratories that retrofit rather than replace as a matter of simple routine.
Share: 24% | CAGR: 5.4% (2026 to 2036)
Regional intelligence for 5 additional markets available in the complete report: East Asia, South Asia and Pacific, Latin America, Middle East and Africa, Eastern Europe. Contact sales@marketmindsadvisory.com.
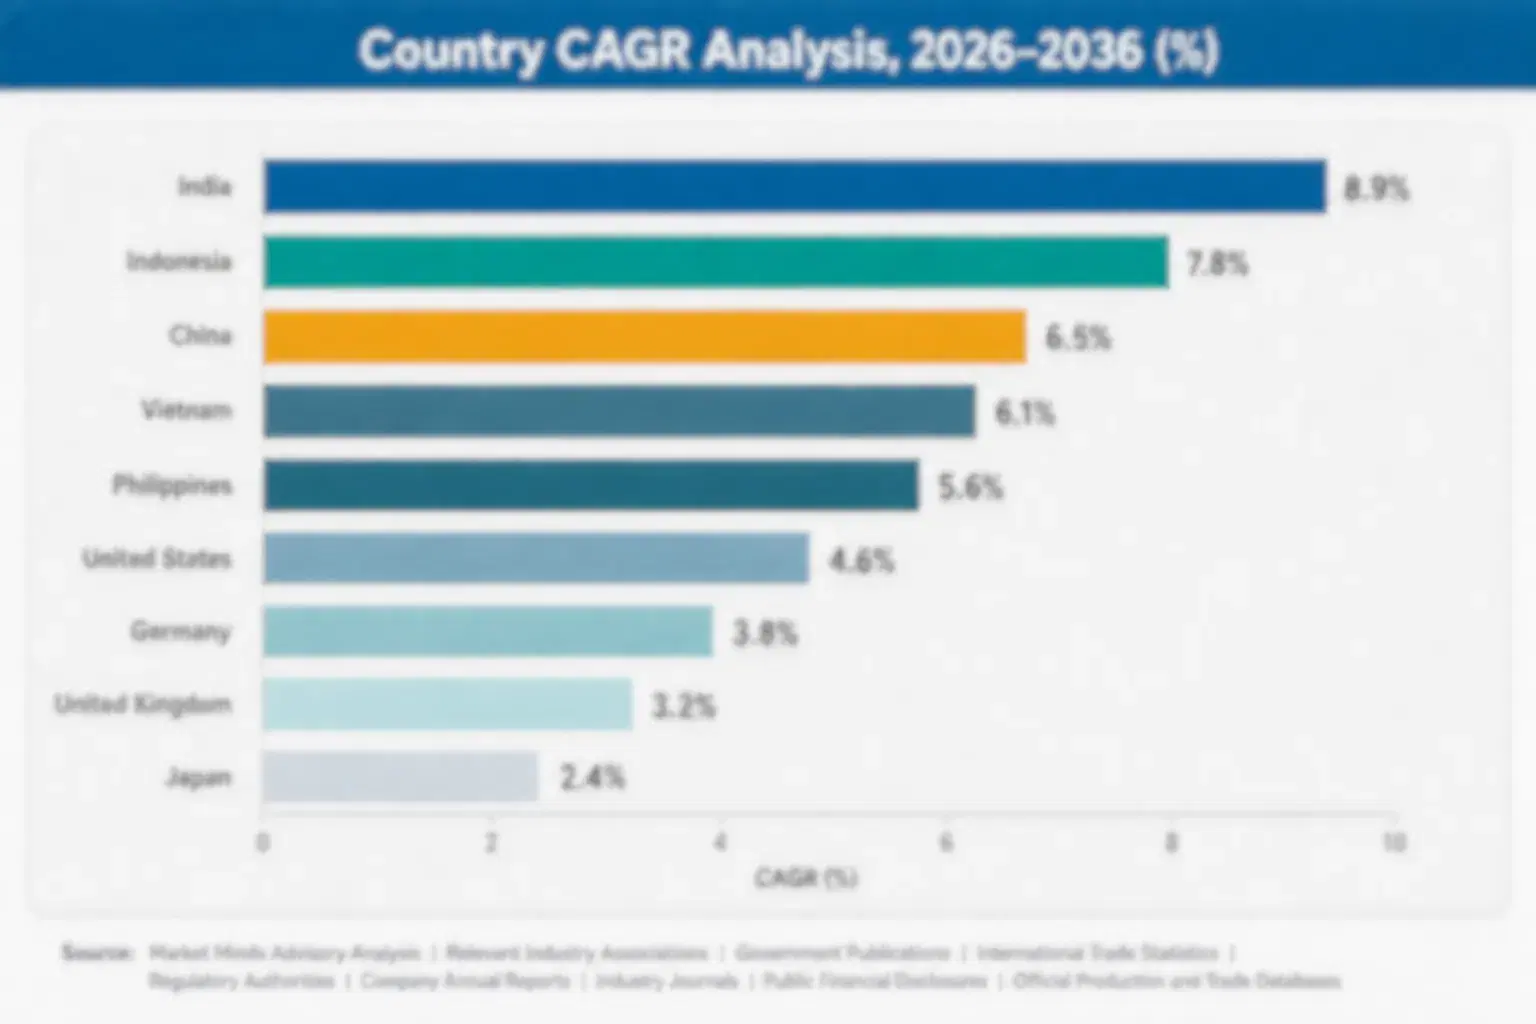
x-ray-photoelectron-spectroscopy-xps-market-country-cagr-analysis-1787716010893

Selling Beyond The Instrument Sale

The technique sees ten nanometres, needs fourteen hours of pumping, lasts around 22 years and generates 41% of revenue from service. Four levers work on fab product separation, installed base capture, interpretation support and sample throughput rather than on analyser specification, which almost nobody in this field actually decides a purchase on any more.

Build A Separate Product For Fabs

A fab wants wafer handling, automation, cleanroom compatibility and uptime measured in months, while a research group wants flexibility and access to every sample geometry imaginable. Those requirements conflict directly, and adapting a research instrument satisfies neither properly. Suppliers who committed to a dedicated metrology line are taking the segment growing at 10.5%, and the ones still demonstrating a modified research system in a fab meeting rarely get invited back to a second one. Fab qualification runs for years and closes the position for the life of a whole node.
Market Impact: Wins the segment growing fastest at 10.5% annually

Organise Commercially Around The Installed Base

Instruments last around 22 years and 41% of category revenue already comes from service, detector upgrades, source replacements and software rather than from new systems. Most suppliers are organised around instrument sales and treat the recurring half as fulfilment. Structured upgrade programmes, proactive detector replacement and long-term service agreements convert an ageing base into predictable revenue. It requires a commercial function most of these companies have simply never built at all. Half a supplier's revenue currently arrives by accident, and organising it deliberately costs headcount rather than any engineering at all.
Market Impact: Captures the 41% revenue share that already recurs

Sell Interpretation, Not Just The Measurement

Roughly 38% of published spectra carry peak assignments that reviewers later dispute, because the technique is taught as instrument operation rather than as data interpretation. Reference databases, guided fitting software and genuine training address a problem the whole field acknowledges and almost nobody sells against. It carries software margins rather than hardware ones and it reaches the entire installed base rather than only whoever is buying an instrument this year. Users already buy this from third parties, which means the demand is proven and somebody else is currently taking it.
Market Impact: Addresses the 38% rate of disputed peak assignments

Engineer Throughput Into Sample Introduction Instead

Fourteen hours of pumping from atmosphere caps how many samples an instrument examines regardless of analyser speed, and load-lock design determines throughput far more than any specification on a datasheet does. Multi-sample carousels, fast-entry airlocks and parking positions all raise usable capacity substantially. Users measure an instrument by samples per week rather than by counts per second, and suppliers persist in competing on the second number instead. A carousel holding 12 samples turns 1 pump-down into a week of measurements rather than into a single afternoon of work entirely. Load-locks matter.
Market Impact: Multiplies output from each 14 hour pump cycle

Who Controls the Margin Pool

Measured on disclosed surface analysis instrument and service revenue, the five largest suppliers hold a CR5 of 76%, among the highest concentrations in analytical instrumentation, because designing and building an ultra-high vacuum hemispherical analyser with monochromated source and charge compensation is genuinely difficult engineering. Thermo Fisher and Kratos hold broad research and industrial positions, ULVAC-PHI and JEOL bring Japanese manufacturing depth close to the fabs, and Scienta Omicron holds specialised research strength. Nobody enters this category casually and almost nobody has.
Three contests define activity. Research instruments compete on flexibility, applications support and reputation within a small and well-connected scientific community. Fab metrology systems compete on automation, uptime and integration rather than on spectroscopic performance. And service competes on engineer availability, which decides more purchases than anybody admits. Upgrades compete with nobody, since only the original maker supplies them.

Pressure builds from Chinese domestic instrument development, still early but well funded, and from software providers capturing interpretation value the hardware makers left unclaimed. Rankings shift toward whoever separated the fab product properly from the research one. Building an ultra-high vacuum analyser remains the barrier that keeps this field small.
x-ray-photoelectron-spectroscopy-xps-market-company-positioning-matrix-1787716011184

Competitive Moat and Risk Dimensions

THERMO FISHER SCIENTIFIC

Moat: Scale, Service Network And Portfolio

Thermo Fisher supports these instruments through a global service organisation built for a far larger analytical portfolio, which puts an engineer within reach of customers that a specialist cannot economically cover. Service response decides more purchases here than specifications do. A smaller competitor with an equal instrument still cannot promise a visit next week in most of the world.
THERMO FISHER SCIENTIFIC

Risk: Fab Requirements Differ Fundamentally

Semiconductor metrology demands wafer automation, cleanroom compatibility and uptime commitments that a research instrument architecture does not naturally provide, and the segment growing at 10.5% is exactly that one. Portfolio breadth does not substitute for a dedicated design. Fab qualification cycles are long, and a supplier arriving late finds the position already occupied.
ULVAC-PHI

Moat: Japanese Manufacturing And Fab Proximity

Manufacturing in Japan alongside deep vacuum technology heritage places the company physically and commercially close to the semiconductor customers driving the category's growth, with service response measured in hours rather than weeks for those accounts. Fab relationships are built over qualification cycles lasting years. That proximity advantage is geographic and cannot be replicated by a competitor on another continent.
ULVAC-PHI

Risk: Research Market Reach Limits Scale

Academic and government laboratory purchasing across North America and Europe remains a substantial share of the category, and reaching it requires service coverage and applications support across geographies where the company is thinner. Strength concentrated near the fabs leaves the installed base opportunity elsewhere underserved. Service revenue at 41% of the category rewards breadth of coverage above everything.

Players Tracked

Prominent Players

Thermo Fisher Scientific
Kratos Analytical
ULVAC-PHI
JEOL
Scienta Omicron

Other Key Players

Shimadzu
SPECS Surface Nano Analysis
Bruker
Hitachi High-Tech
Rigaku
Oxford Instruments
Staib Instruments
PREVAC
Nova Measuring Instruments
Onto Innovation
Edwards Vacuum
Pfeiffer Vacuum
Agilent Technologies
CasaXPS
Leybold

Recent Developments

FEBRUARY 2025

Fab qualifies surface chemistry metrology into atomic layer process control

A semiconductor manufacturer qualified surface chemistry metrology into process control for atomic-layer deposition steps at an advanced node. This was an internal process qualification rather than any commercial announcement, and it followed a multi-year evaluation covering throughput, repeatability and cleanroom integration requirements in considerable detail.
Signal: Fab qualification cycles run for years and effectively close the position to any later arrivals entirely.
JUNE 2025

Instrument maker launches structured detector upgrade programme

An instrument manufacturer launched a structured upgrade programme offering detector, source and software replacement for systems more than a decade old. This was a commercial programme rather than any product launch, and it addressed an installed base considerably larger than annual new instrument shipments across all suppliers.
Signal: Upgrading an ageing installed base is being treated commercially rather than as service fulfilment at last.
OCTOBER 2025

Journal introduces peak fitting reporting standards for submitted spectra

A materials science journal introduced reporting standards requiring authors to document background subtraction, lineshape choices and calibration for submitted photoelectron spectra. This was an editorial policy rather than any commercial development, and it followed sustained concern about disputed chemical assignments appearing in published work over recent years.
Signal: Editorial standards create demand for interpretation tools that the instrument makers never once thought to sell.

Vacuum Chambers And Pumps

The cost sits in metal, magnetics and vacuum hardware rather than in anything electronic. Electropolished stainless steel chambers, turbomolecular and ion pumps, precision-machined hemispherical analysers, high-permeability magnetic shielding alloy, quartz monochromator crystals, aluminium anodes and multichannel detectors together account for 41 to 52% of finished system cost. Magnetic shielding alloy is nickel-rich and machining an analyser to tolerance takes specialist capability very few workshops anywhere possess.
Two things moved. Nickel pricing rose violently in March 2022 when exchange trading was suspended entirely, which United States Geological Survey commodity data records, and stainless steel and shielding alloy costs followed it upward for months. Separately, turbomolecular pump lead times extended well beyond a year as industrial and semiconductor demand absorbed available production, and instrument builders discovered their assembly schedules were governed by pumps.

Exposure divides by vertical integration rather than by scale. Manufacturers machining their own analysers and chambers control the longest lead items and the most specialised capability. Those buying vacuum assemblies carry both pricing and schedule exposure to suppliers serving far larger industrial customers first. Pump and vacuum component sourcing determines build schedules more than any electronics decision does, which surprises people assuming the analyser is the difficult part.
x-ray-photoelectron-spectroscopy-xps-market-cost-volatility-analysis-1787716011482

Contract turbomolecular pump supply well ahead of build

Pump lead times extended beyond a year when industrial and semiconductor demand absorbed available production, and instrument assembly schedules were governed by pumps rather than by anything a builder controlled. Contracting ahead costs commitment against orders that may not arrive. It removes the constraint that has repeatedly determined how many systems a manufacturer could actually ship in a given year.

Machine analysers and chambers internally where possible

Hemispherical analyser machining requires tolerance and surface finish capability that very few workshops anywhere hold, and outsourcing places the most specialised part with a supplier serving others. Internal capability costs capital equipment and skilled machinists who are difficult to recruit. It controls the longest lead item and protects the design knowledge that concentration in this category actually rests upon.

Hedge nickel exposure across shielding and chamber steel

High-permeability magnetic shielding alloy is nickel-rich and stainless chamber steel contains nickel too, so a single commodity moves a substantial part of the bill of materials at once. Nickel priced violently in 2022 and manufacturers absorbed it. Hedging costs treasury capability that instrument businesses of this size rarely maintain, and it converts a shared exposure into a planned cost line.

Portfolio Architecture for Margin Defence

Margin follows scarcity of capability rather than complexity of product, which produces a ranking most people get backwards. Vacuum spares and general components earn thinly against catalogue suppliers anybody can buy from. Research instruments earn moderately against long sales cycles and grant-limited budgets. Detector and source upgrades earn well on an installed base with nowhere else to go. Fab metrology systems earn better on qualification lock-in. Analysis software and interpretation services earn best of anything here.
The tension is that the highest margin lines require capabilities instrument companies do not naturally have. Software and interpretation services need people who think about data rather than hardware, and fab metrology needs automation and cleanroom engineering that a research instrument business has never employed. A supplier weighted entirely to research systems earns adequately and watches growth happen in segments it cannot serve.

High-value pools sit in three places. Detector and source upgrades sold into a 22 year installed base that cannot buy them anywhere else. Fab metrology qualification positions, which close to competitors for the life of the process node. And analysis software with reference databases, which addresses the whole installed base at software margins.

Volume / Commodity-Adjacent

Vacuum components, general spares and consumables available from catalogue suppliers as well as instrument makers. The 10-point range separates manufacturers with internal machining and assembly from those reselling components bought in from specialist vacuum suppliers.
Gross Margin: 26-36%

Premium / Certified

Research laboratory systems and ambient pressure instruments sold into academic and institutional purchasing on capability and applications support. The 14-point spread reflects how differently standard research configurations and highly specialised in-situ systems are priced and negotiated.
Gross Margin: 44-58%

Sustainability / Regulatory / Next-Generation

Fab metrology systems, detector and source upgrades, and analysis software with reference databases. The 26-point range is wide because qualified hardware positions and zero-marginal-cost software sit within a single tier and behave nothing alike.
Gross Margin: 58-84%
x-ray-photoelectron-spectroscopy-xps-market-portfolio-architecture-1787716011789

High-value Sub-segments and Strategic Watch-out

Analysis Software And Databases

Highest margin available anywhere here, addressing a 38% disputed assignment rate across the whole installed base rather than only current instrument buyers. The risk is that instrument makers have historically given software away, which makes charging for it a difficult conversation to begin. Old habits die slowly here.
Gross Margin: 76-84%

Detector And Source Upgrades

Sold into a 22 year installed base with no alternative supplier, since analyser geometry and control electronics are entirely proprietary to each maker. The risk is that a laboratory choosing full replacement instead removes the upgrade opportunity and the account together. Replacement removes both at once.
Gross Margin: 58-70%

Research Laboratory Systems

The traditional core, sold on capability and applications reputation through sales cycles governed entirely by grant award timing rather than by anything commercial. Suppliers hold it because the installed base it creates funds service and upgrade revenue for two decades afterwards. Grant timing governs everything here.
Gross Margin: 44-54%

Fab Qualification Exclusion

The strategic watch-out. Qualification cycles run for years and close the position to later arrivals for the life of a process node. The risk is watching the fastest growing segment develop while adapting research instruments that fabs decline to qualify. Late arrival is worse than none.
Gross Margin: 60-72%

Twenty Years Of Aftermarket

An instrument sale here is the beginning of a relationship lasting two decades rather than a transaction. Systems remain productive for around 22 years, consuming service contracts, detector replacements, source anodes, vacuum spares and software throughout, which is why 41% of category revenue never touches a new system at all. The instrument purchase is an option on twenty years of aftermarket, and suppliers pricing it that way behave differently.
Stickiness is close to absolute once installed. Analyser geometry, control electronics and vacuum interfaces are proprietary to each manufacturer, so a laboratory cannot buy a detector or source from anybody else, and the only exit is a full replacement costing several hundred thousand dollars. Fab accounts are stickier still, since requalifying a metrology step is disruptive enough that nobody does it casually. Software is the one genuinely contestable layer.

The buyer has split into two that share almost nothing. A professor writes a grant application, specifies on capability and waits eighteen months for an award. A fab engineer runs a qualification programme against throughput and uptime criteria and buys on a manufacturing schedule. Suppliers serving both with one commercial organisation serve neither properly.
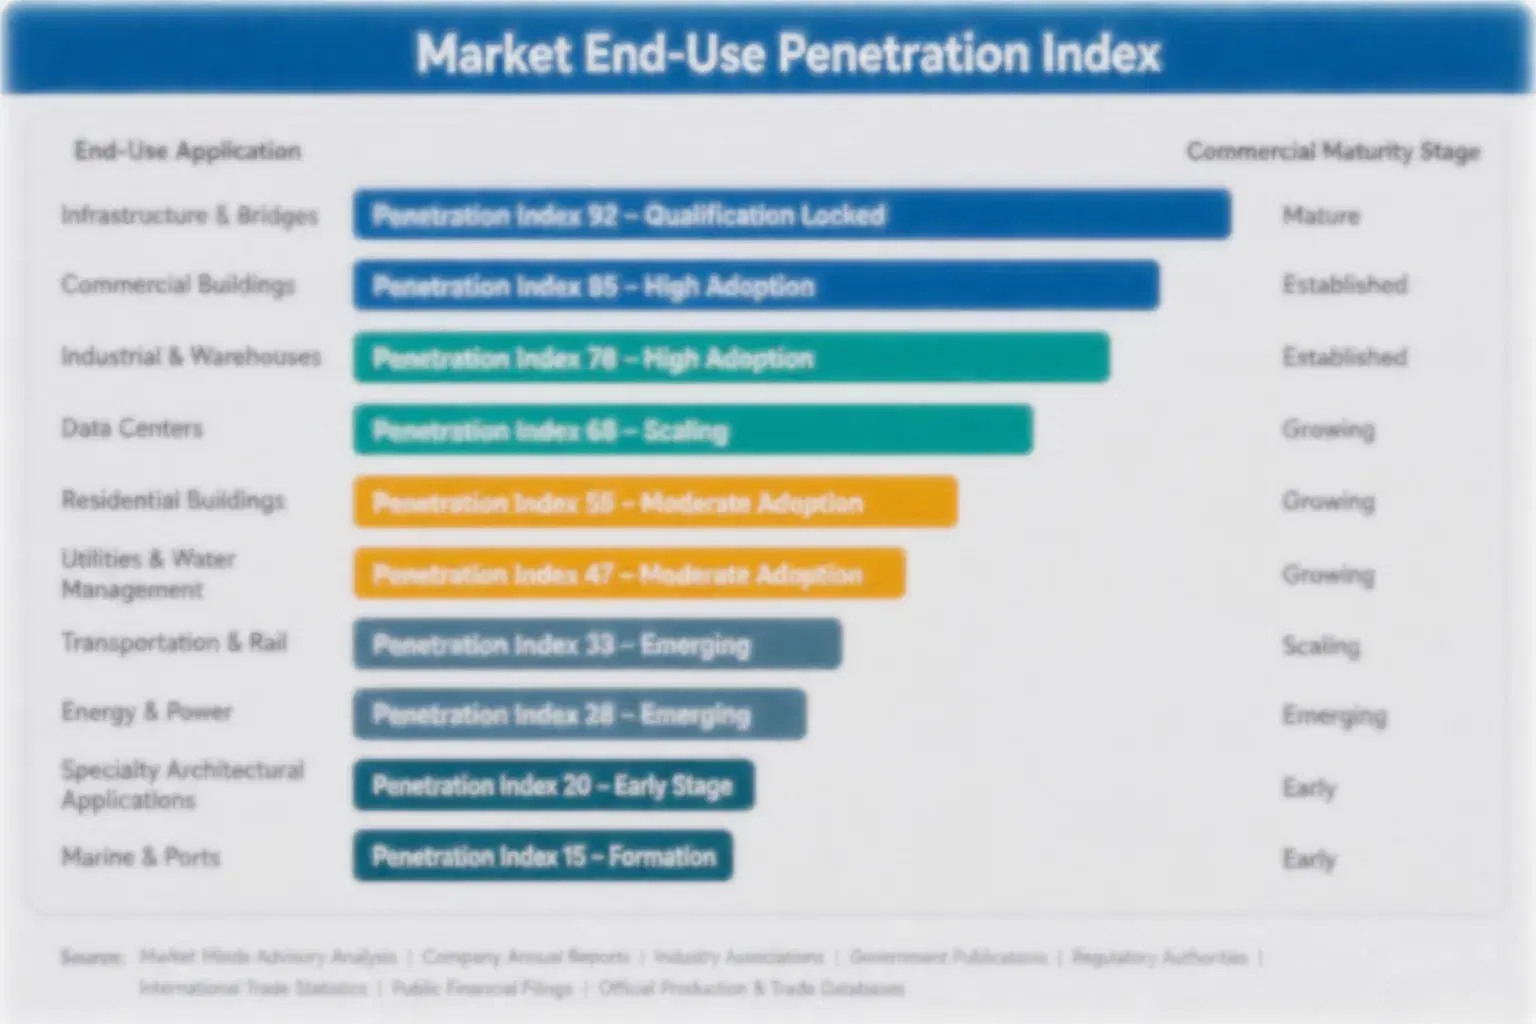
x-ray-photoelectron-spectroscopy-xps-market-end-use-penetration-index-1787716012049

Serve The Installed Base

These are among the four positions where our research anticipates prominent divergence between winners and laggards over the coming forecast period. Each is grounded in the demand model, the regulatory perimeter, and the announced capacity pipeline.
01 / FAB PRODUCT SEPARATION

A research instrument cannot do fab work

A fab requires wafer handling, cleanroom compatibility, automation and uptime measured in months, while a research group wants flexibility and access to every sample geometry that anybody might conceivably bring in. Those requirements conflict directly and a modified research instrument ends up satisfying neither of them properly at all. Suppliers who committed to a dedicated metrology line are taking the segment now growing at 10.5%, while the adapters are rarely invited back for a second meeting anywhere at all afterwards.
02 / AFTERMARKET COMMERCIAL ORGANISATION

Forty-one percent of revenue nobody manages

These instruments remain productive for around 22 years each, and 41% of all category revenue already comes from service contracts, detector upgrades, source replacements and software rather than from any new system sale. Most suppliers here are organised entirely around instrument selling and treat that entire recurring half as mere order fulfilment work. Structured upgrade programmes, proactive detector replacement and long-term service agreements convert an ageing installed base into predictable revenue that almost nobody currently manages deliberately at all today.
03 / INTERPRETATION VALUE CAPTURE

The hard part happens after measurement

Roughly 38% of all published spectra carry peak assignments that reviewers subsequently dispute, because this technique is taught almost everywhere as instrument operation rather than as careful data interpretation by anybody. Reference databases, guided fitting software and genuine training address a problem that the entire field openly acknowledges and that almost nobody sells anything at all against. It carries software margins rather than hardware ones, and it reaches the whole installed base rather than only this year's instrument buyers alone.
04 / THROUGHPUT ENGINEERING FOCUS

Samples per week beats counts per second

Fourteen hours of pumping down from atmosphere caps how many samples an instrument can examine in any given week at all regardless of how fast the analyser counts photoelectrons once it finally gets there. Load-lock design, multi-sample carousels, fast-entry airlocks and sample parking positions all raise usable capacity far more than any analyser specification improvement ever manages to. Users always judge an instrument by its samples per week, and suppliers keep on competing against one another on the other number altogether.

Engagement Snapshot From the Field

A live engagement with an industry participant carrying material or product regulatory and market exposure ahead of a defining policy shift, showing how our research translates into a defensible multi-year portfolio strategy.
MARKET MINDS ADVISORY · CLIENT ENGAGEMENT SUMMARY
X-Ray Photoelectron Spectroscopy (XPS) Producer Strategic Portfolio Review and Transition Roadmap 2026·Investment Scenario on X-Ray Photoelectron Spectroscopy (XPS) Exposure Evaluation 2025-26
CLIENT PROFILE
A surface analysis instrument manufacturer supplying research laboratory systems across European and Asian markets, with reported instrument and service revenue of 96 million dollars (client-reported, unverified by MMA). Roughly 71% came from new system sales. Service was managed as a fulfilment function and no structured upgrade programme existed anywhere in the business at that point.
STRATEGIC CHALLENGE
New system revenue had been flat for four years against research budgets that were not expanding, while two semiconductor evaluations had been lost after fab throughput and automation requirements were assessed. Management was preparing an analyser performance upgrade. That improved a specification nobody had questioned and addressed neither the flat research market nor the fab requirements actually being failed.
MMA APPROACH
MMA analysed revenue by source against installed base age and service coverage, a mapping the company had never built despite holding every serial number. Twenty expert interviews with academic users, fab process engineers, service managers and procurement leads established what each buyer genuinely weighs. The analysis treated aftermarket organisation and fab product separation rather than analyser performance as the routes available.
KEY FINDINGS
  1. The installed base was considerably larger and older than anybody in the company had quantified, and no proactive upgrade contact had ever been made with most of those laboratories.
  2. Both lost fab evaluations recorded throughput and cleanroom integration as the deciding factors, and neither mentioned spectroscopic performance anywhere in the feedback.
  3. Academic users described peak fitting as their greatest difficulty and had bought interpretation software from a third party rather than from the instrument maker.
  4. Service engineer availability had decided at least three purchases in the preceding two years, according to the procurement leads who made those particular decisions.
CLIENT PROFILE
A surface analysis instrument manufacturer supplying research laboratory systems across European and Asian markets, with reported instrument and service revenue of 96 million dollars (client-reported, unverified by MMA). Roughly 71% came from new system sales. Service was managed as a fulfilment function and no structured upgrade programme existed anywhere in the business at that point.
STRATEGIC CHALLENGE
New system revenue had been flat for four years against research budgets that were not expanding, while two semiconductor evaluations had been lost after fab throughput and automation requirements were assessed. Management was preparing an analyser performance upgrade. That improved a specification nobody had questioned and addressed neither the flat research market nor the fab requirements actually being failed.
MMA APPROACH
MMA analysed revenue by source against installed base age and service coverage, a mapping the company had never built despite holding every serial number. Twenty expert interviews with academic users, fab process engineers, service managers and procurement leads established what each buyer genuinely weighs. The analysis treated aftermarket organisation and fab product separation rather than analyser performance as the routes available.
KEY FINDINGS
  1. The installed base was considerably larger and older than anybody in the company had quantified, and no proactive upgrade contact had ever been made with most of those laboratories.
  2. Both lost fab evaluations recorded throughput and cleanroom integration as the deciding factors, and neither mentioned spectroscopic performance anywhere in the feedback.
  3. Academic users described peak fitting as their greatest difficulty and had bought interpretation software from a third party rather than from the instrument maker.
  4. Service engineer availability had decided at least three purchases in the preceding two years, according to the procurement leads who made those particular decisions.
RECOMMENDED STRATEGY
Phase 1: Phase one: build an aftermarket commercial function and contact every installed base laboratory with a structured and costed upgrade proposition. Phase 2: Phase two: commit to a dedicated fab metrology platform rather than continuing to adapt research systems for fab qualification programmes instead. Phase 3: Phase three: acquire or license interpretation software, capturing value that third parties currently take directly from the company's own installed users.
OUTCOME
The aftermarket function generated upgrade orders from laboratories that had heard nothing from the company in a decade. Fab platform development was funded and a first qualification programme opened within the period (client-reported, unverified by MMA). Interpretation software licensing discussions began. The analyser performance upgrade was cancelled, having addressed a specification no customer had ever raised as a concern.

Frequently Asked Questions

Foundational context covering the market sizes, CAGR, scope, country, region and competition that inform every finding below. This section is provided to cover basics and most often pre-purchase conversations, answered from the MMA Primary Research Dataset.

What is the current size of the X-Ray Photoelectron Spectroscopy (XPS) Market?

The market was worth 0.7 billion dollars in 2025, covering research systems, fab metrology, ambient pressure instruments, upgrades, consumables and analysis software. It reaches 0.75 billion dollars in 2026.

How large will the X-Ray Photoelectron Spectroscopy (XPS) Market be by 2036?

MMA forecasts 1.47 billion dollars by 2036, an increase of 0.72 billion dollars over the 2026 base. That represents an expansion multiple of 1.96 times across the forecast period.

What is the CAGR for the X-Ray Photoelectron Spectroscopy (XPS) Market 2026 to 2036?

The base case compounds at 7.0% annually. The bull case reaches 8.2% if fab adoption broadens beyond leading-edge nodes, while the bear case sits at 5.8% on flat research budgets and upgrade-led demand.

Which segment is growing fastest?

Semiconductor metrology systems, at 10.5%, half again the market rate of 7.0%. Atomic-layer films sit precisely within the ten nanometre depth the technique can actually see.

Who are the major companies in the X-Ray Photoelectron Spectroscopy (XPS) Market?

Thermo Fisher Scientific, Kratos Analytical, ULVAC-PHI, JEOL and Scienta Omicron lead on disclosed surface analysis instrument and service revenue. SPECS, Shimadzu and PREVAC hold notable positions.

Which country is growing fastest?

India at 9.0%, as universities and national institutes commission surface analysis laboratories with no prior capability. First-time buyers there weigh training and local service above specification.

Report Segmentation Architecture

The full report scope spans multiple orthogonal segmentation dimensions, with cross-tabulated demand data provided for each dimension pair. Coverage extends further to regional breakdowns, trend trajectories, and the competitive detail needed to support segment-level decision-making.

By System Type

  • Research Laboratory XPS Systems
  • Semiconductor Metrology XPS Systems
  • Ambient Pressure and In-Situ XPS Systems
  • Detectors Analysers and Source Upgrades
  • Consumables Vacuum Components and Spares
  • Data Analysis Software and Peak Fitting Services

By End-Use Industry

  • Universities and Academic Research
  • Semiconductor Manufacturing
  • Government and National Laboratories
  • Materials and Coatings Industry
  • Battery and Energy Storage Research
  • Catalysis and Chemical Industry

By Commercial Dimension

  • Capital Instrument Purchase
  • Research Grant Funded Procurement
  • Fab Qualification and Fleet Supply
  • Service and Maintenance Contracts
  • Upgrade and Retrofit Programmes
  • Software Licensing and Subscription

By Region

  • North America
  • Western Europe
  • East Asia
  • South Asia and Pacific
  • Latin America
  • Middle East and Africa
  • Eastern Europe

Scope, Methodology, and Coverage

Every figure in this report is reproducible from documented input assumptions. The scope below maps the historical period, the forecast horizon, the segmentation dimensions, and the countries covered, alongside the underlying primary and qualitative methodology.
Historical Period
2020 to 2025
Forecast Period
2026 to 2036
Base Year
2025 (USD billions; MMA Primary Research Dataset, August 2026)
Market Definition
Scope covers X-ray photoelectron spectroscopy instrumentation, subsystems, consumables and associated commercial services, spanning research laboratory XPS systems, semiconductor metrology XPS systems configured for wafer handling and process control, ambient pressure and in-situ XPS systems, detectors analysers and X-ray source upgrades supplied into installed instruments, consumables vacuum components and spare parts specific to these systems, and data analysis software with peak fitting and interpretation services. Other surface analysis techniques including Auger electron spectroscopy, secondary ion mass spectrometry and low energy ion scattering, electron and ion microscopy, synchrotron beamline instrumentation, and general purpose laboratory vacuum equipment sold outside this application are excluded from the market size and all derived figures.
Quantitative Units
USD billions (current prices); systems shipped; installed base; service revenue share; samples analysed per week
Segmentation Dimensions
By System Type; By End-Use Industry; By Commercial Dimension; By Region
Regions Covered
North America, Western Europe, East Asia, South Asia and Pacific, Latin America, Middle East and Africa, Eastern Europe
Countries Covered
Japan, USA, China, Germany, South Korea, Taiwan, UK, France, India, Canada, Italy, Netherlands, Poland, Brazil, Saudi Arabia
Key Companies Profiled
Thermo Fisher Scientific, Kratos Analytical, ULVAC-PHI, JEOL, Scienta Omicron, Shimadzu, SPECS Surface Nano Analysis, Bruker, Hitachi High-Tech, Rigaku, Oxford Instruments, Staib Instruments, PREVAC, Nova Measuring Instruments, Onto Innovation, Edwards Vacuum, Pfeiffer Vacuum, Agilent Technologies, CasaXPS, Leybold
Quantitative Methodology
Primary survey, n=3,800 respondents, Q4 2025, six countries; demand-side model with trade association cross-validation
Qualitative Methodology
47 expert interviews, Q4 2025; applied to validate demand model assumptions, identify emerging dynamics, and assess competitive positioning
Report Format
PDF and XLSX data workbook (Word format preview document)
Publisher
Market Minds Advisory
Report Code
MMA-2026-TEC-121
Published
August 2026
Contact
sales@marketmindsadvisory.com | www.marketmindsadvisory.com

Purchase the full X-Ray Photoelectron Spectroscopy (XPS) Market Report (2026 to 2036).

The full report runs to 150 pages and covers all six system type segments, seven regions and 20 profiled suppliers in detail. It includes the complete segment CAGR set, regional research funding and semiconductor manufacturing comparison, and installed base analysis modelling upgrade opportunity against instrument age. Company profiles carry evaluation on disclosed surface analysis instrument and service revenue, with moat and risk assessment for the top five suppliers. The competitive section extends to 11 tracked qualification, programme and standards developments across 2024 and 2025. Primary research inputs include a quantitative survey of 3,800 respondents and 47 expert interviews conducted in Q4 2025.
Six system type segments with individual CAGR forecasts
Seven regional markets with research funding and fab comparison
Twenty supplier profiles on consistent revenue evaluation basis
Eleven tracked qualification and standards developments with commercial interpretation
Installed base modelled for upgrade opportunity against instrument age
Sample throughput assessed against analyser specification competition

Built For The People Who Decide

From boardroom strategy to bench-side execution, this report is read cover-to-cover by leaders shaping the next decade of their industry, turning demand scenarios, market dynamics and valuation benchmarks into decisions.
CXOs/ Presidents/ VPs/ Managers
M&A and Corporate Development
Strategy Teams and R&D Heads
Procurement and Product Directors
Regulatory and Compliance Leaders
Investor Relations and Equity Analysts