Market Minds Advisory
X-Ray Systems Market

X-Ray Systems Market: The Room Costs More Than The Machine

Shielding, floor loading and permitted installation cost around forty per cent more than the equipment itself, which is why the fastest growing systems are the ones needing no room at all.

Lead Analyst

Published

September 2026

Make Smarter Decisions with Customized Research Insights

Request a free sample report and evaluate market opportunities, growth trends, and competitive dynamics relevant to your business needs.

2025 MARKET VALUE$14.2BMarket Size 2025
2036 FORECAST VALUE$26.4BBase Case , 2026 to 2036
CAGR 2026 TO 20365.8 %Bull 7.0% / Bear 4.6%
INCREMENTAL OPPORTUNITY$11.4BNet 10- year value creation
EXPANSION MULTIPLE1.76x2036 value over 2026 base
Strategic Levers
M&A Pipeline
Regional Outlook
Country Rankings
Competitive Intelligence
Segmental Deep-dive
Call-Us : 91 93563 13602

Executive Snapshot and Market Trajectory

The oldest imaging modality is still the largest, with radiography accounting for around 62% of all diagnostic examinations. What has changed is where the money sits. Generators and tubes barely differ, and the detector, the software and the algorithm reading the image decide what a system is worth.
Installation is the barrier nobody prices into the comparison. Shielding, floor loading and permitted construction run about 1.4 times the equipment cost, which is why mobile and portable systems needing no room at all grow fastest at 8.7%, half again the market rate. They also reach settings where the room was always the reason imaging never arrived. Nobody prices the room into the comparison.
The installed base offers a cheaper route than replacement. A retrofit detector panel converts an existing room for roughly 0.31 times the cost of a new system, which competes directly with the machines manufacturers would prefer to sell. East Asia holds 32% of demand on Chinese equipping programmes, and India grows fastest at 9.8%. That calculation is obvious to any budget holder who examines it, and most now do. Nobody selling systems raises it.
Market Definition
Diagnostic X-ray imaging systems and their detectors, covering fixed digital radiography, mobile and portable radiography, fluoroscopy and interventional systems, mammography systems, dental radiography, and detectors and retrofit panels sold separately. Measured at manufacturer selling value. Computed tomography, magnetic resonance imaging, ultrasound, nuclear medicine, radiation therapy equipment, and industrial or veterinary imaging systems are excluded from scope.
Base Year Value
$14.2B in 2025 (MMA Primary Research Dataset, August 2026)
Forecast Period
2026 to 2036, eleven discrete annual values
CAGR
5.8% base case. Bull 7.0%. Bear 4.6%.
Fastest Growth Segment
Mobile and Portable Radiography: 8.7% CAGR
Fastest Growth Country
India: 9.8% CAGR
Fastest Growth Region
South Asia and Pacific: 8.0% CAGR
Largest Region
East Asia: 32% of 2025 global value
Market Leaders
Siemens Healthineers, GE HealthCare, Philips, Canon Medical Systems, United Imaging Healthcare. Source: MMA Primary Research Dataset, July 2026.
Primary Survey
n=3,800 procurement and R&D decision-makers, Q4 2025, six countries
Methodology
Demand-side build-up, cross-validated against public data, 47 expert interviews

X-Ray Systems Market Forecast Scenarios

x-ray-systems-market-size-forecast-scenario-1787665183886
The five years to 2025 combined a point of care shift with intense domestic competition in the largest market. Mobile digital systems proved their value in critical care and emergency settings, while Chinese manufacturers took substantial share at home and increasingly abroad on price and adequate performance. The 4.6% historical rate reflects mix change toward mobile and detector value alongside pricing pressure in fixed systems everywhere.
The 5.8% base case rests on three mechanisms. Mobile and portable systems grow at 8.7% because they bypass the installation cost that governs everything else. Mammography grows at 7.4% as tomosynthesis replaces two dimensional systems across an entire installed base. And Indian equipping programmes grow at 9.8%, faster than any market covered, on district hospital and diagnostic chain expansion together. Installation avoidance, replacement cycles and public equipping programmes, all together.
The 7.0% bull case turns on algorithmic triage becoming standard on radiographs, which would move value decisively toward software and give manufacturers a recurring revenue line the category has never really had. The 4.6% bear case is retrofit substitution: converting an existing room for roughly 0.31 times a new system cost is an obvious choice for any budget holder who examines it properly.

The Oldest Modality, The Newest Economics

Radiography remains the workhorse of medical imaging by an enormous margin, accounting for around 62% of all diagnostic examinations performed worldwide. That volume makes it the natural place for algorithmic reading, since no other modality generates comparable numbers of images with comparable consistency. Value has been moving accordingly, away from generators and tubes that differ little and toward detectors, applications and software.
TOP FIVE CONCENTRATION58%Combined system shipments held by the leading manufacturers
RADIOGRAPHY STUDY SHARE62%Proportion of all diagnostic imaging examinations performed worldwide
SHIELDED ROOM COST RATIO1.4xInstallation and shielding against the system price itself
RETROFIT CONVERSION COST0.31xDetector panel upgrade against a complete system replacement
INSTALLED BASE MEDIAN AGE9 yearsTypical years in service across developed market fleets
SOFTWARE REVENUE SHARE19%Supplier turnover from applications rather than hardware alone
The installation economics are the part outsiders consistently miss. A fixed radiography room requires lead shielding, floor loading capable of carrying the equipment and a permitted construction process, which together cost around 1.4 times the system itself. That is why capital committees hesitate over rooms they would approve as equipment purchases, and why systems requiring no room at all behave completely differently in the market.
Retrofit conversion is the quiet competitor manufacturers rarely discuss. Replacing a detector panel in an existing room delivers digital performance for roughly 0.31 times the cost of a complete new system, using shielding and infrastructure already in place and permitted. With a median installed base age near nine years across developed markets, that is a genuine alternative rather than a marginal one, and it competes with the systems manufacturers would prefer to sell.
"Manufacturers compete on generators and detectors while the customer is quietly deciding between a new room and a new panel in the room they already have. Only one of those conversations has anything to do with the equipment."
Director, Medical Imaging and Diagnostic Equipment Practice · MMA Medical Devices and Imaging Practice · August 2026

Market Trends

Point Of Care Imaging Bypasses The Installation Barrier

A fixed radiography room costs around 1.4 times the equipment in shielding, floor loading and permitted construction, which is a capital decision entirely separate from the imaging one. Battery powered mobile systems with wireless detectors need none of it, which is why they grow at 8.7% against a market rate of 5.8% and why they reach settings where the room was always the reason imaging never arrived at all. Critical care, emergency departments and rural facilities all benefit from the same characteristic for completely different reasons. The room was never the imaging decision.
Market Impact: India grows at 9.8% annually

Value Moves From Generator Toward Detector And Software

Generators and tubes differ little between manufacturers and compete largely on price, while detector performance, dose efficiency and image processing genuinely separate systems. Software already carries around 19% of supplier revenue and rises with each application added, and radiography generating around 62% of all imaging examinations makes it the obvious place for algorithmic triage. Manufacturers still positioning on generator specifications are competing on the component customers care least about, which suits Chinese entrants selling adequate hardware at lower prices. Competing on the component customers care least about suits new entrants perfectly well.
Market Impact: Mammography grows at 7.4% annually

Market Opportunities and Growth Drivers

Indian District Hospital Equipping Expands Imaging Access

Indian public equipping programmes and private diagnostic chains have expanded imaging access across district and tier two cities simultaneously, and India grows at 9.8%, faster than any market covered. Mobile and compact systems suit that expansion because installation cost governs what a district facility can actually deploy. Domestic and Chinese manufacturers compete aggressively on price while international suppliers hold positions in corporate hospital chains and in mammography where screening programme requirements are more demanding across the board. Installation cost rather than equipment price governs what a district facility can actually deploy at all.
Market Impact: Retrofit costs 0.31 times replacement

Tomosynthesis Replaces An Entire Mammography Installed Base

Digital breast tomosynthesis has become the expected standard across screening and diagnostic mammography, which makes replacing two dimensional systems a like for like conversion of an entire installed base rather than an incremental upgrade decision. Mammography grows at 7.4%, second fastest in the category, on that basis. Screening programme expansion across emerging markets adds volume on top of the replacement cycle. Reading workload created by the additional images is the constraint programmes now discuss, which is where algorithmic support arrives naturally. An entire installed base converting at once is unusual in imaging.
Market Impact: Compresses pricing across 32% of demand

Market Restraints and Challenges

Retrofit Conversion Undercuts New System Replacement Directly

Replacing a detector panel in an existing room delivers digital performance for around 0.31 times the cost of a complete new system, using shielding and infrastructure already permitted and in place. The root cause is that the imaging chain has modularised while the room has not, so the expensive part of the installation outlives several generations of detector. Commercially this caps replacement volumes across an installed base with median age near nine years. Manufacturers respond by selling retrofit themselves, which cannibalises deliberately rather than accidentally. Somebody converts the room one way or another.
Market Impact: Fastest type growing at 8.7%

Domestic Manufacturers Compress Pricing In The Largest Market

Chinese manufacturers supply adequate performance at prices international suppliers cannot approach, in the single largest market for these systems and increasingly in export markets alongside. The root cause is that generator and mechanical hardware genuinely commoditised while regulatory barriers in radiography are lower than in most imaging modalities. Commercially this compresses pricing and pushes international suppliers toward detector performance, software and service. Those responses work in developed markets and reach very little of the volume growth happening elsewhere. Volume growth is happening in exactly the markets where those responses reach the least of all.
Market Impact: Software carries 19% of revenue
3 additional market trends, 4 additional growth drivers, and 2 additional restraints and challenges are covered in the full report. Contact sales@marketmindsadvisory.com to access the complete intelligence.

Segment CAGR and Growth Architecture

Segmentation follows system type, since type determines whether an installation is required, which clinical setting deploys it, what detector performance is needed and how exposed it is to price competition. Six types cover the category as supplied. Growth tracks installation avoidance and replacement cycles rather than any change in examination volumes. Installation avoidance drives the mix.
x-ray-systems-market-market-share-analysis-1787665184464

Mobile and Portable Radiography

Battery powered wheeled and handheld systems with wireless detectors, imaging at the bedside, in emergency settings and in facilities without any dedicated radiography room. At 8.7% this is the fastest growing type, half again the market rate of 5.8%, and installation avoidance rather than image quality explains it. A fixed room costs around 1.4 times the equipment in shielding, floor loading and permitted construction, which is the barrier these systems remove entirely. Critical care, emergency departments and rural facilities adopt them for different reasons and benefit from exactly the same characteristic. Battery power and wireless detectors made that possible only relatively recently, which is why the growth arrived when it did.
CAGR 8.7%

Mammography Systems

Dedicated breast imaging systems, with digital breast tomosynthesis now the expected standard across screening and diagnostic use in developed markets. Growth of 7.4% is second fastest in the category, driven by like for like replacement of an entire two dimensional installed base rather than by any expansion in the examined population. Screening programme development across emerging markets adds volume alongside that conversion. Reading workload from the additional images generated is the constraint programmes increasingly discuss, which is precisely where algorithmic support enters the conversation naturally. Replacing an entire installed base on a like for like basis is unusual in imaging, and it will not repeat once that conversion has completed.
CAGR 7.4%
Full segment breakdown across 6 segments available in the complete report.

Regional Architecture and Country Demand Map

East Asia holds 32%, above the standard band, because Chinese equipping programmes and domestic manufacturing together produce installation volumes no other region approaches. North America follows at 24% and Western Europe at 20%. India grows fastest at 9.8%. Installation economics rather than examination volume decides these.

North America

A 24% share reflects a large, mature and comparatively old installed base where replacement rather than expansion drives demand. Median system age near nine years puts a substantial fleet into the replacement window, and retrofit conversion competes hard for that budget at around a third of new system cost. Algorithmic reading support has advanced further here than anywhere, with clearance pathways established and radiology workload making triage genuinely valuable. Group purchasing organisations negotiate across whole health systems. Growth of 4.8% reflects replacement economics rather than any expansion in imaging capacity. Replacement economics rather than capacity expansion is what governs this market entirely. Retrofit competes for almost every replacement budget available.
Share: 24% | CAGR: 4.8% (2026 to 2036)

Western Europe

A 20% share reflects mature imaging provision with high system quality and constrained capital budgets across most public health systems. Replacement cycles run longer here than in North America because procurement is tender driven and capital approval is slow, which extends median fleet age and makes retrofit conversion particularly attractive. Screening programmes are well established, with tomosynthesis conversion progressing steadily through national mammography services. Regulatory requirements around dose optimisation are the strictest anywhere. Growth of 4.2% is the lowest of the seven regions and reflects budget constraint rather than clinical need. Long procurement cycles rather than clinical hesitation are what extend fleet age across this region. That makes retrofit unusually attractive here.
Share: 20% | CAGR: 4.2% (2026 to 2036)
Regional intelligence for 5 additional markets available in the complete report: East Asia, South Asia and Pacific, Latin America, Middle East and Africa, Eastern Europe. Contact sales@marketmindsadvisory.com.
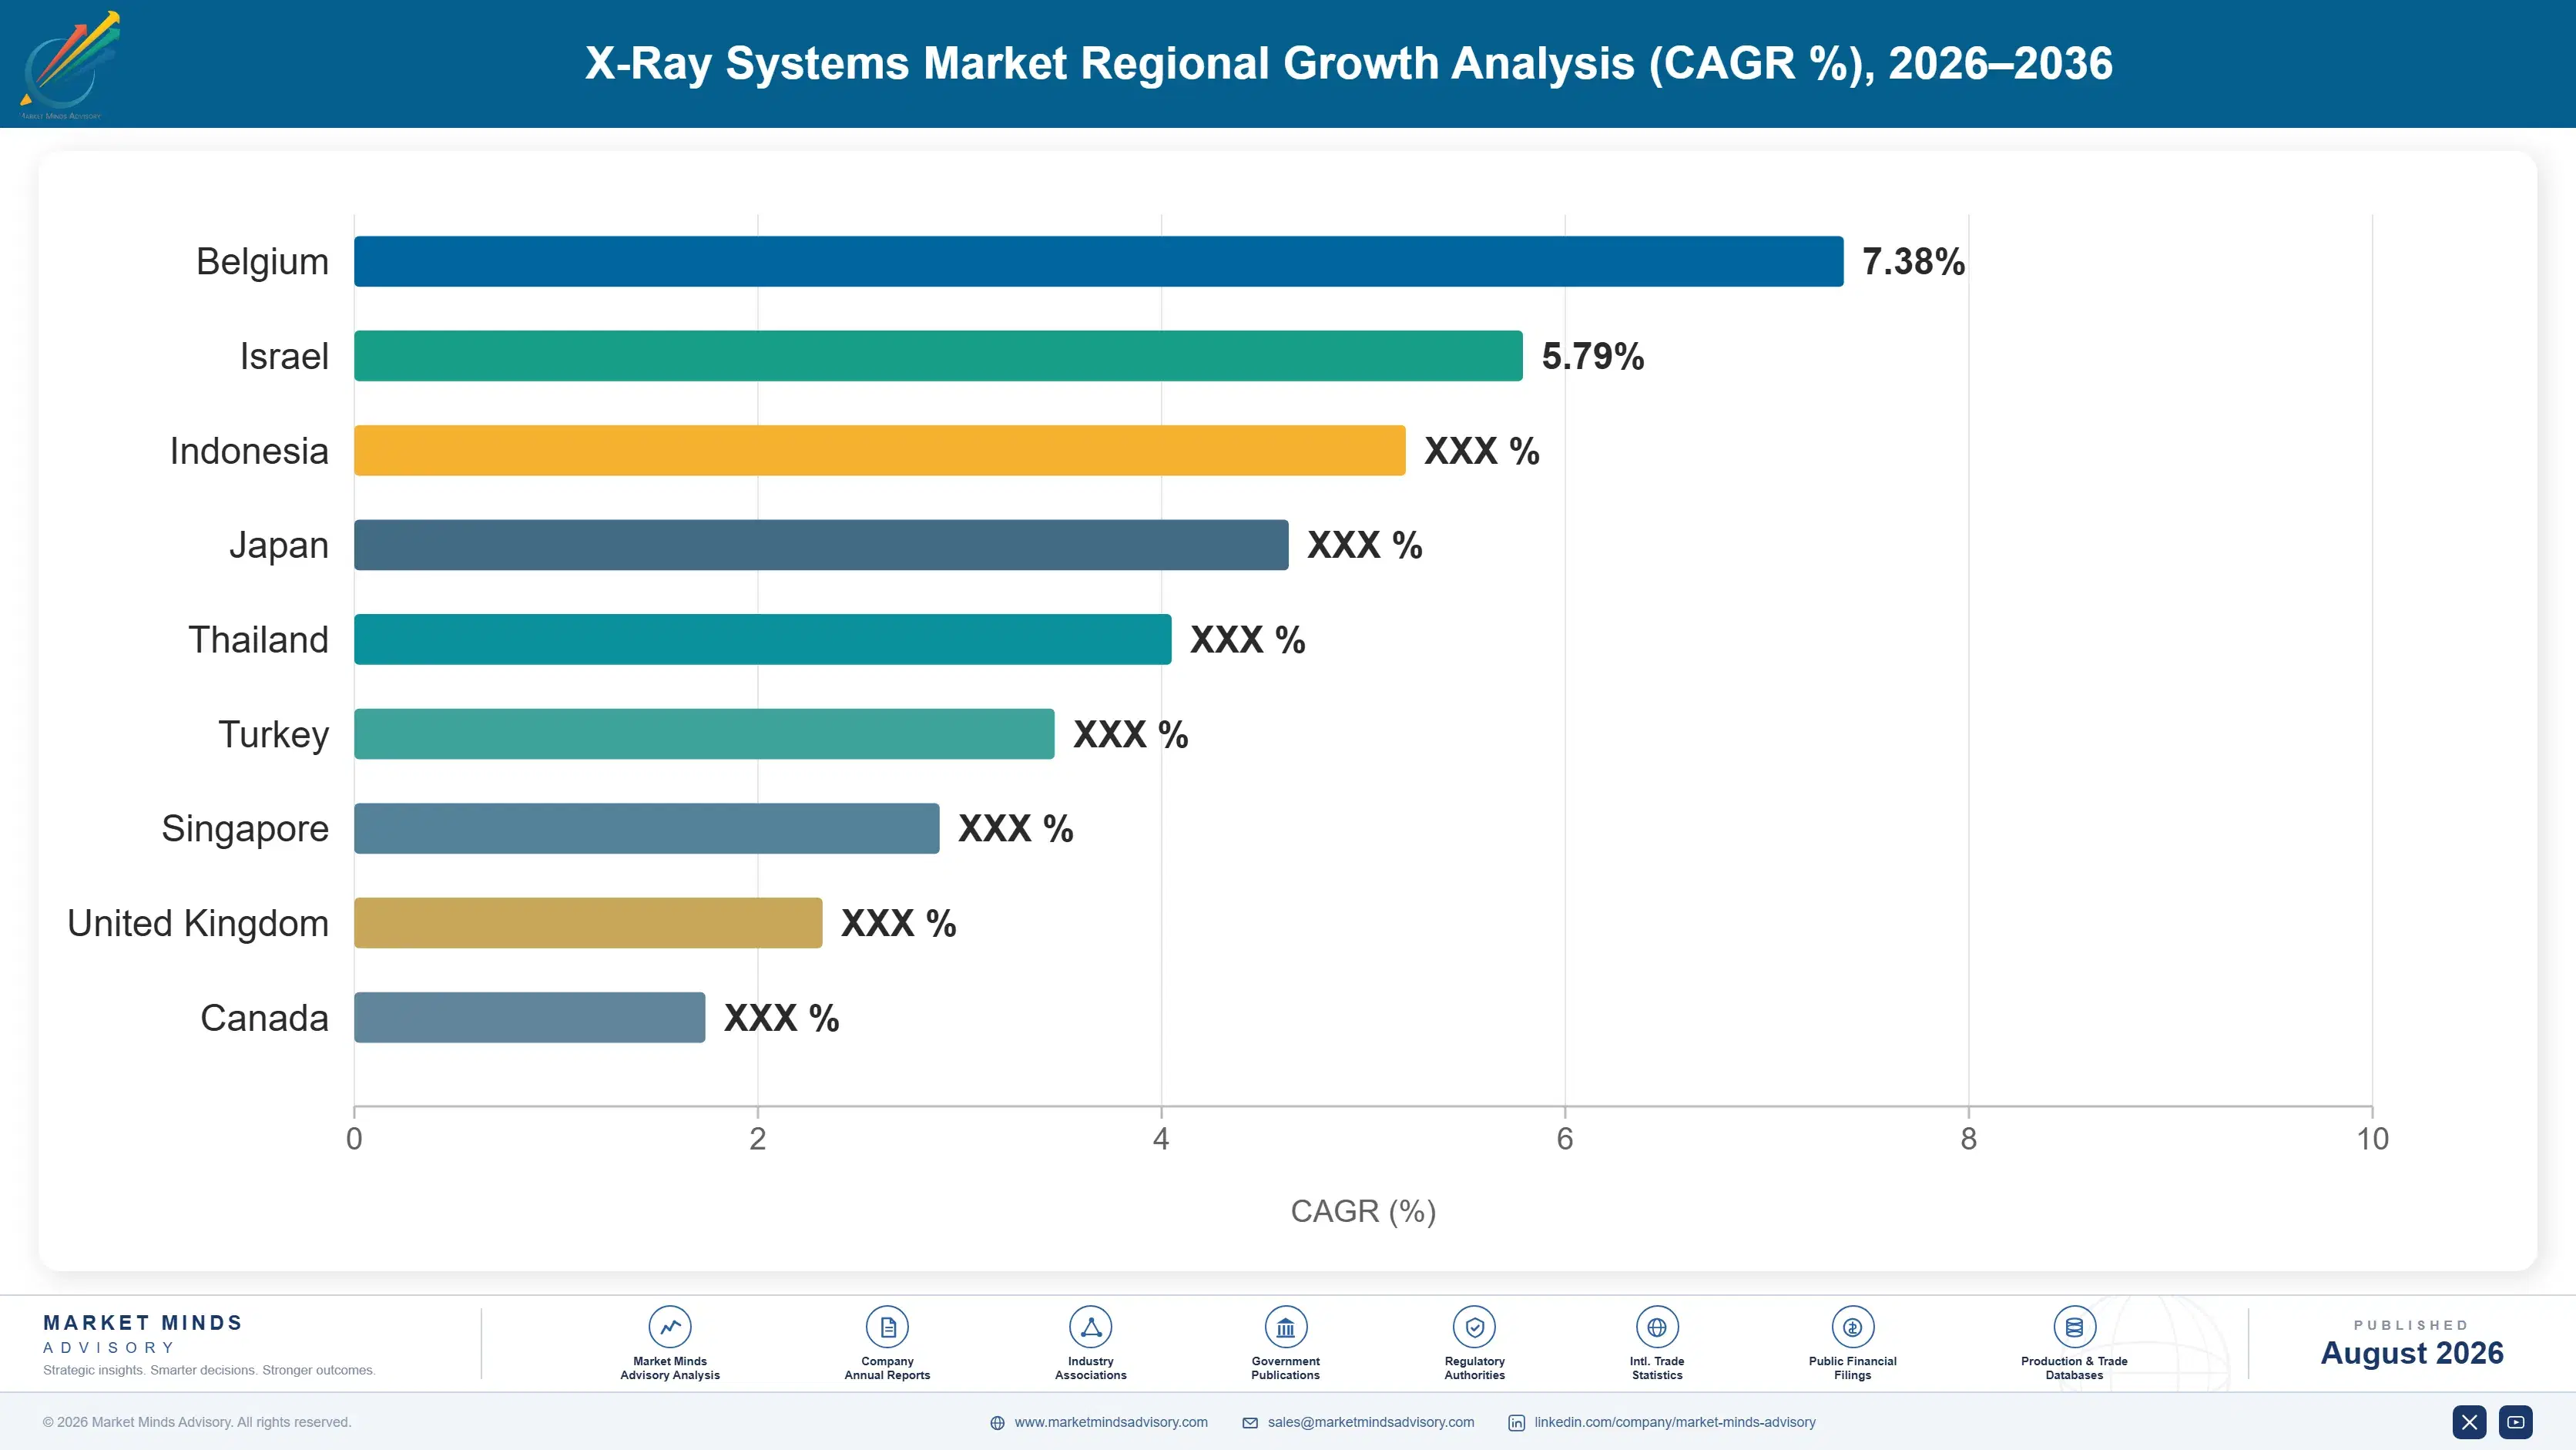
x-ray-systems-market-country-cagr-analysis-1787665184983

Where Imaging Systems Actually Earn

Nothing here is won on generator specification, because that hardware commoditised years ago and customers stopped comparing it. Value accrues to whoever avoids the installation barrier, whoever competes on detectors and software, whoever owns the retrofit channel, and whoever arrives as public programmes deploy. Four routes carry weight and none is about tubes. Installation cost decides everything.

Sell Around The Room Not Into It

A fixed radiography room costs around 1.4 times the equipment in shielding, floor loading and permitted construction, which is a separate capital decision from the imaging one and frequently the one that fails. Mobile and portable systems remove it entirely and grow at 8.7% against a market rate of 5.8% as a result. They also reach settings where the room was always the reason imaging never arrived, which is a considerably larger addressable population than replacement demand in equipped facilities. Around 1.4 times the equipment cost is a capital decision, not an imaging one.
Market Impact: Avoids installation costing 1.4 times the equipment price

Compete On The Detector Not The Generator

Generators and tubes differ little between manufacturers and compete on price, which is exactly the ground Chinese entrants occupy most effectively with adequate hardware at lower cost. Detector performance, dose efficiency and image processing genuinely separate systems, and software already carries around 19% of supplier revenue while rising with each application. Radiography generates around 62% of all imaging examinations, which makes it the obvious modality for algorithmic triage and the obvious place for recurring software revenue to appear. Around 19% software revenue today is where this category's next decade actually sits commercially.
Market Impact: Software already carries 19% of all supplier revenue

Convert Existing Rooms Before Replacing Them

A retrofit detector panel converts an existing room for roughly 0.31 times the cost of a complete new system, using shielding and infrastructure already permitted and in place. With median installed base age near nine years across developed markets, that is a real alternative rather than a marginal one, and it competes directly against new system sales. Manufacturers selling retrofit themselves cannibalise deliberately, which is considerably better than watching a competitor or a third party do it for them. Around 0.31 times a new system is not a marginal saving anybody overlooks.
Market Impact: Retrofit runs at 0.31 times new system cost

Follow County Hospital Equipping Into China

Chinese equipping programmes across county and district hospitals installed imaging capacity at a scale nowhere else attempted, and East Asia holds 32% of demand as a direct consequence. Domestic manufacturers supply most of that volume on price, so competing on hardware cost is not a viable route in for anybody. Detector performance, software applications and service positions in tertiary centres are where international suppliers hold ground, and the programmes continue rather than having concluded. Around 32% of category demand sitting in one region concentrates the competitive question considerably. The programmes have not concluded.
Market Impact: East Asia alone carries 32% of category demand

Who Controls the Margin Pool

Concentration is high and shifting. The top five hold 58% of system shipments, the basis applied consistently throughout this section, though the composition has changed as United Imaging joined established multinationals through domestic scale rather than through any international expansion at all. Siemens Healthineers leads on installed base breadth across system types and geographies, and the gap reflects service infrastructure and application depth rather than any hardware performance difference at all.
Competition runs on three fronts. Multinational manufacturers compete on detector performance, software applications and service coverage where those three things genuinely differentiate a system. Chinese manufacturers compete on adequate hardware at prices that reset expectations in every market they enter. And retrofit and refurbished equipment compete from outside the new system market entirely, taking budget that would otherwise have funded a complete replacement.

Rankings will move with software and algorithmic capability rather than with hardware development, since radiography generates the examination volume that makes automated reading commercially meaningful. The other pressure point is Chinese export expansion, which has already reset pricing in several emerging markets and is proceeding into developed ones with regulatory clearances progressively accumulating behind it.
x-ray-systems-market-company-positioning-matrix-1787665185510

Competitive Moat and Risk Dimensions

SIEMENS HEALTHINEERS

Moat: Service Network And Application Depth

Service infrastructure across virtually every meaningful market provides uptime commitments and response times that hospitals value considerably more than specification differences, and building comparable coverage takes decades rather than capital. Application software depth across system types also spreads development cost in a way single modality competitors cannot approach.
SIEMENS HEALTHINEERS

Risk: Hardware Price Compression

Chinese manufacturers supply adequate hardware at prices that reset expectations in every market they enter, and radiography carries lower regulatory barriers than most imaging modalities. Defending price on generator and mechanical performance is not available, which forces the whole argument onto detectors, software and service where the premium must be earned repeatedly.
UNITED IMAGING HEALTHCARE

Moat: Domestic Scale And Cost Position

Scale built through Chinese equipping programmes provides manufacturing cost position and installed base that international competitors cannot match on price in any market entered subsequently. That base also funds development at a pace domestic scale alone would not have supported a decade ago, which is changing the competitive picture globally.
UNITED IMAGING HEALTHCARE

Risk: International Service Buildout

Selling systems internationally requires service networks, application support and regulatory clearances that take years to establish and cost more than the equipment margin initially returns. Hospitals in developed markets weigh uptime and support at least as heavily as purchase price, which is precisely where an entrant has least to offer.

Players Tracked

Prominent Players

Siemens Healthineers
GE HealthCare
Philips
Canon Medical Systems
United Imaging Healthcare

Other Key Players

Fujifilm
Konica Minolta
Shimadzu
Hologic
Carestream Health
Agfa-Gevaert
Mindray
Neusoft Medical
Wandong Medical
Samsung Medison
Varex Imaging
Ziehm Imaging
Planmeca
Dentsply Sirona
Vieworks

Recent Developments

FEBRUARY 2025

Health system converts fixed rooms through detector retrofit programme

A health system converted analogue and older digital rooms through a detector retrofit programme rather than replacing complete systems, using shielding and infrastructure already permitted. Retrofit conversion costs around 0.31 times a new system, and median installed base age near nine years makes the calculation straightforward for budget holders.
Signal: The room outlives several detector generations, which nobody selling systems mentions to a hospital capital committee anywhere
MAY 2025

Algorithmic triage clearance extends across chest radiography workflows

Regulatory clearance extended for algorithmic triage across chest radiography workflows, prioritising studies with suspected findings for earlier reading. Radiography generates around 62% of all diagnostic imaging examinations, which is what makes automated triage commercially meaningful in a way other modalities cannot match. Volume rather than difficulty decides.
Signal: Examination volume rather than clinical difficulty is what makes this modality attractive to anybody building these products
SEPTEMBER 2025

Chinese manufacturer secures clearances for developed market entry

A Chinese imaging manufacturer secured additional regulatory clearances supporting entry into developed markets, adding to positions already established across emerging ones. Pricing expectations reset in every market these manufacturers enter, and radiography carries lower regulatory barriers than most other imaging modalities. Barriers to entry are correspondingly lower.
Signal: Clearances accumulate quietly and then a pricing structure changes all at once for everybody selling into it

What An Imaging System Costs

Detector panels account for 34% of system cost of goods, with X-ray tubes at 17% and generators, mechanical positioning, software development and regulatory work carrying the remainder. Flat panel detector production is concentrated among a limited number of manufacturers, several of whom also compete in finished systems, which creates an awkward supply relationship. Tube manufacturing is similarly concentrated and requires capability few companies have chosen to build.
Component allocation constrained this category alongside every other electronics dependent industry during the last shortage. Medical device company annual reports documented extended lead times on detector components and control electronics, while China MIIT industrial output data recorded the semiconductor and panel supply conditions behind it. Regulatory clearance obligations made substituting components slower than commercial urgency required, which lengthened the disruption considerably for manufacturers. Nobody escaped it.

Exposure divides by vertical integration rather than by scale. Manufacturers producing their own detectors and tubes control the largest cost elements and their supply, while those buying both from competitors carry price and availability risk on the components that most differentiate a system. That difference explains why several manufacturers invested in detector capability despite the capital involved, and why those that did not are progressively less comfortable.
x-ray-systems-market-cost-volatility-analysis-1787665185705

Secure detector supply or build detector capability

Detector panels are 34% of system cost and the component customers actually evaluate, yet several manufacturers buy them from competitors who also sell finished systems. That relationship is uncomfortable in normal conditions and untenable during allocation. Building or securing detector capability is capital intensive and removes both a cost exposure and a competitive dependency that grows more awkward each year.

Sell retrofit conversion before somebody else does

Retrofit converts an existing room for around 0.31 times a new system, and with median fleet age near nine years the calculation is obvious to any budget holder examining it. Manufacturers avoiding the channel do not prevent the conversion; they simply lose it to third parties. Cannibalising deliberately retains the customer relationship and the service contract behind it.

Build software revenue before hardware pricing compresses further

Software already carries around 19% of supplier revenue and radiography generates around 62% of all imaging examinations, which is the volume that makes algorithmic applications commercially meaningful. Hardware pricing continues compressing as Chinese manufacturers enter more markets. Building recurring software revenue while hardware still funds development is considerably easier than building it afterwards under pressure.

Portfolio Architecture for Margin Defence

Margin architecture divides on whether hardware or capability is being sold. Fixed radiography systems earn least, competing directly against Chinese manufacturers on hardware that genuinely commoditised and against retrofit conversion for the same budget. Mobile systems and premium detectors earn considerably better, since installation avoidance and detector performance are things customers evaluate and pay for. Software applications and service contracts earn best, because they recur and nothing about them commoditises quickly.
The tension runs between installed base and margin quality. System sales create the installed base that generates service contracts, application sales and retrofit opportunities across a decade or more, and those sales increasingly happen at prices that barely justify the effort. Manufacturers protecting hardware price lose placements, and manufacturers pricing to win placements fund the recurring revenue that follows. Neither position is comfortable.

High value pools concentrate in detectors, software and service, none of which is a generator argument. Everything sold on hardware specification competes against manufacturers with cost positions that international suppliers cannot match anywhere. The businesses worth building are those where the recurring revenue behind an installation exceeds what the installation itself earned, which is the only structure that survives the pricing environment this category now has.

Fixed Radiography Hardware

Fixed room systems competing on hardware that has genuinely commoditised, against both Chinese manufacturers and retrofit conversion for the same budget. Price rather than specification decides most of these placements now.
Gross Margin: 24-29%

Mobile Systems And Premium Detectors

Mobile platforms avoiding installation cost entirely and detector technology that customers genuinely evaluate and pay for. Installation avoidance is a value proposition rather than a specification claim anybody has to defend.
Gross Margin: 34-40%

Software Applications And Service

Clinical applications, algorithmic reading support and service contracts recurring across an installed life. The range is wide because application licensing and service contract structures differ substantially between health systems and markets.
Gross Margin: 48-58%
x-ray-systems-market-portfolio-architecture-1787665186207

High-value Sub-segments and Strategic Watch-out

Mobile and Portable Radiography

Fastest growing type at 8.7% because it removes installation costing around 1.4 times the equipment itself. It also reaches settings where the shielded room, rather than the machine, was always the reason imaging never arrived. Battery power and wireless detectors made that possible only recently.
Gross Margin: 34-40%

Mammography Systems

Second fastest at 7.4% on tomosynthesis converting an entire two dimensional installed base rather than any growth in examined population. Reading workload from additional images is where algorithmic support enters the conversation naturally. A like for like conversion of a whole base does not repeat.
Gross Margin: 38-44%

Fixed Digital Radiography

Growing at only 4.6% and carrying the largest installed base, which makes it the exposed core rather than any growth story. Chinese pricing and retrofit conversion compete for exactly the same budget from two different directions. Two very different competitors want exactly the same budget.
Gross Margin: 24-29%

Detectors and Retrofit Panels

Growing at 6.8% and competing directly against the complete systems the same manufacturers would prefer to sell instead. Selling retrofit cannibalises deliberately, which is better than watching third parties do it. Manufacturers who avoid this channel simply lose it rather than actually preventing the conversion.
Gross Margin: 40-46%

How Imaging Demand Recurs

An imaging system generates revenue long after the sale, which is what makes placement worth winning at prices that look unattractive on their own. Service contracts, application licences, detector replacement and eventual retrofit all follow an installation across a decade or more, and median fleet age near nine years indicates how long that relationship runs. Manufacturers protecting hardware margin at the expense of placement are optimising the smallest part of the total.
Stickiness depends on service and applications rather than on hardware. A hospital running a system under a manufacturer service contract with clinical applications embedded in workflow rarely changes supplier at replacement, since retraining and integration cost more than any price difference. A hospital buying hardware and servicing it independently is genuinely open at every replacement cycle, which is where price competition actually bites hardest.

The purchaser is shifting from radiology toward finance and estates. Installation cost at around 1.4 times the equipment brings facilities and capital committees into a decision radiology previously made, and retrofit conversion at roughly a third of new system cost is an argument those committees find immediately persuasive. Manufacturers selling clinical performance to radiologists are reaching a party who no longer controls the budget.
x-ray-systems-market-end-use-penetration-index-1787665186696

Where This Category Rewards Focus

These are among the four positions where our research anticipates prominent divergence between winners and laggards over the coming forecast period. Each is grounded in the demand model, the regulatory perimeter, and the announced capacity pipeline.
01 / INSTALLATION BARRIER BYPASS

The room is the decision, not the machine

A fixed radiography room costs around 1.4 times the equipment in shielding, floor loading and permitted construction, which is a separate capital decision from the imaging one and frequently the one that actually fails. Mobile and portable systems remove that requirement entirely and grow at 8.7% against a market rate of 5.8% as a direct consequence of it. They also reach settings where the room was always the reason imaging never arrived, which is a far larger population than replacement demand.
02 / DETECTOR VALUE CAPTURE

Nobody buys a generator any more

Generators and tubes now differ very little between manufacturers and compete almost entirely on price, which is precisely the ground Chinese entrants occupy most effectively with adequate hardware at lower cost. Detector performance, dose efficiency and image processing genuinely separate systems, and software already carries around 19% of supplier revenue while rising with every application added. Radiography generates around 62% of all imaging examinations, which makes it the obvious modality for algorithmic triage and for recurring revenue to finally appear.
03 / RETROFIT CHANNEL OWNERSHIP

Cannibalise it before a third party does

A retrofit detector panel converts an existing room for roughly 0.31 times the cost of a complete new system, using shielding and infrastructure that is already permitted and in place. With median installed base age near nine years across developed markets, that calculation is obvious to any budget holder who examines it seriously. Manufacturers avoiding the channel do not prevent the conversion happening; they simply lose it to third parties and independent service organisations instead, along with the service contract.
04 / PUBLIC PROGRAMME TIMING

Equipping programmes reset entire pricing structures

Chinese equipping programmes across county and district hospitals installed imaging capacity at a scale nowhere else has attempted, and East Asia holds 32% of category demand as a direct result of that deployment. Domestic manufacturers supplied most of it on price, which means competing on hardware cost is not a viable route in for anybody arriving now. Detector performance, software applications and tertiary centre service positions are where international suppliers hold defensible ground, and the programmes have not concluded yet.

Engagement Snapshot From the Field

A live engagement with an industry participant carrying material or product regulatory and market exposure ahead of a defining policy shift, showing how our research translates into a defensible multi-year portfolio strategy.
MARKET MINDS ADVISORY · CLIENT ENGAGEMENT SUMMARY
X-Ray Systems Producer Strategic Portfolio Review and Transition Roadmap 2026·Investment Scenario on X-Ray Systems Exposure Evaluation 2025-26
CLIENT PROFILE
An imaging equipment manufacturer supplying fixed and mobile radiography systems to hospitals across North America and Western Europe. Annual revenue was approximately 640 million dollars (client-reported, unverified by MMA), predominantly from fixed system sales with service contracts attached. Detector panels were purchased from a supplier that also competed in finished systems, and no retrofit programme existed.
STRATEGIC CHALLENGE
Fixed system pricing had compressed for five consecutive years against Chinese entrants and against retrofit conversion that the client did not offer. Management was weighing further hardware development against detector capability investment and a retrofit programme. Nobody had established how much of the client's own installed base was converting through third party retrofit rather than replacing.
MMA APPROACH
MMA traced conversion activity across the client's installed base to identify how many rooms had been retrofitted by third parties rather than replaced. Detector capability investment and a retrofit programme were costed against continued hardware development. Forty-seven expert interviews with radiology directors, estates managers, capital committee members and independent service organisations established how these decisions are made, alongside survey work across six countries.
KEY FINDINGS
  1. Roughly 30% of the client's installed rooms had been retrofitted by third parties rather than replaced, taking both the conversion revenue and frequently the service contract with it.
  2. Capital committees rather than radiology departments made the final decision in 6 of every 10 replacement cases reviewed, evaluating installation cost above clinical specification.
  3. Detector capability investment was costed at around 4 years to production, against a supply relationship with a competitor that had already tightened once during allocation.
  4. Software application attachment ran at 2 in 10 installations against a competitor benchmark closer to 5, representing recurring revenue the client was simply not pursuing.
CLIENT PROFILE
An imaging equipment manufacturer supplying fixed and mobile radiography systems to hospitals across North America and Western Europe. Annual revenue was approximately 640 million dollars (client-reported, unverified by MMA), predominantly from fixed system sales with service contracts attached. Detector panels were purchased from a supplier that also competed in finished systems, and no retrofit programme existed.
STRATEGIC CHALLENGE
Fixed system pricing had compressed for five consecutive years against Chinese entrants and against retrofit conversion that the client did not offer. Management was weighing further hardware development against detector capability investment and a retrofit programme. Nobody had established how much of the client's own installed base was converting through third party retrofit rather than replacing.
MMA APPROACH
MMA traced conversion activity across the client's installed base to identify how many rooms had been retrofitted by third parties rather than replaced. Detector capability investment and a retrofit programme were costed against continued hardware development. Forty-seven expert interviews with radiology directors, estates managers, capital committee members and independent service organisations established how these decisions are made, alongside survey work across six countries.
KEY FINDINGS
  1. Roughly 30% of the client's installed rooms had been retrofitted by third parties rather than replaced, taking both the conversion revenue and frequently the service contract with it.
  2. Capital committees rather than radiology departments made the final decision in 6 of every 10 replacement cases reviewed, evaluating installation cost above clinical specification.
  3. Detector capability investment was costed at around 4 years to production, against a supply relationship with a competitor that had already tightened once during allocation.
  4. Software application attachment ran at 2 in 10 installations against a competitor benchmark closer to 5, representing recurring revenue the client was simply not pursuing.
RECOMMENDED STRATEGY
Phase 1: Phase one: launch a retrofit programme immediately, since roughly 30% of installed rooms were already converting through third parties instead. Phase 2: Phase two: pursue detector capability over about 4 years, ending a supply dependency on a competitor that has already tightened once. Phase 3: Phase three: rebuild application attachment toward benchmark, currently 2 in 10 installations against a competitor figure closer to 5 installations.
OUTCOME
The client launched a retrofit programme and recaptured conversion revenue alongside service contracts that had been leaving with third party upgrades. Detector capability investment was approved on supply security grounds rather than cost, and application attachment improved materially once selling was directed at it deliberately (client-reported, unverified by MMA).

Frequently Asked Questions

Foundational context covering the market sizes, CAGR, scope, country, region and competition that inform every finding below. This section is provided to cover basics and most often pre-purchase conversations, answered from the MMA Primary Research Dataset.

What is the current size of the X-Ray Systems Market?

The market was valued at 14.2 billion dollars in 2025, covering diagnostic X-ray imaging systems and their detectors worldwide. It reaches an estimated 15.02 billion dollars during 2026.

How large will the X-Ray Systems Market be by 2036?

MMA forecasts 26.40 billion dollars by 2036, an increase of 11.38 billion dollars over the 2026 base. That represents an expansion multiple of 1.76 times across the forecast period.

What is the CAGR for the X-Ray Systems Market 2026 to 2036?

The base case compound annual growth rate is 5.8%, with a bull case of 7.0% and a bear case of 4.6%. Algorithmic reading adoption and retrofit substitution separate those two scenarios.

Which segment is growing fastest?

Mobile and portable radiography grows at 8.7%, half again the market rate of 5.8%, because it avoids installation costing more than the equipment. Mammography follows at 7.4%.

Who are the major companies in the X-Ray Systems Market?

Siemens Healthineers, GE HealthCare, Philips, Canon Medical Systems and United Imaging Healthcare lead on system shipments worldwide. Together they account for 58% of the global market.

Which country is growing fastest?

India grows fastest at 9.8%, because public equipping programmes and private diagnostic chains have expanded imaging access across district and tier two cities at the same time.

Report Segmentation Architecture

The full report scope spans multiple orthogonal segmentation dimensions, with cross-tabulated demand data provided for each dimension pair. Coverage extends further to regional breakdowns, trend trajectories, and the competitive detail needed to support segment-level decision-making.

By System Type

  • Fixed Digital Radiography
  • Mobile and Portable Radiography
  • Fluoroscopy and Interventional Systems
  • Mammography Systems
  • Dental Radiography
  • Detectors and Retrofit Panels

By End-Use Industry

  • Hospital Radiology Departments
  • Emergency and Critical Care
  • Orthopaedic and Specialty Clinics
  • Breast Screening Programmes
  • Dental Practices
  • Primary Care and Community Imaging

By Commercial Dimension

  • Direct Hospital Supply
  • Distributor and Dealer Supply
  • Public Tender Procurement
  • Refurbished Equipment Trade
  • Service and Maintenance Contracts
  • Retrofit and Upgrade Supply

By Region

  • North America
  • Western Europe
  • East Asia
  • South Asia and Pacific
  • Latin America
  • Middle East and Africa
  • Eastern Europe

Scope, Methodology, and Coverage

Every figure in this report is reproducible from documented input assumptions. The scope below maps the historical period, the forecast horizon, the segmentation dimensions, and the countries covered, alongside the underlying primary and qualitative methodology.
Historical Period
2020 to 2025
Forecast Period
2026 to 2036
Base Year
2025 (USD billions; MMA Primary Research Dataset, August 2026)
Market Definition
Diagnostic X-ray imaging systems and their detectors worldwide, covering fixed digital radiography, mobile and portable radiography, fluoroscopy and interventional systems, mammography systems including digital breast tomosynthesis, dental radiography, and flat panel detectors and retrofit panels sold separately, together with associated clinical application software, measured at manufacturer selling value. Computed tomography, magnetic resonance imaging, ultrasound, nuclear medicine and molecular imaging, radiation therapy equipment, and industrial or veterinary imaging systems are excluded from scope entirely.
Quantitative Units
USD billions (manufacturer selling value); systems shipped; USD per system by type
Segmentation Dimensions
System type; end-use industry; commercial dimension; region
Regions Covered
North America, Western Europe, East Asia, South Asia and Pacific, Latin America, Middle East and Africa, Eastern Europe
Countries Covered
United States, Canada, Germany, France, United Kingdom, Italy, Spain, Netherlands, Sweden, China, Japan, South Korea, Taiwan, India, Australia, Indonesia, Vietnam, Brazil, Mexico, Saudi Arabia, South Africa, Poland
Key Companies Profiled
Siemens Healthineers, GE HealthCare, Philips, Canon Medical Systems, United Imaging Healthcare, Fujifilm, Konica Minolta, Shimadzu, Hologic, Carestream Health, Agfa-Gevaert, Mindray, Neusoft Medical, Wandong Medical, Samsung Medison, Varex Imaging, Ziehm Imaging, Planmeca, Dentsply Sirona, Vieworks
Quantitative Methodology
Primary survey, n=3,800 respondents, Q4 2025, six countries; demand-side model with trade association cross-validation
Qualitative Methodology
47 expert interviews, Q4 2025; applied to validate demand model assumptions, identify emerging dynamics, and assess competitive positioning
Report Format
PDF and XLSX data workbook (Word format preview document)
Publisher
Market Minds Advisory
Report Code
MMA-2026-MED-141
Published
August 2026
Contact
sales@marketmindsadvisory.com | www.marketmindsadvisory.com

Purchase the full X-Ray Systems Market Report (2026 to 2036).

The full report treats X-ray as a category where the interesting economics moved off the machine entirely, into detectors, software and the installation cost that decides whether a system is bought at all. It sizes all six system types independently through 2036, models retrofit conversion against replacement demand by installed base age, and quantifies how installation cost governs deployment in capacity constrained settings. Regional chapters cover all seven regions, with Chinese equipping scale assessed separately from developed market replacement economics. Competitive profiling covers 20 participants on one consistent shipment measure.
Six system types sized independently through 2036
Retrofit conversion modelled against replacement demand by fleet age
Installation cost quantified against equipment price by setting
Software and service revenue separated from hardware throughout
Chinese manufacturer export expansion tracked by clearance and market
Twenty participants profiled on one consistent shipment measure

Built For The People Who Decide

From boardroom strategy to bench-side execution, this report is read cover-to-cover by leaders shaping the next decade of their industry, turning demand scenarios, market dynamics and valuation benchmarks into decisions.
CXOs/ Presidents/ VPs/ Managers
M&A and Corporate Development
Strategy Teams and R&D Heads
Procurement and Product Directors
Regulatory and Compliance Leaders
Investor Relations and Equity Analysts