
Market Minds Advisory
Packaging Labels Market

Packaging Labels Market Size, Share & Trends 2026-2036

E-commerce fulfillment volume and private label proliferation are pushing standard packaging label demand toward faster-turnaround digital and short-run converting faster than legacy commodity printers can retool across most consumer goods categories worldwide.

Lead Analyst

Bilal Shaikh

Published

November 2026

Make Smarter Decisions with Customized Research Insights

Request a free sample report and evaluate market opportunities, growth trends, and competitive dynamics relevant to your business needs.

2025 MARKET VALUE$18.5BMarket Size 2025
2036 FORECAST VALUE$31.3BBase Case , 2026 to 2036
CAGR 2026 TO 20364.9 %Bull 6.1% / Bear 3.7%
INCREMENTAL OPPORTUNITY$11.9BNet 10- year value creation
EXPANSION MULTIPLE1.61x2036 value over 2026 base
Strategic Levers
M&A Pipeline
Regional Outlook
Country Rankings
Competitive Intelligence
Segmental Deep-dive
Call-Us : 91 93563 13602

Packaging Labels Demand Outlook

Packaging labels are moving from a standardized commodity print run into a fragmented specification landscape, as e-commerce fulfillment, private label proliferation, and short-run promotional packaging demand converting flexibility that conventional long-run analog printing was never designed to support across most consumer goods categories now.
Food, beverage, and household goods applications concentrate the largest volume in East Asia's dense consumer goods manufacturing base, while private label and e-commerce fulfillment adoption is growing fastest across North America and parts of Europe as retailers and brand owners seek shorter runs and faster turnaround, extending demand well beyond simple product identification into comprehensive brand differentiation and regulatory compliance programs across most major packaging markets, a shift already visible across most major consumer.
Competitive intensity is rising as diversified converters compete across an unusually fragmented supplier base, since no single converter dominates a category this large, while short-run agility and digital print integration increasingly separate leading converters from followers across retail and e-commerce accounts, a pattern reshaping consolidation across the mid-tier converter segment as turnaround speed becomes a deciding factor for securing the largest consumer packaged goods brand contracts broadly this year.
Market Definition
This report covers packaging labels broadly: standard pressure-sensitive and glue-applied labels used across food, beverage, household goods, and e-commerce shipping applications, printed through conventional flexographic, offset, or digital methods. It excludes the specialty decoration technologies covered under separate reports, including foil, metallic, in-mold, and laminated labels. The in-mold label market is already worth USD 4.2 billion in 2025, and MMA expects a 6.5% CAGR from here to 2036.
Base Year Value
$18.5B in 2025 (MMA Primary Research Dataset, October 2026)
Forecast Period
2026 to 2036, eleven discrete annual values
CAGR
4.9% base case. Bull 6.1%. Bear 3.7%.
Fastest Growth Segment
E-Commerce Shipping and Fulfillment Labels: 7.4% CAGR
Fastest Growth Country
India: 6.8% CAGR
Fastest Growth Region
South Asia and Pacific: 6.9% CAGR
Largest Region
East Asia: 28% of 2025 global value
Market Leaders
CCL Industries, Avery Dennison, Multi-Color Corporation, UPM Raflatac, and Fuji Seal International lead by shipment volume. Source: MMA Analysis based on company annual reports.
Primary Survey
n=3,800 procurement and R&D decision-makers, Q4 2025, six countries
Methodology
Demand-side build-up, cross-validated against public data, 47 expert interviews

Packaging Labels Growth Scenarios to 2036

packaging-labels-market-size-forecast-scenario-1791303632046
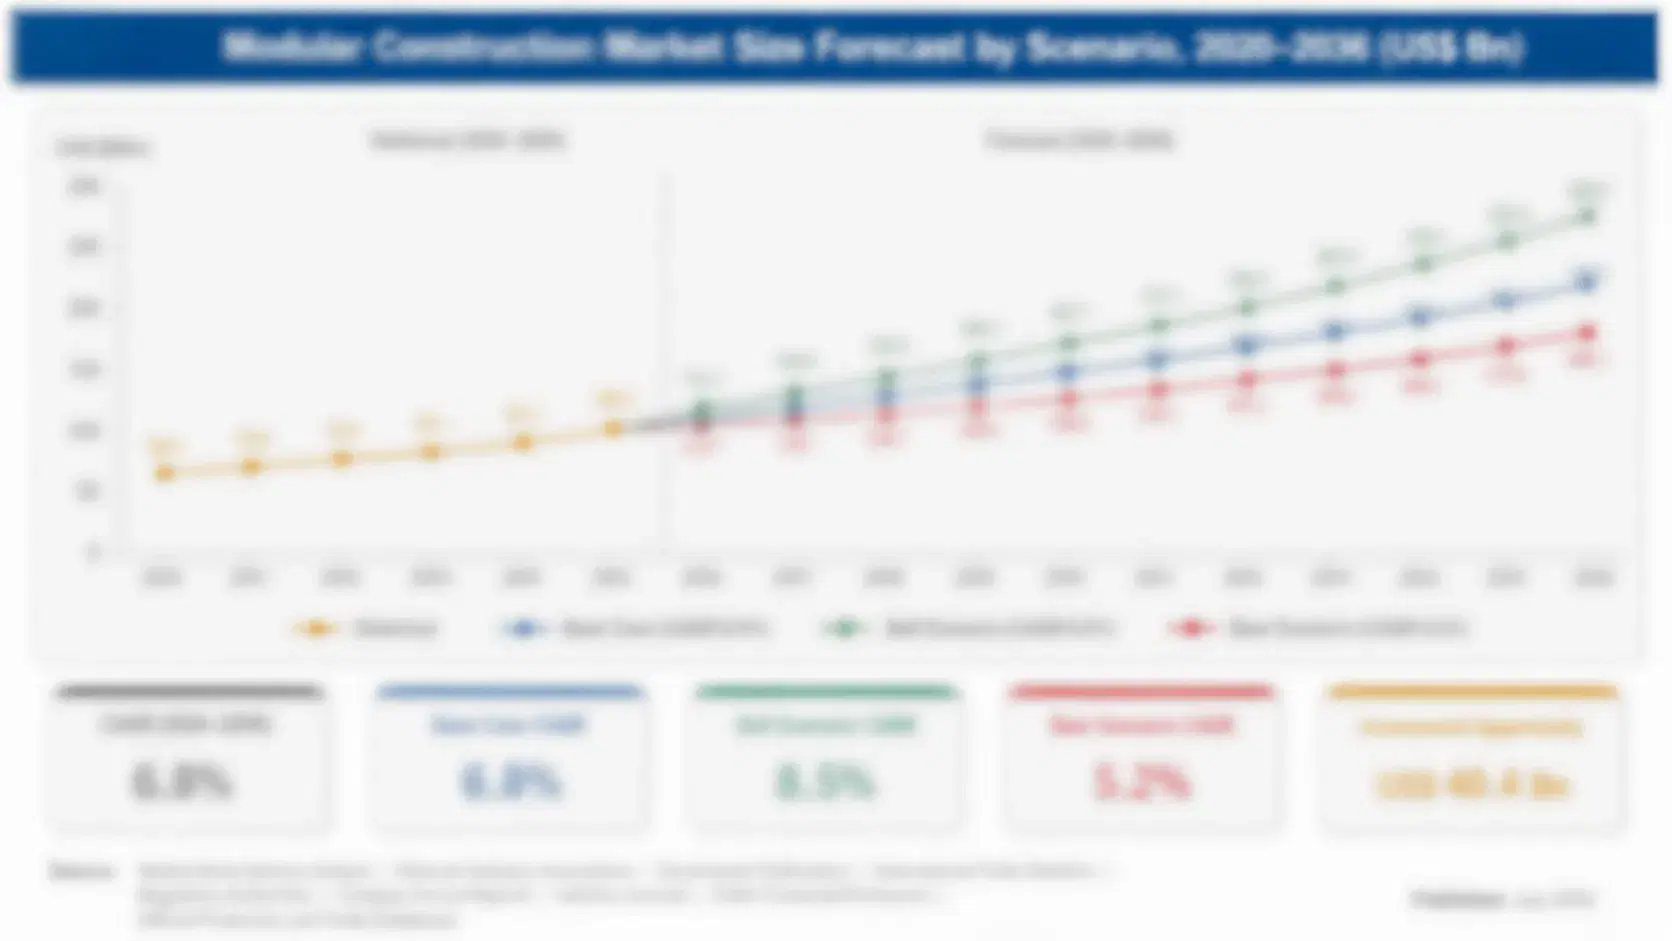
Packaging label demand grew steadily between 2020 and 2025 as e-commerce fulfillment volume expanded sharply and private label proliferation accelerated across food and household goods categories, with growth picking up noticeably once digital and short-run converting capacity matured enough to handle rising SKU variety without sacrificing cost efficiency at scale, setting a firm historical baseline that MMA extrapolates forward for the 2026 to 2036 forecast period specifically.
MMA's base case assumes continued expansion driven by three commercial mechanisms: e-commerce fulfillment centers scaling shipping label consumption to match rising parcel volume, private label brands proliferating SKU variety across food and household categories, and converters replacing long-run analog printing with flexible digital and short-run capacity during normal equipment lifecycle upgrades across most major consumer goods markets through the coming decade of continued fragmentation, with all three mechanisms reinforcing each other through shared capital investment cycles across.
The bull case centers on accelerating private label and e-commerce SKU proliferation pulling converters toward digital and short-run capacity faster than currently planned, while the bear case reflects slower-than-expected consumer goods volume growth that keeps conventional long-run converting economics competitive for stable, high-volume brand accounts, delaying some converters' planned capital equipment upgrades by several budget cycles.

Turnaround Flexibility Is Becoming the Deciding Factor

Converters with flexible digital and short-run capacity already serving private label and e-commerce accounts are capturing a growing share of new contract awards, since retailers and brand owners increasingly treat fast turnaround and SKU flexibility as baseline requirements rather than premium add-ons across most packaging categories, pushing long-run-only competitors toward partnership or exit decisions. Retailers are now writing turnaround time and SKU flexibility directly into supplier qualification. The same pull shows up in the labels market, where MMA projects a 6.2% CAGR through 2036.
MARKET CONCENTRATION29%Combined share held by top five converters globally
AVERAGE SELLING PRICE$0.03/unitBlended unit price across standard and digital formats
TOP PRODUCING COUNTRY26%Share of global production capacity sited domestically today
CAPACITY UTILIZATION76%Average across installed label production lines worldwide today
PRIVATE LABEL ADOPTION SHARE35%Portion of output used in private label packaging programs now
SUBSTRATE INPUT COST SHARE31%Share of production cost tied to specialty facestock sourcing
Capacity investment is concentrating among converters already serving private label and e-commerce accounts, where turnaround requirements are tightening fastest. Standard long-run brand accounts remain comparatively price-driven. Converters without digital and short-run access are increasingly relegated to lower-margin commodity long-run accounts, where competitive intensity runs highest across the broader category overall. This split is becoming more pronounced each procurement cycle as e-commerce and private label buyers consolidate purchasing toward a smaller digital-capable supplier pool. Adjacent demand is captured in the in-mold labels market, which MMA expects to grow from USD 1.95 billion in 2025 to USD 3.7 billion by 2036.
Average selling prices are rising gradually as digital and short-run formats displace conventional long-run analog printing across private label and e-commerce applications, even as converters serving mass-market staple goods accounts continue competing primarily on price and delivery reliability within a comparatively thin-margin segment of the broader category overall. This bifurcation is expected to widen further as SKU proliferation continues accelerating. For a connected opportunity, MMA values the metallic labels market at USD 1.15 billion in 2025.
"Standard labels used to be the boring part of the business. Now SKU proliferation means the converter who can turn a job in a day, not a week, wins the account."
Senior Analyst, Packaging Labeling Practice · MMA General Pressure-Sensitive Packaging Labeling Practice · October 2026

Packaging Labels Adoption Trends

Digital Print Integration Absorbing Rising SKU Variety Economically

Digital print integration adapted for mainstream packaging label production is reaching cost parity with conventional flexographic printing at increasingly longer run lengths, letting converters absorb rising SKU variety from private label and e-commerce accounts without the plate setup costs that analog printing requires at comparable volumes. This cost parity shift is concentrated among the largest converters first, with smaller regional converters still relying on conventional analog production for standard long-run accounts. Converters investing in digital capacity are winning short-run contracts that previously required separate specialty converter relationships, capturing share from competitors unable to match current turnaround benchmarks. The same pressures carry over to the pre gummed labels market, where MMA forecasts USD 1.95 billion by 2036 at a 4.2% CAGR.
Market Impact: Adds 38 billion shipping labels yearly
Smart Label Integration Expanding Into Mainstream Consumer Packaging

QR code and smart label integration that once appeared primarily on premium or specialty packaging is spreading into mainstream consumer goods labeling as brand owners seek direct consumer engagement channels and supply chain traceability without separate decoration steps. Adoption is concentrated among the largest consumer packaged goods brands first, where digital engagement campaigns justify the incremental printing complexity involved. Converters investing in smart label integration capacity are winning contracts from brands seeking traceability and engagement features that conventional static labels cannot deliver across their product portfolios broadly across most major retail categories today. Measured on its own, the smart label market is valued by MMA at USD 11.8 billion in 2025, heading to USD 35.7 billion by 2036.
Market Impact: Adds 12,000 new private label SKUs

Packaging Labels Strategic Opportunities

E-Commerce Fulfillment Centers Scaling Shipping Label Consumption

E-commerce fulfillment centers are scaling shipping label consumption to match rising parcel volume, directly pulling converter capacity investment into scope for facilities that previously relied on simpler labeling programs across most major logistics markets. This expansion is forcing converters serving fulfillment accounts to add digital print capability or risk losing contracts to competitors already qualified under the turnaround standards major e-commerce operators now demand. Converters with established fulfillment center relationships are extending those contracts into adjacent retail categories fastest, capturing early mover advantage across this expanding demand scope across the broader logistics industry today. This ties directly to the pin feed labels market, which MMA forecasts will reach USD 0.48 billion by 2036 at a 3.2% CAGR.
Market Impact: Caps margin at 18 percent

Private Label Brands Proliferating SKU Variety Across Categories

Private label brands are proliferating SKU variety across food, beverage, and household goods categories as retailers compete for shelf differentiation against national brands, directly pulling converter capacity toward short-run, fast-turnaround production that conventional long-run converting cannot economically support. This proliferation is concentrated among the largest retail chains first, since smaller independent retailers often lack the scale to justify dedicated private label SKU investment at comparable unit economics. Converters serving multiple retail accounts simultaneously are capturing scale advantages that smaller single-account competitors increasingly struggle to match today across most major retail categories now.
Market Impact: Adds 16 percent cost volatility swings

Packaging Labels Cost and Adoption Hurdles

Fragmented Competitive Base Limiting Pricing Power

The packaging labels category's unusually fragmented competitive base, with no single converter commanding a dominant share, limits pricing power for even the largest players and keeps margins persistently thin relative to specialty decoration categories commanding premium positioning. The root cause is the category's low barriers to entry for standard long-run production, since conventional flexographic equipment requires comparatively modest capital investment relative to specialty decoration technologies covered elsewhere. Leading converters are mitigating this through bundled service differentiation and digital capability investment, though smaller players often lack the capital to match comparable service breadth.
Market Impact: Cuts run length to 3,800 units

Substrate Cost Volatility Compressing Converter Margins

Specialty facestock and adhesive costs remain volatile enough that some converters report difficulty maintaining consistent margins across multi-year brand contracts, particularly when paper and film input costs swing meaningfully during broader commodity price cycles affecting the category. The root cause traces to the label's dependence on pulp and specialty film markets, both of which are subject to broader industrial commodity cycles that converters cannot control through their own operational decisions. Leading converters are mitigating this through hedged material contracts and buffer inventory, though smaller players often lack the capital to maintain comparable positions.
Market Impact: Adds 4.2 billion smart-enabled labels
3 additional market trends, 2 additional growth drivers, and 4 additional restraints and challenges are covered in the full report. Contact sales@marketmindsadvisory.com to access the complete intelligence.

Packaging Labels Growth by Segment

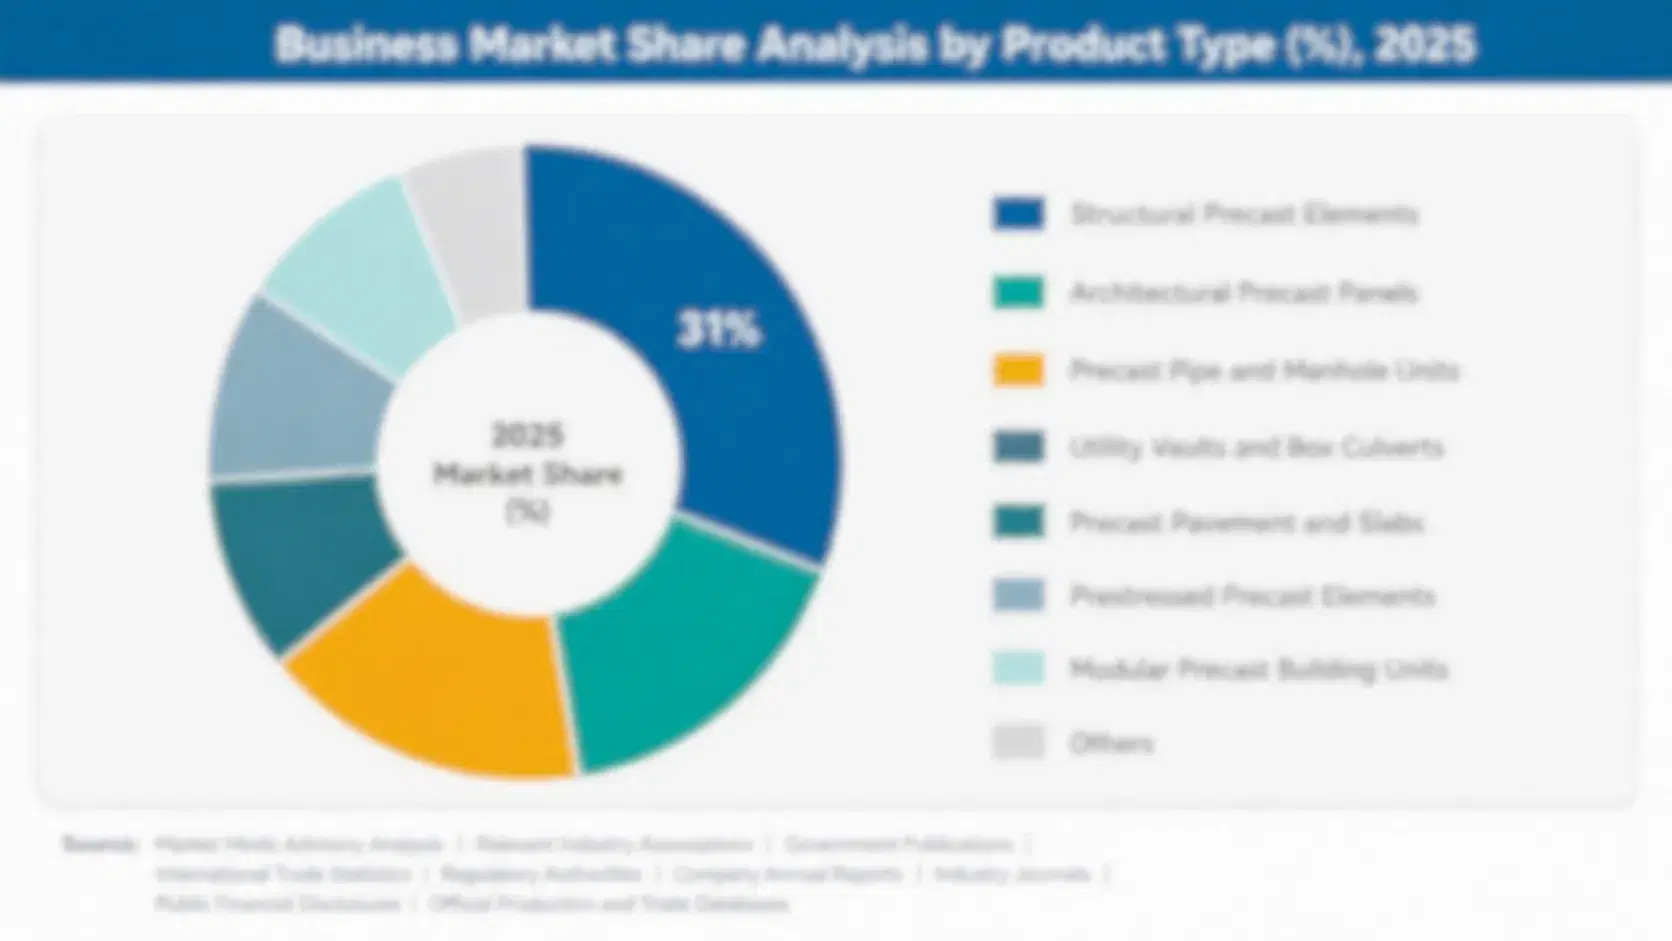
Packaging label demand splits across end-use application segments shaped by turnaround requirements and SKU variety economics. E-commerce shipping and private label formats are pulling capacity investment fastest, while conventional long-run food and beverage segments add differentiated but steadier volume. Converters are prioritizing capacity expansion toward these two growth paths, while monitoring emerging smart label integration economics closely.
packaging-labels-market-market-share-analysis-1791303632332

E-Commerce Shipping and Fulfillment Labels

E-commerce shipping and fulfillment labels are the fastest-growing segment, used across parcel shipping, returns processing, and fulfillment center operations where turnaround speed and volume scalability matter most to converter profitability. Demand is concentrated among the largest e-commerce fulfillment operators first, who face the steepest parcel volume growth and labeling throughput pressure across their distribution networks. Converters serving this segment increasingly pair digital print capability with automated application integration, since fulfillment operators now specify both capabilities jointly rather than treating them as separable purchasing decisions. Growth here is expected to stay well ahead of the broader category average through the full forecast window as adoption spreads from the largest operators toward mid-tier fulfillment centers.
CAGR 7.4%

Private Label Packaging Labels

Private label packaging labels form the second-fastest segment, driven by retailer SKU proliferation across food, beverage, and household goods categories as private label brands compete for shelf differentiation against national brands. Converters with established short-run digital capacity are best positioned to serve retailers facing the highest SKU variety requirements, since these customers often cannot justify the setup costs associated with conventional long-run analog printing for smaller volume runs. This segment's growth trajectory depends heavily on continued digital print cost reduction, which varies somewhat by converter but is broadly moving in the same favorable direction across most major retail markets served by the industry currently Several retailers are also requesting bundled digital proofing services to shorten approval cycles for new private.
CAGR 6.5%
Full segment breakdown across 7 segments available in the complete report.

Packaging Labels Regional and Country Demand

East Asia leads global packaging label demand on the strength of its dense consumer goods manufacturing base, with North America close behind through e-commerce fulfillment adoption. The remaining five regions show meaningfully different adoption paces tied to retail market maturity, shaped largely by consumer goods manufacturing scale and retail SKU.

East Asia

China anchors East Asian demand through its concentrated food, beverage, and household goods manufacturing base, where standard packaging labels are produced at massive scale serving both domestic consumption and export markets. Japan and South Korea contribute substantial incremental demand tied to their retail and e-commerce sectors, both increasingly adopting digital print capacity for faster turnaround. Taiwan's converter base is scaling digital capacity rapidly, serving both domestic packaging brands and export-oriented contract manufacturing simultaneously. Converters across the region are increasingly exporting packaging labels to serve smaller Southeast Asian markets lacking comparable domestic converting capacity, reinforcing a scale advantage competitors elsewhere find difficult to replicate given the manufacturing volume concentrated at this base. The Japan structured product label management market moves on similar drivers, with MMA projecting a 6.5% CAGR over 2026-2036.
Share: 28% | CAGR: 5.9% (2026 to 2036)

North America

The United States anchors North American demand through its concentrated e-commerce fulfillment and private label retail base, where brand owners are specifying digital print capability as a baseline procurement requirement across most new supplier qualification processes. Private label retailers expanding SKU variety across food and household goods categories are driving particularly steep demand for short-run digital converting. Canada follows a broadly similar adoption trajectory with a modest lag tied to smaller domestic converter capital investment relative to the United States. Mexico's growing contract manufacturing sector is adding incremental demand as nearshoring investment accelerates across the broader region, though both markets continue converging toward comparable digital specification standards across most major packaging categories served.
Share: 27% | CAGR: 4.6% (2026 to 2036)
Regional intelligence for 5 additional markets available in the complete report: Western Europe, South Asia and Pacific, Latin America, Middle East and Africa, Eastern Europe. Contact sales@marketmindsadvisory.com.
packaging-labels-market-country-cagr-analysis-1791303632658

Where Converters Can Capture More Margin

Converters hold several commercial levers to capture value beyond standard unit pricing in packaging labels. Digital proofing services, smart label integration, and multi-year retail supply contracts each offer distinct paths to margin expansion as SKU variety and turnaround requirements tighten across e-commerce and private label accounts, with the most successful converters pursuing more than one lever simultaneously rather than choosing.

Digital Proofing and Rapid Turnaround Services Program

Converters bundling digital proofing services alongside physical label production are capturing recurring revenue beyond standard unit pricing, since retailers increasingly prefer a single accountable supplier for both proofing and production rather than managing separate vendor relationships for each function. This bundled approach adds roughly 10 to 15 percent to per-unit contract value compared to standalone production, reflecting the proofing software, approval workflow, and ongoing technical support retailers now expect as part of a complete short-run turnaround solution. This approach also strengthens contract renewal rates since switching proofing providers mid-cycle disrupts approval workflow continuity.
Market Impact: Adds 10 to 15 percent to value today

Smart Label Integration and Traceability Services Program

Converters offering smart label integration, including QR code encoding and supply chain traceability features, are securing premium contract pricing that generic static labeling alone cannot command, since brand owners value the consumer engagement and compliance documentation these features provide. These integration services typically lock in multi-year contract commitments at premium pricing roughly 13 percent above standard label rates, reflecting the specialized encoding and data management capability most generic converters lack entirely. Converters without such integration capability increasingly struggle to compete for flagship retail accounts where traceability documentation has become a specification requirement.
Market Impact: Secures pricing 13 percent above standard rates today

Packaging Labels Pricing and Margins

The top five converters hold a combined 29 percent share on a global production volume basis, leaving an unusually fragmented field below them where regional specialists compete on turnaround speed rather than scale. The gap between the leading converter and the nearest challenger reflects roughly three years of accumulated digital print integration experience that smaller competitors are still working to close, a gap that.
Current competitive activity centers on digital print technology acquisitions, smart label licensing deals, and private label supply partnerships, as diversified converters race to add short-run capability without building internal digital expertise from scratch. Several mid-tier players have announced capacity expansions specifically targeting e-commerce fulfillment demand ahead of expanding turnaround specification requirements, signaling that scale alone is no longer sufficient to compete for the largest e-commerce accounts.

Emerging pressure is coming from specialty digital print startups entering through licensing partnerships with established converters rather than direct competition, a path that could reshuffle rankings over the next several years as these partnerships mature into broader commercial relationships. Rankings among the top five are likely to shift as turnaround speed capability increasingly separates leaders from followers. Converters watching from the sidelines risk losing ground permanently once these partnerships mature.
packaging-labels-market-company-positioning-matrix-1791303632918

Packaging Labels Supplier Positioning

CCL INDUSTRIES

Moat: Global Converting Scale Network

CCL Industries operates one of the broadest converter networks globally, letting it serve multinational retail and e-commerce accounts with consistent turnaround performance across every manufacturing region, a capability smaller regional converters cannot easily match given the capital intensity of comparable digital equipment investment at global scale.
CCL INDUSTRIES

Risk: Scale Without Differentiation Risk

CCL Industries' broad commodity exposure across standard packaging accounts creates margin pressure from investors seeking segment-level profitability disclosure, pushing the company to justify continued investment in digital and smart label differentiation against lower-margin core business lines across every major procurement cycle going forward, particularly in digital-focused supplier reviews.
AVERY DENNISON

Moat: Diversified Converting Technology Depth

Avery Dennison's broad decoration technology portfolio, spanning standard, digital, and specialty converting, lets it serve retail accounts with a single-supplier relationship across multiple label categories, an operational advantage that reduces vendor management complexity for customers consolidating their packaging label supply base across most of its regional accounts specifically today.
AVERY DENNISON

Risk: Commodity Margin Exposure Gap

Avery Dennison's exposure to high-volume commodity packaging accounts alongside its specialty portfolio has left it comparatively more exposed to pricing pressure in this fragmented category where competitors with narrower focus are capturing disproportionate new contract awards across most new contract bids reviewed broadly today today.

Players Tracked

Prominent Players

CCL Industries
Avery Dennison
Multi-Color Corporation
UPM Raflatac
Fuji Seal International

Other Key Players

Constantia Flexibles
Huhtamaki
Taghleef Industries
Resolute Forest Products
Sonoco Products
WS Packaging Group
Inland Label
Spectrum Label
Jindal Poly Films
Cosmo Films
Schreiner Group
tesa SE
Nitto Denko
Fedrigoni
Autajon Group

Recent Developments

MARCH 2026

CCL Industries acquired a digital print technology developer to bring short-run capability in house, reducing dependency on third-party equipment partners for its private label and e-commerce accounts. The acquisition expands CCL Industries' digital converting capacity and secures exclusive access to several proprietary print technologies previously licensed only through the acquired.
Signal: Vertical integration into digital print signals deeper turnaround commitment ahead and competitors are taking notice quickly
SEPTEMBER 2025

Avery Dennison entered a joint venture with a smart label technology provider to offer bundled traceability and engagement solutions to retail and e-commerce accounts across North America and Europe. The joint venture combines Avery Dennison's label production with the technology partner's encoding infrastructure, creating a combined offering neither company could.
Signal: Joint venture signals converters are racing to bundle production and smart features across the industry today

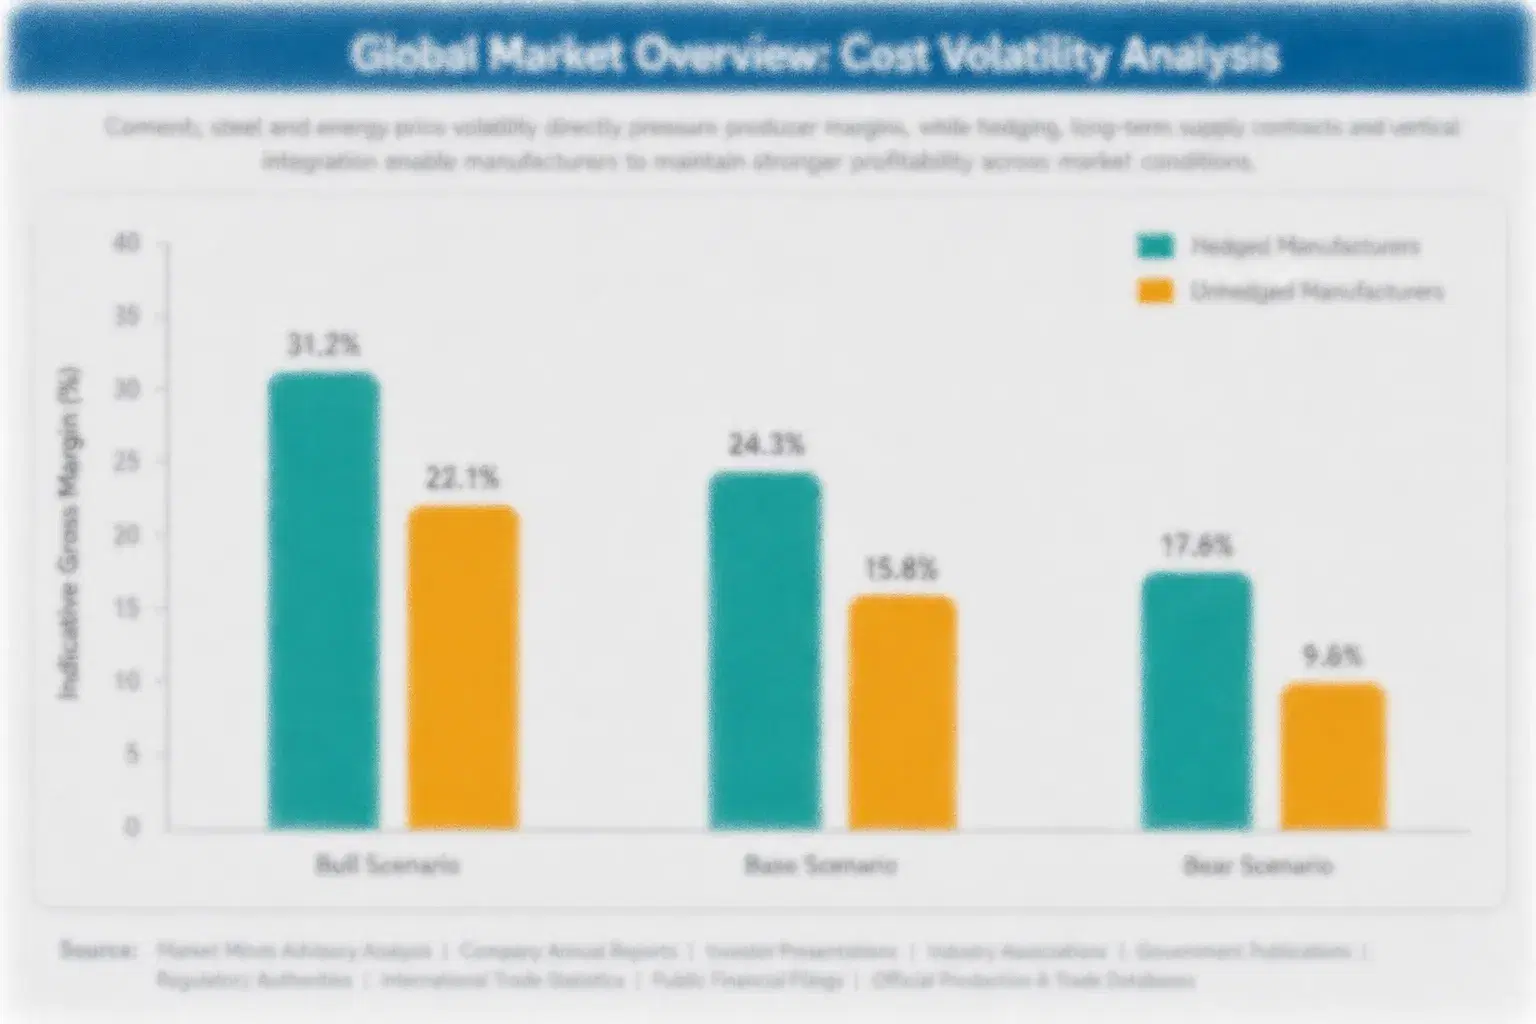
Facestock Substrate Cost Exposure

Specialty facestock paper and film substrate together account for roughly 31 percent of total cost of goods sold for a typical packaging label, sourced primarily from pulp and specialty film producers concentrated in North America, Northern Europe, and increasingly China's expanding paper and film processing capacity serving export-oriented converter operations globally. Standard adhesive formulation and extended quality testing overhead add a further meaningful share, leaving smaller.
Pulp and specialty film prices spiked sharply during 2021 and 2022 as supply chain disruptions tied to pandemic-era logistics constraints rippled through paper and petrochemical production costs globally, according to IEA and EIA commentary covering related manufacturing supply chains during that period in detail. Converters without hedged substrate supply contracts absorbed significant margin compression during this window, forcing several smaller players to pass costs through to retail.

Converters without long-term substrate supply agreements face a lasting cost disadvantage against larger competitors able to negotiate multi-year fixed pricing directly with pulp and film producers, leaving smaller players exposed to spot market volatility during price spikes recurring periodically across broader commodity cycles. This exposure varies meaningfully by geography too, since converters in regions with domestic pulp and film production face less currency and shipping risk than.
packaging-labels-market-cost-volatility-analysis-1791303633260

Multi-Year Substrate Supply Contracts

Converters are increasingly locking in multi-year paper and film substrate supply contracts with fixed or collared pricing to reduce exposure to spot market volatility during commodity price spikes. This approach requires sufficient scale to interest producers in long-term commitments, favoring larger converters over smaller independents lacking comparable purchasing volume currently today, particularly for smaller players lacking comparable negotiating leverage.

Regional Substrate Sourcing Diversification

Some converters are diversifying substrate sourcing across multiple regional suppliers rather than depending on a single producer, reducing shipping risk and currency exposure tied to any one geography specifically across their operations. This strategy adds supplier qualification overhead but meaningfully improves resilience against regional supply disruptions over time, particularly for converters serving multiple geographic markets simultaneously across their customer base.

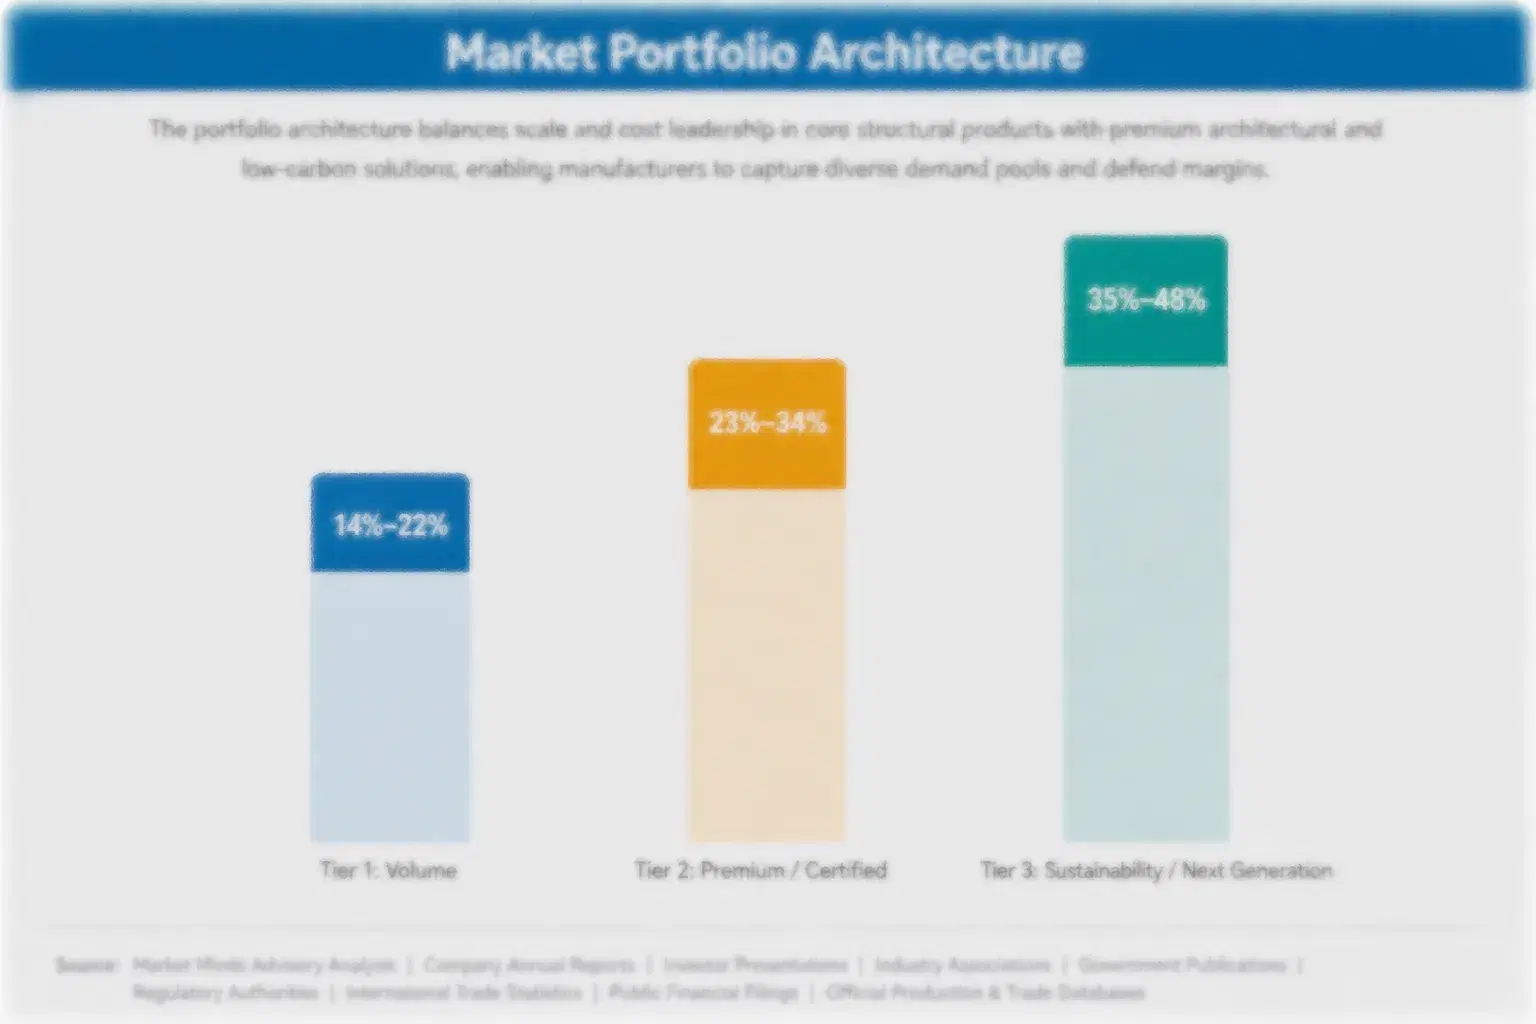
Portfolio Architecture for Margin Defence

Packaging label portfolios split across three tiers with meaningfully different margin economics, from commodity standard long-run formats through certified digital short-run products to next-generation smart-enabled and sustainability-oriented designs still gaining commercial traction across most markets served today. Volume tiers compete primarily on price and delivery reliability, while premium digital formats command sustained pricing power through turnaround agility and technology integration barriers that limit new entrant competition meaningfully across the category overall.
The tension between volume and premium positioning is sharpening as private label and e-commerce operators increasingly demand certified turnaround agility across their full supply base, pushing converters to shift production mix toward higher-specification formats even when near-term margin benefits remain uncertain across different accounts served broadly. Converters slow to make this transition risk losing contract renewals to competitors already positioned in the premium tier ahead of them.

High-value margin pools concentrate heavily in e-commerce fulfillment and private label short-run applications, both commanding premiums well above commodity standard long-run formats across most markets currently served by the industry worldwide. Converters that invest early in these pools are positioning themselves ahead of where premium turnaround specification requirements are clearly heading across the coming decade of continued fragmentation.

Standard long-run label formats competing primarily on price and delivery reliability across cost-sensitive accounts, representing the largest volume base but thinnest margins in the category overall, with limited pricing power against larger competitors holding better input cost positions overall.
Gross Margin

Digital short-run formats meeting stringent e-commerce and private label turnaround specifications, commanding sustained pricing power through agility barriers that limit competitive entry meaningfully across this tier, a position converters work hard to defend once achieved given the technology investment required to reach it.
Gross Margin

Emerging smart-enabled and sustainability-oriented formats still gaining commercial traction, positioned to capture outsized margin as traceability specification gradually increases across most major markets, though adoption timelines vary considerably depending on each retailer's technology investment pace specifically.
Gross Margin
packaging-labels-market-portfolio-architecture-1791303633582

High-value Sub-segments and Strategic Watch-out

E-Commerce Shipping and Fulfillment Labels

This fastest-growing segment combines high volume with premium certified pricing, making it the clearest high-value high-growth pool in the category. Converters with early digital integration are capturing disproportionate share as operators consolidate purchasing toward validated suppliers only, a pattern expected to persist, reinforcing its position as the category's clearest growth.

Private Label Packaging Labels

A large, high-value segment growing at a moderate but steady pace, anchored by expanding retailer SKU proliferation. Margins here remain comparable to the fastest-growing segment given similarly specialized short-run requirements across most major retail markets served by converters globally, particularly as SKU proliferation extends progressively across additional retail categories.

Conventional Long-Run Brand Labels

A stable segment serving high-volume national brand applications with lower turnaround requirements, currently trailing the category average as adoption remains concentrated among the largest global manufacturers facing the steadiest demand today, with demand expected to remain steady as these accounts prioritize reliability over turnaround speed.

Fragmented Low-Barrier Converter Capacity

A strategic watch-out segment where converters lacking digital or scale differentiation face mounting competitive exposure. Continued substrate price volatility could force consolidation among smaller undifferentiated players unable to secure capital for upgrades going forward across most categories, especially where converters hold no near-term technology investment plan currently.

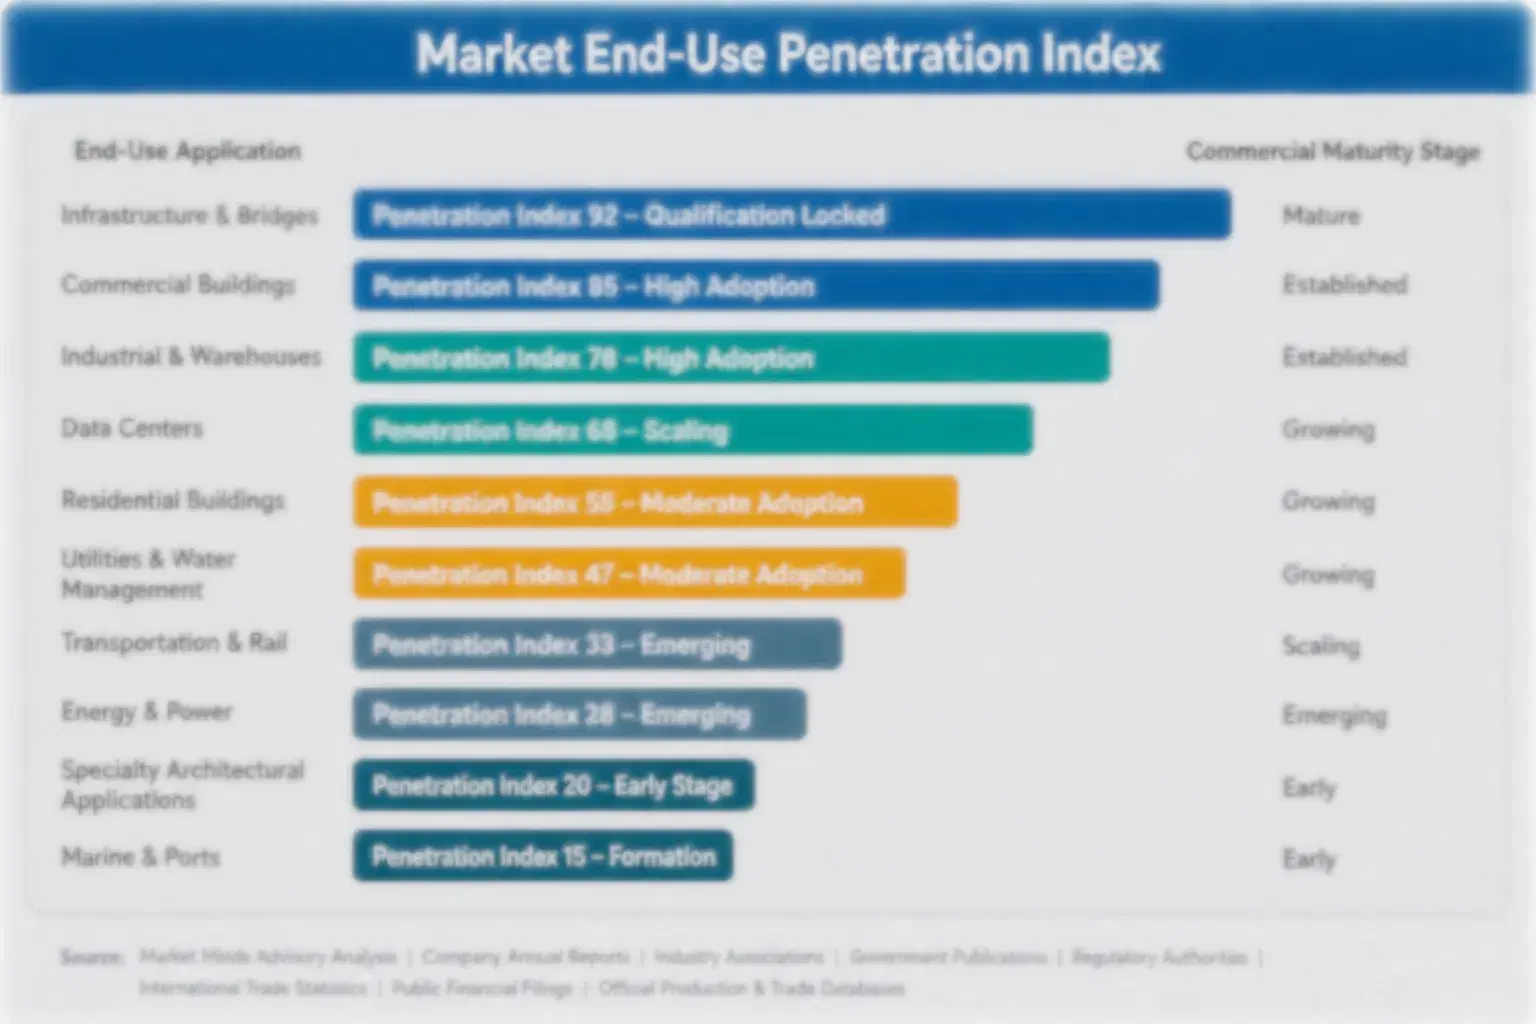
Annuity Demand and Buyer Stickiness

Packaging label supply runs on annuity economics once a converter clears retail or e-commerce fleet certification, since switching qualified label suppliers requires re-validating turnaround and quality performance across an entire supply network, a costly process most retailers avoid repeating often across their global footprint across most certified accounts served today, reinforcing the annuity character of.
Adoption stickiness varies meaningfully by end-use vertical, with private label retailers showing the deepest lock-in given fleet software integration and SKU management investment, while e-commerce fulfillment shows somewhat shallower stickiness as operators occasionally dual-source across certified converters to manage supply risk during periods of elevated substrate price volatility. National brand applications sit between these two extremes currently, with adoption still consolidating as turnaround requirements tighten gradually across major retail regions worldwide.

A generational shift in buyer profiles is underway as e-commerce and merchandising officers increasingly co-own packaging specification decisions alongside traditional procurement teams, pushing label adoption beyond pure cost calculus toward turnaround readiness scorecards that factor into corporate risk reporting obligations. Younger procurement professionals entering packaging roles show markedly less resistance to premium digital formats than their predecessors did. This shift is most visible among major private label and e-commerce customers currently reviewing supplier scorecards.
packaging-labels-market-end-use-penetration-index-1791303633886

Strategic Priorities for Converters

These are among the four positions where our research anticipates prominent divergence between winners and laggards over the coming forecast period. Each is grounded in the demand model, the regulatory perimeter, and the announced capacity pipeline.
01 / DIGITAL PRINT CAPITAL INVESTMENT

Prioritize digital short-run capacity across core production lines

Converters without sufficient digital short-run capacity are losing private label and e-commerce contract renewals to competitors already equipped across comparable production lines across their full manufacturing footprint. Capacity expansion requires upfront capital and multi-quarter installation cycles, but it secures premium tier pricing, multi-year contract commitments, closer technical collaboration with retail customers, and priority access to constrained equipment manufacturer allocation. Players that delay this investment risk permanent exclusion from the fastest-growing segment as operators consolidate purchasing toward validated suppliers, while early movers capture outsized share of new contract awards.
02 / SUBSTRATE SUPPLY SECURITY

Secure multi-year facestock contracts before next price cycle

Substrate price volatility tied to pulp and petrochemical cycles has repeatedly compressed converter margins during supply disruptions over the past several years across most regions served by the industry today. Locking in multi-year fixed or collared pricing with established producers protects margin during the next inevitable volatility event and secures priority allocation when supply tightens unexpectedly during the next cyclical downturn. Smaller converters lacking scale to negotiate favorable terms should consider pooled purchasing arrangements with regional peers facing similar exposure.
03 / REGIONAL CAPACITY EXPANSION

Expand converting capacity in East Asia ahead of demand acceleration

East Asia's consumer goods manufacturing concentration and expanding e-commerce brand proliferation are driving the fastest regional demand growth across the entire forecast window through 2036 and beyond. Converters without meaningful regional presence risk ceding share to domestic competitors positioned closer to both substrate supply and brand customers across the region's major manufacturing hubs, particularly China and South Korea. Capacity expansion decisions made over the next several years will likely determine competitive positioning for the following decade, favoring players who move before rivals commit comparable capital to the same expanding regional.
04 / TURNAROUND BRAND POSITIONING

Align product roadmaps with tightening SKU variety and turnaround requirements

E-commerce and merchandising officers are increasingly co-owning packaging specification decisions, pushing retail customers toward suppliers with credible digital turnaround and smart label integration capability across their full global supply base. Converters that proactively build this capability into their commercial offering gain an edge during brand supplier reviews that increasingly weight turnaround heavily alongside price, reliability, and prior relationship history across multiple contract cycles. This positioning matters most for private label and e-commerce accounts facing the strictest near-term SKU variety expectations.

Engagement Snapshot From the Field

A live engagement with an industry participant carrying material or product regulatory and market exposure ahead of a defining policy shift, showing how our research translates into a defensible multi-year portfolio strategy.
MARKET MINDS ADVISORY · CLIENT ENGAGEMENT SUMMARY
Packaging Labels Producer Strategic Portfolio Review and Transition Roadmap 2026·Investment Scenario on Packaging Labels Exposure Evaluation 2025-26
CLIENT PROFILE
The client was a mid-sized grocery retail chain operating private label programs across five countries, exploring a transition toward digital short-run labeling for its expanding private label SKU portfolio following mounting pressure to compete with national brands on shelf variety. The engagement took place in the third quarter of 2025, commissioned directly by the chain's private label merchandising and packaging leadership jointly.
STRATEGIC CHALLENGE
The client faced a decision between three competing converters with meaningfully different digital print capability, turnaround speed, and pricing structures, none of which had been independently benchmarked against each other on a consistent commercial basis previously. The chain needed an independent, commercially consistent comparison framework before committing to a multi-year supply award covering its full five-country private label footprint.
MMA APPROACH
MMA conducted supplier benchmarking across digital print capability, turnaround speed, and contract pricing structure, supplemented by primary interviews with converter technical leads and a review of each supplier's quality consistency validation documentation submitted to the client directly. The assessment weighted print capability, turnaround, and pricing structure consistently across all three candidates to produce a single comparable scorecard.
KEY FINDINGS
  1. Converter A offered the fastest turnaround but relied on a single production facility, creating meaningful supply concentration risk during demand spikes specifically.
  2. Converter B held the strongest multi-year substrate pricing contracts but lagged roughly two quarters behind on digital capability for the client's specific label format.
  3. Converter C's pricing was most competitive but its quality consistency documentation showed gaps against the client's private label brand standards, requiring additional validation work before award.
  4. None of the three converters had previously served a client with the chain's five-country private label footprint, requiring custom logistics modeling for each candidate evaluated.
CLIENT PROFILE
The client was a mid-sized grocery retail chain operating private label programs across five countries, exploring a transition toward digital short-run labeling for its expanding private label SKU portfolio following mounting pressure to compete with national brands on shelf variety. The engagement took place in the third quarter of 2025, commissioned directly by the chain's private label merchandising and packaging leadership jointly.
STRATEGIC CHALLENGE
The client faced a decision between three competing converters with meaningfully different digital print capability, turnaround speed, and pricing structures, none of which had been independently benchmarked against each other on a consistent commercial basis previously. The chain needed an independent, commercially consistent comparison framework before committing to a multi-year supply award covering its full five-country private label footprint.
MMA APPROACH
MMA conducted supplier benchmarking across digital print capability, turnaround speed, and contract pricing structure, supplemented by primary interviews with converter technical leads and a review of each supplier's quality consistency validation documentation submitted to the client directly. The assessment weighted print capability, turnaround, and pricing structure consistently across all three candidates to produce a single comparable scorecard.
KEY FINDINGS
  1. Converter A offered the fastest turnaround but relied on a single production facility, creating meaningful supply concentration risk during demand spikes specifically.
  2. Converter B held the strongest multi-year substrate pricing contracts but lagged roughly two quarters behind on digital capability for the client's specific label format.
  3. Converter C's pricing was most competitive but its quality consistency documentation showed gaps against the client's private label brand standards, requiring additional validation work before award.
  4. None of the three converters had previously served a client with the chain's five-country private label footprint, requiring custom logistics modeling for each candidate evaluated.
RECOMMENDED STRATEGY
Phase 1: Phase one: commission independent quality consistency validation testing for Converter C to close documentation gaps before any award decision directly. Phase 2: Phase two: negotiate a dual-sourcing arrangement combining Converter A's speed with Converter B's pricing security across different private label lines. Phase 3: Phase three: build a shared quality reporting template usable across both awarded converters to simplify future private label production planning.
OUTCOME
The client awarded a dual-sourcing contract six months after engagement completion, reporting a meaningful reduction in single-supplier dependency risk and improved private label launch turnaround scores across its five-country footprint (client-reported, unverified by MMA). Projected five-year substrate cost savings versus the original single-supplier path were estimated in the low seven figures (client-reported, unverified by MMA).

Frequently Asked Questions

Foundational context covering the market sizes, CAGR, scope, country, region and competition that inform every finding below. This section is provided to cover basics and most often pre-purchase conversations, answered from the MMA Primary Research Dataset.

What is the current size of the Packaging Labels Market?

The global packaging labels market reached 18.50 billion dollars in 2025. This figure reflects validated converter shipment data across certified retail and e-commerce applications worldwide.

How large will the Packaging Labels Market be by 2036?

MMA projects the market will reach 31.31 billion dollars by 2036. This represents a meaningful expansion from the 2026 forecast base, driven by e-commerce and private label growth.

What is the CAGR for the Packaging Labels Market 2026 to 2036?

The market is forecast to grow at a 4.9 percent compound annual rate between 2026 and 2036. This pace reflects steady adoption of certified digital short-run formats.

Which segment is growing fastest?

E-Commerce Shipping and Fulfillment Labels is the fastest-growing segment, expanding at a 7.4 percent CAGR, roughly 1.51 times the overall market rate. Parcel volume growth is the primary driver.

Who are the major companies in the Packaging Labels Market?

Leading participants include CCL Industries, Avery Dennison, Multi-Color Corporation, UPM Raflatac, and Fuji Seal International. These five companies collectively hold roughly 29 percent of global shipment volume.

Which country is growing fastest?

India is the fastest-growing country market, expanding at a 6.8 percent CAGR as its e-commerce sector scales digital print investment. Domestic brand customization demand is accelerating.

Packaging Labels Market Segmentation

The full report scope spans multiple orthogonal segmentation dimensions, with cross-tabulated demand data provided for each dimension pair. Coverage extends further to regional breakdowns, trend trajectories, and the competitive detail needed to support segment-level decision-making.
  • Digital Short-Run Labels
  • Conventional Long-Run Labels
  • Smart-Enabled Labels
  • Food and Beverage
  • Household Goods
  • E-Commerce and Logistics
  • National Brand Procurement
  • Private Label Procurement
  • Fulfillment Center Procurement

By Region

  • North America
  • Western Europe
  • East Asia
  • South Asia and Pacific
  • Latin America
  • Middle East and Africa
  • Eastern Europe

Scope, Methodology, and Coverage

Every figure in this report is reproducible from documented input assumptions. The scope below maps the historical period, the forecast horizon, the segmentation dimensions, and the countries covered, alongside the underlying primary and qualitative methodology.
Historical Period
2020 to 2025
Forecast Period
2026 to 2036
Base Year
2025 (USD billions; MMA Primary Research Dataset, October 2026)
Market Definition
This report covers packaging labels broadly: standard pressure-sensitive and glue-applied labels used across food, beverage, household goods, and e-commerce shipping applications, printed through conventional flexographic, offset, or digital methods. It excludes the specialty decoration technologies covered under separate reports, including foil, metallic, in-mold, and laminated labels.
Quantitative Units
USD billions, 2025 to 2036
Segmentation Dimensions
End-use application, print technology, commercial channel, region
Regions Covered
North America, Western Europe, East Asia, South Asia and Pacific, Latin America, Middle East and Africa, Eastern Europe
Countries Covered
40+ countries across seven global regions
Key Companies Profiled
20 companies spanning packaging converters and substrate suppliers
Quantitative Methodology
Primary survey, n=3,800 respondents, Q4 2025, six countries; demand-side model with trade association cross-validation
Qualitative Methodology
47 expert interviews, Q4 2025; applied to validate demand model assumptions, identify emerging dynamics, and assess competitive positioning
Report Format
PDF and XLSX data workbook (Word format preview document)
Publisher
Market Minds Advisory
Report Code
MMA-2026-PAC-338
Published
October 2026
Contact
sales@marketmindsadvisory.com | www.marketmindsadvisory.com

Purchase the full Packaging Labels Market Report (2026 to 2036).

This report gives packaging procurement and retail merchandising teams a validated view of the packaging labels market, combining primary survey data with converter and substrate supplier interviews conducted during the fourth quarter of 2025. It covers sizing, segmentation, regional dynamics, competitive positioning, and input cost exposure across the full forecast period extending through 2036. The analysis is designed to support sourcing decisions, capacity investment planning, and turnaround strategy roadmapping for brand owners and converters alike operating across this highly fragmented category. It also benchmarks converter sourcing resilience against substrate supply volatility risk.
Validated 2025 to 2036 market sizing and forecast scenarios
Seven-region share and growth rate breakdown
Five-segment MECE market structure with growth rates
Twenty-company competitive benchmarking and moat analysis
Input cost exposure and mitigation pathway assessment
Anonymized client case study with recommended strategy

Built For The People Who Decide

From boardroom strategy to bench-side execution, this report is read cover-to-cover by leaders shaping the next decade of their industry, turning demand scenarios, market dynamics and valuation benchmarks into decisions.
CXOs/ Presidents/ VPs/ Managers
M&A and Corporate Development
Strategy Teams and R&D Heads
Procurement and Product Directors
Regulatory and Compliance Leaders
Investor Relations and Equity Analysts