

Market Minds Advisory
Optoelectronic Development Tools Market

Optoelectronic Development Tools Market: Test and Measurement Systems for Photonic Device Engineering.

Photonic integrated circuit volume production is pulling test equipment demand toward automated wafer-level probing far faster than legacy manual bench testing, rewarding vendors who solve throughput and precision together over those still selling single-device instruments.

Lead Analyst

Published

September 2026

Make Smarter Decisions with Customized Research Insights

Request a free sample report and evaluate market opportunities, growth trends, and competitive dynamics relevant to your business needs.

2025 MARKET VALUE$2.9BMarket Size 2025
2036 FORECAST VALUE$7.1BBase Case , 2026 to 2036
CAGR 2026 TO 20368.5 %Bull 9.7% / Bear 7.3%
INCREMENTAL OPPORTUNITY$4.0BNet 10- year value creation
EXPANSION MULTIPLE2.26x2036 value over 2026 base
Strategic Levers
M&A Pipeline
Regional Outlook
Country Rankings
Competitive Intelligence
Segmental Deep-dive
Call-Us : 91 93563 13602

Executive Snapshot and Market Trajectory.

Optoelectronic development tool demand has shifted decisively toward photonic integrated circuit characterization, as silicon photonics moves from research curiosity into volume production for AI interconnect and pushes test engineers toward equipment that legacy discrete component testers were never designed to handle at comparable throughput.
Photonic integrated circuit volume production and coherent optical component testing are the two dominant commercial forces, concentrating volume in East Asia, where semiconductor foundry capacity and photonics manufacturing scale both outpace most other regions of the world today. Photonic integrated circuit test and characterization systems absorb a rapidly growing share of spend, since wafer-level optical testing increasingly requires automated systems that legacy manual bench setups cannot support at comparable production volume or throughput.
Competitive intensity spans established test and measurement vendors alongside specialized photonics instrumentation makers competing on wavelength precision and automated wafer probing throughput, a dynamic reshaping vendor selection criteria across foundry and device maker accounts worldwide today. Falling instrument cost from modular, software-defined test platforms is pulling sophisticated characterization capability into smaller photonics startups that previously could not justify the capital investment at all across their early product development cycles.
Market Definition
The Optoelectronic Development Tools Market covers test, measurement, and characterization equipment used to design, validate, and manufacture photonic integrated circuits, lasers, detectors, and other optoelectronic components. It excludes the optoelectronic devices themselves, general-purpose electronic test equipment without photonic-specific capability, and fiber optic cable manufacturing equipment.
Base Year Value
$2.9B in 2025 (MMA Primary Research Dataset, September 2026)
Forecast Period
2026 to 2036, eleven discrete annual values
CAGR
8.5% base case. Bull 9.7%. Bear 7.3%.
Fastest Growth Segment
Photonic Integrated Circuit Test and Characterization Systems: 13.5% CAGR
Fastest Growth Country
China: 11.0% CAGR
Fastest Growth Region
South Asia and Pacific: 10.5% CAGR
Largest Region
East Asia: 30% of 2025 global value
Market Leaders
Keysight Technologies, EXFO, Yokogawa Electric, Thorlabs, and MKS Instruments (Newport) lead the global Optoelectronic Development Tools Market. Source: MMA Primary Research Dataset, July 2026, and company disclosures.
Primary Survey
n=3,800 procurement and R&D decision-makers, Q4 2025, six countries
Methodology
Demand-side build-up, cross-validated against public data, 47 expert interviews

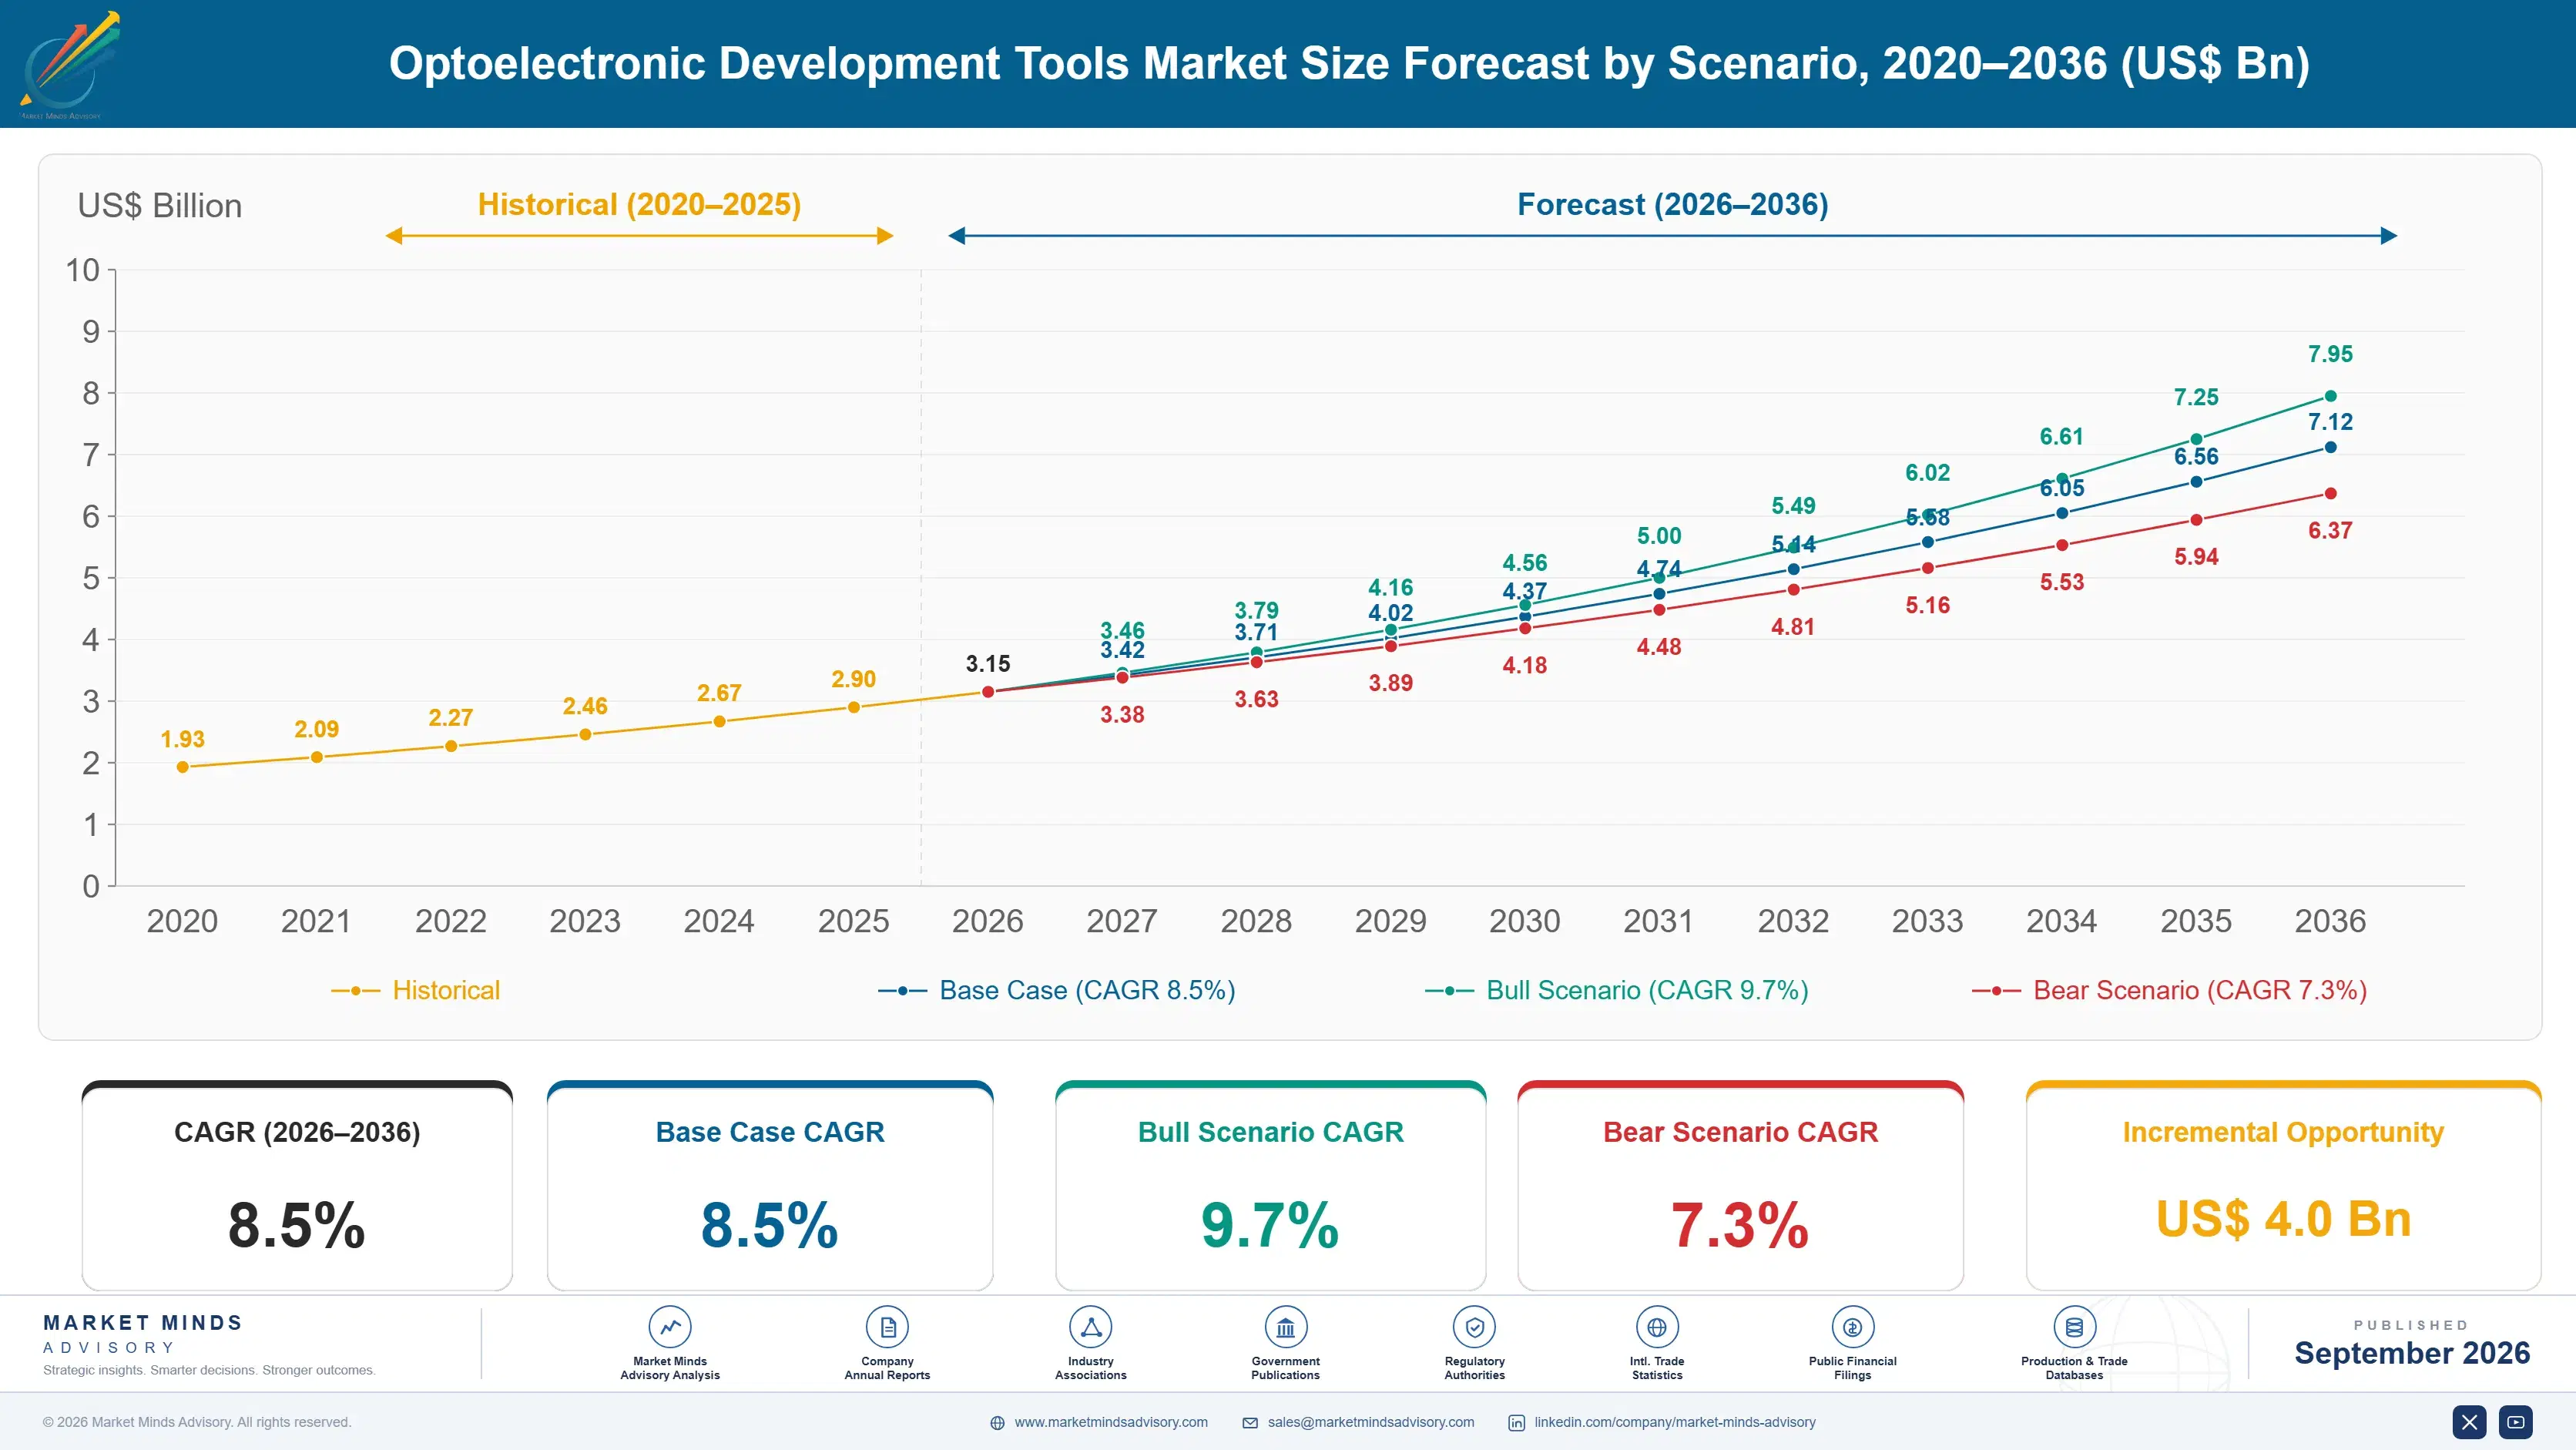
Optoelectronic Development Tools Market Forecast Scenarios

optoelectronic-development-tools-market-size-forecast-scenario-1790009932769
Optoelectronic development tool demand grew steadily across 2020 to 2025, as expanding data center optical transceiver production and early silicon photonics commercialization sustained instrument orders even as broader semiconductor capital equipment spending experienced a cyclical downturn during part of that period, a divergence that surprised several longtime industry participants who expected much closer correlation between the two.
The base case assumes continued photonic integrated circuit volume production ramp, expanding coherent optical component testing requirements tied to hyperscale data center interconnect buildout, and gradual migration from manual bench testing toward automated wafer-level characterization systems. These three mechanisms together sustain solid growth even as mature discrete component testing markets approach saturation, shifting incremental spend toward higher-value photonic integrated circuit characterization equipment that commands considerably richer per-unit pricing across the industry.
A bull scenario centers on accelerated photonic integrated circuit adoption for AI data center interconnect pulling test equipment demand well beyond current foundry capital expenditure plans across multiple regional manufacturing hubs. A bear scenario centers on a broader semiconductor capital equipment spending slowdown reducing instrument orders across both discrete optoelectronic component and photonic integrated circuit test segments simultaneously.

Wafer-Level Testing Redefines Instrument Economics

Optoelectronic test demand now tracks wafer-level automation depth more than raw instrument port count, since a single automated characterization system increasingly replaces multiple manual bench setups that photonics foundries once relied upon for device qualification. This automation shift is reshaping which vendors actually win foundry qualification programs, favoring throughput and repeatability over raw measurement precision alone across nearly every major device category tracked.
MARKET CONCENTRATIONCR5 54%Concentrated among a handful of established test and measurement vendors
AVERAGE SELLING PRICE$25,000-$350,000Price scales with system configuration, automation level, and channel count
TOP PRODUCING COUNTRYChina 28%Volume concentrated among rapidly expanding domestic photonics foundry capacity
CAPACITY UTILIZATION68-78%Scales with foundry wafer starts and device qualification volume
INPUT COST SHARE35% of COGSPrecision optics and tunable laser sources dominate total cost
REPLACEMENT CYCLE6-8 YearsInstruments refreshed as wavelength and speed requirements evolve
Commercial character has shifted from a niche research instrumentation business toward production test infrastructure, where automated wafer probing throughput and measurement repeatability increasingly determine which vendors foundries trust with high-volume qualification programs. Vendors unable to demonstrate proven throughput at scale increasingly lose contracts to rivals who can, regardless of how strong their underlying measurement science otherwise is across comparable product lines and price tiers.
Expanding photonic integrated circuit volume production, growing coherent optical component complexity, and increasing automation of wafer-level characterization will shape optoelectronic test demand through the next decade, with vendors solving throughput and precision simultaneously best positioned to capture the largest foundry contracts across every major manufacturing region where silicon photonics capacity continues expanding rapidly and consistently year after year.
"Ten years ago this was a bench full of tunable lasers and a technician with steady hands. Now it is a robotic wafer prober that never gets tired and never misaligns a fiber."
Director, Photonics Test and Measurement Practice · MMA Technology Practice · September 2026

Market Trends

Automated Wafer-Level Probing Replaces Manual Bench Testing

Photonics foundries increasingly deploy automated wafer-level optical probing systems capable of testing hundreds of photonic integrated circuit dies per hour, moving beyond earlier manual bench setups that required a technician to individually align fiber probes for each device under test. This automation shift reflects the reality that photonic integrated circuit production volumes have grown to a scale that manual testing simply cannot economically support. Several leading test equipment vendors have disclosed automated wafer probing platform roadmaps targeting substantially higher throughput within the next two product generations across their entire automated wafer probing platform lineup.
Market Impact: PIC foundry capacity investment up 35%

Software-Defined Test Platforms Reduce Instrument Capital Cost

Modular, software-defined optoelectronic test platforms increasingly replace dedicated fixed-function instruments, letting smaller photonics companies configure test capability through software rather than purchasing separate hardware for each measurement type. This modularity trend reduces total capital investment required for a functional test lab considerably compared to legacy fixed-instrument approaches. Several test equipment vendors have disclosed expanded software-defined product lines specifically targeting smaller photonics startups and university research programs seeking flexible, budget-conscious characterization capability without committing to a fully dedicated, expensive hardware suite from the very outset of a brand new research program or product initiative.
Market Impact: Coherent test equipment demand up 18%

Market Opportunities and Growth Drivers

Photonic Integrated Circuit Production Ramp Drives Test Demand

Major semiconductor foundries are expanding photonic integrated circuit production capacity to meet growing hyperscale data center demand for optical interconnect components, directly driving demand for wafer-level test and characterization equipment. Several leading foundries have disclosed capital expenditure plans specifically dedicated to photonic integrated circuit production line expansion over the coming several years. This foundry investment sustains test equipment demand independent of the broader semiconductor capital equipment spending cycle that affects other, more mature test equipment categories serving established electronic semiconductor customers across the broader semiconductor test equipment industry as a whole.
Market Impact: Entry-level systems cost 40% less

Coherent Optical Component Complexity Sustains Test Sophistication

Continued advancement in coherent optical component technology for higher-capacity data transmission sustains demand for increasingly sophisticated test equipment capable of characterizing complex modulation formats and higher channel counts. Multiple optical component manufacturers have disclosed next-generation coherent transceiver development programs requiring correspondingly advanced characterization equipment beyond what earlier component generations demanded. This complexity growth sustains premium pricing for the most sophisticated test platforms capable of handling these advanced modulation schemes and correspondingly higher channel density configurations that earlier generation test platforms were never originally designed or properly engineered to fully accommodate.
Market Impact: Cross-vendor discrepancies reach 15% variance

Market Restraints and Challenges

High Instrument Cost Limits Smaller Lab Adoption

Advanced photonic integrated circuit test systems carry substantial capital cost, whose root cause traces to the precision optics, tunable laser sources, and automated positioning hardware required to achieve production-grade measurement accuracy and repeatability. The commercial impact limits adoption of the most advanced automated systems to well-capitalized foundries and large device makers, leaving smaller research labs and startups dependent on shared facility access. Vendors are pursuing mitigation through modular, software-defined platforms that lower the entry-level capital investment required for a genuinely functional characterization capability suitable for early-stage device development work at a manageable budget level.
Market Impact: Automated probing throughput up 45% yearly

Standardization Gaps Complicate Cross-Vendor Test Comparability

The photonic integrated circuit industry lacks the mature measurement standardization that characterizes established electronic semiconductor testing, whose root cause lies in the relative youth of volume photonic integrated circuit manufacturing compared to decades-old electronic chip testing conventions. The commercial impact creates friction when foundries and device makers attempt to compare measurement results across different vendor test platforms. Industry consortia are pursuing mitigation through standardized measurement protocol development efforts involving multiple test equipment vendors and leading photonics foundries collaboratively across several ongoing standards working groups convened specifically to address this comparability gap.
Market Impact: Software-defined platform adoption up 30% yearly
4 additional market trends, 4 additional growth drivers, and 4 additional restraints and challenges are covered in the full report. Contact sales@marketmindsadvisory.com to access the complete intelligence.

Segment CAGR and Growth Architecture

The Optoelectronic Development Tools Market segments by device category under test, since photonic integrated circuits, discrete lasers, and detector components require fundamentally different test fixtures, automation approaches, and measurement methodologies across the development and production lifecycle, rather than by underlying wavelength range or application market alone, which matters far less to engineers actually specifying the test equipment.
optoelectronic-development-tools-market-market-share-analysis-1790009933334

Photonic Integrated Circuit Test and Characterization Systems

Photonic integrated circuit test and characterization systems perform automated wafer-level optical and electrical measurement across dozens of integrated waveguides, modulators, and detectors on a single die, requiring fundamentally different automation architecture than discrete component testing. Demand here grows fastest because photonic integrated circuit production volumes have scaled to a point where manual testing simply cannot keep pace, and foundries increasingly demand automated systems capable of testing hundreds of dies per hour. Vendors with proven wafer-level automation and high-throughput probing capability increasingly capture the largest foundry qualification programs over competitors offering only manual bench setups that cannot economically scale to meet current or projected production volume requirements at any reasonable cost.
CAGR 13.5%

Coherent Optical Component Test Systems

Coherent optical component test systems characterize complex modulation formats and polarization multiplexing schemes used in high-capacity data transmission components, requiring specialized signal generation and analysis capability beyond simple wavelength measurement. This segment grows steadily as data center operators and telecom carriers continue upgrading to higher-capacity coherent optical transport, sustaining demand for increasingly sophisticated characterization equipment. Vendors with proven coherent signal analysis expertise and support for the latest modulation formats increasingly win contracts over competitors offering only legacy direct-detect testing capability that cannot characterize modern coherent transmission schemes or their increasingly complex modulation formats and higher-order polarization multiplexing schemes now entering commercial deployment across the largest telecom carrier and hyperscale network operator accounts worldwide.
CAGR 10.5%
Full segment breakdown across 6 segments available in the complete report.

Regional Architecture and Country Demand Map

Optoelectronic test equipment demand concentrates wherever photonics manufacturing scale and R&D investment intersect, with East Asia leading on foundry capacity and wafer volume while North America anchors substantial coherent component and defense photonics demand across nearly every major application category worldwide today, from hyperscale interconnect through defense photonics.

North America

North American demand centers on coherent optical component development for hyperscale data center interconnect, with the United States hosting substantial photonic integrated circuit foundry capacity and the headquarters of leading test equipment vendors including Keysight and MKS Instruments. Defense and aerospace photonics programs add specialized test equipment demand independent of commercial data center cycles. University and national laboratory photonics research programs sustain steady instrumentation demand across the broader research infrastructure spanning dozens of leading technical institutions and their affiliated national laboratory partnerships spanning multiple frontier photonics research programs and cross-institutional collaboration initiatives spanning multiple states, federal research agencies, and private philanthropic funding sources supporting both basic and applied photonics research across dozens of leading academic centers.
Share: 26% | CAGR: 8.0% (2026 to 2036)

Western Europe

Western European demand draws on strong photonics research institutions across Germany, France, and the United Kingdom, combined with established telecom equipment manufacturing supporting coherent optical component development. European Union research funding programs supplement national government investment in photonics research infrastructure, sustaining steady instrumentation demand across the region's leading technical universities. Regional foundry capacity remains more limited than East Asia, concentrating demand more toward research and development applications rather than high-volume production testing found in more established East Asian manufacturing centers with considerably larger installed foundry base capacity built up over many years of sustained public and private investment across the continent's most research-intensive economies and their leading technical universities across the continent's most prominent research hubs.
Share: 22% | CAGR: 6.7% (2026 to 2036)
Regional intelligence for 5 additional markets available in the complete report: East Asia, South Asia and Pacific, Latin America, Middle East and Africa, Eastern Europe. Contact sales@marketmindsadvisory.com.
optoelectronic-development-tools-market-country-cagr-analysis-1790009933874

Where Test Equipment Vendors Actually Capture Margin

Optoelectronic test equipment vendors capture value beyond baseline instrument pricing through four commercial mechanisms that reward automation depth and foundry relationship scale over one-time hardware sale margin. Automation upsell pricing, multi-year foundry service contracts, software analytics licensing, and calibration service revenue all matter considerably more here than initial port pricing ever really did across this entire industry.

Charging Premium Pricing for Automated Wafer Probing

Vendors that offer fully automated wafer-level probing systems capture premium pricing compared to manual bench setups, since foundries increasingly require throughput that manual testing simply cannot deliver at production volume. This automation premium typically commands 50 to 70% higher system pricing than equivalent manual configurations, reflecting the robotics and software engineering investment involved. Vendors with proven automated probing reliability increasingly capture the largest foundry qualification programs over competitors offering only manual alternatives lacking comparable robotics and precision motion control engineering investment built up carefully over multiple successive product generations of continuous engineering refinement.
Market Impact: Automated systems command 50 to 70% price premiums

Securing Multi-Year Foundry Service and Support Contracts

Vendors that negotiate multi-year service and calibration contracts with photonics foundries capture predictable recurring revenue tied to ongoing production operations, rather than competing purely on initial equipment sale price. These service contracts typically span 3 to 5 years aligned with foundry equipment depreciation cycles, providing vendors revenue visibility that equipment-only competitors lack entirely. This approach favors vendors with dedicated field service organizations over smaller rivals lacking comparable support infrastructure, dedicated field engineering staff, and regional service coverage across multiple manufacturing hubs and time zones worldwide, ensuring rapid response to any equipment issue.
Market Impact: Service contracts typically span 3 to 5 years

Licensing Analytics Software for Yield Optimization

Vendors that license data analytics software helping foundries correlate test results with manufacturing yield capture recurring software revenue beyond the underlying instrument sale itself. This analytics layer typically generates 15 to 25% of total contract value annually, compounding meaningfully over the equipment's multi-year operational lifetime. Vendors with genuinely differentiated yield correlation capability increasingly retain customers longer than those offering only raw measurement data without any accompanying interpretation, root-cause analysis, or actionable manufacturing recommendation attached to the raw measurement data their systems generate each and every production shift around the clock.
Market Impact: Analytics software adds 15 to 25% of revenue

Offering Calibration and Certification Service Revenue

Vendors offering regular calibration and certification services for deployed instruments capture recurring service revenue equal to 8 to 12% of contract value beyond the initial equipment purchase itself. This service layer matters particularly to foundries requiring documented, auditable calibration traceability for customer qualification and compliance audits. Vendors with accredited calibration laboratories increasingly win preferred-vendor status over competitors lacking equivalent certification infrastructure, accreditation credentials, and documented traceability records spanning multiple international standards bodies and their respective national accreditation authorities across every major manufacturing region served by the vendor's global calibration laboratory network.
Market Impact: Calibration services add 8 to 12% of revenue

Who Controls the Margin Pool

Five firms hold roughly 54% of global optoelectronic test equipment revenue, a moderately concentrated market structure reflecting the precision engineering investment and established foundry relationships required to compete credibly. Keysight and EXFO lead through decades of test and measurement manufacturing scale and photonics-specific engineering depth, while the gap to smaller specialized vendors remains meaningful on automation capability, though narrower in niche characterization segments where focused specialists compete effectively against considerably larger diversified rivals.
Current competitive activity centers on automated wafer-level probing platform development, coherent signal analysis capability expansion, and yield analytics software integration, as vendors race to meet tightening foundry throughput requirements. Some vendors increasingly acquire specialized photonics instrumentation startups rather than building automated probing capability entirely in-house, accelerating consolidation among smaller technical specialists that lack the capital to sustain independent operations much longer.

Emerging pressure comes from photonics foundries exploring in-house test equipment development for their most specialized process needs, potentially disintermediating traditional vendors on the highest-volume production lines over time. Rankings shift fastest in automated wafer-level probing, where vendors with genuine throughput and precision leadership increasingly out-compete rivals still offering only manual bench alternatives lacking any genuine automation investment.
optoelectronic-development-tools-market-company-positioning-matrix-1790009934402

Competitive Moat and Risk Dimensions

KEYSIGHT TECHNOLOGIES

Moat: Broad Test Portfolio Scale

Keysight's combined electronic and photonic test equipment portfolio lets it serve foundries needing integrated characterization across both domains from a single vendor relationship, reducing procurement complexity and giving Keysight cross-selling opportunities that narrower photonics-only competitors simply cannot match without comparable electronics test scale and manufacturing depth.
KEYSIGHT TECHNOLOGIES

Risk: Slower Photonics-Specific Innovation Pace

Keysight's broad portfolio focus means it invests somewhat less intensively in newer photonics-specific automation features than pure-play specialists, risking share loss in the fastest-growing wafer-level probing segment to competitors dedicating their entire engineering focus to that single, comparatively narrow but genuinely fast-growing category alone across the industry.
EXFO

Moat: Deep Coherent Optical Test Specialization

EXFO's exclusive focus on optical and photonic test technology gives it product depth and engineering specialization in coherent signal analysis that diversified electronic test vendors extending into photonics cannot easily match, particularly around advanced modulation format characterization for the newest generation of coherent transceivers entering commercial deployment.
EXFO

Risk: Limited Scale Versus Diversified Rivals

EXFO's smaller overall scale relative to diversified test and measurement giants limits its research and development budget and global service network reach, risking share loss in large multinational foundry accounts to larger, better-resourced competitors with considerably broader global field service coverage and larger installed customer bases.

Players Tracked

Prominent Players

Keysight Technologies
EXFO
Yokogawa Electric
Thorlabs
MKS Instruments (Newport)

Other Key Players

Anritsu Corporation
Viavi Solutions
Santec Corporation
Luna Innovations
Hamamatsu Photonics
Advantest Corporation
Teradyne
National Instruments (NI)
Agiltron
Photon Dynamics
Optical Zonu Corporation
PhotonicsIndustries
Toptica Photonics
II-VI (Coherent Corp)
Corning Incorporated

Recent Developments

FEBRUARY 2026

Keysight Launches Automated Photonic Wafer Probing Platform

Keysight announced a new automated photonic wafer probing platform capable of testing several hundred integrated circuit dies per hour, targeting foundries scaling production of photonic integrated circuits for AI data center interconnect applications across their global manufacturing footprint, a capability several industry analysts consider a meaningful competitive advantage.
Signal: Signals established vendors are investing heavily in automation depth well ahead of accelerating foundry demand growth.
AUGUST 2025

EXFO Forms Strategic Partnership With Major Photonics Foundry

EXFO entered a strategic partnership with a major photonics foundry covering dedicated coherent optical test equipment deployment across the foundry's expanding production lines, including committed multi-year capacity reservation and dedicated on-site service support terms specific to the foundry's operational needs and equipment maintenance and calibration schedules going forward.
Signal: Signals foundries are increasingly locking in dedicated test equipment vendor relationships ahead of planned capacity expansion.
APRIL 2025

Yokogawa Acquires Specialized Photonics Instrumentation Startup

Yokogawa completed the acquisition of a specialized photonics instrumentation startup with established automated wafer probing technology, adding this capability to its broader test and measurement portfolio serving photonics foundry customers across multiple geographic markets, manufacturing scales, and process technology generations across the company's broader customer base.
Signal: Signals larger test equipment vendors increasingly prefer acquiring specialized automation expertise rather than building it internally.

Precision Optics Anchor Instrument Cost Structure

Precision optics and tunable laser sources together account for roughly 35% of optoelectronic test equipment manufacturing cost, sourced primarily from specialized optical component manufacturers concentrated in a handful of countries with mature precision optics manufacturing capability. This dependence on a limited supplier base means most instrument vendors, regardless of headquarters location, compete for the same relatively narrow global optical component supply chain.
A documented tunable laser source supply constraint during 2024 pushed component costs up by roughly 22% and extended lead times to 14 to 18 weeks, according to industry supply chain reporting referenced in company annual disclosures, as demand from both test equipment and coherent transceiver manufacturers competed for the same limited specialized laser production capacity. Several test equipment vendors delayed new product shipments as a direct consequence, straining relationships with foundry customers awaiting delivery.

Smaller test equipment vendors face a genuine competitive disadvantage here since they lack the purchase volume needed to secure priority allocation from constrained optical component suppliers during shortage periods, unlike larger vendors like Keysight with enterprise-scale sourcing relationships. This dynamic favors vendors with diversified component sourcing, while smaller specialty vendors increasingly pursue long-term supply agreements as mitigation against recurring component cost volatility.
optoelectronic-development-tools-market-cost-volatility-analysis-1790009934597

Diversifying Across Multiple Optical Component Suppliers

Larger vendors are qualifying production across multiple precision optics and tunable laser suppliers rather than concentrating sourcing with a single provider, reducing exposure to any one supplier's capacity constraints during periods of industry-wide demand pressure and component allocation competition across the sector, particularly during simultaneous foundry and transceiver manufacturer demand spikes affecting the entire shared supply base at once.

Negotiating Long-Term Component Supply Agreements

Mid-sized test equipment vendors are negotiating multi-year component supply agreements with committed volume and pricing terms, trading some short-term flexibility for protection against future price spikes and improved allocation priority during periods of industry-wide optical component supply constraint that regularly disrupt smaller, less-prepared competitors lacking comparable committed contract terms and forward pricing certainty already firmly in place.

Vertical Integration Into Precision Optics Manufacturing

Some larger vendors are pursuing vertical integration into precision optics and laser component manufacturing, reducing dependence on external suppliers while capturing margin previously paid to third-party component vendors and improving overall supply chain reliability during periods of industry-wide shortage and allocation pressure across the entire global supplier base and their respective manufacturing capacity constraints.

Portfolio Architecture for Margin Defence

Margin architecture in optoelectronic test equipment splits between commoditized manual bench instruments and premium automated wafer-level systems. Manual bench instruments run thin margins given intense competitive bidding among many established vendors, while automated wafer probing systems for photonic integrated circuit foundries command substantially richer margins tied to throughput and precision credentials that only established vendors with genuine robotics engineering depth can consistently deliver.
Volume manual instrument sales still generate meaningful revenue today, but margin economics increasingly favor automated production test systems as photonic integrated circuit manufacturing scales toward higher volumes. Vendors positioned only in manual bench instruments face genuine margin pressure as foundries push for automated throughput, forcing many smaller vendors to pursue automation development as a defensive necessity rather than a pure growth opportunity they might otherwise have deferred.

High-value margin pools concentrate in automated wafer-level probing, coherent optical test systems, and analytics software licensing, where throughput credentials and precision command premium pricing that manual instrument competitors simply cannot match today. Vendors building genuine automation depth alongside coherent signal analysis expertise increasingly capture the richest margin pools within the entire optoelectronic test equipment industry.

Volume / Commodity-Adjacent

Manual bench instruments for basic discrete component testing, bid competitively among established vendors worldwide with limited differentiation beyond delivery speed, unit price, and a basic reliability track record built over time.
Gross Margin: 30-38%

Premium / Certified

Automated wafer-level probing systems for photonic integrated circuit foundries priced for throughput and precision credentials that only a smaller pool of vendors with genuine automation engineering depth can consistently deliver at reliable scale.
Gross Margin: 48-58%

Sustainability / Regulatory / Next-Generation

Coherent optical test systems and analytics software licensing positioned ahead of emerging modulation standards, commanding premium early-mover pricing before wider competitive entry compresses these margins across the broader test equipment market.
Gross Margin: 40-50%
optoelectronic-development-tools-market-portfolio-architecture-1790009935099

High-value Sub-segments and Strategic Watch-out

Photonic Integrated Circuit Test and Characterization Systems

The fastest-growing and highest-value segment, combining a 13.5% forecast CAGR with premium margins tied to automation depth. Vendors with proven wafer-level probing capture the richest growth and margin combination across the entire optoelectronic test market today, well ahead of every other application category currently tracked in the industry.
Gross Margin: 50-58%

Coherent Optical Component Test Systems

A high-value segment growing at 10.5% annually, tied to expanding data center interconnect and telecom transport capacity upgrades. Margin economics here trail photonic integrated circuit testing though overall deployment volume remains substantial across established carrier and hyperscale accounts, sustained by continued global network capacity expansion.
Gross Margin: 42-50%

Discrete Laser and Detector Component Test Instruments

The volume core of the market, generating steady revenue through discrete component testing instruments, though intensifying migration toward integrated photonic circuits is slowing overall segment growth toward the market's lower end over the coming forecast period across most established discrete component manufacturing markets found worldwide today.
Gross Margin: 32-40%

Legacy Manual Bench Test Configurations Facing Displacement

A strategic watch-out segment where manual bench test configurations face gradual displacement from automated wafer-level alternatives offering considerably higher throughput across most foundry production environments, a category facing gradual but steady decline relative to the broader, rapidly expanding photonics test equipment market as a whole.
Gross Margin: 24-32%

Why Test Equipment Revenue Recurs

Optoelectronic test equipment revenue builds annuity-like characteristics through multi-year calibration and service contracts that follow initial equipment sale, rather than through one-time hardware purchases alone. Foundries rarely switch test equipment vendors mid-production line once initial qualification is complete, since replacing an established vendor requires re-certifying measurement accuracy across the entire test flow at real cost, schedule risk, and potential production downtime that most foundries strongly prefer to avoid.
Adoption stickiness varies meaningfully by end-use vertical: large photonics foundries show the deepest vendor lock-in, since production-critical test infrastructure cannot tolerate qualification transition risk once operational, while university and research lab customers show comparatively shallower stickiness given smaller purchase scale and greater willingness to switch. Mid-sized device makers sit in between, with switching costs tied closely to production volume and installed base size.

A generational shift in buyer profile is underway as production and process engineering teams, not just research and development groups, increasingly drive optoelectronic test equipment procurement decisions. These newer buyers evaluate vendors on throughput and automation reliability rather than pure measurement precision specifications, reshaping how vendors must position, sell, and structure ongoing account relationships with foundry engineering leadership.
optoelectronic-development-tools-market-end-use-penetration-index-1790009935637

Where to Compete in Optoelectronic Testing

These are among the four positions where our research anticipates prominent divergence between winners and laggards over the coming forecast period. Each is grounded in the demand model, the regulatory perimeter, and the announced capacity pipeline.
01 / WAFER-LEVEL AUTOMATION DEPTH

Invest in automated probing before it becomes baseline

Photonic integrated circuit test and characterization systems are growing at 13.5% annually, well above the market's average pace, yet many mid-tier vendors still offer only manual bench alternatives lacking any genuine automation investment whatsoever. Vendors that invest in automated wafer-level probing now will capture disproportionate share as foundries scale production volume over the next several years. Waiting until automation becomes table stakes cedes this position to already-invested competitors that moved first and now hold established foundry qualification relationships across the largest production accounts available.
02 / COHERENT SIGNAL ANALYSIS

Build advanced modulation format expertise ahead of upgrades

Coherent optical component test systems require increasingly sophisticated signal analysis capability as underlying data transmission technology continues advancing steadily toward higher-capacity modulation formats. Vendors that build genuine coherent analysis expertise now will capture premium pricing as telecom carriers and hyperscale operators continue upgrading transport infrastructure across multiple regional markets and their respective national telecom infrastructure investment cycles. Firms without this capability should invest deliberately before competitors establish exclusive relationships with leading component manufacturers and hyperscale network operators pursuing next-generation transport upgrades.
03 / COMPONENT SUPPLY DIVERSIFICATION

Diversify optical component sourcing to manage cost risk

Precision optics and tunable laser sources account for roughly 35% of test equipment manufacturing cost, and a documented 2024 shortage pushed prices up by roughly 22% while extending lead times industry-wide across nearly every major test equipment manufacturing region. Vendors relying on a single component supplier face real cost and delivery disadvantages against diversified rivals with multiple qualified sourcing relationships. Smaller vendors should pursue multi-supplier qualification rather than continuing to depend on a single concentrated supply relationship that leaves them fully exposed during periods of shortage.
04 / RECURRING SERVICE REVENUE

Build calibration and analytics revenue beyond hardware sales

Vendors offering calibration services and analytics software licensing capture recurring revenue that typically reaches 15 to 25% of total contract value annually, well beyond what one-time equipment sales alone could ever generate on their own. Vendors without these recurring revenue streams face a hard revenue ceiling compared to rivals building ongoing platform relationships with foundry customers. Firms still selling only hardware should prioritize this development now, before competitors establish deeper, harder-to-displace customer relationships across the same foundry accounts every rival is currently targeting.

Engagement Snapshot From the Field

A live engagement with an industry participant carrying material or product regulatory and market exposure ahead of a defining policy shift, showing how our research translates into a defensible multi-year portfolio strategy.
MARKET MINDS ADVISORY · CLIENT ENGAGEMENT SUMMARY
Optoelectronic Development Tools Producer Strategic Portfolio Review and Transition Roadmap 2026·Investment Scenario on Optoelectronic Development Tools Exposure Evaluation 2025-26
CLIENT PROFILE
The client is a photonics foundry operator expanding photonic integrated circuit production capacity to serve growing hyperscale data center interconnect demand, with annual capital expenditure reportedly exceeding $180 million (client-reported, unverified by MMA). The client's existing manual test infrastructure had not scaled proportionally as production volume grew rapidly over the preceding two years, straining the client's small existing test engineering team considerably.
STRATEGIC CHALLENGE
The client faced mounting production bottlenecks as manual wafer-level testing could not keep pace with expanding photonic integrated circuit production volume, creating a growing backlog of untested dies awaiting qualification. Leadership needed an objective evaluation of automated test equipment vendors capable of meeting an aggressive production ramp timeline without compromising measurement accuracy standards.
MMA APPROACH
MMA conducted a structured vendor capability assessment across five candidate automated test equipment providers, evaluating throughput capability, measurement accuracy, and disclosed reliability track records at comparable production scale. The engagement combined primary interviews with the client's process engineering and procurement teams alongside comparative throughput benchmarking against the client's production ramp requirements.
KEY FINDINGS
  1. Only two of five candidate vendors demonstrated production-proven throughput meeting the client's aggressive ramp timeline requirements consistently across every evaluated throughput and accuracy dimension.
  2. Automated systems could reduce the client's per-die testing time by roughly 65% compared to the existing manual bench process entirely, freeing up considerable engineering staff capacity.
  3. Integration complexity with the client's existing production line favored vendors offering modular, phased deployment over complete replacement systems requiring full production line downtime.
  4. The selected vendor's proven measurement repeatability across other foundry deployments reduced the client's perceived qualification risk considerably during the overall vendor evaluation and selection process.
CLIENT PROFILE
The client is a photonics foundry operator expanding photonic integrated circuit production capacity to serve growing hyperscale data center interconnect demand, with annual capital expenditure reportedly exceeding $180 million (client-reported, unverified by MMA). The client's existing manual test infrastructure had not scaled proportionally as production volume grew rapidly over the preceding two years, straining the client's small existing test engineering team considerably.
STRATEGIC CHALLENGE
The client faced mounting production bottlenecks as manual wafer-level testing could not keep pace with expanding photonic integrated circuit production volume, creating a growing backlog of untested dies awaiting qualification. Leadership needed an objective evaluation of automated test equipment vendors capable of meeting an aggressive production ramp timeline without compromising measurement accuracy standards.
MMA APPROACH
MMA conducted a structured vendor capability assessment across five candidate automated test equipment providers, evaluating throughput capability, measurement accuracy, and disclosed reliability track records at comparable production scale. The engagement combined primary interviews with the client's process engineering and procurement teams alongside comparative throughput benchmarking against the client's production ramp requirements.
KEY FINDINGS
  1. Only two of five candidate vendors demonstrated production-proven throughput meeting the client's aggressive ramp timeline requirements consistently across every evaluated throughput and accuracy dimension.
  2. Automated systems could reduce the client's per-die testing time by roughly 65% compared to the existing manual bench process entirely, freeing up considerable engineering staff capacity.
  3. Integration complexity with the client's existing production line favored vendors offering modular, phased deployment over complete replacement systems requiring full production line downtime.
  4. The selected vendor's proven measurement repeatability across other foundry deployments reduced the client's perceived qualification risk considerably during the overall vendor evaluation and selection process.
RECOMMENDED STRATEGY
Phase 1: Phase 1 (Pilot): Deploy automated test equipment on a single production line within the engagement's first three months of active implementation work. Phase 2: Phase 2 (Validation): Validate measurement accuracy and throughput against existing manual test benchmarks running in parallel throughout the validation period. Phase 3: Phase 3 (Scale): Expand automated testing across all remaining production lines following successful pilot validation results and final leadership sign-off across the organization.
OUTCOME
The client completed the pilot deployment and validation within the recommended timeframe across its designated production line. Testing throughput reportedly improved by 58% within the first six months (client-reported, unverified by MMA), while the production backlog cleared considerably faster than the client's original internal projections anticipated.

Frequently Asked Questions

Foundational context covering the market sizes, CAGR, scope, country, region and competition that inform every finding below. This section is provided to cover basics and most often pre-purchase conversations, answered from the MMA Primary Research Dataset.

What is the current size of the Optoelectronic Development Tools Market?

The Optoelectronic Development Tools Market reached $2.9 billion in 2025, driven by photonic integrated circuit production ramp and coherent optical component testing demand across major markets worldwide.

How large will the Optoelectronic Development Tools Market be by 2036?

The market is projected to reach $7.12 billion by 2036, roughly 2.26 times its 2026 level, as automated wafer-level testing becomes standard foundry infrastructure across most manufacturing regions.

What is the CAGR for the Optoelectronic Development Tools Market 2026 to 2036?

The market is forecast to grow at an 8.5% compound annual rate between 2026 and 2036, with photonic integrated circuit testing growing considerably faster than discrete component categories.

Which segment is growing fastest?

Photonic integrated circuit test and characterization systems lead at 13.5% CAGR, roughly 1.59 times the overall market's average growth pace through the entire forecast period.

Who are the major companies in the Optoelectronic Development Tools Market?

Keysight Technologies, EXFO, Yokogawa Electric, Thorlabs, and MKS Instruments lead the market, together holding roughly 54% of global optoelectronic test equipment revenue across all product categories.

Which country is growing fastest?

China leads country-level growth at roughly 11.0% CAGR, driven by rapid expansion of domestic photonic integrated circuit foundry capacity and manufacturing investment across the country.

Report Segmentation Architecture

The full report scope spans multiple orthogonal segmentation dimensions, with cross-tabulated demand data provided for each dimension pair. Coverage extends further to regional breakdowns, trend trajectories, and the competitive detail needed to support segment-level decision-making.

By Device Category Under Test

  • Photonic Integrated Circuits
  • Discrete Lasers
  • Optical Detectors
  • Coherent Optical Components
  • Passive Optical Components
  • Others

By End-Use Industry

  • Semiconductor Foundries
  • Telecommunications Equipment Manufacturers
  • Data Center and Hyperscale Operators
  • Defense and Aerospace
  • Research Institutions

By Commercial Dimension

  • Direct Equipment Sales
  • Calibration and Service Contracts
  • Software Licensing
  • Distributor Channel

By Region

  • North America
  • Western Europe
  • East Asia
  • South Asia and Pacific
  • Latin America
  • Middle East and Africa
  • Eastern Europe

Scope, Methodology, and Coverage

Every figure in this report is reproducible from documented input assumptions. The scope below maps the historical period, the forecast horizon, the segmentation dimensions, and the countries covered, alongside the underlying primary and qualitative methodology.
Historical Period
2020 to 2025
Forecast Period
2026 to 2036
Base Year
2025 (USD billions; MMA Primary Research Dataset, September 2026)
Market Definition
The Optoelectronic Development Tools Market covers test, measurement, and characterization equipment used to design, validate, and manufacture photonic integrated circuits, lasers, detectors, and other optoelectronic components. It excludes the optoelectronic devices themselves, general-purpose electronic test equipment without photonic-specific capability, and fiber optic cable manufacturing equipment.
Quantitative Units
USD billions (current prices); unit shipment volume where applicable
Segmentation Dimensions
By Device Category Under Test; By End-Use Industry; By Commercial Dimension; By Region
Regions Covered
North America, Western Europe, East Asia, South Asia and Pacific, Latin America, Middle East and Africa, Eastern Europe
Countries Covered
USA, China, Germany, France, UK, Japan, South Korea, India, Australia, Canada, Brazil, Mexico, Indonesia, Vietnam, Thailand, Malaysia, UAE, Saudi Arabia, South Africa, Nigeria, Turkey, Poland, Netherlands, Italy, Spain, Sweden, Switzerland, Argentina, Colombia, Singapore, and additional markets relevant to this sector
Key Companies Profiled
Keysight Technologies, EXFO, Yokogawa Electric, Thorlabs, MKS Instruments (Newport), Anritsu Corporation, Viavi Solutions, Santec Corporation, Luna Innovations, Hamamatsu Photonics, Advantest Corporation, Teradyne, National Instruments (NI), Agiltron, Photon Dynamics, Optical Zonu Corporation, PhotonicsIndustries, Toptica Photonics, II-VI (Coherent Corp), Corning Incorporated
Quantitative Methodology
Primary survey, n=3,800 respondents, Q4 2025, six countries; demand-side model with trade association cross-validation
Qualitative Methodology
47 expert interviews, Q4 2025; applied to validate demand model assumptions, identify emerging dynamics, and assess competitive positioning
Report Format
PDF and XLSX data workbook (Word format preview document)
Publisher
Market Minds Advisory
Report Code
MMA-2026-TEC-110
Published
September 2026
Contact
sales@marketmindsadvisory.com | www.marketmindsadvisory.com

Purchase the full Optoelectronic Development Tools Market Report (2026 to 2036).

This report delivers a comprehensive analysis of the global Optoelectronic Development Tools Market, covering sizing, segmentation, regional dynamics, and competitive positioning through 2036. It profiles the twenty leading test and measurement vendors. The analysis examines automation adoption barriers shaping vendor economics, and it quantifies input cost exposure tied to precision optics and laser component supply concentration. Readers gain access to detailed regional demand mechanisms across all seven global regions, alongside forward-looking scenario analysis spanning bull, base, and bear growth cases through the full ten-year 2026 to 2036 forecast period covered in this report.
Ten-year market sizing and forecast model
Twenty-company competitive benchmarking and profiling analysis
Seven-region demand and CAGR breakdown tables
Automation adoption barrier and throughput analysis
Input cost and optical component supply risk assessment
Revenue lever and margin architecture framework

Built For The People Who Decide

From boardroom strategy to bench-side execution, this report is read cover-to-cover by leaders shaping the next decade of their industry, turning demand scenarios, market dynamics and valuation benchmarks into decisions.
CXOs/ Presidents/ VPs/ Managers
M&A and Corporate Development
Strategy Teams and R&D Heads
Procurement and Product Directors
Regulatory and Compliance Leaders
Investor Relations and Equity Analysts