
Market Minds Advisory
Hydrogen Electrolyzer Market

Hydrogen Electrolyzer Market: Hydrogen Electrolyzers: Policy Support Meets A Brutal Cost Reality

A commercial reading of hydrogen production equipment, where government subsidy decides which projects proceed, PEM technology challenges legacy alkaline dominance, and stack cost remains the unresolved barrier between announced capacity and actual shipped megawatts.

Lead Analyst

David Horsley

Published

August 2026

Make Smarter Decisions with Customized Research Insights

Request a free sample report and evaluate market opportunities, growth trends, and competitive dynamics relevant to your business needs.

2025 MARKET VALUE$3.8BMarket Size 2025
2036 FORECAST VALUE$12.6BBase Case , 2026 to 2036
CAGR 2026 TO 203611.5 %Bull 12.8% / Bear 10.2%
INCREMENTAL OPPORTUNITY$8.3BNet 10- year value creation
EXPANSION MULTIPLE2.97x2036 value over 2026 base
Strategic Levers
M&A Pipeline
Regional Outlook
Country Rankings
Competitive Intelligence
Segmental Deep-dive
Call-Us : 91 93563 13602

Executive Snapshot and Market Trajectory.

Announced electrolyzer capacity keeps outrunning what actually ships, and the gap between headline gigawatt pledges and shipped megawatts is where every serious buyer now focuses attention before signing a single purchase order with any manufacturer in this crowded, still-consolidating field.
The market stands at USD 3.8 billion in 2025 and reaches USD 12.59 billion by 2036 at a 11.5% CAGR. PEM electrolyzers grow fastest at 16.2%, about 1.41 times the overall rate, as renewable-coupled projects favour the dynamic response alkaline technology cannot match at comparable cost or footprint. East Asia holds 27% of value on Chinese manufacturing scale, while India posts the quickest national growth of all at 19.4% on its national green hydrogen mission.
Concentration is low, with the top five holding roughly 38% of revenue against a genuinely crowded field of legacy industrial gas suppliers and newer specialist entrants all competing on quite different cost bases entirely. Two forces reshape the field now. Government subsidy decisions increasingly determine which announced projects actually reach final investment decision, and Chinese manufacturers are undercutting Western stack pricing by a margin domestic policy alone cannot fully offset.
Market Definition
The hydrogen electrolyzer market covers stack and system equipment that splits water into hydrogen and oxygen using electrical current, spanning alkaline, proton exchange membrane, solid oxide, and anion exchange membrane technologies sold to industrial and utility buyers. Hydrogen storage, transport infrastructure, fuel cells, and downstream hydrogen offtake applications are excluded.
Base Year Value
$3.8B in 2025 (MMA Primary Research Dataset, August 2026)
Forecast Period
2026 to 2036, eleven discrete annual values
CAGR
11.5% base case. Bull 12.8%. Bear 10.2%.
Fastest Growth Segment
PEM Electrolyzers: 16.2% CAGR
Fastest Growth Country
India: 19.4% CAGR
Fastest Growth Region
South Asia and Pacific: 13.8% CAGR
Largest Region
East Asia: 27% of 2025 global value
Market Leaders
Nel Hydrogen, thyssenkrupp nucera, Plug Power, ITM Power, Cummins (Accelera). Source: MMA Analysis based on company annual reports.
Primary Survey
n=3,800 procurement and R&D decision-makers, Q4 2025, six countries
Methodology
Demand-side build-up, cross-validated against public data, 47 expert interviews

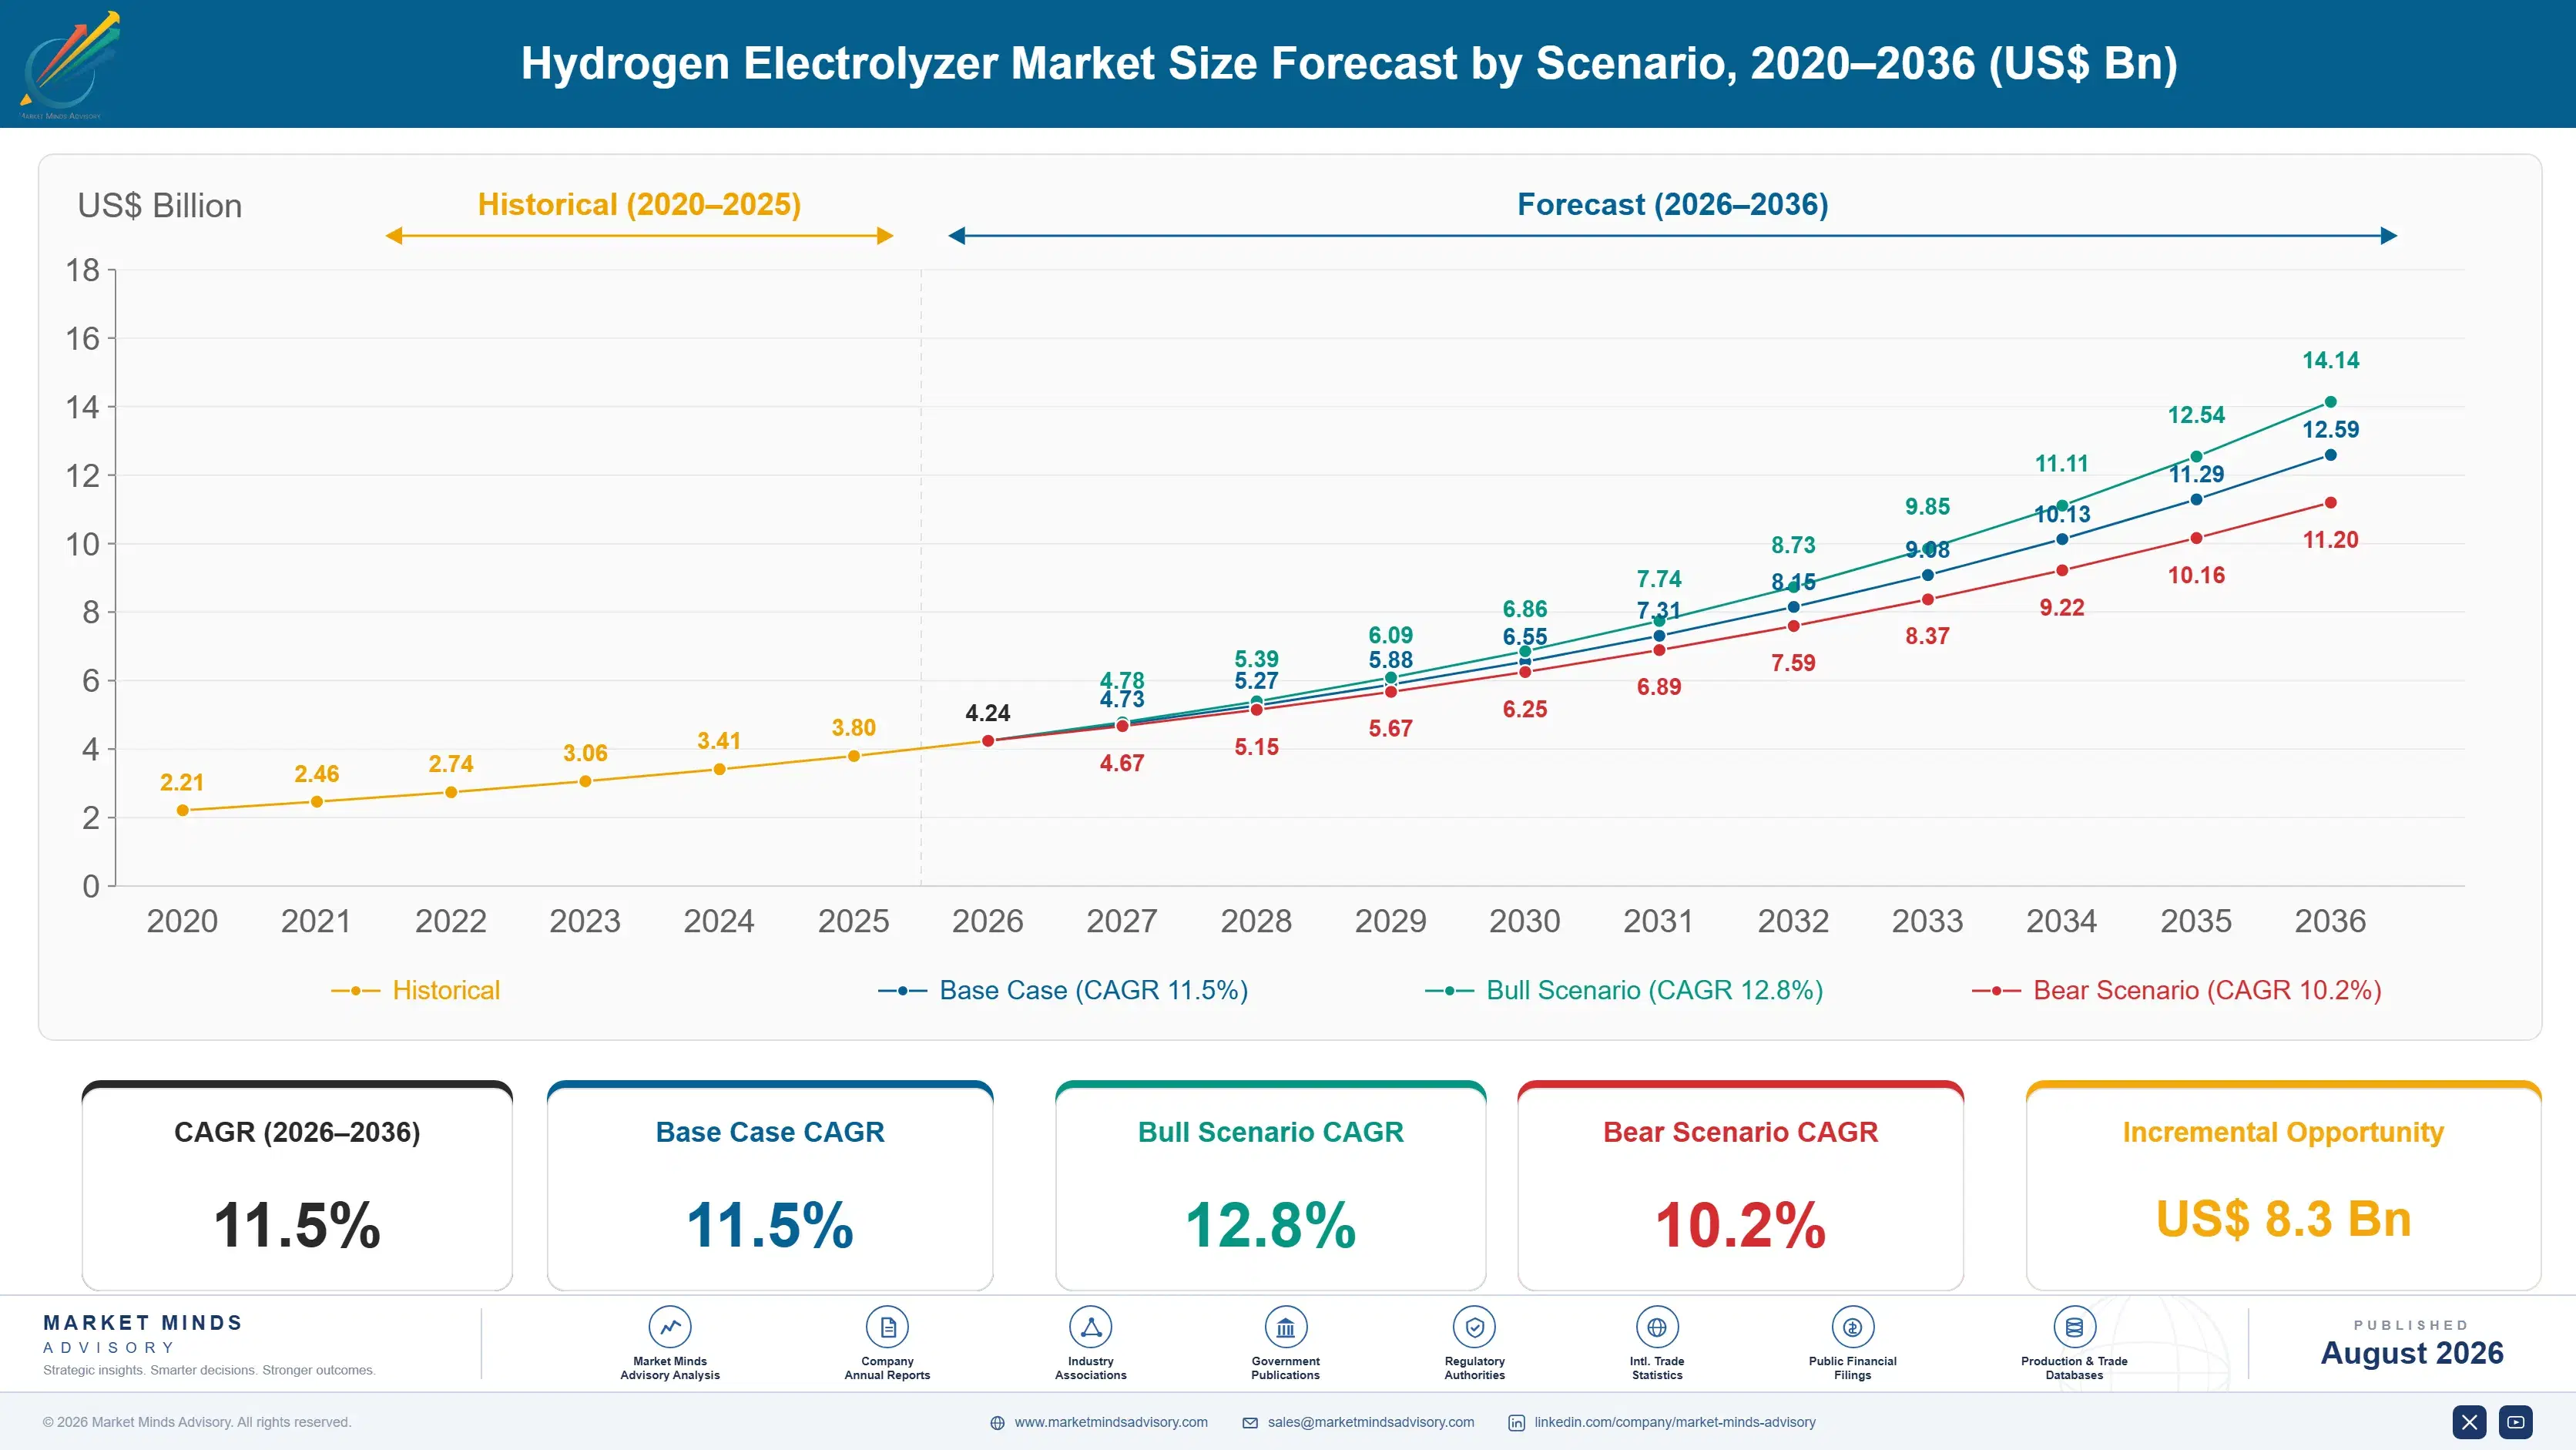
Hydrogen Electrolyzer Market Forecast Scenarios

hydrogen-electrolyzer-market-size-forecast-scenario-1787324748360
Growth from 2020 to 2025 compounded near 10.5%, accelerating as national hydrogen strategies and subsidy programmes multiplied across Europe, North America, and Asia within a remarkably short window. Announced project pipelines grew far faster than actual final investment decisions, and that gap between pledge and shipped capacity became the defining feature of the period across nearly every major market tracked.
Three mechanisms carry the base case to 11.5%. First, subsidy programmes including the American production tax credit and European hydrogen bank auctions keep converting announced projects into funded ones at a steady, measurable pace. Second, industrial decarbonisation mandates in steel and ammonia production create demand no renewable power alone can satisfy without electrolysis. Third, Chinese manufacturing scale keeps driving stack costs down, expanding the set of projects that clear commercial viability thresholds.
The bull case at 12.8% assumes subsidy programmes expand further and stack costs fall faster than current manufacturing roadmaps suggest across every major technology. The bear case at 10.2% assumes subsidy programmes face political reversal in key markets and announced projects continue stalling at final investment decision at the rate recently observed across the industry.

Why Bankability Now Matters More Than Technology

Three converging forces set demand now. Subsidy programmes including the American production tax credit and European hydrogen bank auctions keep converting announced projects into funded ones at a steady, measurable pace across every major regulated market. Industrial decarbonisation mandates in steel and ammonia production create demand renewable power alone cannot satisfy without electrolysis equipment. And Chinese manufacturing scale keeps driving stack costs down, expanding which projects cl
MARKET CONCENTRATIONCR5: 38%Fragmented supply base across legacy and specialist manufacturers
AVERAGE SELLING PRICEUSD 400 to 1,200 per kilowattBlended stack pricing varying considerably by technology type
TOP PRODUCING COUNTRY SHAREChina: 41% of global capacity shippedChinese stack manufacturing scale supplying domestic and export demand
MANUFACTURING CAPACITY UTILISATION45 to 65%Announced factory capacity running well below nameplate installed capability
PROJECTS REACHING FINAL INVESTMENTAbout 30% of announced pipelineAnnounced projects actually proceeding to funded construction status yearly
STACK REPLACEMENT CYCLE7 to 10 yearsTypical operating life before major stack refurbishment or replacement
The commercial character splits along technology maturity almost entirely across every buyer segment. Alkaline buyers purchase proven, lower-cost equipment for large industrial applications where dynamic response matters less than upfront capital cost. PEM buyers pay a genuine premium for renewable-coupled flexibility instead, since dynamic response to variable solar and wind output justifies the additional cost for grid-connected projects specifically.
The next decade turns on stack cost and project bankability together across every technology tracked here. Manufacturers that close the cost gap against Chinese suppliers capture Western subsidy-backed volume no cost leadership alone could ever secure. Project developers who convert announced pipeline into actual final investment decisions determine whether headline capacity figures translate into real shipped megawatts.
"Every conference presentation shows a gigawatt pipeline chart, and almost nobody shows the chart underneath it, which is how much of that pipeline actually reaches final investment decision. That second chart is the only one that matters to a manufacturer trying to plan factory capacity."
Director, Hydrogen and Electrolysis Technology Practice · MMA Energy / Hydrogen

Market Trends

Announced Pipeline Far Outpaces Final Investment Decisions

Global announced electrolyzer project capacity has reached many multiples of what has actually proceeded to final investment decision and construction, a gap that widened rather than narrowed through 2023 and 2024 as offtake agreements proved harder to secure than developers initially expected. The commercial consequence is that manufacturers building factory capacity against announced pipeline figures risk substantial overcapacity if conversion rates do not improve considerably from current levels. Buyers increasingly demand manufacturers demonstrate bankable order books rather than pipeline announcements before committing to long-term supply agreements, and that shift is reshaping how manufacturers report their own commercial position publicly.
Market Impact: Subsidies close 40-60% of cost gap
Chinese Manufacturers Undercut Western Stack Pricing Sharply

LONGi Hydrogen, Sungrow Hydrogen, and PERIC have scaled alkaline and PEM stack manufacturing capacity at prices reportedly 30% to 50% below comparable Western equipment, applying manufacturing scale built across adjacent solar and battery industries to this newer product category. Western manufacturers argue quality and durability differences justify the premium, but buyers in price-sensitive markets increasingly specify Chinese equipment regardless of that argument entirely. The commercial consequence is that Western manufacturers now compete primarily on subsidy-protected domestic content requirements rather than on cost, since open international competition increasingly favours Chinese suppliers on price alone.
Market Impact: Steel and ammonia demand tops 40Mt

Market Opportunities and Growth Drivers

Subsidy Programmes Keep Converting Pipeline Into Funded Projects

The American clean hydrogen production tax credit and the European Union's hydrogen bank auction mechanism both provide per-kilogram production subsidies substantial enough to close the cost gap against grey hydrogen produced from natural gas without carbon capture equipment attached. Every successful auction round converts a portion of announced pipeline into contractually committed, bankable projects that can secure project financing on reasonable terms. Similar mechanisms are spreading to Japan, South Korea, and India, each adding a national funding pool that developers can access alongside private capital, meaningfully expanding the addressable project universe.
Market Impact: Green hydrogen costs 2-3x grey

Industrial Decarbonisation Mandates Create Guaranteed Offtake Demand

Steel producers facing carbon border adjustment mechanisms in the European Union and ammonia producers facing similar decarbonisation pressure both require hydrogen at a scale renewable power generation alone cannot deliver without electrolysis equipment converting that power into a storable, transportable industrial fuel. These industrial buyers sign long-term offtake agreements that materially improve project bankability, since lenders finance projects with contracted revenue far more readily than those dependent on merchant hydrogen sales alone in a thin spot market. Steel and ammonia together represent the largest addressable industrial demand pool electrolyzer capacity currently targets worldwide.
Market Impact: Offtake covers under 25% of pipelin

Market Restraints and Challenges

Stack Cost Remains The Unresolved Commercial Barrier

Electrolyzer stack cost, particularly for PEM systems using platinum group metal catalysts and titanium components, remains high enough that green hydrogen production cost exceeds grey hydrogen even after available subsidy in most markets tracked. The root cause is that manufacturing scale has not yet reached the volume needed to drive component costs down the learning curve that solar and battery manufacturing achieved previously. Commercially this keeps many announced projects stalled at final investment decision indefinitely. Manufacturers are mitigating the barrier through reduced precious metal loading, standardised modular designs, and manufacturing scale investment funded partly by government grants.
Market Impact: Only 30% of pipeline reaches FID

Offtake Agreements Remain Difficult To Secure At Scale

Industrial buyers remain reluctant to sign long-term hydrogen offtake agreements at prices reflecting current green hydrogen production cost, since doing so locks in a cost disadvantage against competitors continuing to use conventional grey hydrogen or natural gas directly. The root cause is that hydrogen buyers generally lack the same subsidy support electrolyzer developers themselves receive, creating a genuine mismatch in the economics each side of the transaction faces. Commercially this leaves many projects unable to reach bankable financing despite available capital. Developers are mitigating the gap through blended pricing structures and by targeting buyers facing their own decarbonisation mandates.
Market Impact: Chinese stacks undercut prices 30-5
4 additional market trends, 3 additional growth drivers, and 2 additional restraints and challenges are covered in the full report. Contact sales@marketmindsadvisory.com to access the complete intelligence.

Segment CAGR and Growth Architecture

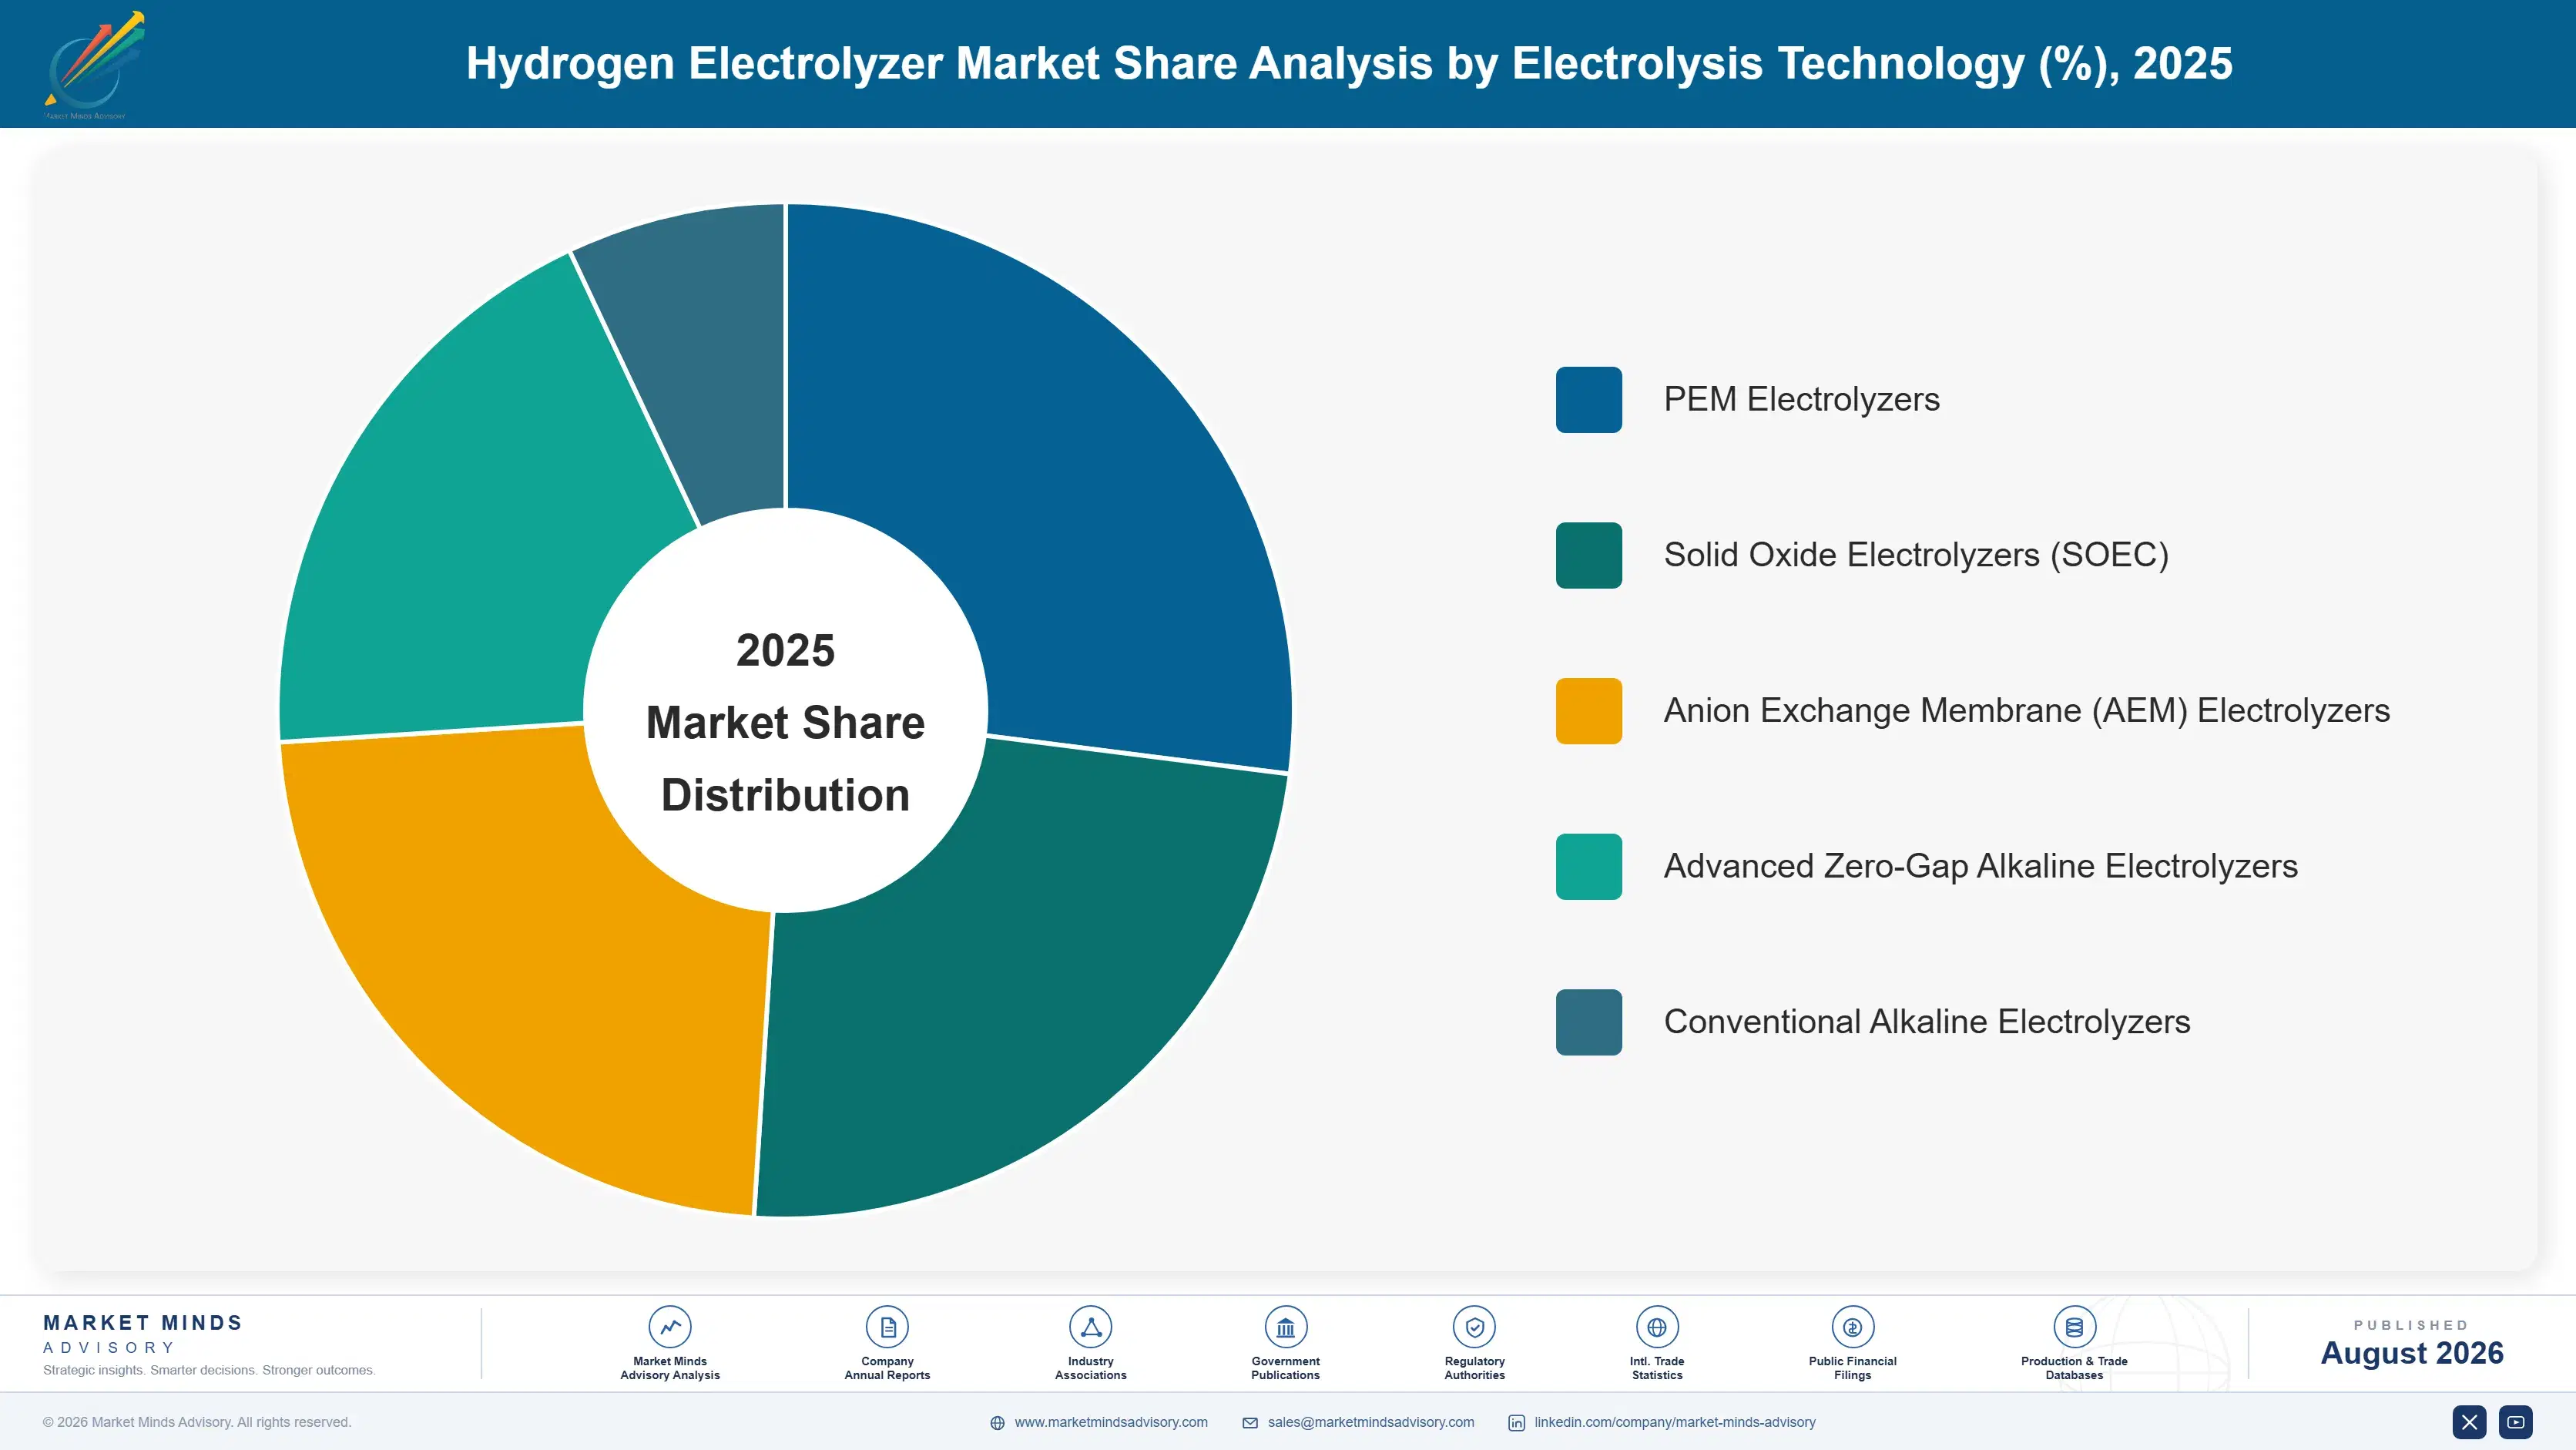
Segmentation follows electrolysis technology, a single engineering logic describing the electrochemical mechanism that splits water into hydrogen and oxygen at the cell level. Each technology carries its own efficiency, capital cost, and response characteristics, so commercial position tracks the technology rather than the buyer's end application. Project scale and end-use industry appear separately in the framework.
hydrogen-electrolyzer-market-market-share-analysis-1787324748908

PEM Electrolyzers

PEM electrolyzers grow fastest at 16.2%, about 1.41 times the overall 11.5% rate, favoured for renewable-coupled projects where dynamic response to variable solar and wind output matters more than upfront capital cost. The technology uses platinum group metal catalysts and titanium components that keep stack cost meaningfully above alkaline alternatives, though costs have fallen considerably as manufacturing scale expands across Nel Hydrogen, ITM Power, and Cummins facilities specifically over the past several years. Grid operators and renewable project developers increasingly specify PEM for its compact footprint and fast response characteristics, even where the levelised cost calculation still favours alkaline technology on paper. Reduced precious metal loading research continues narrowing the cost gap steadily each generation.
CAGR 16.2%

Solid Oxide Electrolyzers (SOEC)

Solid oxide electrolyzers grow second-fastest at 14.8%, operating at high temperature to achieve efficiency levels considerably above both alkaline and PEM alternatives, particularly attractive where waste industrial heat is available to offset the thermal energy requirement entirely. Sunfire and Bloom Energy have both commercialised solid oxide systems at meaningful scale, targeting industrial buyers with existing high-grade heat sources including steel and chemical production facilities specifically. The technology remains earlier in its commercial deployment curve than alkaline or PEM, carrying genuine durability questions under thermal cycling that buyers evaluate carefully before committing capital. Efficiency advantages are proving decisive for buyers with the right heat integration opportunity available on site already today.
CAGR 14.8%
Full segment breakdown across 5 segments available in the complete report.

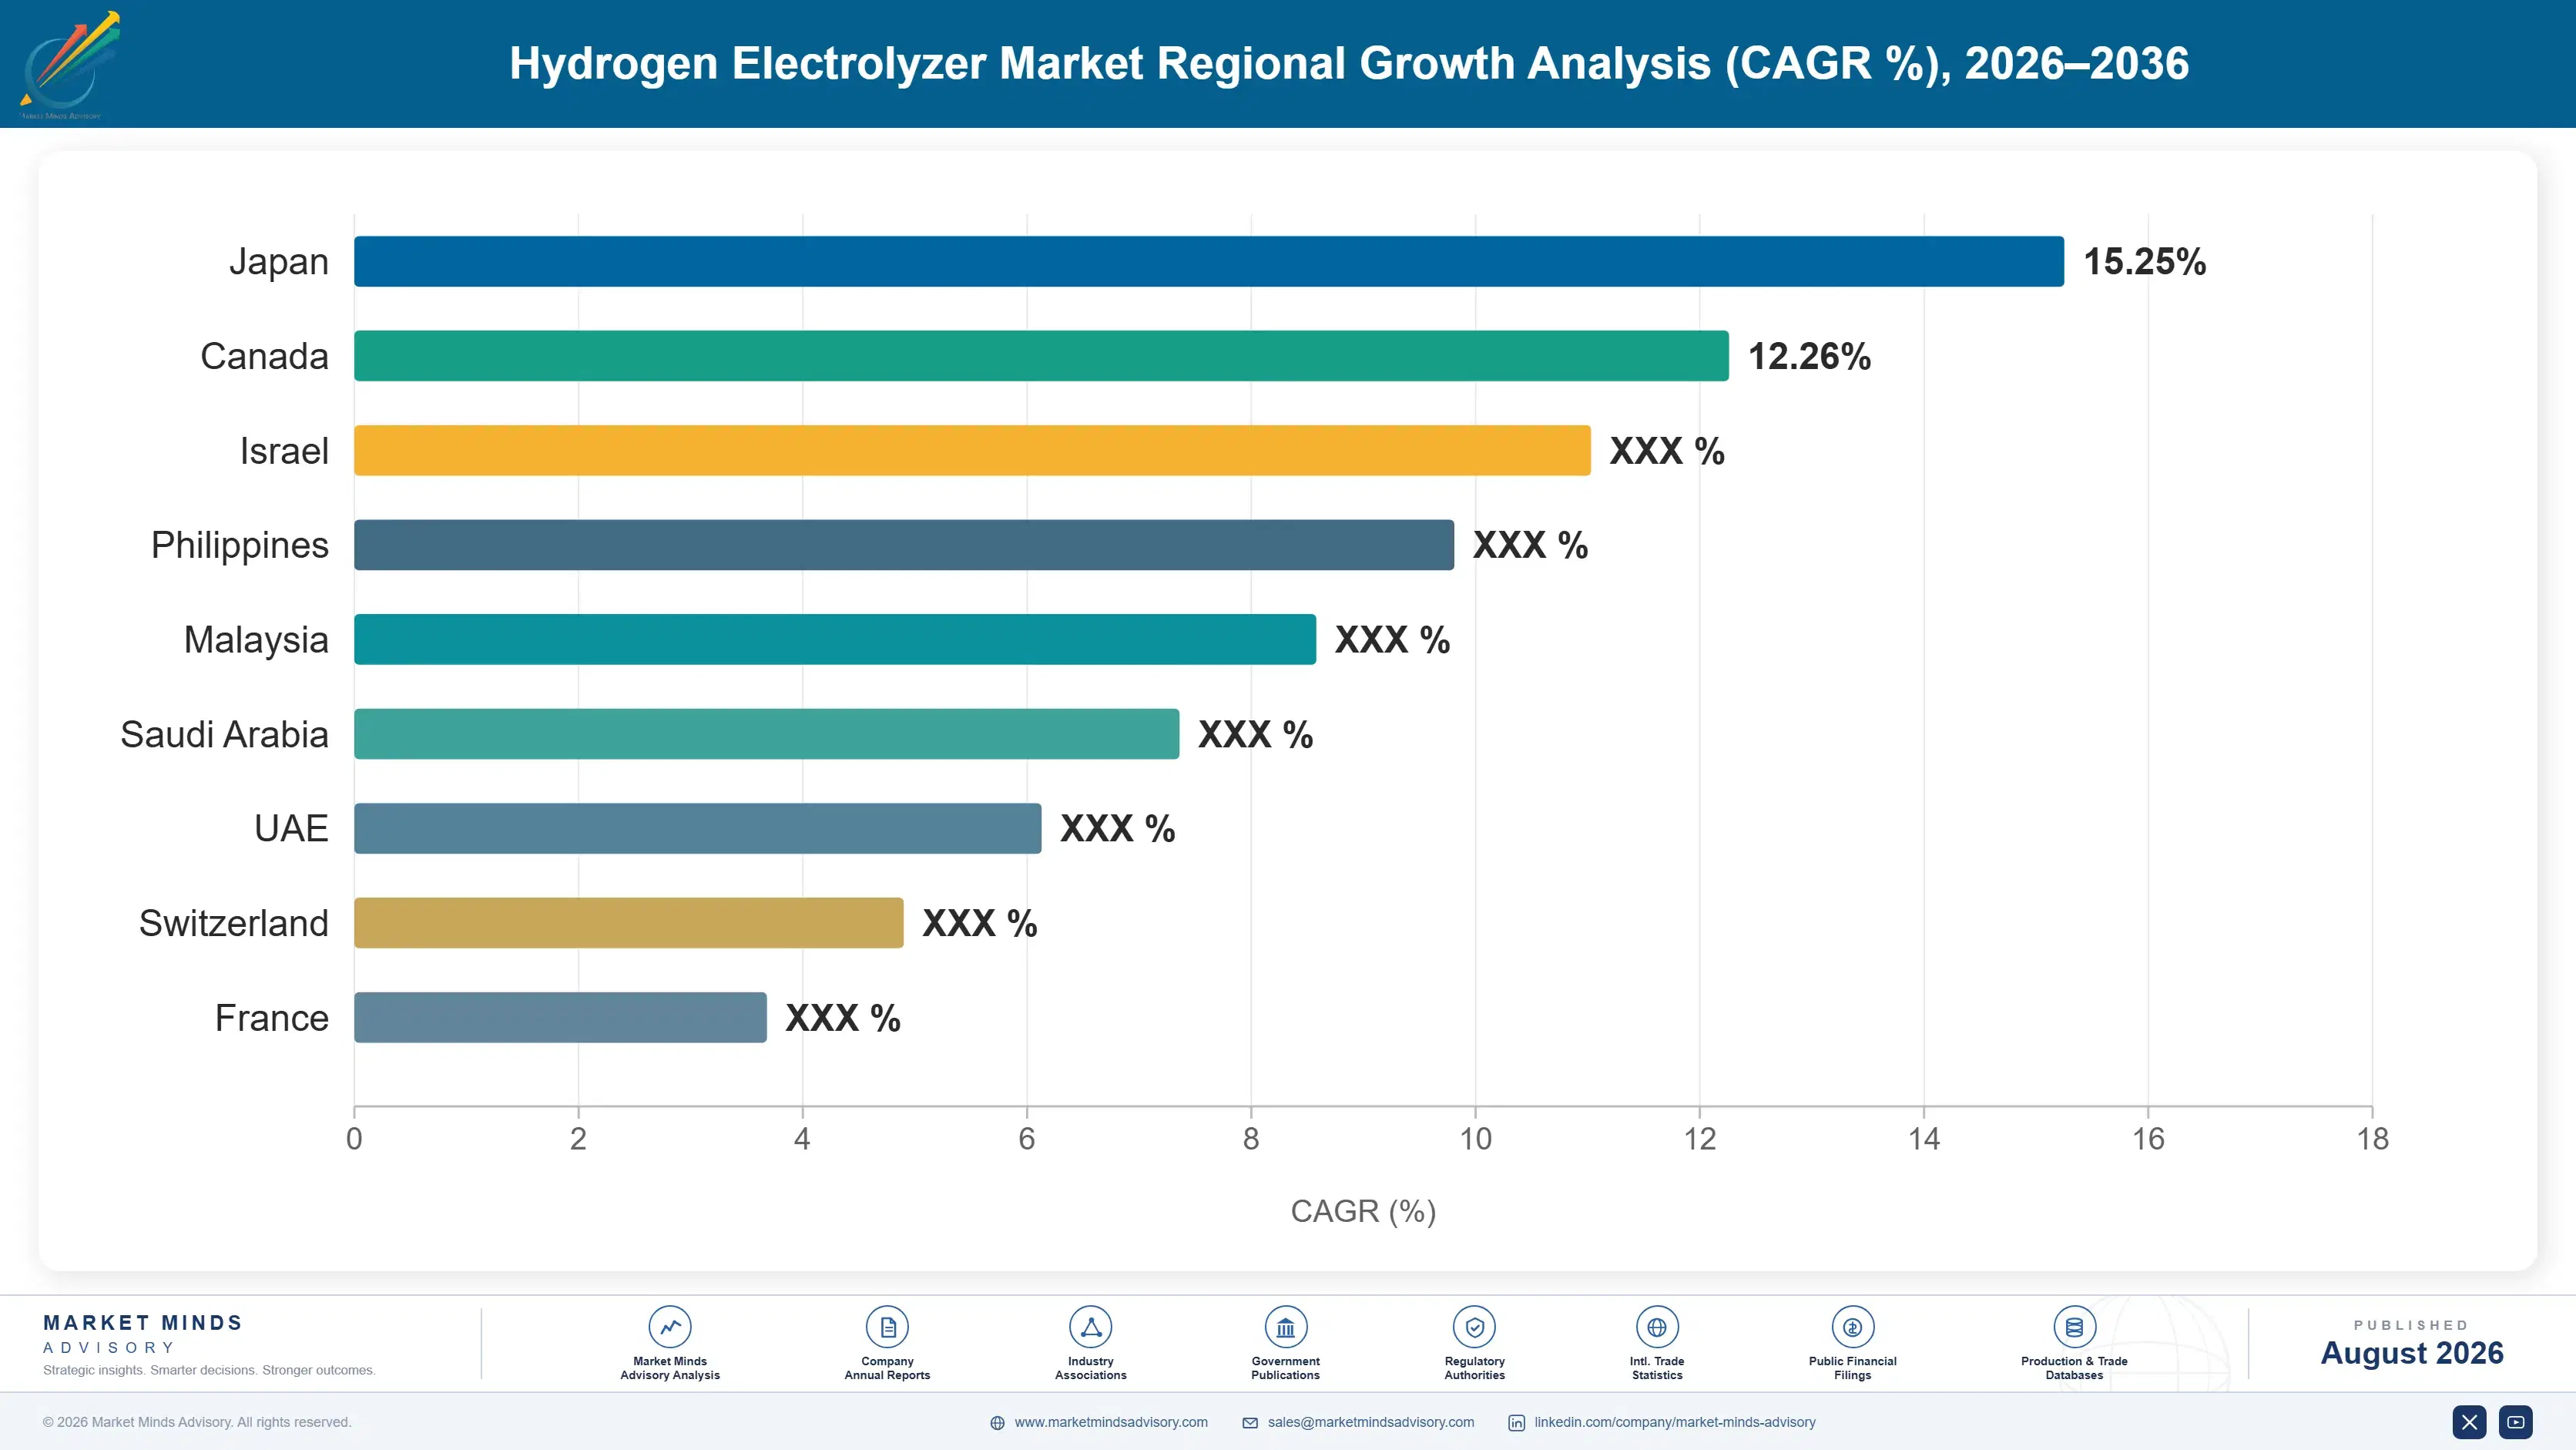
Regional Architecture and Country Demand Map

Manufacturing capacity and subsidy programme strength together set this distribution across the seven regions tracked here almost entirely on their own. East Asia leads on Chinese manufacturing scale, while share elsewhere tracks how aggressively each region's subsidy programmes convert announced pipeline into funded, shipped projects.

North America

North America holds 24% of value, and the American clean hydrogen production tax credit has been the single most consequential policy mechanism shaping project economics anywhere in the world since its introduction. Domestic manufacturing content requirements attached to the credit are pulling stack production investment onshore from Plug Power and other domestic manufacturers rather than relying entirely on imported equipment. Canadian projects target export-oriented ammonia and hydrogen production, drawing on abundant low-cost renewable and hydroelectric power specifically available there. Policy uncertainty around credit continuation following recent political transitions has slowed some final investment decisions considerably. Growth of 12.3% reflects subsidy-driven project conversion continuing despite that genuine uncertainty hanging over longer-dated projects.
Share: 24% | CAGR: 12.3% (2026 to 2036)

Western Europe

Western Europe holds 25% of value, and the European Union's hydrogen bank auction mechanism has become the primary vehicle converting announced projects into funded ones across member states pursuing aggressive decarbonisation targets. German and French industrial buyers, particularly in steel and chemical production, provide the deepest offtake demand pool anywhere in the region by a considerable margin. thyssenkrupp nucera and other European manufacturers hold genuine technology leadership in alkaline and solid oxide systems specifically. Import competition from Chinese equipment is intensifying pressure on domestic manufacturers even as European content requirements partly shield them from direct price comparison. Growth of 10.0% tracks auction round timing and industrial offtake agreement conversion closely across the bloc.
Share: 25% | CAGR: 10.0% (2026 to 2036)
Regional intelligence for 5 additional markets available in the complete report: East Asia, South Asia and Pacific, Latin America, Middle East and Africa, Eastern Europe. Contact sales@marketmindsadvisory.com.
hydrogen-electrolyzer-market-country-cagr-analysis-1787324749421

Where Electrolyzer Value Survives Chinese Price Pressure

Selling alkaline stacks against Chinese scale pricing is a race Western manufacturers cannot win on cost alone against subsidised domestic capacity built over years of adjacent industry investment. The four moves below shift value toward positions a bulk price comparison cannot easily erode: bankability documentation, domestic content eligibility, technology differentiation, and offtake-backed project development.

Sell Bankability Documentation As A Distinct Product

Only about 30% of announced project pipeline reaches final investment decision, and lenders increasingly demand manufacturers demonstrate track record, warranty terms, and performance guarantees before financing proceeds on reasonable terms anywhere in the world. Manufacturers who package documented performance data, insurance-backed warranties, and financing partnerships alongside the equipment itself capture design-in relationships pure hardware sellers never access at all in this market. That documentation effectively becomes a separate product buyers pay for explicitly, since it directly determines whether their project can secure financing at a workable interest rate at all.
Market Impact: Bankable manufacturers see 2x highe

Qualify For Domestic Content Subsidy Eligibility Early

The American production tax credit and European Union domestic content requirements both provide meaningful subsidy premiums for equipment meeting specific manufacturing origin thresholds, creating pricing power Chinese imports cannot access regardless of underlying cost advantage held elsewhere in the world. Manufacturers who establish qualifying domestic production early capture subsidy-protected volume for the life of these programmes, which typically run 10 years or longer once enacted into law by legislators. Qualification requires genuine manufacturing investment rather than final assembly alone, so early movers build a defensible position latecomers cannot easily replicate.
Market Impact: Domestic content premiums add 20% t

Differentiate On Technology Rather Than Compete On Price

PEM and solid oxide technologies command premium pricing 40% to 60% above commodity alkaline systems because dynamic response and efficiency advantages genuinely matter to specific buyer segments willing to pay for them directly and repeatedly. Manufacturers competing purely on alkaline price against Chinese suppliers face a race to the bottom no Western cost structure can win over any reasonable timeframe available. Investing in PEM or solid oxide capability instead moves competition toward performance characteristics where manufacturing scale matters less than genuine engineering capability and accumulated field experience earned over many product generations.
Market Impact: PEM commands 40% to 60% price premi

Co-Develop Projects With Offtake Partners Directly

Offtake agreements currently cover under 25% of announced pipeline, and manufacturers who help developers secure that offtake by co-investing or providing structured financing support capture equipment sales that would otherwise stall indefinitely at final investment decision anywhere in the world. Cummins and other diversified manufacturers with balance sheet capacity increasingly participate in project development directly rather than selling equipment at arm's length to independent developers alone. That involvement de-risks the manufacturer's own order book considerably, converting speculative pipeline into contracted, bankable revenue years ahead of typical industry practice observed elsewhere.
Market Impact: Co-developed projects convert to or

Who Controls the Margin Pool

Concentration is low: the top five hold roughly 38% of revenue, with legacy industrial gas equipment suppliers, dedicated hydrogen specialists, and Chinese manufacturers competing on quite different cost bases. The gap between leaders and challengers is bankability and offtake relationships rather than manufacturing scale alone, which is genuinely accessible to well-capitalised new entrants. All participants are assessed on one basis, revenue from electrolyzer stack and system equipment sold to
Competition runs along three lines. First, bankability, since manufacturers demonstrating documented performance and warranty terms win financed projects component-only sellers cannot access. Second, domestic content eligibility, where subsidy-qualifying manufacturing captures pricing power imports cannot match. Third, technology differentiation, since PEM and solid oxide command premium pricing commodity alkaline increasingly cannot sustain.

Pressure is building from two directions. Chinese manufacturers including LONGi Hydrogen and Sungrow Hydrogen are winning export qualification on price and increasingly on demonstrated quality as well. Meanwhile diversified manufacturers with balance sheet capacity are co-developing projects directly, converting speculative pipeline into bankable orders competitors selling equipment alone cannot replicate. Rankings should favour companies with genuine bankability and technology differentiation over those competing on commodity alkaline price alone.
hydrogen-electrolyzer-market-company-positioning-matrix-1787324749947

Competitive Moat and Risk Dimensions

NEL HYDROGEN

Moat: Alkaline scale and installed base

Nel Hydrogen operates one of the largest installed alkaline electrolyzer bases globally, giving it field performance data and customer relationships newer entrants take years to accumulate. Its manufacturing scale across both alkaline and PEM technology lets it serve buyers across the full technology spectrum rather than a single niche.
NEL HYDROGEN

Risk: Chinese price competition and margin

Chinese manufacturers undercut Nel's alkaline pricing by 30% to 50%, pressuring margin on the company's largest product line even as it tries to shift mix toward higher-margin PEM systems. Project delays across the industry have also slowed order conversion, leaving announced backlog larger than confirmed shipping schedules suggest.
THYSSENKRUPP NUCERA

Moat: Zero-gap alkaline efficiency leadership

thyssenkrupp nucera holds genuine technology leadership in zero-gap alkaline design, delivering efficiency considerably above conventional alkaline systems while retaining alkaline's cost advantage over PEM systems entirely. Deep relationships with European industrial buyers give it a bankability advantage smaller entrants struggle to replicate quickly across comparable projects.
THYSSENKRUPP NUCERA

Risk: European industrial demand concentration

A meaningful share of thyssenkrupp nucera's order book depends on European industrial decarbonisation policy continuing on its current trajectory, leaving it exposed if political support wavers unexpectedly. Chinese export competition is also reaching European buyers directly, pressuring pricing even within its historically strongest home market.

Players Tracked

Prominent Players

Nel Hydrogen
thyssenkrupp nucera
Plug Power
ITM Power
Cummins (Accelera)

Other Key Players

McPhy Energy
Sunfire
Enapter
John Cockerill
LONGi Hydrogen
Sungrow Hydrogen
PERIC Hydrogen Equipment
CIMC Enric
Elogen
HydrogenPro
Hoeller Electrolyzer
Green Hydrogen Systems
Erre Due
Ohmium International
H-TEC Systems

Recent Developments

JUNE 2025

Cummins Accelera commissions expanded PEM manufacturing in Spain

Cummins' Accelera division commissioned an expanded PEM electrolyzer manufacturing facility in Spain, adding meaningful European production capacity to serve subsidy-qualifying domestic content requirements under the European Union's hydrogen bank programme. This was an organic capacity expansion rather than any acquisition or joint venture, targeting European auction-backed demand specifically.
Signal: Domestic content-qualifying capacity inves
DECEMBER 2024

LONGi Hydrogen signs supply agreement with Middle East ammonia megaproject

LONGi Hydrogen signed a supply agreement with a Middle Eastern green ammonia megaproject developer for alkaline electrolyzer stacks, securing a substantial equipment order ahead of the project's targeted final investment decision. This was a supply agreement rather than an acquisition or merger, reflecting Chinese manufacturers winning megaproject-scale contracts.
Signal: Chinese suppliers winning megaproject cont
JANUARY 2025

US Treasury finalises clean hydrogen production tax credit guidance

The United States Treasury finalised implementation guidance for the clean hydrogen production tax credit, clarifying eligibility rules that had left many announced projects unable to secure financing pending clarity. This was a regulatory policy clarification rather than any corporate transaction, releasing stalled project financing activity broadly.
Signal: Regulatory clarity on subsidy eligibility

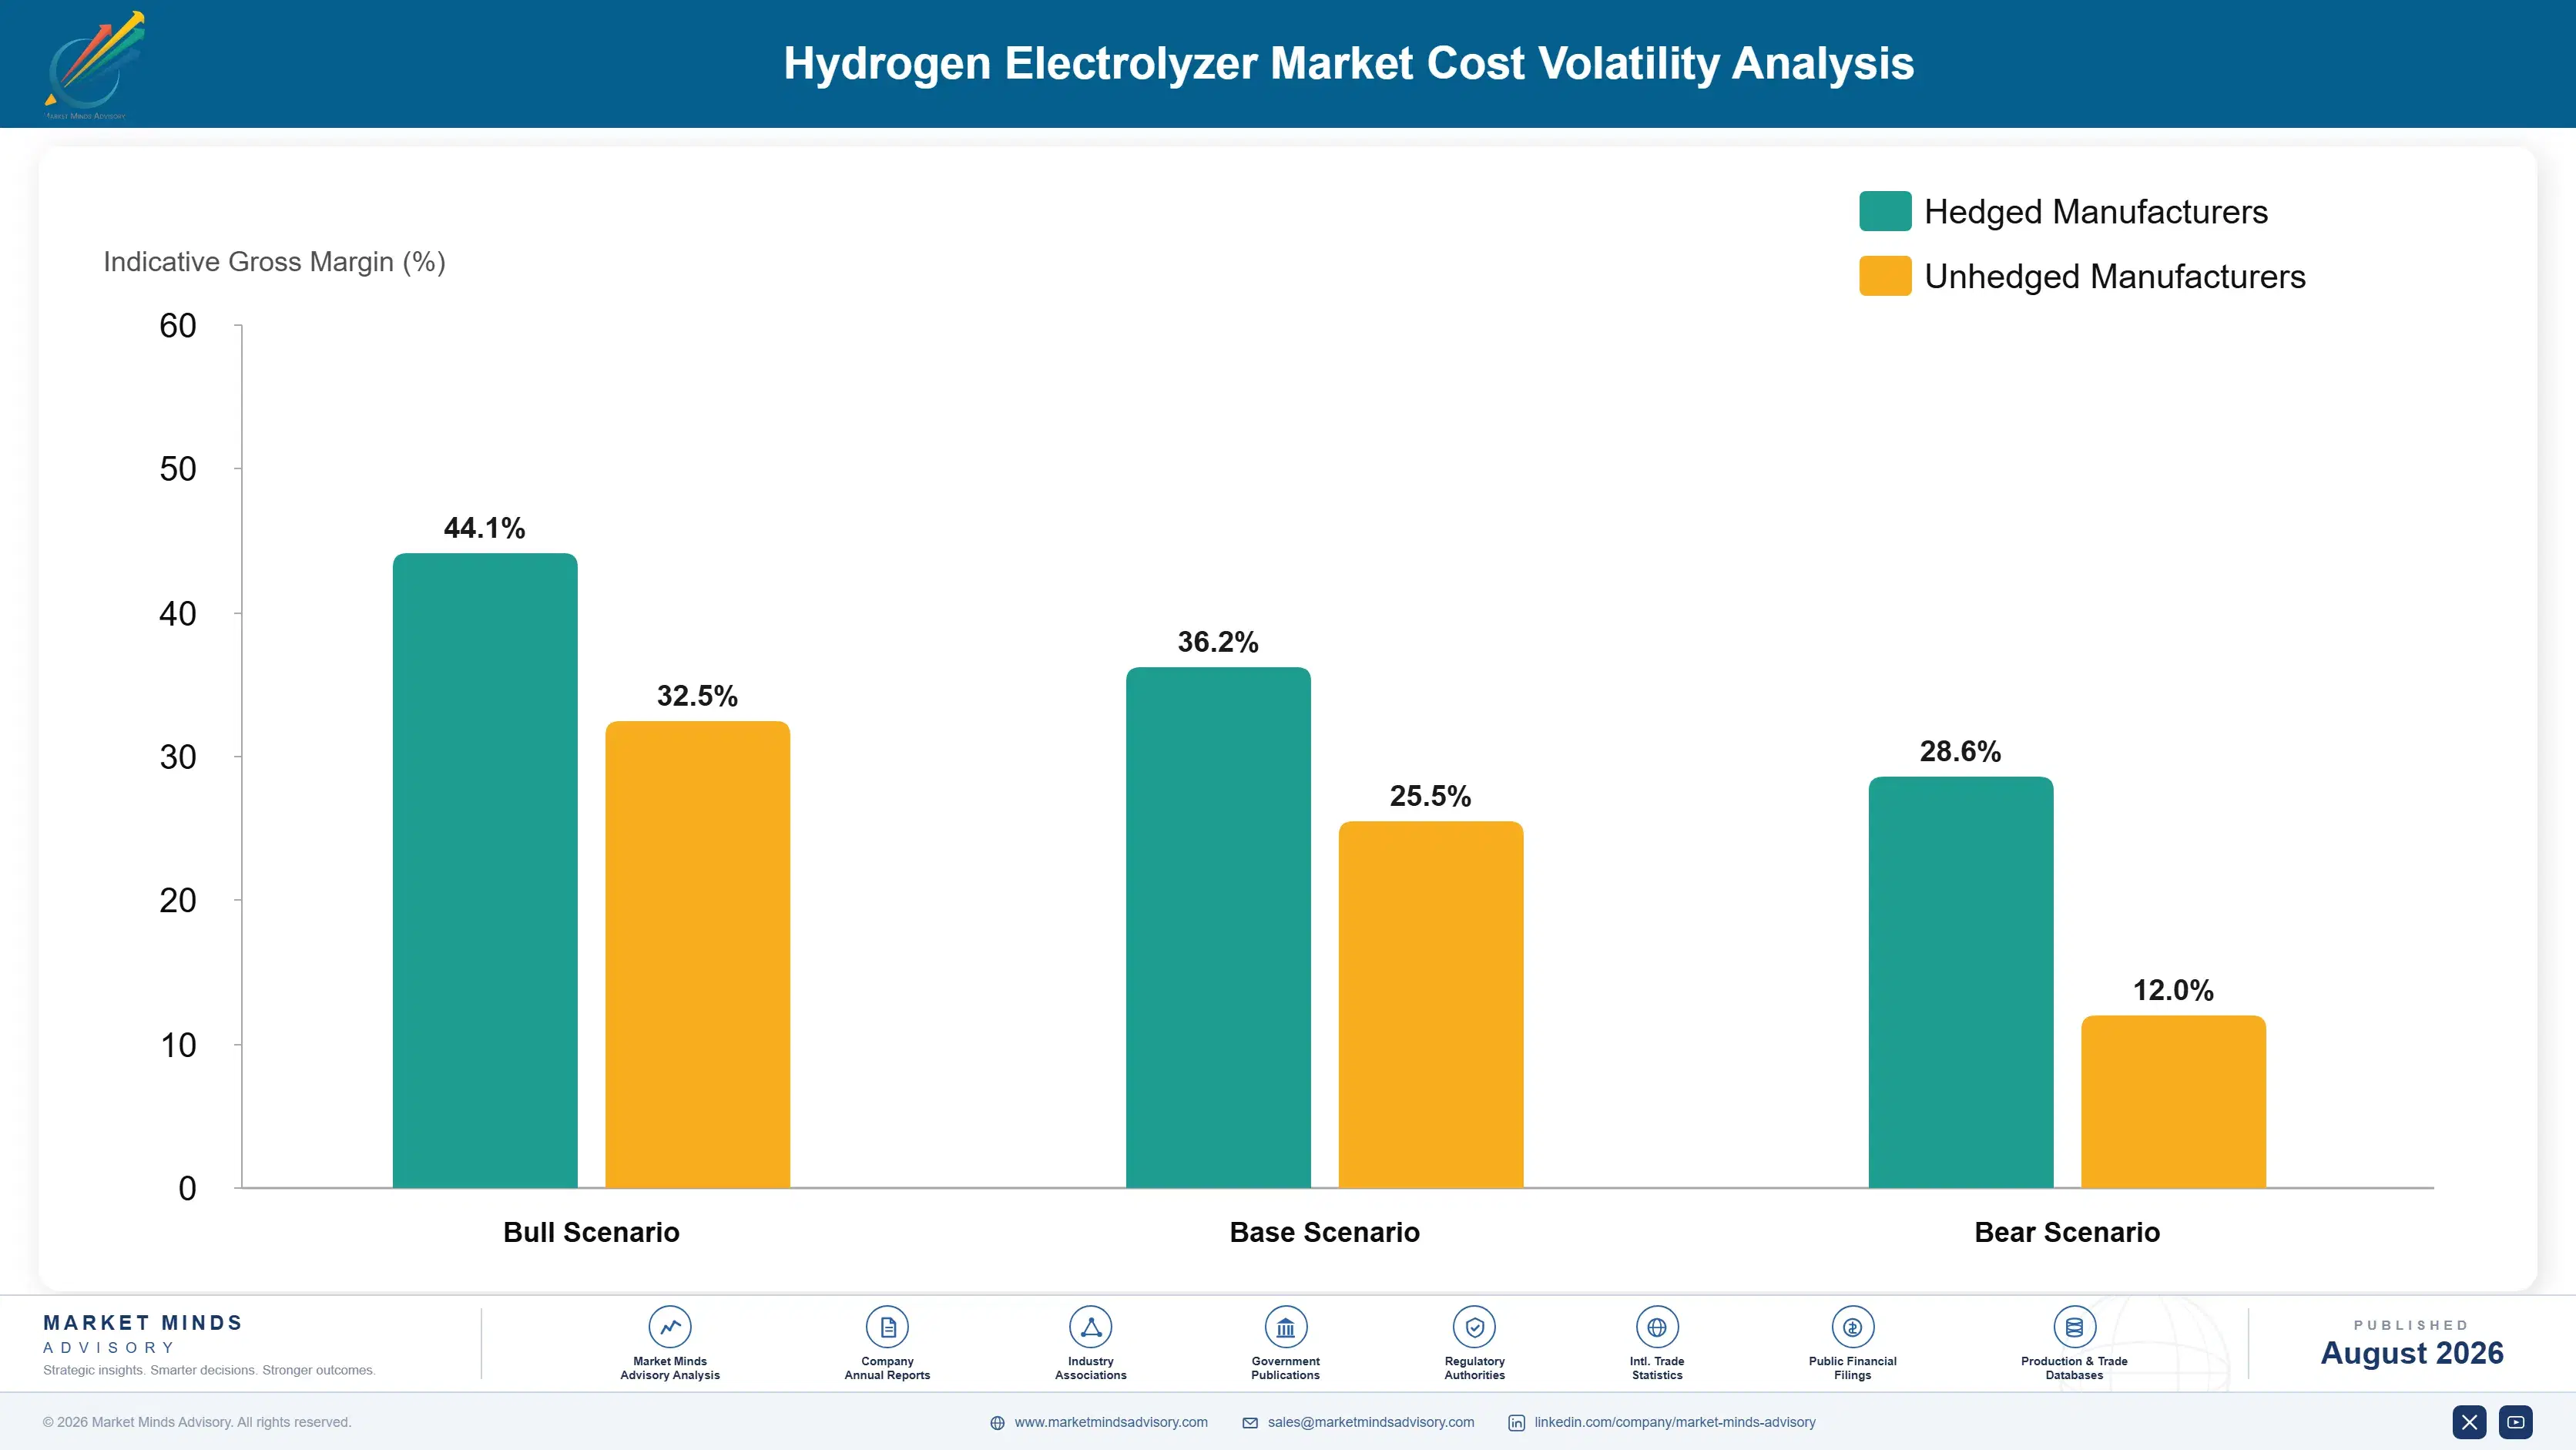
Platinum, Titanium, And Subsidy Timing Risk

Stack components account for roughly 40% to 55% of system cost, dominated by platinum group metal catalysts and titanium bipolar plates in PEM systems specifically, sourced mainly from South African and Russian mining operations. Nickel and steel components for alkaline systems add 20% to 30%. Power electronics and balance-of-plant equipment make up most of the remainder across every technology.
Platinum group metal prices spiked considerably through 2021 as automotive catalytic converter demand and investment demand both rose simultaneously, tightening supply for electrolyzer manufacturers competing for the same constrained material pool. The IEA's Global Hydrogen Review recorded platinum trading well above prior five-year averages at the period's peak, and ITM Power's 2022 annual report cited precious metal cost inflation as a direct pressure on PEM stack margins specifically.

Exposure separates sharply by technology choice and hedging sophistication across the industry. Alkaline manufacturers avoid precious metal exposure entirely, insulating them from platinum price volatility that PEM manufacturers cannot escape regardless of scale achieved. Larger PEM manufacturers negotiate forward purchase agreements with metal suppliers, while smaller entrants buy on spot markets and absorb volatility directly into already thin margins.
hydrogen-electrolyzer-market-cost-volatility-analysis-1787324750144

Reduce platinum group metal loading through catalyst research

Platinum group metal cost represents a disproportionate share of PEM stack cost relative to its physical volume, making loading reduction the single highest-leverage engineering investment available to PEM manufacturers today. Research into reduced-loading catalyst coatings and alternative catalyst chemistry continues narrowing the cost gap against alkaline technology meaningfully each product generation released to the market.

Negotiate forward purchase agreements for precious metals

Spot market platinum purchasing exposed manufacturers fully to the 2021 price spike with no protection whatsoever against the sudden swing in cost that followed almost immediately. Forward purchase agreements with metal suppliers smooth exposure across price cycles and give manufacturers planning certainty spot purchasing simply cannot provide during a genuine market disruption of any real scale.

Diversify technology portfolio across alkaline and PEM

A manufacturer selling only PEM systems carries full precious metal price exposure with no offsetting revenue base to absorb volatility during a price spike affecting the whole market at once. Offering both alkaline and PEM technology lets manufacturers shift customer recommendations toward whichever technology carries more favourable input cost conditions at any given time.

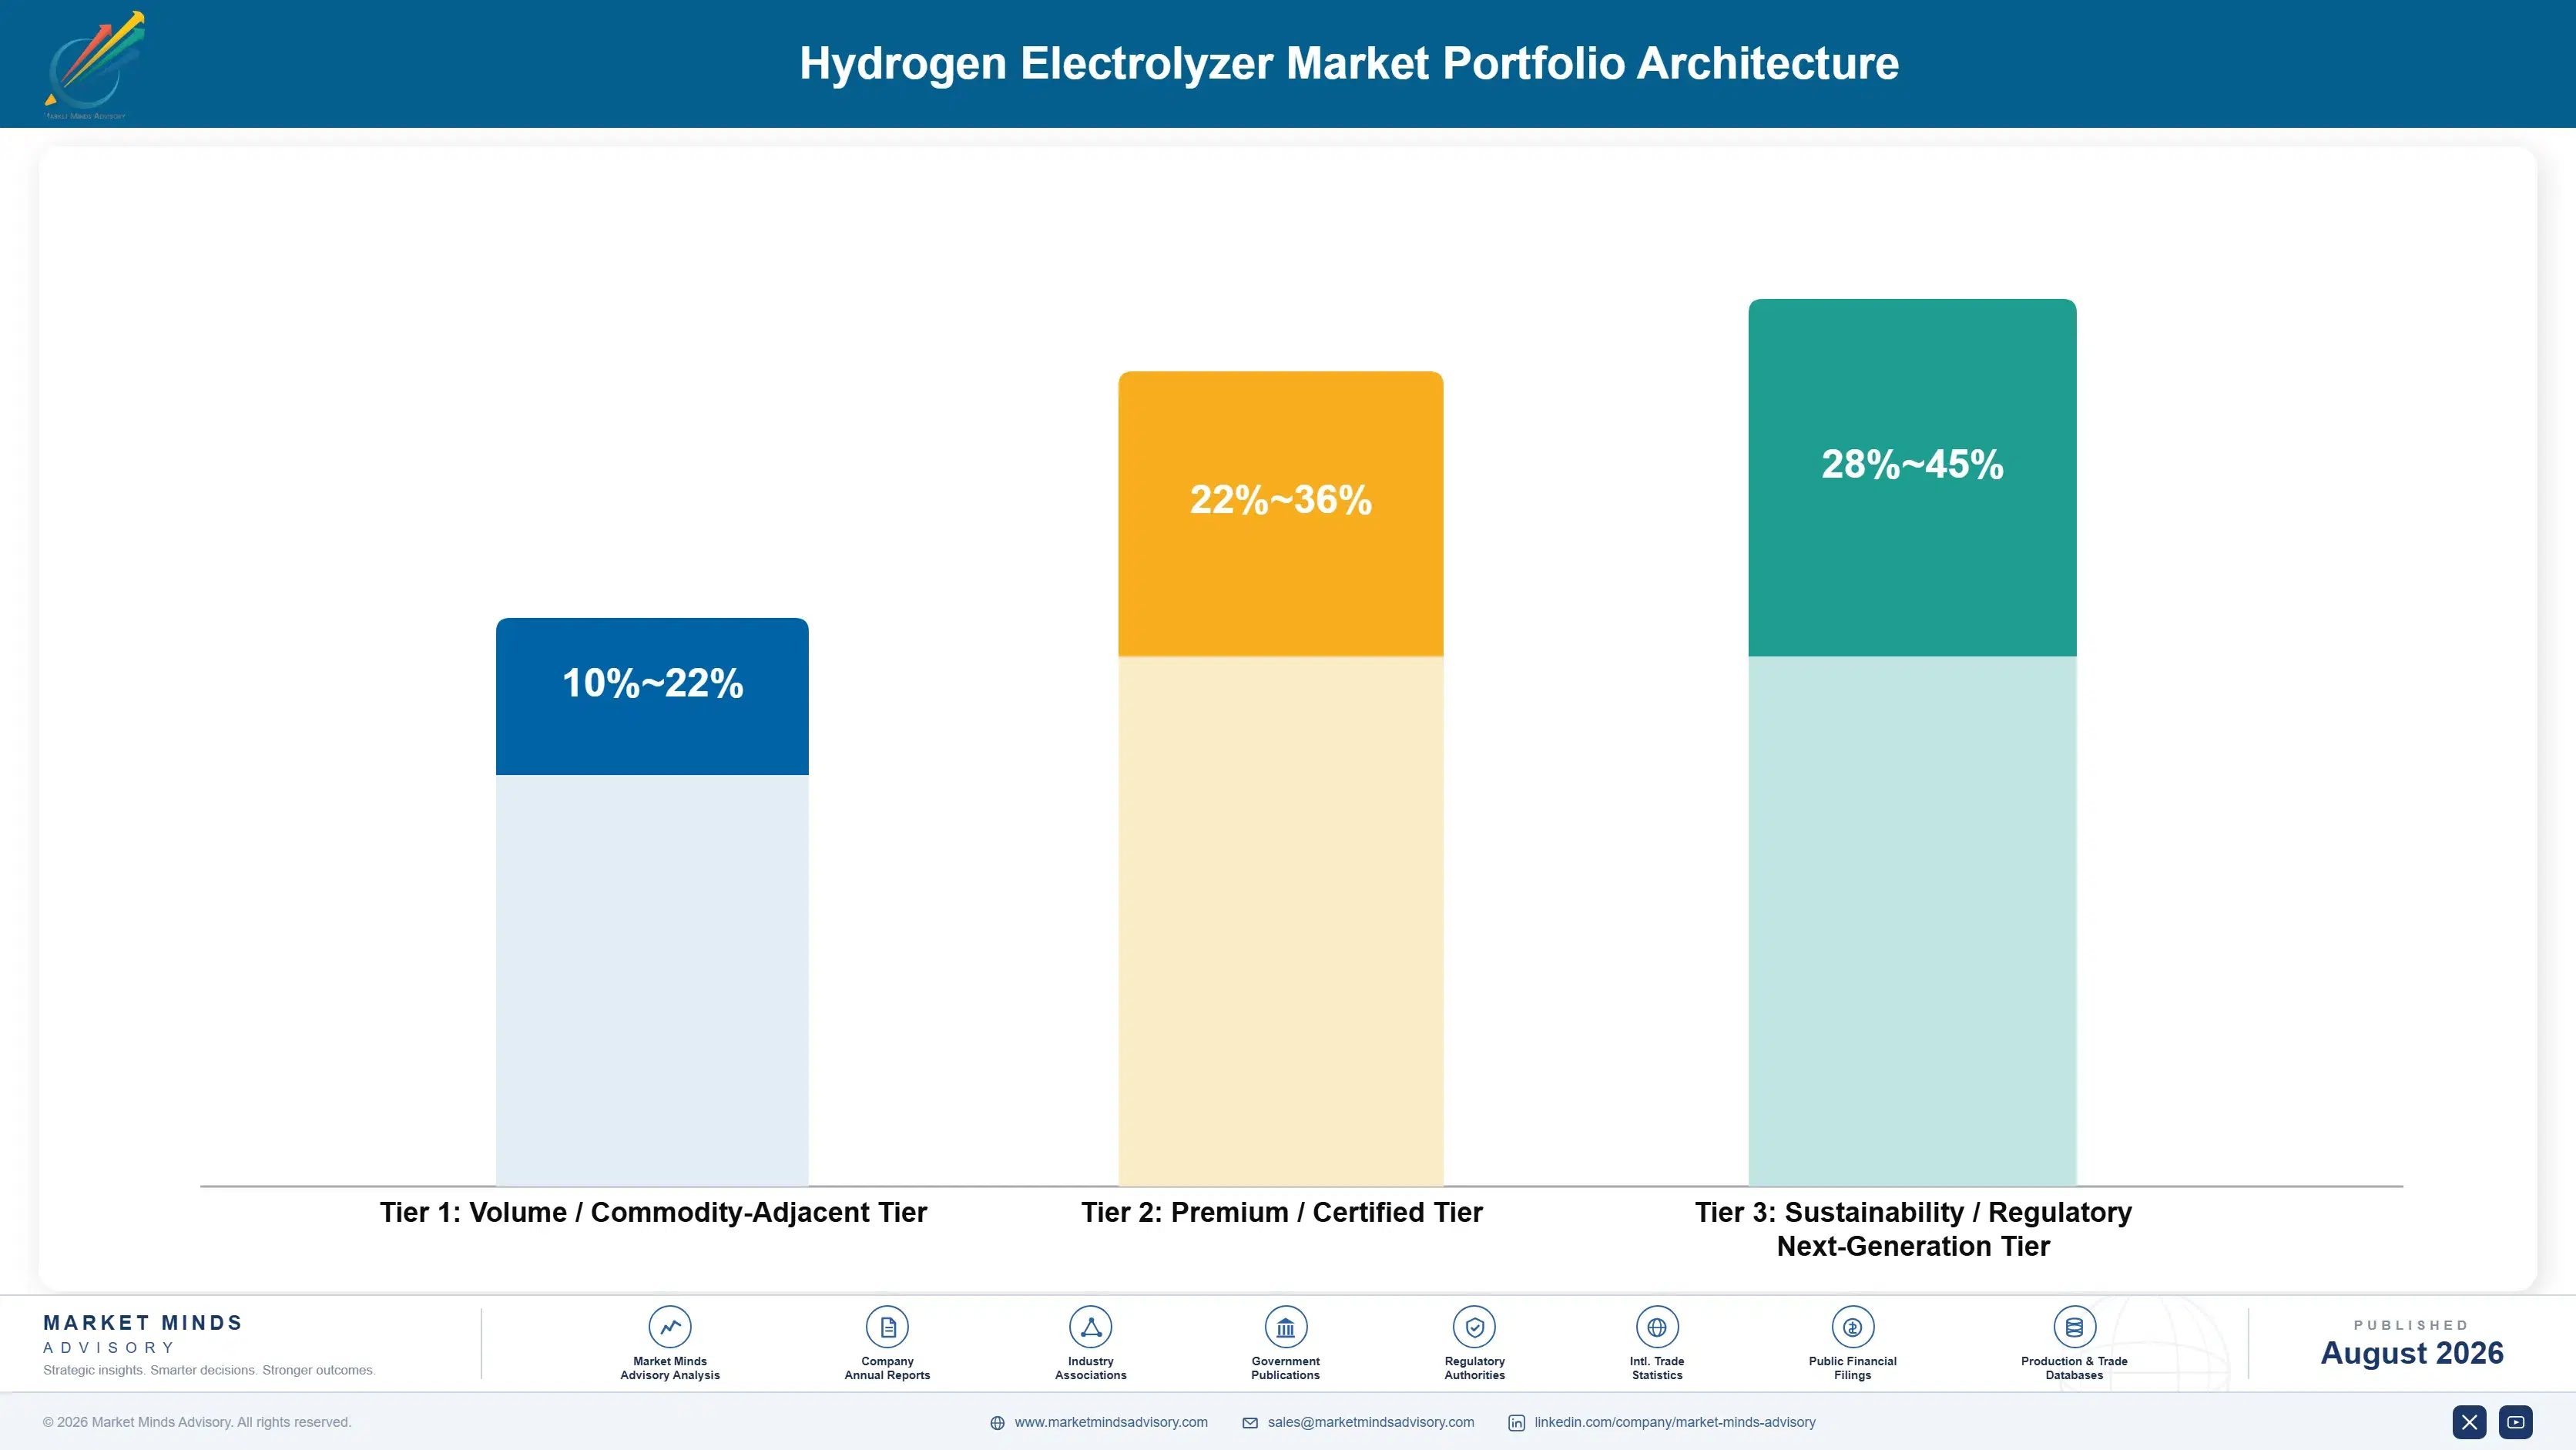
Portfolio Architecture for Margin Defence

The portfolio splits into three tiers with sharply different economics. Conventional alkaline systems form the volume tier, priced against Chinese scale competition with thin, closely benchmarked margin across every qualified regional supplier. PEM and solid oxide systems earn considerably more, since technology differentiation and bankability documentation both resist pure price negotiation between buyer and manufacturer throughout the sales cycle.
Tension runs between the alkaline volume business funding today's operations and the PEM and solid oxide investment that captures tomorrow's premium across every technology segment. A manufacturer defending alkaline volume too aggressively under-invests in the technology differentiation premium buyers actually reward from every credible bidder now competing for bankable projects. Yet abandoning volume revenue too early starves the cash flow that funds the very capability build a manufacturer needs simply to compete.

High-value pools concentrate where genuine differentiation or bankability barriers limit competition meaningfully across the industry: PEM systems for renewable-coupled projects, solid oxide systems for heat-integrated industrial applications, and domestic content-qualifying manufacturing commanding subsidy-protected pricing few competitors can match. Commodity alkaline systems for undifferentiated bulk sale sit at the other end, competing purely on cost against every Chinese manufacturer.

Volume / Commodity-Adjacent Tier

Conventional alkaline electrolyzer systems sold near commodity pricing, competing directly against Chinese manufacturers with considerable scale advantage and correspondingly thin margin across every qualified regional bidder competing for the same renewal contract.
Gross Margin: 10-22%

Premium / Certified Tier

PEM electrolyzer systems and advanced zero-gap alkaline carrying validated bankability documentation, where technology differentiation and financing partnerships both resist pure price negotiation between buyer and manufacturer across the full project cycle.
Gross Margin: 22-36%

Sustainability / Regulatory / Next-Generation Tier

Solid oxide electrolyzer systems, domestic content-qualifying manufacturing, and offtake-backed project-development equipment commanding premium pricing on genuine differentiation and subsidy eligibility few competitors can currently replicate at comparable scale or speed.
Gross Margin: 28-45%
hydrogen-electrolyzer-market-portfolio-architecture-1787324750647

High-value Sub-segments and Strategic Watch-out

PEM Electrolyzers

High value and fastest-growing at 16.2%, favoured for renewable-coupled projects where dynamic response justifies premium pricing well above alkaline margins across every qualified buyer segment evaluated. Reduced precious metal loading research continues narrowing the cost gap steadily each product generation released to market by leading manufacturers.
Gross Margin: 24-38%

Solid Oxide Electrolyzers (SOEC)

High value with strong growth at 14.8%, as industrial buyers with waste heat integration opportunities pay premium for efficiency advantages conventional technology cannot match at comparable scale or cost. Very few credible large-scale commercial deployments exist anywhere close to full maturity today across the wider industry.
Gross Margin: 26-40%

Advanced Zero-Gap Alkaline Electrolyzers

The volume core for large industrial applications, growing steadily at 10.5% but priced through routine negotiation that leaves limited room for margin expansion over time regardless of buyer sophistication involved. Scale and efficiency, not differentiation, decide who wins this business consistently across every region tracked worldwide.
Gross Margin: 16-28%

Conventional Alkaline Electrolyzers

The strategic watch-out, growing just 6.0% and steadily displaced by advanced zero-gap alkaline and Chinese competition on price across nearly every market tracked here. Volume persists mainly where buyers prioritise lowest upfront capital cost over efficiency or bankability documentation entirely, regardless of lifecycle cost implications.
Gross Margin: 8-18%

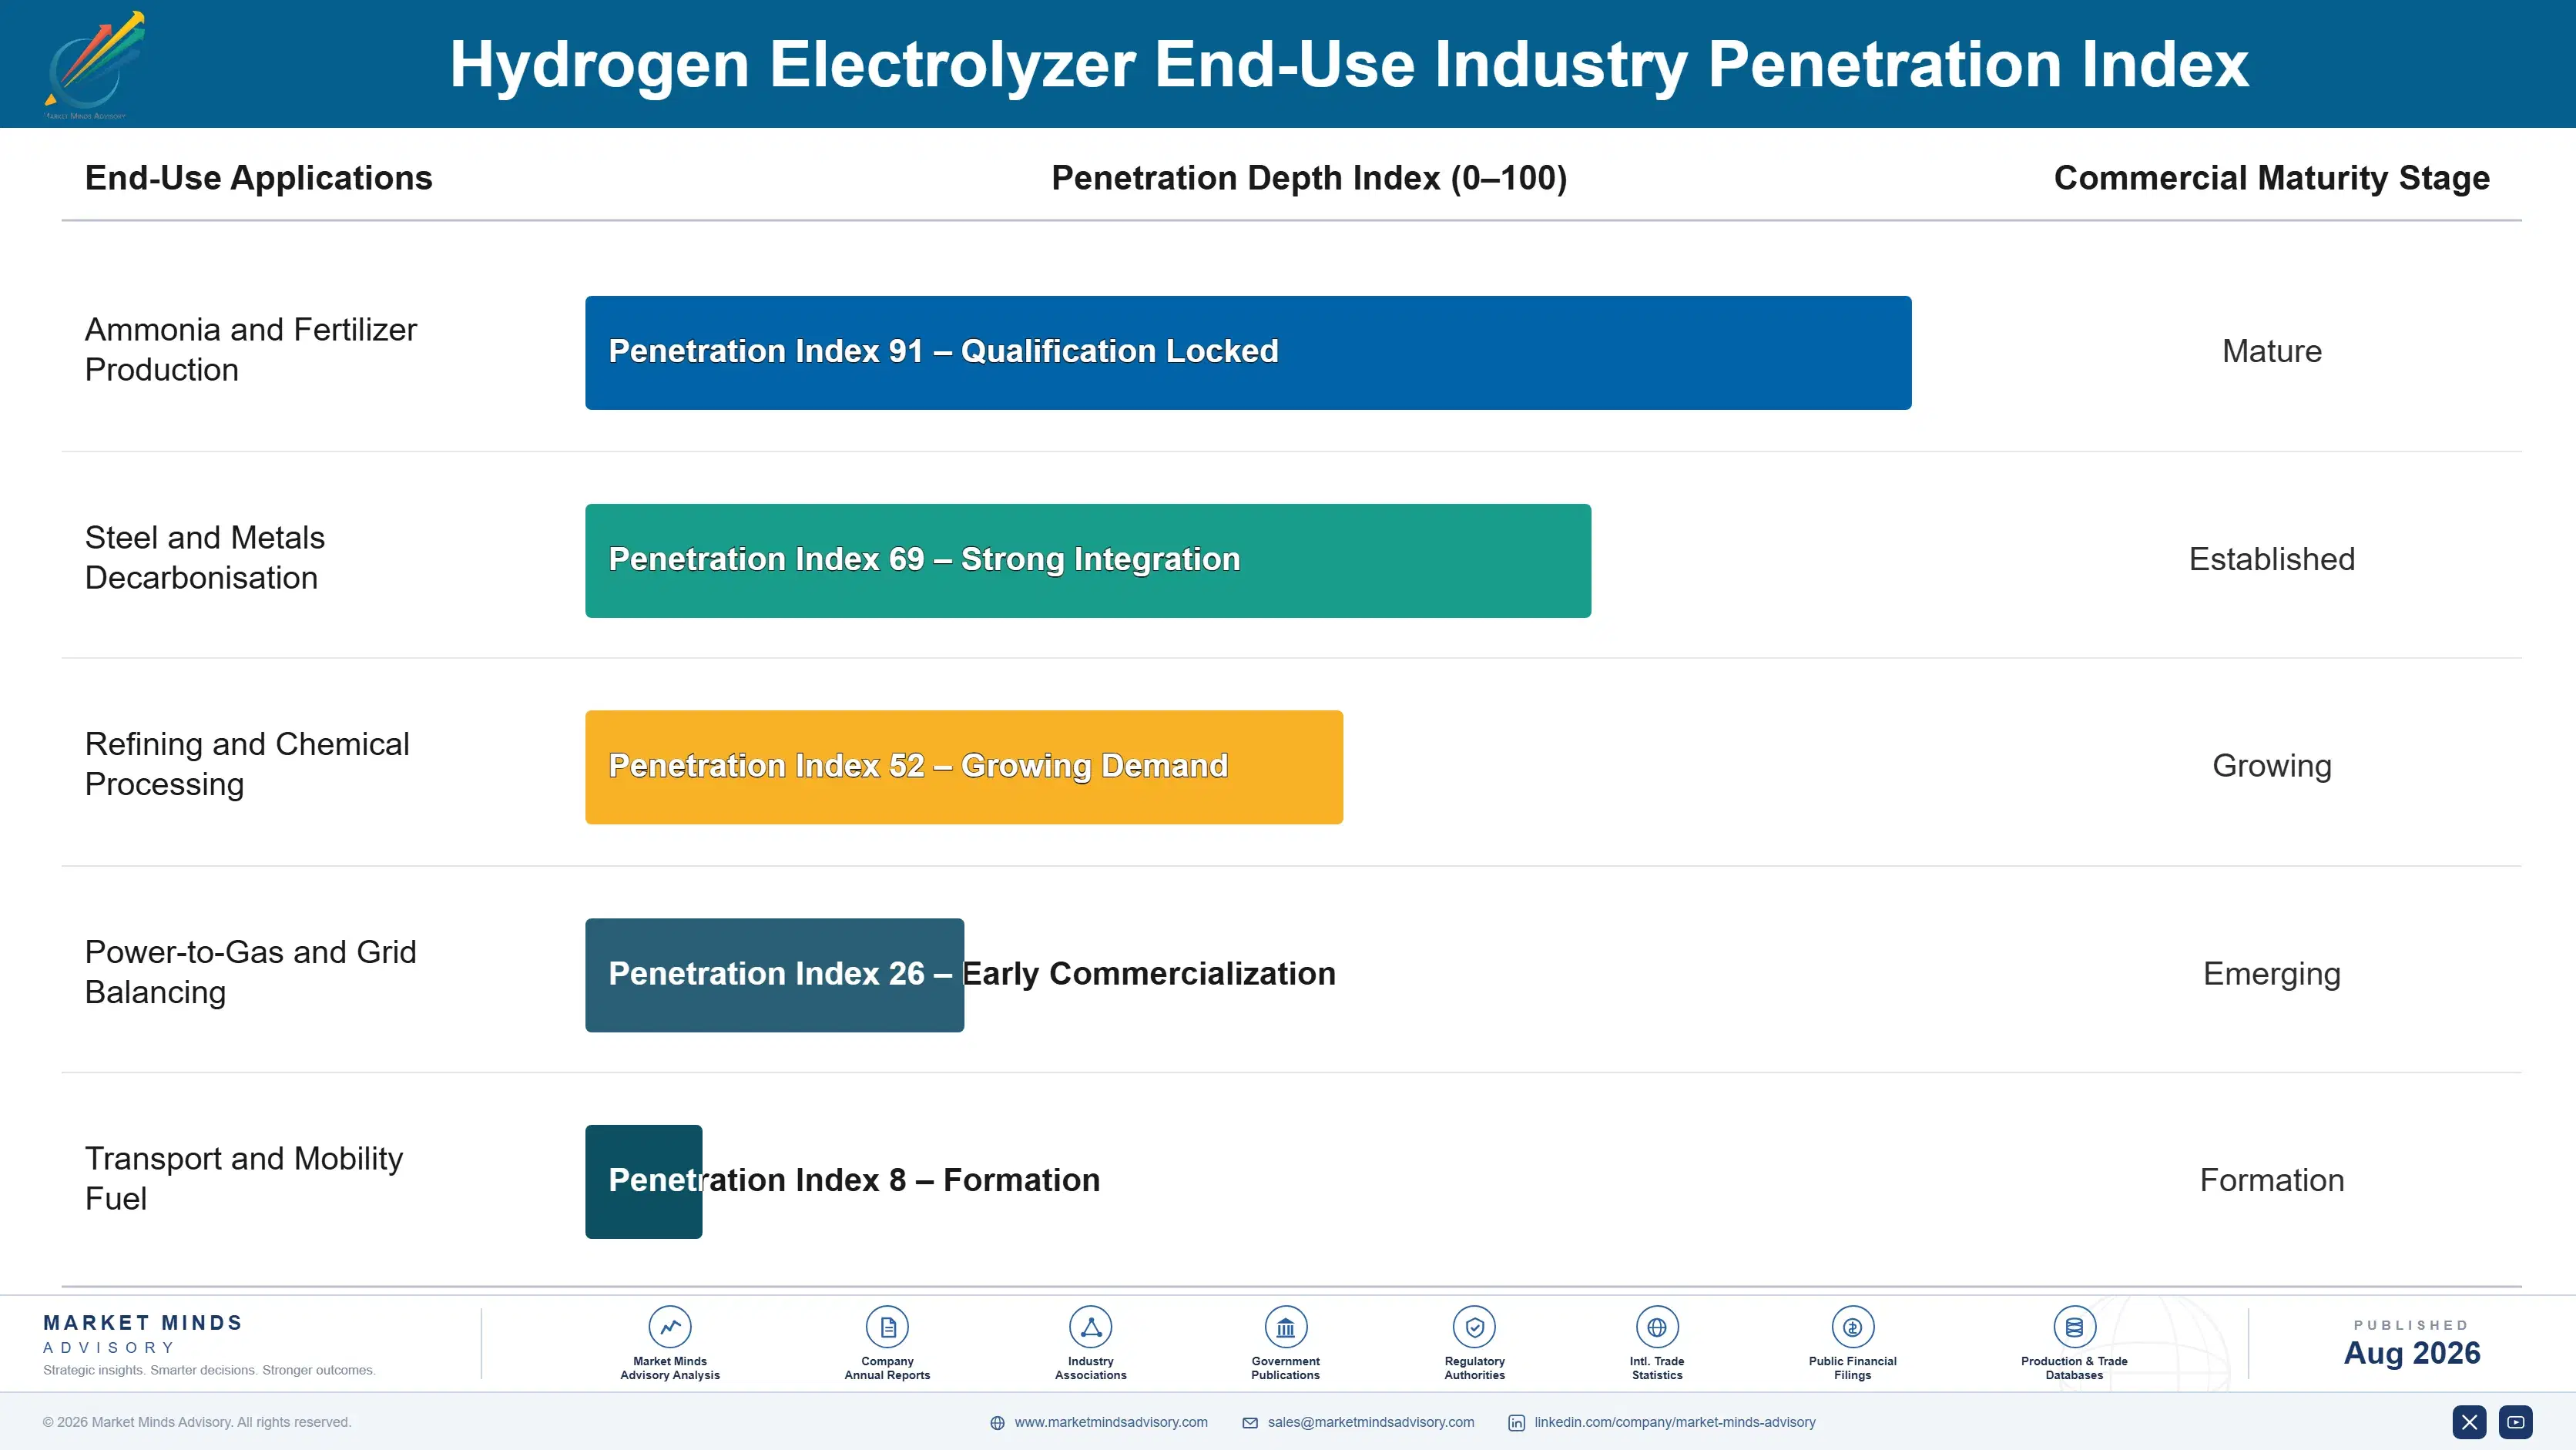
How Electrolyzer Orders Actually Convert

Revenue depends on projects reaching final investment decision rather than on announced pipeline alone, and a manufacturer's real order book bears little resemblance to the gigawatt figures conference presentations display publicly each year. A manufacturer winning a bankable project captures equipment revenue plus years of aftermarket service and stack replacement, while a stalled project generates nothing regardless of how prominently it was originally announced.
Adoption depth varies sharply by buyer sophistication. Industrial buyers with existing decarbonisation mandates and carbon pricing exposure convert to funded projects fastest, since the economics already favour action regardless of subsidy timing. Utility and grid-scale buyers follow with a meaningful lag as offtake agreements prove harder to structure. Speculative export-oriented megaprojects convert slowest, since they depend on both subsidy programmes and offtake buyers materialising simultaneously across two continents.

Buyer profiles have shifted from pure equipment procurement toward project development partnerships where manufacturers increasingly provide financing support and offtake structuring alongside the equipment itself entirely. Younger project development teams increasingly treat bankability documentation as a purchase criterion equal to technical specification, which favours manufacturers with genuine track record over newer entrants without one.
hydrogen-electrolyzer-market-end-use-penetration-index-1787324751135

Our Read On Hydrogen Electrolyzers

These are among the four positions where our research anticipates prominent divergence between winners and laggards over the coming forecast period. Each is grounded in the demand model, the regulatory perimeter, and the announced capacity pipeline.
01 / BANKABILITY BEATS PIPELINE SIZE

The gigawatt chart matters less than final investment decisions

Only about 30% of announced project pipeline reaches final investment decision, and lenders increasingly demand manufacturers demonstrate track record, warranty terms, and performance guarantees before financing proceeds on reasonable terms anywhere in the world today. Manufacturers who package documented performance data and financing partnerships alongside the equipment itself capture design-in relationships pure hardware sellers never access at all in this crowded field. Buyers should evaluate manufacturers on bankable order book depth, not announced pipeline size, when assessing genuine commercial position.
02 / SUBSIDIES CONVERT PIPELINE

Auction rounds and tax credits are the real demand engine

The American clean hydrogen production tax credit and the European Union's hydrogen bank auction mechanism both provide per-kilogram subsidies substantial enough to close the cost gap against grey hydrogen in most markets tracked here today across the industry. Every successful auction round converts a portion of announced pipeline into contractually committed, bankable projects that can secure project financing on reasonable terms from lenders. Manufacturers should track subsidy programme timelines as closely as they track technology roadmaps, since funding timing determines order flow.
03 / CHINESE SCALE RESHAPES PRICING

Western manufacturers cannot win on alkaline cost alone

LONGi Hydrogen, Sungrow Hydrogen, and PERIC have scaled alkaline and PEM stack manufacturing capacity at prices reportedly 30% to 50% below comparable Western equipment, applying manufacturing scale built across adjacent solar and battery industries to this newer product category entirely and effectively. Western manufacturers now compete primarily on subsidy-protected domestic content requirements rather than on cost, since open competition increasingly favours Chinese suppliers on price alone. Differentiation through technology and bankability, not price, is the only viable Western strategy remaining today.
04 / STACK COST BLOCKS PARITY

Green hydrogen remains more expensive than grey almost everywhere

Electrolyzer stack cost, particularly for PEM systems using platinum group metal catalysts, remains high enough that green hydrogen production cost exceeds grey hydrogen even after available subsidy in most markets currently tracked across the industry. Manufacturing scale has not yet reached the volume needed to drive component costs down the learning curve that solar and battery manufacturing achieved previously over time. Buyers should expect the cost gap to persist for years, narrowing gradually rather than closing suddenly through any single breakthrough.

Engagement Snapshot From the Field

A live engagement with an industry participant carrying material or product regulatory and market exposure ahead of a defining policy shift, showing how our research translates into a defensible multi-year portfolio strategy.
MARKET MINDS ADVISORY · CLIENT ENGAGEMENT SUMMARY
Hydrogen Electrolyzer Producer Strategic Portfolio Review and Transition Roadmap 2026·Investment Scenario on Hydrogen Electrolyzer Exposure Evaluation 2025-26
CLIENT PROFILE
An independent electrolyzer manufacturer selling conventional alkaline systems engaged MMA as Chinese import competition began eroding its core market meaningfully within its primary region. The client reported annual revenue near USD 180 million, with roughly 88% tied to alkaline systems and no PEM or solid oxide product in its current portfolio (client-reported, unverified by MMA).
STRATEGIC CHALLENGE
Commercial leadership wanted to cut alkaline pricing to match Chinese competitors, a strategy that would have compressed already thin margins further without addressing the underlying cost structure disadvantage the business faced. Engineering leadership argued for PEM development instead but lacked a clear business case quantifying the investment against realistic near-term revenue expectations.
MMA APPROACH
MMA modelled margin outcomes under continued price-matching against Chinese imports versus redirecting capital toward PEM development and domestic content qualification instead of matching price. We assessed which specific customer segments carried genuine willingness to pay a technology premium, and we quantified the qualification timeline and cost for domestic content subsidy eligibility specifically.
KEY FINDINGS
  1. Continued price-matching against Chinese imports carried an estimated 22% margin compression within just two years as competitors kept undercutting further and further.
  2. Developing a validated PEM product line required roughly sixteen months and USD 12 million in dedicated engineering investment (client-reported, unverified by MMA).
  3. Renewable-coupled project developers represented an addressable segment willing to pay a genuine 40% to 60% premium for PEM dynamic response capability alone.
  4. Domestic content qualification would secure subsidy-protected pricing worth an estimated USD 30 million in annual addressable revenue within just three years total.
CLIENT PROFILE
An independent electrolyzer manufacturer selling conventional alkaline systems engaged MMA as Chinese import competition began eroding its core market meaningfully within its primary region. The client reported annual revenue near USD 180 million, with roughly 88% tied to alkaline systems and no PEM or solid oxide product in its current portfolio (client-reported, unverified by MMA).
STRATEGIC CHALLENGE
Commercial leadership wanted to cut alkaline pricing to match Chinese competitors, a strategy that would have compressed already thin margins further without addressing the underlying cost structure disadvantage the business faced. Engineering leadership argued for PEM development instead but lacked a clear business case quantifying the investment against realistic near-term revenue expectations.
MMA APPROACH
MMA modelled margin outcomes under continued price-matching against Chinese imports versus redirecting capital toward PEM development and domestic content qualification instead of matching price. We assessed which specific customer segments carried genuine willingness to pay a technology premium, and we quantified the qualification timeline and cost for domestic content subsidy eligibility specifically.
KEY FINDINGS
  1. Continued price-matching against Chinese imports carried an estimated 22% margin compression within just two years as competitors kept undercutting further and further.
  2. Developing a validated PEM product line required roughly sixteen months and USD 12 million in dedicated engineering investment (client-reported, unverified by MMA).
  3. Renewable-coupled project developers represented an addressable segment willing to pay a genuine 40% to 60% premium for PEM dynamic response capability alone.
  4. Domestic content qualification would secure subsidy-protected pricing worth an estimated USD 30 million in annual addressable revenue within just three years total.
RECOMMENDED STRATEGY
Phase 1: Phase 1 (0 to 4 months): Halt price-matching against Chinese imports and redirect capital toward PEM development work immediately company-wide. Phase 2: Phase 2 (4 to 16 months): Complete PEM validation and pursue domestic content subsidy qualification in parallel with product development. Phase 3: Phase 3 (16 to 24 months): Launch the PEM product line targeting renewable-coupled developers willing to pay the technology premium.
OUTCOME
The client abandoned price-matching and launched a validated PEM product line instead, securing renewable-coupled project orders at pricing roughly 45% above its legacy alkaline systems within the first year. Domestic content qualification secured subsidy-protected pricing the board judged decisive for long-term viability (client-reported, unverified by MMA).

Frequently Asked Questions

Foundational context covering the market sizes, CAGR, scope, country, region and competition that inform every finding below. This section is provided to cover basics and most often pre-purchase conversations, answered from the MMA Primary Research Dataset.

What is the current size of the Hydrogen Electrolyzer Market?

The global hydrogen electrolyzer market is valued at USD 3.8 billion in 2025, covering alkaline, PEM, solid oxide, and AEM stack and system equipment sold to project developers. Downstream hydrogen applications are excluded.

How large will the Hydrogen Electrolyzer Market be by 2036?

The market is forecast to reach USD 12.59 billion by 2036 in the base case, about 2.97 times the 2026 level. That represents incremental value of roughly USD 8.35 billion across the decade.

What is the CAGR for the Hydrogen Electrolyzer Market 2026 to 2036?

The market grows at a 11.5% CAGR in the base case, with bull and bear scenarios at 12.8% and 10.2%. The spread turns mainly on subsidy programme continuation and stack cost reduction pace.

Which segment is growing fastest?

PEM electrolyzers grow fastest at 16.2%, about 1.41 times the overall rate, as renewable-coupled projects favour dynamic response alkaline technology cannot match. Solid oxide follows at 14.8%.

Who are the major companies in the Hydrogen Electrolyzer Market?

Leading companies include Nel Hydrogen, thyssenkrupp nucera, Plug Power, ITM Power, and Cummins (Accelera). Concentration is low, with the top five holding roughly 38% of revenue across a crowded field.

Which country is growing fastest?

India grows fastest at a 19.4% CAGR off a small base, driven by its National Green Hydrogen Mission subsidy programme. China remains the largest producer on manufacturing scale.

Report Segmentation Architecture

The full report scope spans multiple orthogonal segmentation dimensions, with cross-tabulated demand data provided for each dimension pair. Coverage extends further to regional breakdowns, trend trajectories, and the competitive detail needed to support segment-level decision-making.

By Electrolysis Technology

  • PEM Electrolyzers
  • Solid Oxide Electrolyzers (SOEC)
  • Anion Exchange Membrane (AEM) Electrolyzers
  • Advanced Zero-Gap Alkaline Electrolyzers
  • Conventional Alkaline Electrolyzers

By End-Use Industry

  • Ammonia and Fertilizer Production
  • Steel and Metals Decarbonisation
  • Refining and Chemical Processing
  • Power-to-Gas and Grid Balancing
  • Transport and Mobility Fuel

By Commercial Dimension

  • Utility and Grid-Scale Projects
  • Industrial Offtake-Backed Projects
  • Export-Oriented Megaprojects
  • Distributed and Modular Systems

By Region

  • North America
  • Western Europe
  • East Asia
  • South Asia and Pacific
  • Latin America
  • Middle East and Africa
  • Eastern Europe

Scope, Methodology, and Coverage

Every figure in this report is reproducible from documented input assumptions. The scope below maps the historical period, the forecast horizon, the segmentation dimensions, and the countries covered, alongside the underlying primary and qualitative methodology.
Historical Period
2020 to 2025
Forecast Period
2026 to 2036
Base Year
2025 (USD billions; MMA Primary Research Dataset, August 2026)
Market Definition
The hydrogen electrolyzer market comprises stack and system equipment that splits water into hydrogen and oxygen using electrical current, valued at manufacturer net revenue. It spans alkaline, proton exchange membrane, solid oxide, and anion exchange membrane technologies sold to industrial, utility, and project developer buyers across ammonia, steel, refining, and power-to-gas applications. Hydrogen storage, transport infrastructure, fuel cells, and downstream hydrogen offtake applications sold separately from the electrolyzer equipment itself are excluded.
Quantitative Units
USD billions (current prices); installed capacity in megawatts where applicable
Segmentation Dimensions
By Electrolysis Technology; By End-Use Industry; By Commercial Dimension; By Region
Regions Covered
North America, Western Europe, East Asia, South Asia and Pacific, Latin America, Middle East and Africa, Eastern Europe
Countries Covered
USA, China, Germany, France, UK, Japan, South Korea, India, Australia, Canada, Brazil, Mexico, Indonesia, Vietnam, Thailand, Malaysia, UAE, Saudi Arabia, South Africa, Nigeria, Turkey, Poland, Netherlands, Italy, Spain, Sweden, Switzerland, Argentina, Colombia, Singapore, and additional markets relevant to this sector
Key Companies Profiled
Nel Hydrogen, thyssenkrupp nucera, Plug Power, ITM Power, Cummins (Accelera), McPhy Energy, Sunfire, Enapter, John Cockerill, LONGi Hydrogen, Sungrow Hydrogen, PERIC Hydrogen Equipment, CIMC Enric, Elogen, HydrogenPro, Hoeller Electrolyzer, Green Hydrogen Systems, Erre Due, Ohmium International, H-TEC Systems
Quantitative Methodology
Primary survey, n=3,800 respondents, Q4 2025, six countries; demand-side model with trade association cross-validation
Qualitative Methodology
47 expert interviews, Q4 2025; applied to validate demand model assumptions, identify emerging dynamics, and assess competitive positioning
Report Format
PDF and XLSX data workbook (Word format preview document)
Publisher
Market Minds Advisory
Report Code
MMA-2026-ENE-104
Published
August 2026
Contact
sales@marketmindsadvisory.com | www.marketmindsadvisory.com

Purchase the full Hydrogen Electrolyzer Market Report (2026 to 2036).

The full MMA Hydrogen Electrolyzer report sizes the market across five technologies, five end-use industries, four commercial dimensions, and seven regions through 2036 in considerable detail. It profiles 20 companies on a consistent revenue basis, scoring each on bankability documentation, domestic content eligibility, and technology differentiation. Scenario models quantify how subsidy programme timing, stack cost reduction, and offtake agreement conversion move addressable demand by technology. The report also includes platinum group metal cost benchmarking, subsidy programme timeline tracking, and pipeline-to-order conversion analysis for manufacturers and project developers.
Five-technology and four-channel market sizing to 2036
Twenty-company benchmark on consistent manufacturer revenue basis
Subsidy programme timeline tracking across major regulated markets
Platinum group metal cost benchmarking against volatility events
Pipeline-to-order conversion analysis by region and buyer type
Domestic content eligibility assessment for manufacturer sourcing strategy

Built For The People Who Decide

From boardroom strategy to bench-side execution, this report is read cover-to-cover by leaders shaping the next decade of their industry, turning demand scenarios, market dynamics and valuation benchmarks into decisions.
CXOs/ Presidents/ VPs/ Managers
M&A and Corporate Development
Strategy Teams and R&D Heads
Procurement and Product Directors
Regulatory and Compliance Leaders
Investor Relations and Equity Analysts