Market Minds Advisory
Direct Drive Wind Turbine Market

Direct Drive Wind Turbine Market: Offshore Scale-Up and the Gearless Reliability Premium

Offshore wind developers are pushing turbine capacity past 10 megawatts faster than supply chains can qualify components, favoring gearless drivetrains for lower maintenance burden, while magnet sourcing and crane vessel scarcity increasingly gate delivery schedules.

Lead Analyst

David Horsley

Published

September 2026

Make Smarter Decisions with Customized Research Insights

Request a free sample report and evaluate market opportunities, growth trends, and competitive dynamics relevant to your business needs.

2025 MARKET VALUE$19.5BMarket Size 2025
2036 FORECAST VALUE$47.8BBase Case , 2026 to 2036
CAGR 2026 TO 20368.5 %Bull 9.8% / Bear 7.2%
INCREMENTAL OPPORTUNITY$26.7BNet 10- year value creation
EXPANSION MULTIPLE2.26x2036 value over 2026 base
Strategic Levers
M&A Pipeline
Regional Outlook
Country Rankings
Competitive Intelligence
Segmental Deep-dive
Call-Us : 91 93563 13602

Executive Snapshot and Market Trajectory

Direct drive has moved from a niche reliability play to the default drivetrain choice for offshore wind. Developers now weigh lifetime maintenance cost, not just upfront turbine price, and gearless designs increasingly win contracts specifically because offshore crane vessel access for a gearbox swap is scarce and enormously expensive.
Turbines rated above 10 megawatts are growing at roughly 1.8x the market average as offshore developers chase larger rotor swept areas to improve project economics per installed foundation. East Asia has extended its lead in both manufacturing and installed capacity, anchored by China's aggressive offshore buildout and a deep domestic supply chain, while European and North American developers work to secure component allocation against a backlog that now stretches years for the largest turbine classes.
Competitive intensity concentrates among five diversified turbine manufacturers that increasingly bundle direct drive hardware with long-term service agreements and predictive maintenance software, leaving smaller regional builders to compete on price in the onshore mid-capacity segment. Permanent magnet supply security and nacelle logistics, not generator efficiency alone, determine which suppliers win the largest offshore contracts. Insurers are beginning to price offshore risk premiums around drivetrain choice.
Market Definition
The direct drive wind turbine market covers gearless wind turbine systems in which the rotor connects directly to a low-speed generator without an intermediate gearbox, spanning permanent magnet and electrically excited synchronous generator designs across onshore and offshore applications. It includes new turbine sales, repowering kits, and directly bundled long-term service contracts. Geared and hybrid drivetrain turbines, along with standalone balance-of-plant equipment sold apart from the turbine, are excluded.
Base Year Value
$19.5B in 2025 (MMA Primary Research Dataset, August 2026)
Forecast Period
2026 to 2036, eleven discrete annual values
CAGR
8.5% base case. Bull 9.8%. Bear 7.2%.
Fastest Growth Segment
>10 MW Direct Drive Turbines: 15.5% CAGR
Fastest Growth Country
China: 13.5% CAGR
Fastest Growth Region
South Asia and Pacific: 10.6% CAGR
Largest Region
East Asia: 30% of 2025 global value
Market Leaders
Siemens Gamesa Renewable Energy, Goldwind, Enercon GmbH, Envision Energy, MingYang Smart Energy. Source: MMA Analysis based on company annual reports.
Primary Survey
n=3,800 procurement and R&D decision-makers, Q4 2025, six countries
Methodology
Demand-side build-up, cross-validated against public data, 47 expert interviews

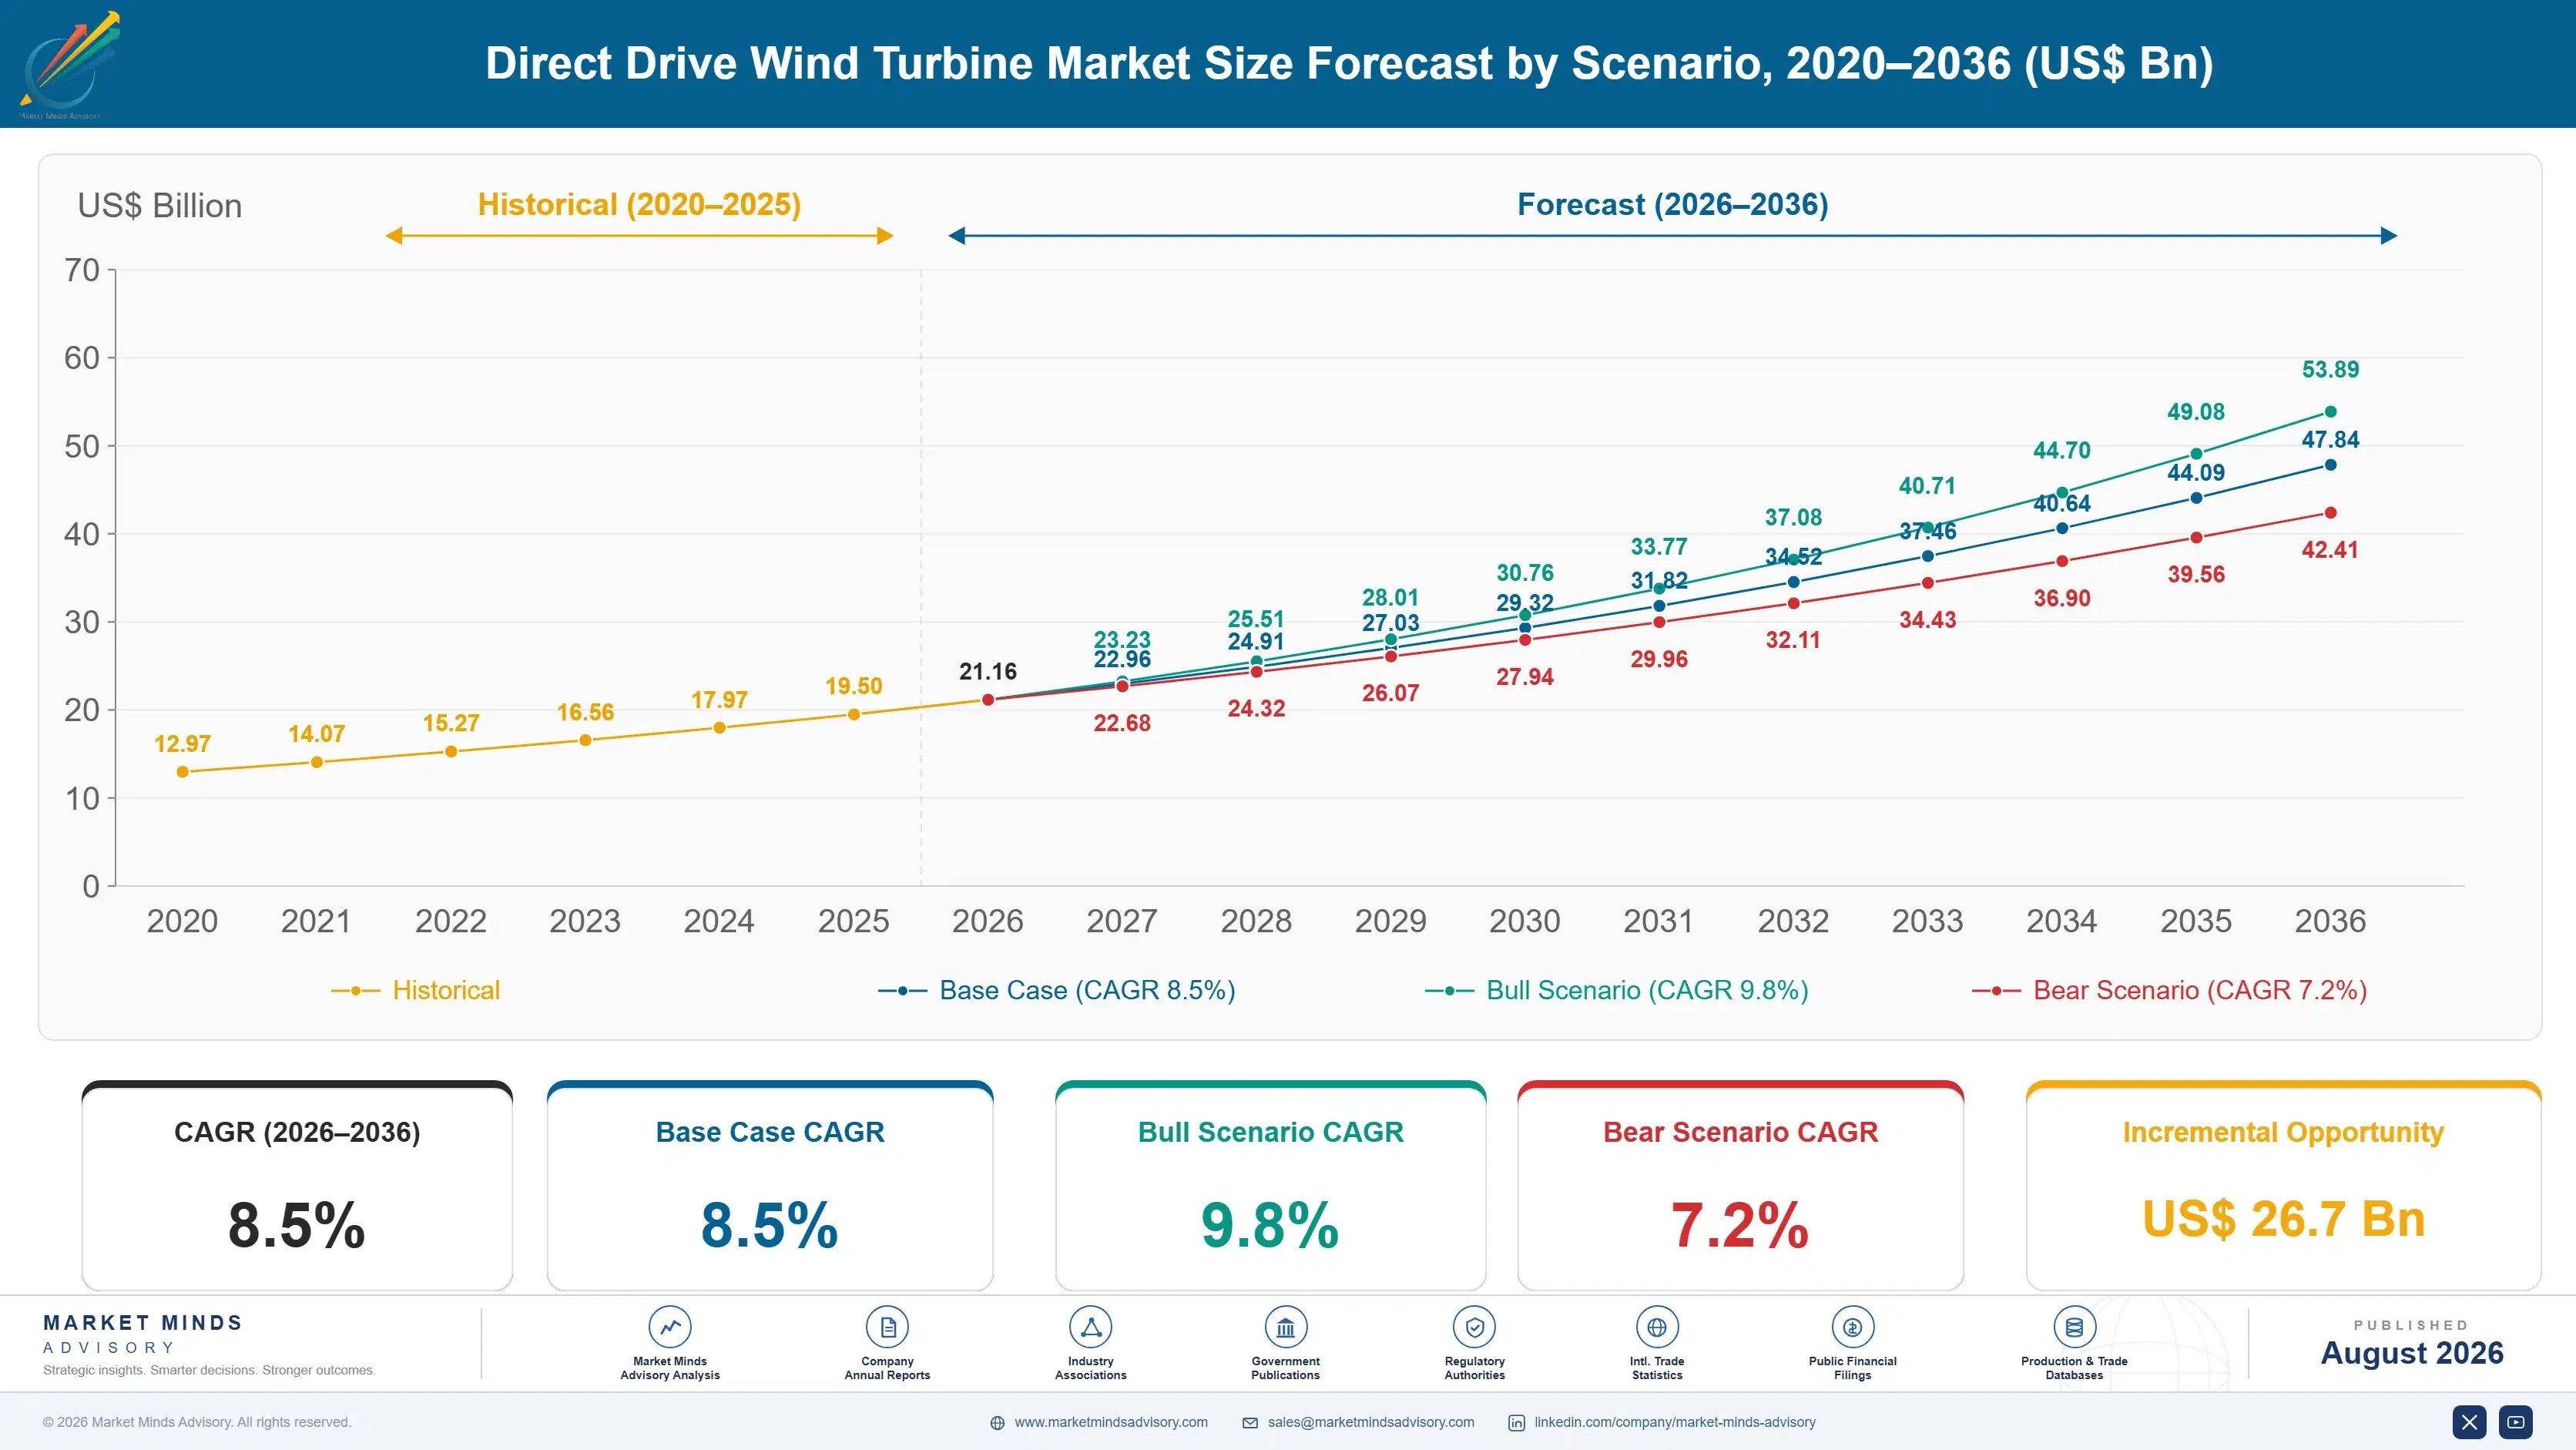
Direct Drive Wind Turbine Market Forecast Scenarios

direct-drive-wind-turbine-market-size-forecast-scenario-1787302241049
Between 2020 and 2025 the market expanded at an estimated 7.5% historical CAGR, growing steadily on onshore direct drive adoption before accelerating from 2023 onward as offshore wind capacity additions in China and Europe scaled faster than prior industry roadmaps anticipated. Early offshore projects favored direct drive specifically to reduce the operating cost burden of servicing gearboxes at sea, a lesson the sector learned expensively during earlier geared offshore deployments.
The base case assumes 8.5% CAGR through 2036, resting on three mechanisms: offshore turbine capacity climbing past 10 megawatts as developers chase larger rotor swept area per foundation, onshore repowering programmes replacing aging geared fleets with gearless designs to cut maintenance cost, and emerging offshore markets in Asia Pacific and North America adding first-time capacity as permitting regimes mature. Magnet supply chain localization adds a reinforcing tailwind as manufacturers reduce sourcing dependency.
A bull scenario, near 9.8% CAGR, assumes faster offshore permitting in the United States and accelerated Southeast Asian wind auctions pull capacity additions forward. The bear case, near 7.2% CAGR, assumes rising interest rates and permanent magnet material costs slow project financing, pushing some developers to delay final investment decisions on the largest offshore turbine orders.

Offshore Scale Race Redefines Drivetrain Economics

Three forces are converging on direct drive demand simultaneously: an offshore capacity race that rewards whichever developer secures the largest available turbine class first, a parallel onshore repowering wave replacing aging geared fleets nearing end of service life, and a permanent magnet supply chain racing to keep pace with generator production as turbine ratings keep climbing. Developers increasingly negotiate turbine allocation years before a project reaches final investment decision, tr
MARKET CONCENTRATION64%Combined revenue share held by top five manufacturers
OFFSHORE TURBINE ASP$11.2MBlended selling price for a standard offshore direct drive unit
ORDER-TO-DELIVERY LEAD TIME24-36 moTypical wait between firm order and turbine commissioning
FLEET AVAILABILITY RATE97.2%Share of installed turbine hours available for generation
TOP MANUFACTURING COUNTRYChinaLeading country for finished direct drive turbine assembly volume
MAGNET COST SHARE18%Permanent magnet material as portion of generator manufacturing cost
Commercially, the category increasingly resembles a long-term service relationship bundled around the turbine sale rather than a pure hardware transaction. Developers commit to multi-year service agreements covering predictive maintenance, availability guarantees, and performance monitoring alongside the initial turbine purchase, since offshore access constraints make reactive maintenance dramatically more expensive than for onshore fleets serviced by road-accessible crews.
Over the next decade, expect direct drive to keep gaining share against geared designs at the largest offshore capacity classes, continued consolidation among smaller manufacturers unable to fund permanent magnet supply security programmes, and growing scrutiny of rare earth material sourcing as governments tie renewable subsidy eligibility to domestic or allied supply chain content requirements.
"Everyone still asks about levelized cost of energy per megawatt. Offshore developers increasingly care more about how many helicopter trips a turbine needs per year, because that number is what actually breaks a project's return model."
Director, Renewable Energy Equipment Practice · MMA Renewable Energy Generation

Market Trends

Offshore Turbines Push Past 10 Megawatts Rated Capacity

Leading offshore wind developers are increasingly specifying turbines rated above 10 megawatts to maximize energy capture per installed foundation, a shift that favors direct drive designs since larger rotor diameters amplify the maintenance cost penalty of a failed gearbox at sea. Each new turbine generation requires larger permanent magnet generators, larger blades, and specialized installation vessels capable of handling taller, heavier nacelles than the prior class could accommodate. Manufacturers report order backlogs for the largest turbine classes now extending several years, and developers increasingly negotiate allocation priority through long-term framework agreements rather than single-project purchase orders.
Market Impact: Adds 42 GW auctioned capacity yearl
Onshore Repowering Accelerates Gearless Fleet Replacement

Wind farm operators across mature onshore markets are increasingly repowering aging geared turbine fleets reaching the end of their original service life with direct drive replacements, drawn by the lower long-term maintenance burden gearless designs offer over a comparable operating horizon. Each repowering project typically replaces multiple older turbines with fewer, larger direct drive units on the same or expanded footprint, improving both energy yield and site-level maintenance economics simultaneously. Operators completing early repowering projects report reduced unplanned downtime hours compared to the retired fleet, reinforcing repowering as a standard renewal strategy across mature onshore wind portfolios.
Market Impact: Cuts offshore corrective maintenanc

Market Opportunities and Growth Drivers

Global Offshore Wind Capacity Auctions Expand Addressable Demand

Government-run offshore wind capacity auctions across China, the European Union, and emerging markets including South Korea and Vietnam are expanding the addressable base for direct drive turbines well beyond the mature North Sea and Chinese coastal markets that historically dominated offshore demand. Each successful auction round typically commits gigawatts of capacity to firm delivery timelines spanning years, giving manufacturers forward visibility supporting capital investment in expanded production capacity. Manufacturers with established offshore records are capturing outsized share, since developers in emerging markets prefer suppliers with proven data over unproven entrants regardless of pricing.
Market Impact: Raises generator cost exposure 22%

Rising Offshore Maintenance Cost Favors Gearless Reliability

The extraordinary cost of offshore corrective maintenance, often requiring specialized vessels and favorable weather windows that can delay a repair by weeks, is pushing developers to place a growing value premium on drivetrain reliability rather than upfront turbine price alone. Direct drive designs eliminate the gearbox, historically among the highest-failure-rate components in a wind turbine drivetrain, removing an entire category of offshore corrective maintenance risk from the operating model. Developers modeling total lifetime cost increasingly find direct drive turbines favorable despite a higher upfront price, once offshore access cost and downtime risk are weighted across a twenty-five-year operating horizon.
Market Impact: Delays installs 8 to 12 months

Market Restraints and Challenges

Rare Earth Permanent Magnet Supply Concentration Creates Risk

Permanent magnet direct drive generators depend on rare earth materials, primarily neodymium and dysprosium, whose refining and magnet manufacturing capacity remains heavily concentrated in a small number of facilities, and the root cause is that alternative refining capacity outside this concentrated base has taken many years to develop at meaningful scale. The commercial impact falls hardest on manufacturers without long-term supply agreements, since spot rare earth prices swing sharply during export policy tightening or demand surges from competing industries such as electric vehicles. Manufacturers are mitigating this by qualifying electrically excited designs avoiding magnets.
Market Impact: Adds 15.5% CAGR to over-10MW segmen

Installation Vessel Scarcity Delays Offshore Project Timelines

The specialized heavy-lift installation vessels required to erect the largest offshore turbines remain in short supply relative to the pipeline of announced projects, and the root cause is that building a new jack-up installation vessel capable of handling next-generation turbine classes requires years of shipyard lead time and substantial capital investment few operators are willing to commit without firm long-term contracts. The commercial impact falls hardest on smaller developers competing for vessel time against larger, better-capitalized programmes holding priority slots. Developers are mitigating this by booking vessel capacity years ahead of planned windows, well before final investment decision.
Market Impact: Adds 4.6 GW repowered capacity year
3 additional market trends, 3 additional growth drivers, and 2 additional restraints and challenges are covered in the full report. Contact sales@marketmindsadvisory.com to access the complete intelligence.

Segment CAGR and Growth Architecture

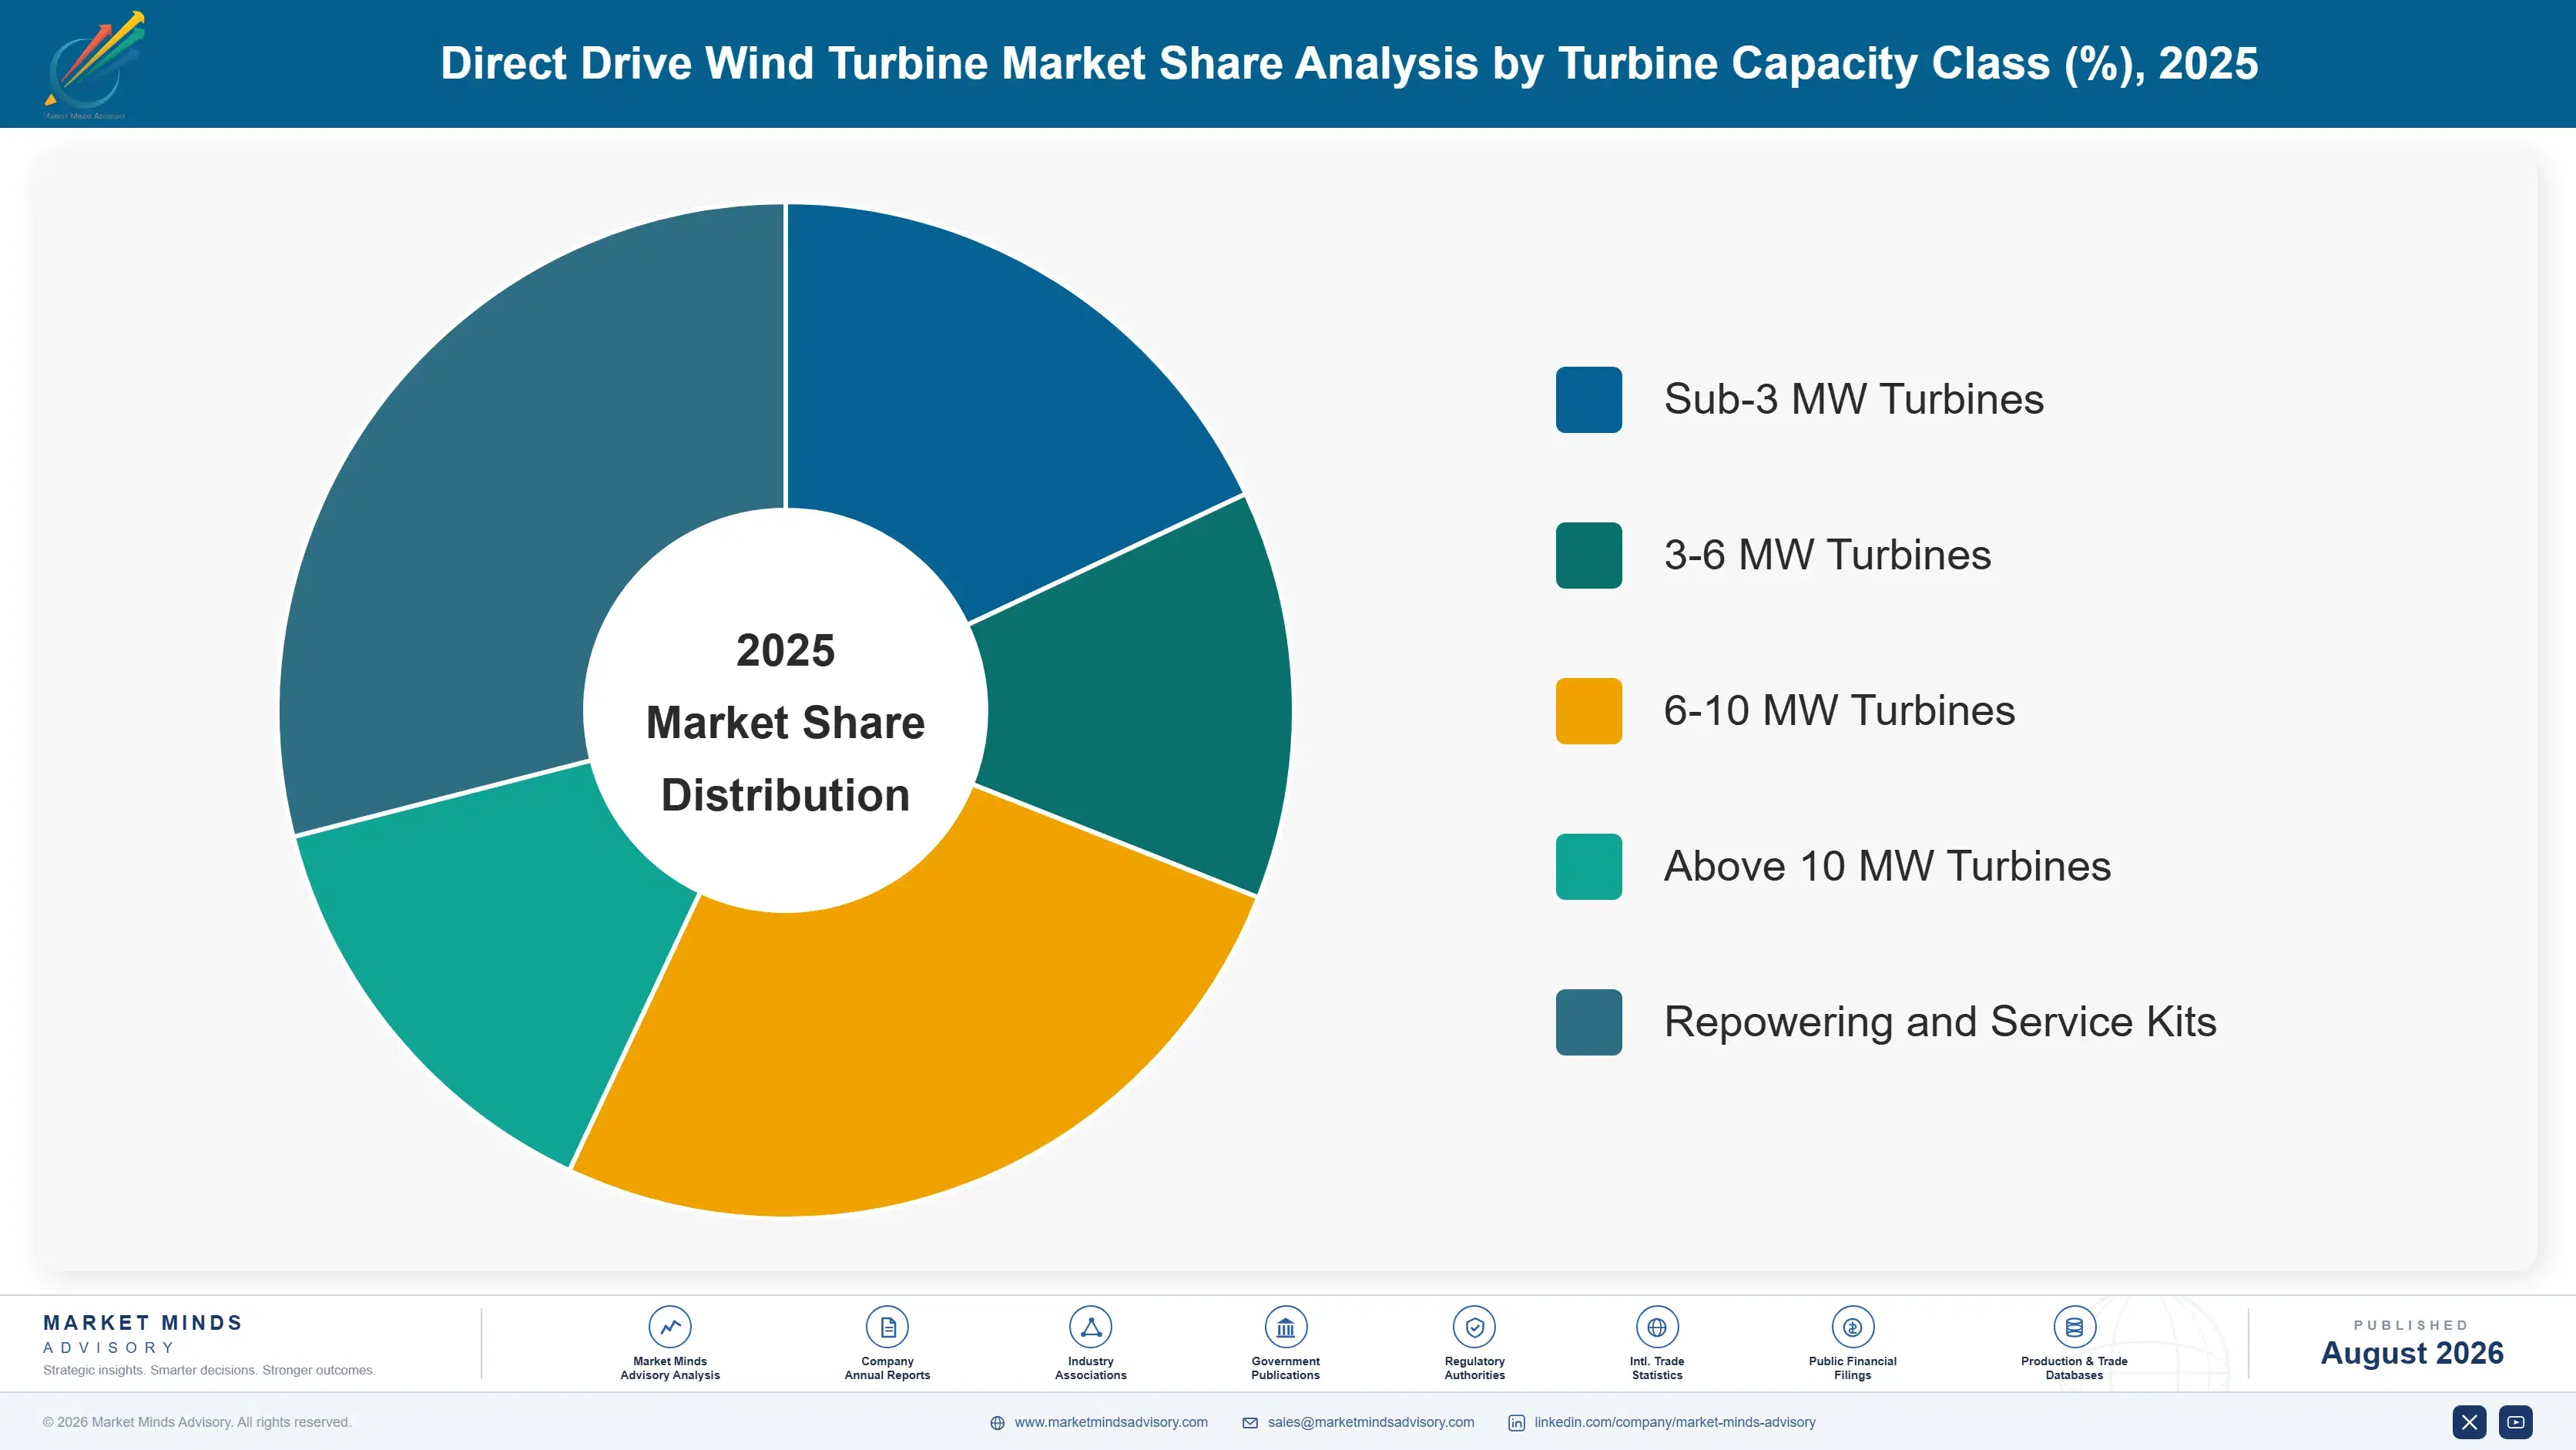
Segmentation follows turbine capacity class, the single dimension developers specify against when designing a project around foundation type, vessel availability, and grid interconnection capacity. Sub-3 megawatt, 3 to 6 megawatt, 6 to 10 megawatt, and above 10 megawatt turbines each serve a distinct project profile, with repowering kits addressing the separate fleet renewal market across every region.
direct-drive-wind-turbine-market-market-share-analysis-1787302241592

>10 MW Direct Drive Turbines

Turbines rated above 10 megawatts represent the newest and fastest-growing capacity class, purpose-built for offshore projects seeking maximum energy capture per installed foundation and per unit of scarce installation vessel time. Adoption is concentrated among the largest offshore developers with the balance sheet strength to commit to multi-year turbine framework agreements years before construction begins. Growth outpaces the broader market by roughly 1.8x as offshore auction volumes expand and existing North Sea and Chinese developers upgrade planned projects to the largest available class. Manufacturers with proven reliability data at this capacity class are capturing outsized share, since qualifying a new supplier for gigawatt-scale offshore commitments requires field validation most developers are unwilling to accept from an unproven platform.
CAGR 15.5%

6-10 MW Direct Drive Turbines

Turbines in the 6 to 10 megawatt class remain the workhorse of current offshore construction, balancing proven field reliability against the still-emerging above 10 megawatt class that carries comparatively less operating history. Adoption is concentrated among offshore developers executing projects already committed to this turbine class before the newest generation reached commercial maturity, as well as onshore projects in regions with favorable wind resources supporting larger rotor diameters. Growth remains strong even as the newest class gains share, since manufacturer production capacity for the largest turbines remains constrained relative to total offshore demand. Developers with near-term construction timelines increasingly favor this class because its supply chain and vessel compatibility carry less schedule risk than the newest, less field-proven generation.
CAGR 10.5%
Full segment breakdown across 5 segments available in the complete report.

Regional Architecture and Country Demand Map

East Asia leads on both manufacturing and installed capacity as China's aggressive offshore wind buildout and deep domestic supply chain outpace other regions, while Western Europe and North America compete for allocation against a multi-year order backlog for the largest turbine classes available on the market today.

North America

United States offshore wind development, concentrated across the Atlantic Coast, is driving growing direct drive turbine demand even as permitting timelines and evolving federal policy support introduce meaningful project schedule uncertainty for developers planning multi-year construction programmes. Canadian onshore wind development continues favoring direct drive for cold-climate reliability advantages tied to reduced gearbox lubricant maintenance requirements in extreme winter operating conditions. Domestic manufacturing incentives are encouraging some turbine assembly localization, though major generator and permanent magnet component supply chains remain concentrated overseas for now. Growth trails East Asia because the region's offshore project pipeline, while expanding, remains earlier in its construction cycle relative to China's already substantial and rapidly scaling installed base across multiple coastal provinces.
Share: 22% | CAGR: 9.2% (2026 to 2036)

Western Europe

North Sea offshore wind projects across the United Kingdom, Germany, and the Netherlands anchor regional demand, with direct drive increasingly specified as the default drivetrain for new offshore framework agreements given the region's extensive operating history with gearbox failure costs at sea. German manufacturer Enercon maintains strong domestic and regional penetration tied to decades of direct drive engineering leadership predating most competitors' entry into the technology. Onshore repowering activity across Germany and Spain continues replacing aging geared fleets reaching the end of subsidy-supported operating life. Regional growth trails the global rate as the North Sea's already mature offshore buildout limits incremental first-time installation upside relative to newer offshore markets still in earlier development phases elsewhere in the forecast.
Share: 24% | CAGR: 7.0% (2026 to 2036)
Regional intelligence for 5 additional markets available in the complete report: East Asia, South Asia and Pacific, Latin America, Middle East and Africa, Eastern Europe. Contact sales@marketmindsadvisory.com.
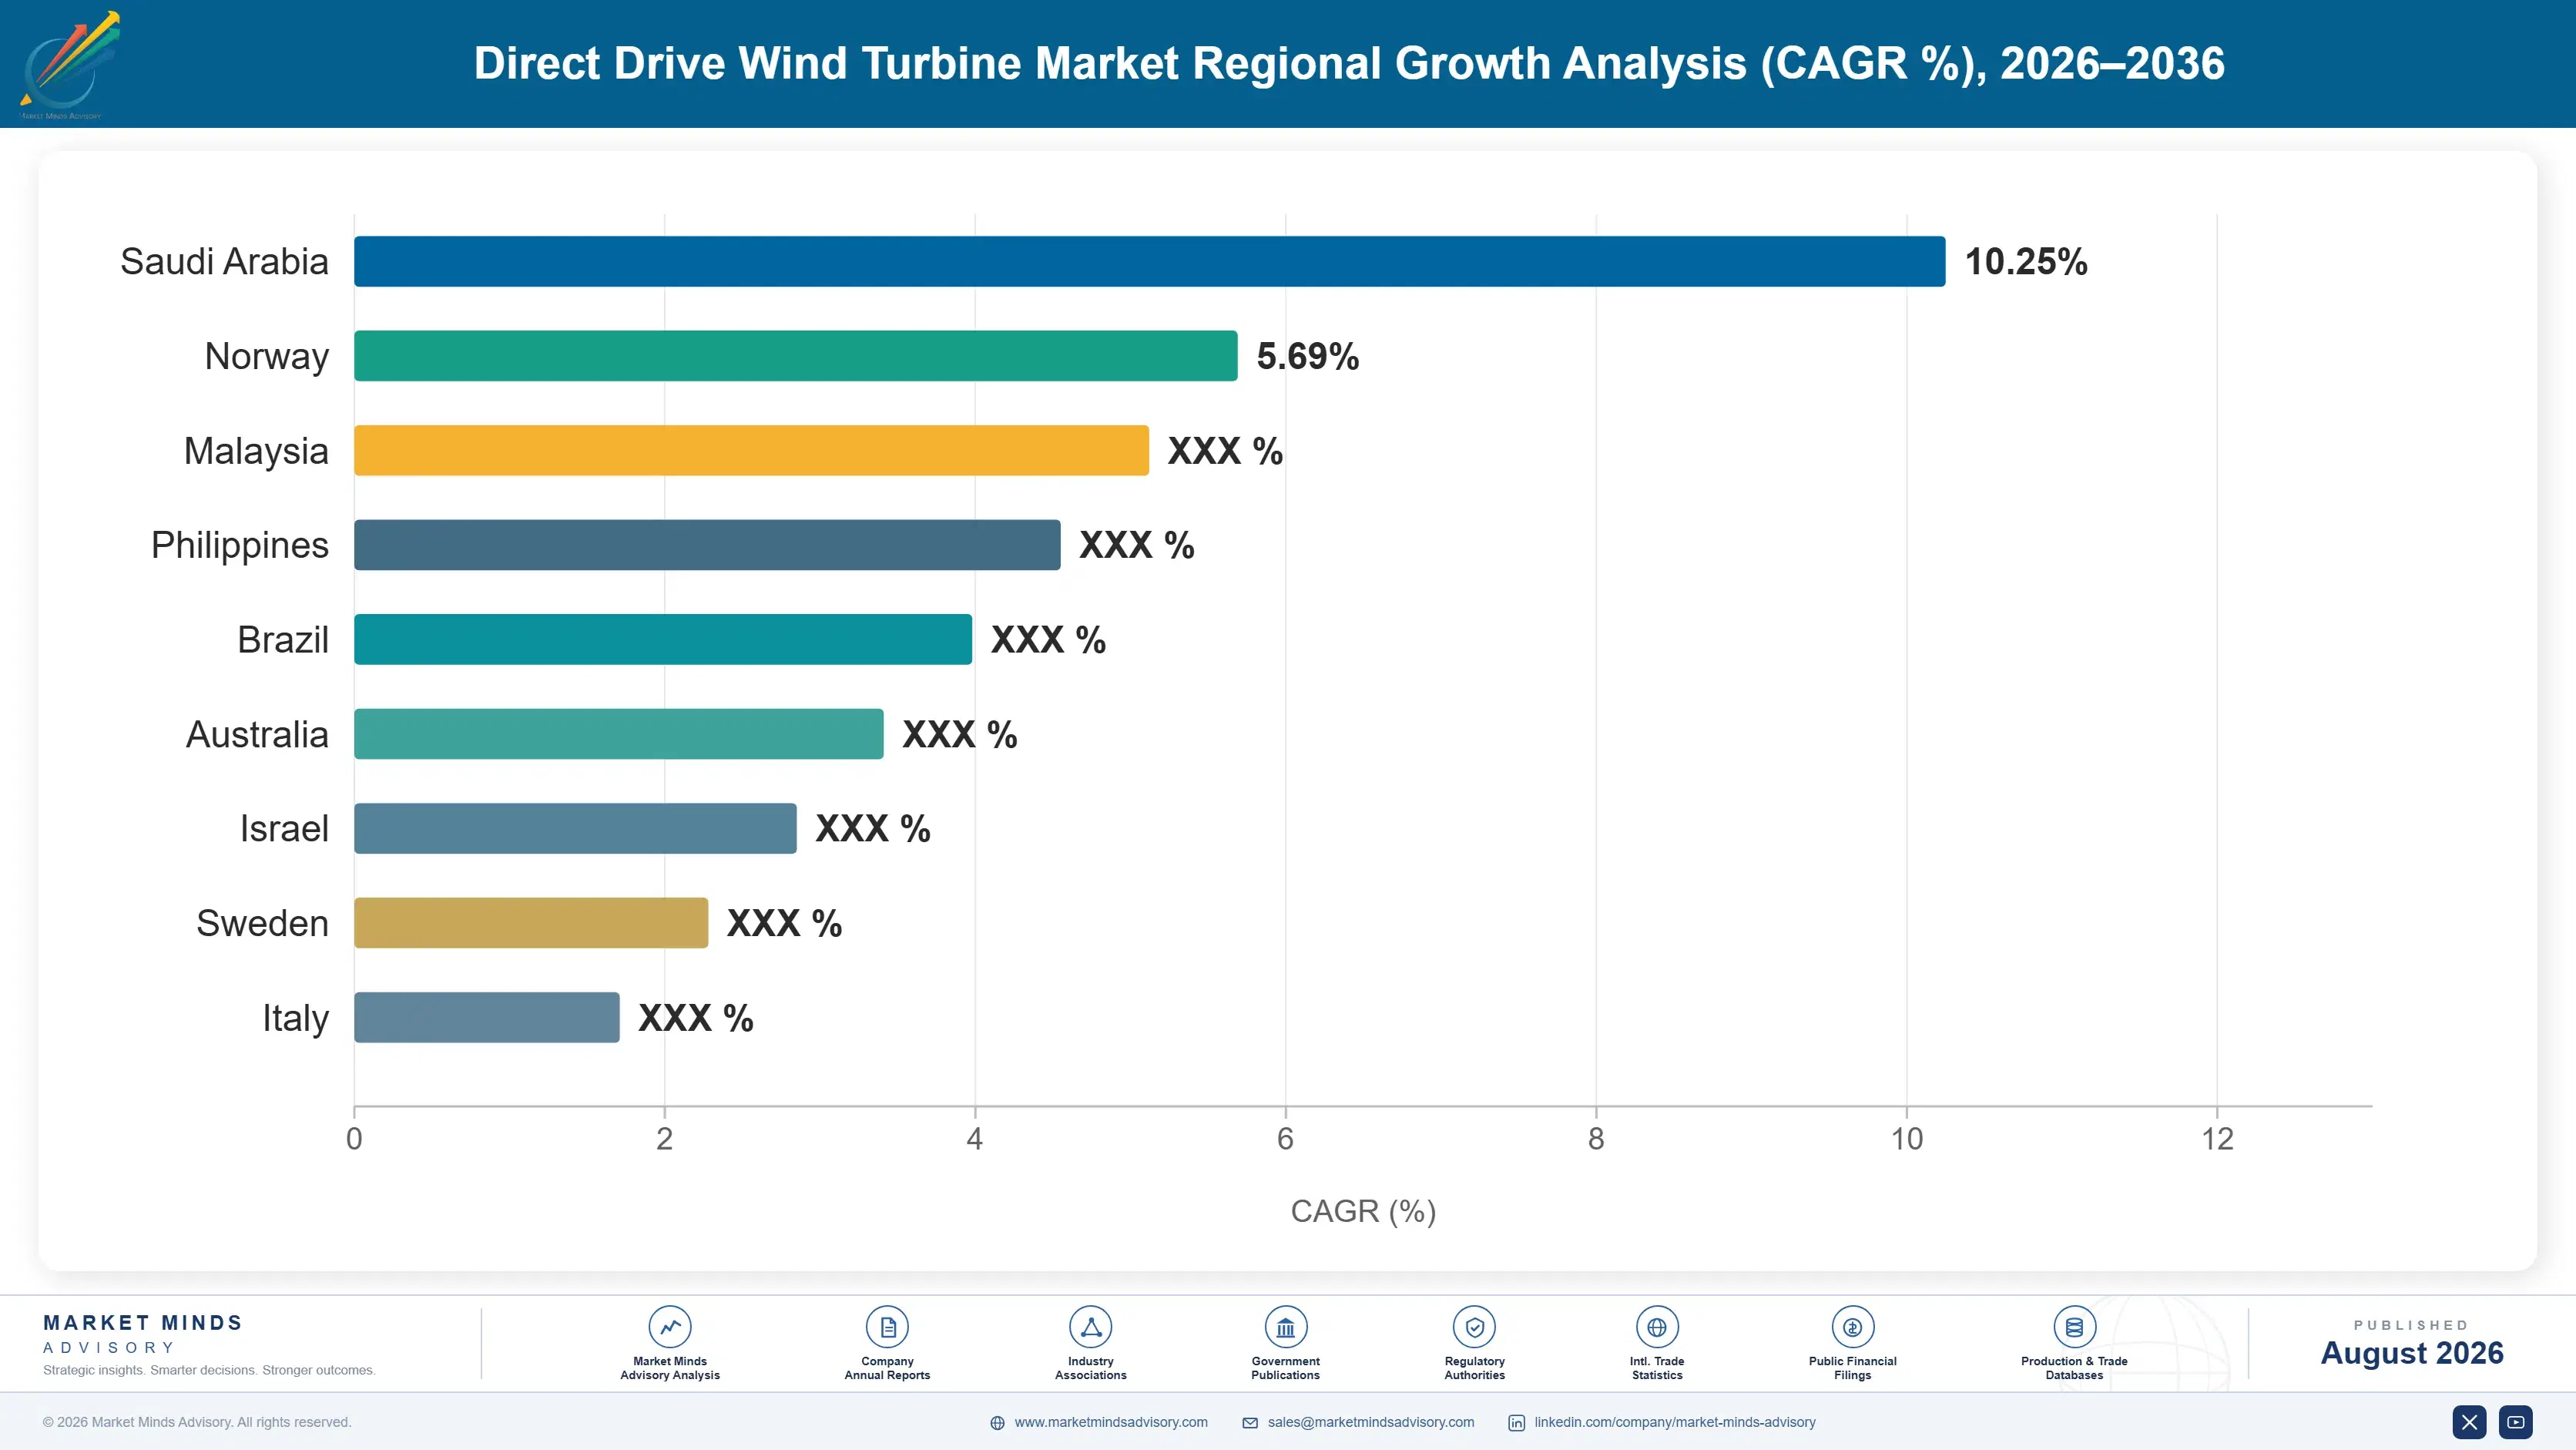
direct-drive-wind-turbine-market-country-cagr-analysis-1787302242108

Monetizing Availability Guarantees and Supply Security

Manufacturers are shifting commercial emphasis from one-time turbine sales toward long-term service agreements, availability guarantees, and supply chain security programmes, since offshore developers now value operating reliability and delivery certainty as much as upfront turbine pricing. This mirrors a broader shift across energy infrastructure toward relationship-based commercial structures rather than transactional pricing across every equipment category.

Structuring Long-Term Availability Guarantee Service Contracts

Manufacturers increasingly sell multi-year service contracts that guarantee a minimum fleet availability percentage, typically above 95%, with financial penalties owed to the developer if actual performance falls short of the contracted threshold. This shifts commercial risk toward the manufacturer, who assumes responsibility for predictive maintenance and rapid response logistics in exchange for recurring service revenue that can span fifteen to twenty years of the asset's operating life. Manufacturers with strong availability track records report service contract renewal rates well above 85%, since developers view a proven operator relationship as lower risk than switching providers mid-asset-life.
Market Impact: Guarantees fleet availability above

Long-Term Turbine Allocation and Framework Agreements

Manufacturers are increasingly structuring multi-year framework agreements that reserve production capacity for developers years before a specific project reaches final investment decision, formalizing a practice that offshore developers now consider essential given multi-year order backlogs across the largest turbine classes. Developers holding framework agreements report securing delivery windows meaningfully earlier than spot market customers, a scheduling advantage worth an estimated 12 to 18 months versus placing an order without prior allocation commitment. Manufacturers benefit from improved production planning visibility that supports capital investment in expanded generator and nacelle manufacturing capacity.
Market Impact: Secures delivery roughly 12 to 18 m

Predictive Maintenance and Remote Monitoring Software

Manufacturers are increasingly bundling predictive maintenance software and remote condition monitoring subscriptions alongside turbine sales, using sensor data to flag developing component issues before they cause an unplanned outage requiring costly offshore vessel dispatch. This service layer reduces unplanned offshore maintenance visits by an estimated 25 to 30% versus reactive maintenance models, a meaningful saving given how expensive an unscheduled offshore vessel mobilization can be. Manufacturers report predictive maintenance subscription attach rates rising fastest among offshore fleet operators managing dozens of turbines across geographically dispersed project sites, with attach rates now exceeding 60% among the largest fleet operators.
Market Impact: Cuts unplanned offshore visits 25 t

Repowering and Fleet Modernization Retrofit Packages

Manufacturers are increasingly offering repowering packages that replace aging geared turbines with direct drive units on existing foundations and grid connections, giving operators a faster and lower cost path to fleet modernization than a fully greenfield project would require. This retrofit path typically costs meaningfully less than developing an entirely new site while still delivering the energy yield and maintenance cost improvements a modern direct drive turbine provides. Manufacturers report repowering order volume, now roughly 18% of total unit shipments, rising fastest among operators whose original geared fleets are approaching twenty years of service.
Market Impact: Cuts repowering capex by roughly 30

Who Controls the Margin Pool

The top five manufacturers hold roughly 64% combined share, a high concentration reflecting the capital intensity of offshore-scale manufacturing and the multi-year field validation barrier keeping new entrants from competing for the largest framework contracts. The gap between offshore-capable manufacturers and smaller regional builders is widening as developers restrict bid eligibility to suppliers with proven, field-validated track records spanning multiple prior projects.
Current competitive activity centers on three fronts: turbine capacity scale-up races targeting the above 10 megawatt class, permanent magnet supply security investments including electrically excited generator alternatives, and long-term service contract depth for offshore fleet operators. Several Chinese manufacturers are pursuing aggressive expansion into European and emerging offshore markets, a faster but margin-diluting route to share than established manufacturers' reliability-driven growth model.

Emerging pressure comes from Chinese manufacturers moving beyond their domestic market into export offshore contracts, sold initially at competitive pricing to establish reference projects but increasingly backed by genuine reliability data as fleets accumulate hours. Rankings among the top five could shift if incumbents fail to match Chinese scale and cost competitiveness, since developers diversify sourcing across at least two qualified suppliers per major project.
direct-drive-wind-turbine-market-company-positioning-matrix-1787302242629

Competitive Moat and Risk Dimensions

SIEMENS GAMESA RENEWABLE ENERGY

Moat: Offshore reliability track record

Siemens Gamesa's extensive operating history across the North Sea's largest offshore wind farms gives it a field-validated reliability record few competitors can match, a critical advantage when developers evaluate turbine suppliers for multi-billion-dollar offshore projects carrying decades of operating risk. That track record compounds with every new project completed.
SIEMENS GAMESA RENEWABLE ENERGY

Risk: Persistent offshore margin pressure

Siemens Gamesa has faced sustained profitability challenges in its offshore turbine business tied to warranty provisions and quality issues on newer turbine platforms, raising questions about whether aggressive capacity scale-up has outpaced the manufacturing quality control needed to sustain its reliability reputation over the long run.
GOLDWIND

Moat: Domestic scale and cost position

Goldwind's dominant position within China's massive domestic wind market gives it manufacturing scale and cost advantages that support increasingly competitive international expansion, backed by a deep vertically integrated supply chain spanning generator components through final turbine assembly. That scale advantage widens with every domestic order won.
GOLDWIND

Risk: Limited offshore track record abroad

Goldwind's operating history outside China remains comparatively limited relative to established Western manufacturers, and international developers evaluating offshore suppliers for high-stakes, multi-decade projects often weigh this shorter non-domestic track record as a meaningful qualification risk factor during vendor selection for the largest offshore projects under review today.

Players Tracked

Prominent Players

Siemens Gamesa Renewable Energy
Goldwind
Enercon GmbH
Envision Energy
MingYang Smart Energy

Other Key Players

GE Vernova
Vestas Wind Systems
Nordex SE
Shanghai Electric Wind Power
CSSC Haizhuang
Windey
Sany Renewable Energy
Dongfang Electric
United Power
STX Heavy Industries
Zhuzhou CRRC Times Electric
Ingeteam
WEG Industries
Hitachi Energy
ABB

Recent Developments

OCTOBER 2025

Siemens Gamesa Expands Offshore Nacelle Assembly Capacity in Denmark

Siemens Gamesa announced an expansion of nacelle assembly capacity at its Danish facility, targeting increased production volume for its largest offshore turbine platform amid a multi-year order backlog. The expansion reflects organic capacity growth funded through existing capital investment rather than any acquisition or joint venture.
Signal: Confirms manufacturers are racing to expan
JANUARY 2026

Goldwind Signs Multi-Year Framework Agreement With European Developer

Goldwind signed a multi-year turbine supply framework agreement with a major European offshore developer, securing allocation priority across several planned North Sea projects through the end of the decade. The agreement is a supply arrangement rather than a joint venture or acquisition, extending Goldwind's European market presence.
Signal: Highlights Chinese manufacturers' growing
APRIL 2026

Envision Energy Acquires Permanent Magnet Component Supplier

Envision Energy completed the acquisition of a privately held permanent magnet component manufacturer, securing dedicated rare earth magnet supply capacity for its direct drive generator production lines. The deal strengthens Envision's supply chain resilience ahead of continued offshore capacity expansion worldwide, and terms of the transaction were not disclosed publicly.
Signal: Signals accelerating vertical integration

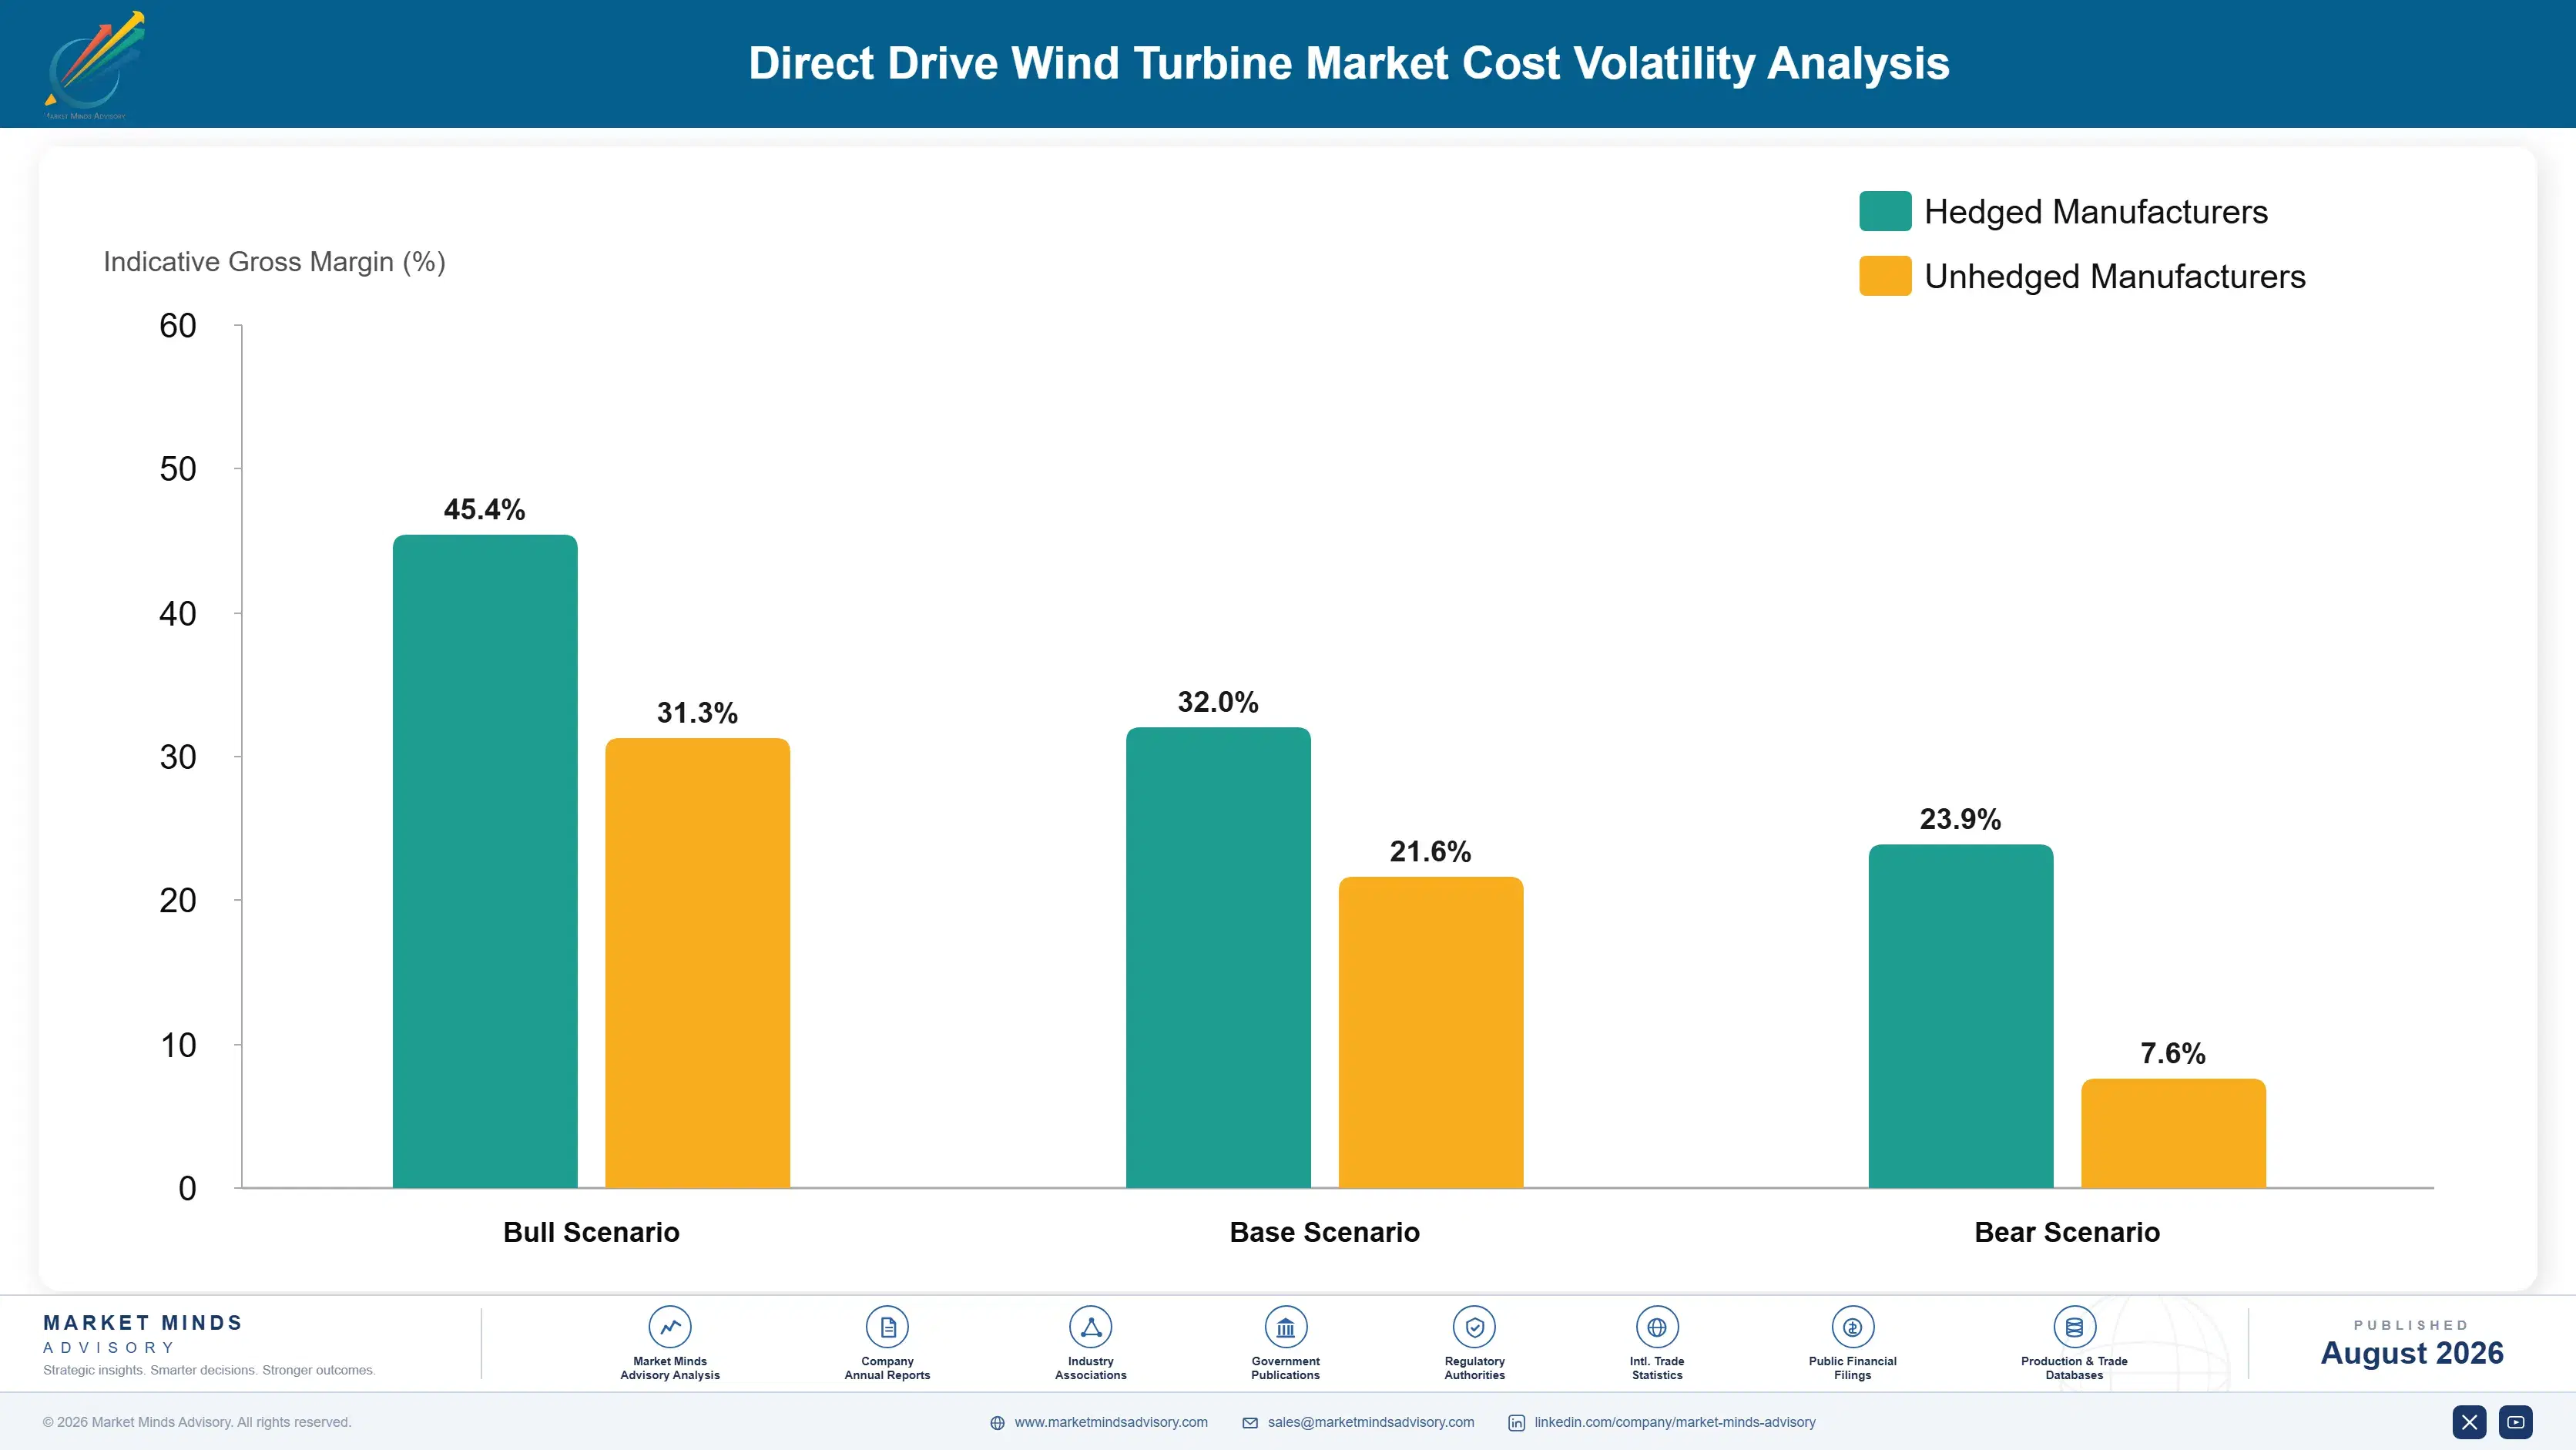
Rare Earth Magnet and Structural Steel Exposure

Rare earth permanent magnets, structural steel for towers and nacelles, and large-diameter bearings together represent an estimated 45 to 55% of direct drive turbine cost of goods sold. Rare earth magnet supply remains concentrated among a small number of refining and magnet manufacturing facilities, creating a narrower supply base than most other renewable energy equipment categories rely upon.
Rare earth prices spiked meaningfully during 2021 and 2022 amid export policy tightening and surging demand from the electric vehicle industry competing for the same magnet supply chain, a dynamic the IEA's critical minerals reporting flagged as a persistent risk facing multiple clean energy categories at once. Several manufacturers disclosed in annual reports that magnet lead times stretched beyond twenty-four weeks during the tightest period, delaying generator production.

Smaller regional manufacturers carry disproportionate exposure to these input swings since they lack the purchasing scale to negotiate multi-year fixed pricing directly with magnet producers that the top five manufacturers secure. This gap is widest for manufacturers dependent entirely on permanent magnet designs, leaving them vulnerable to margin compression during shortages that diversified competitors can absorb by shifting toward electrically excited alternatives.
direct-drive-wind-turbine-market-cost-volatility-analysis-1787302242826

Vertical Integration Into Magnet Manufacturing

Leading manufacturers are investing directly in permanent magnet production capacity rather than relying solely on external suppliers, insulating their generator lines from the shortages that stretched lead times beyond twenty-four weeks during 2021 and 2022 and protecting offshore delivery commitments already under contract with major developers across multiple continents and project phases currently underway.

Electrically Excited Generator Design Alternatives

Manufacturers are increasingly offering electrically excited synchronous generator designs that avoid permanent magnets entirely for a portion of their offshore product lineup, trading modest efficiency loss for meaningfully reduced exposure to rare earth material price volatility and geopolitical supply concentration risk facing the broader industry today across every region and market segment served worldwide.

Multi-Year Rare Earth Supply Contracts

Top five manufacturers increasingly lock multi-year pricing directly with rare earth refiners and magnet producers, smoothing generator input costs and insulating margin from the spot price volatility smaller regional manufacturers remain exposed to, a practice that has become standard procurement policy since the 2021 shortage cycle began across the industry broadly speaking and consistently.

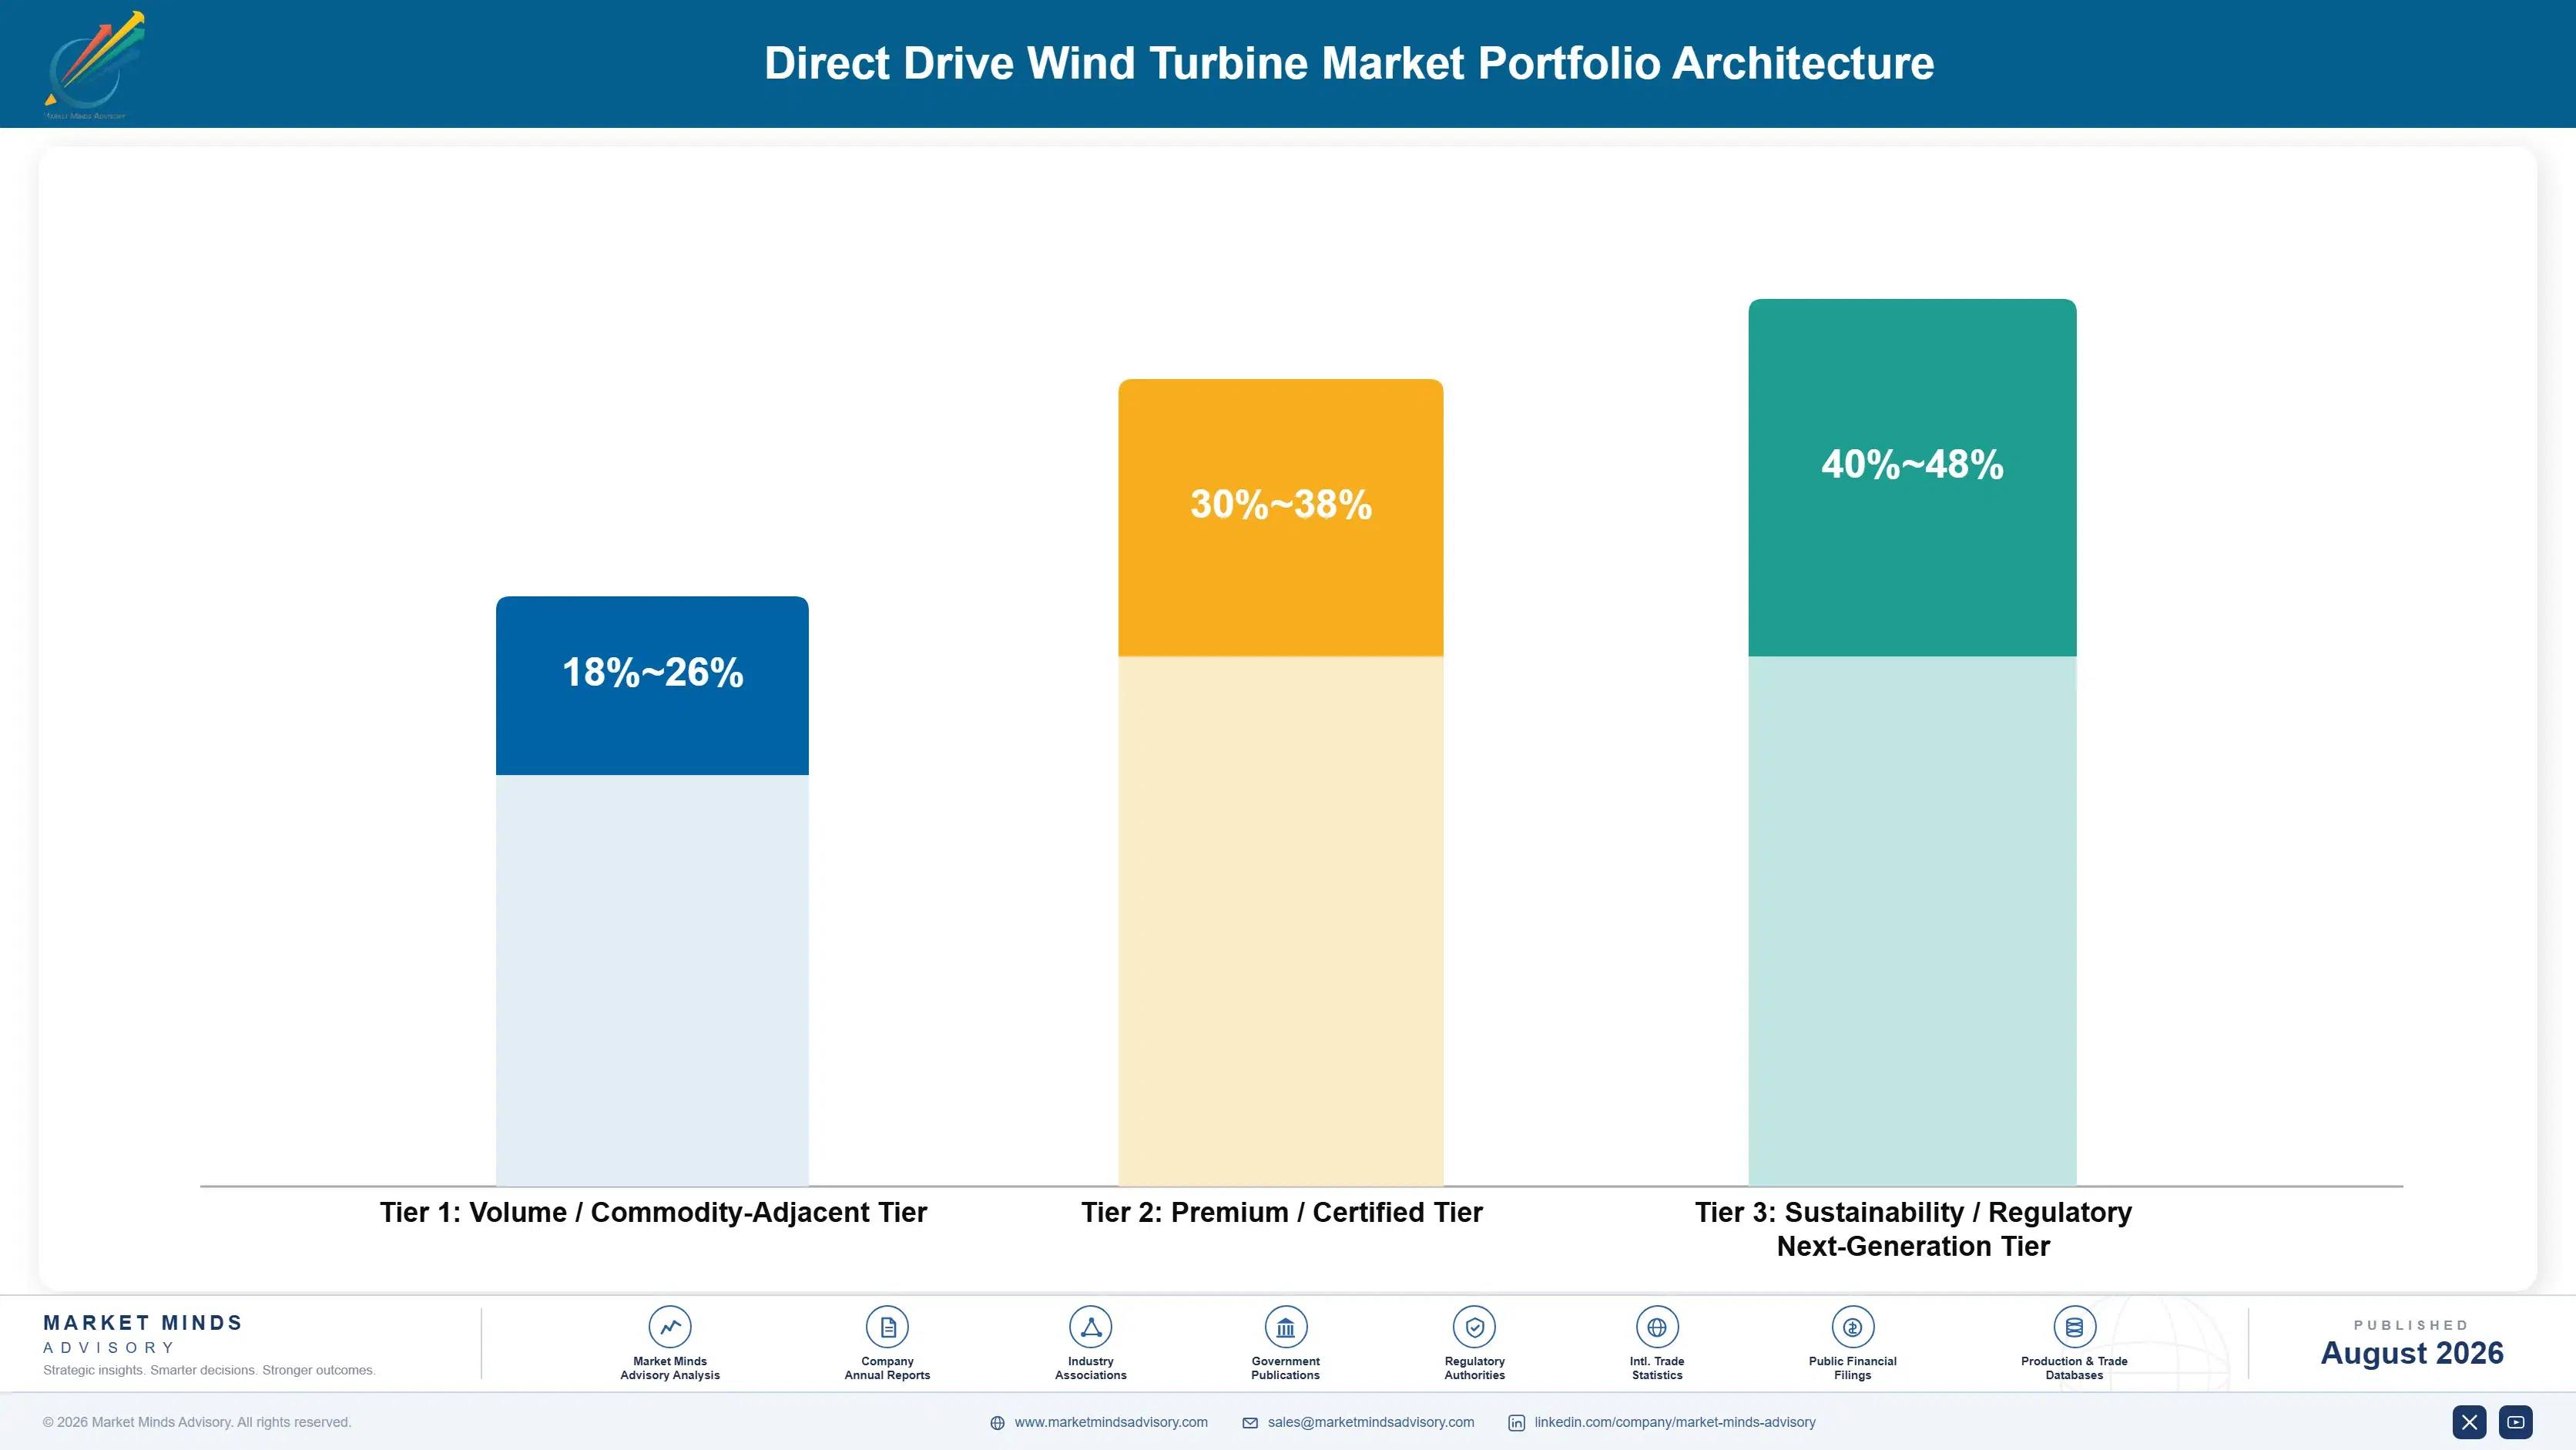
Portfolio Architecture for Margin Defence

Portfolio architecture splits across three tiers: volume priced sub-6 megawatt onshore turbines competing largely on cost, certified 6 to 10 megawatt offshore-qualified turbines carrying field validation barriers that support durable pricing, and next generation above 10 megawatt platforms bundled with long-term service and availability guarantee agreements. Gross margins widen meaningfully moving up this ladder as offshore qualification and reliability barriers concentrate hardest at the newest
The volume versus premium tension is sharpest in onshore turbines, where Chinese manufacturer competition has compressed prices fastest, pushing established vendors to defend share through service bundling rather than matching import pricing directly on hardware alone. Offshore-qualified turbines retain the strongest pricing power because field validation cost and multi-decade service relationships discourage developers from switching suppliers mid-programme.

High value margin pools concentrate in above 10 megawatt offshore platforms paired with long-term availability guarantee contracts, where recurring service revenue and high switching costs together support gross margins well above the portfolio average. Manufacturers are consequently prioritizing capital and engineering investment toward this tier even though it remains a minority of total unit volume shipped across the broader portfolio today, betting the mix shifts decisively within the decade.

Volume / Commodity-Adjacent Tier

Sub-6 megawatt onshore turbines competing primarily on unit price against Chinese manufacturer competition, with limited service attach and thin per-unit margins across most transactions worldwide today across every channel and distribution route.
Gross Margin: 18-26%

Premium / Certified Tier

6 to 10 megawatt offshore-qualified turbines serving proven project profiles, where field validation cost and multi-decade service relationships support durable, defensible pricing across the industry today and going forward reliably.
Gross Margin: 30-38%

Sustainability / Regulatory / Next-Generation Tier

Above 10 megawatt offshore platforms bundled with availability guarantee and predictive maintenance services, sold on reliability and long-term partnership value rather than unit price alone today across every project currently underway.
Gross Margin: 40-48%
direct-drive-wind-turbine-market-portfolio-architecture-1787302243330

Service Contracts Anchor Recurring Revenue

Direct drive economics function like a multi-decade annuity once a manufacturer wins a turbine order, since availability guarantee and maintenance service contracts typically span fifteen to twenty years, often extending well beyond the original turbine sale into multiple subsequent contract renewal cycles. This is why manufacturers compete so aggressively, even at thin initial hardware margins, to win the original turbine order, treating it as a foothold rather than the primary profit event.
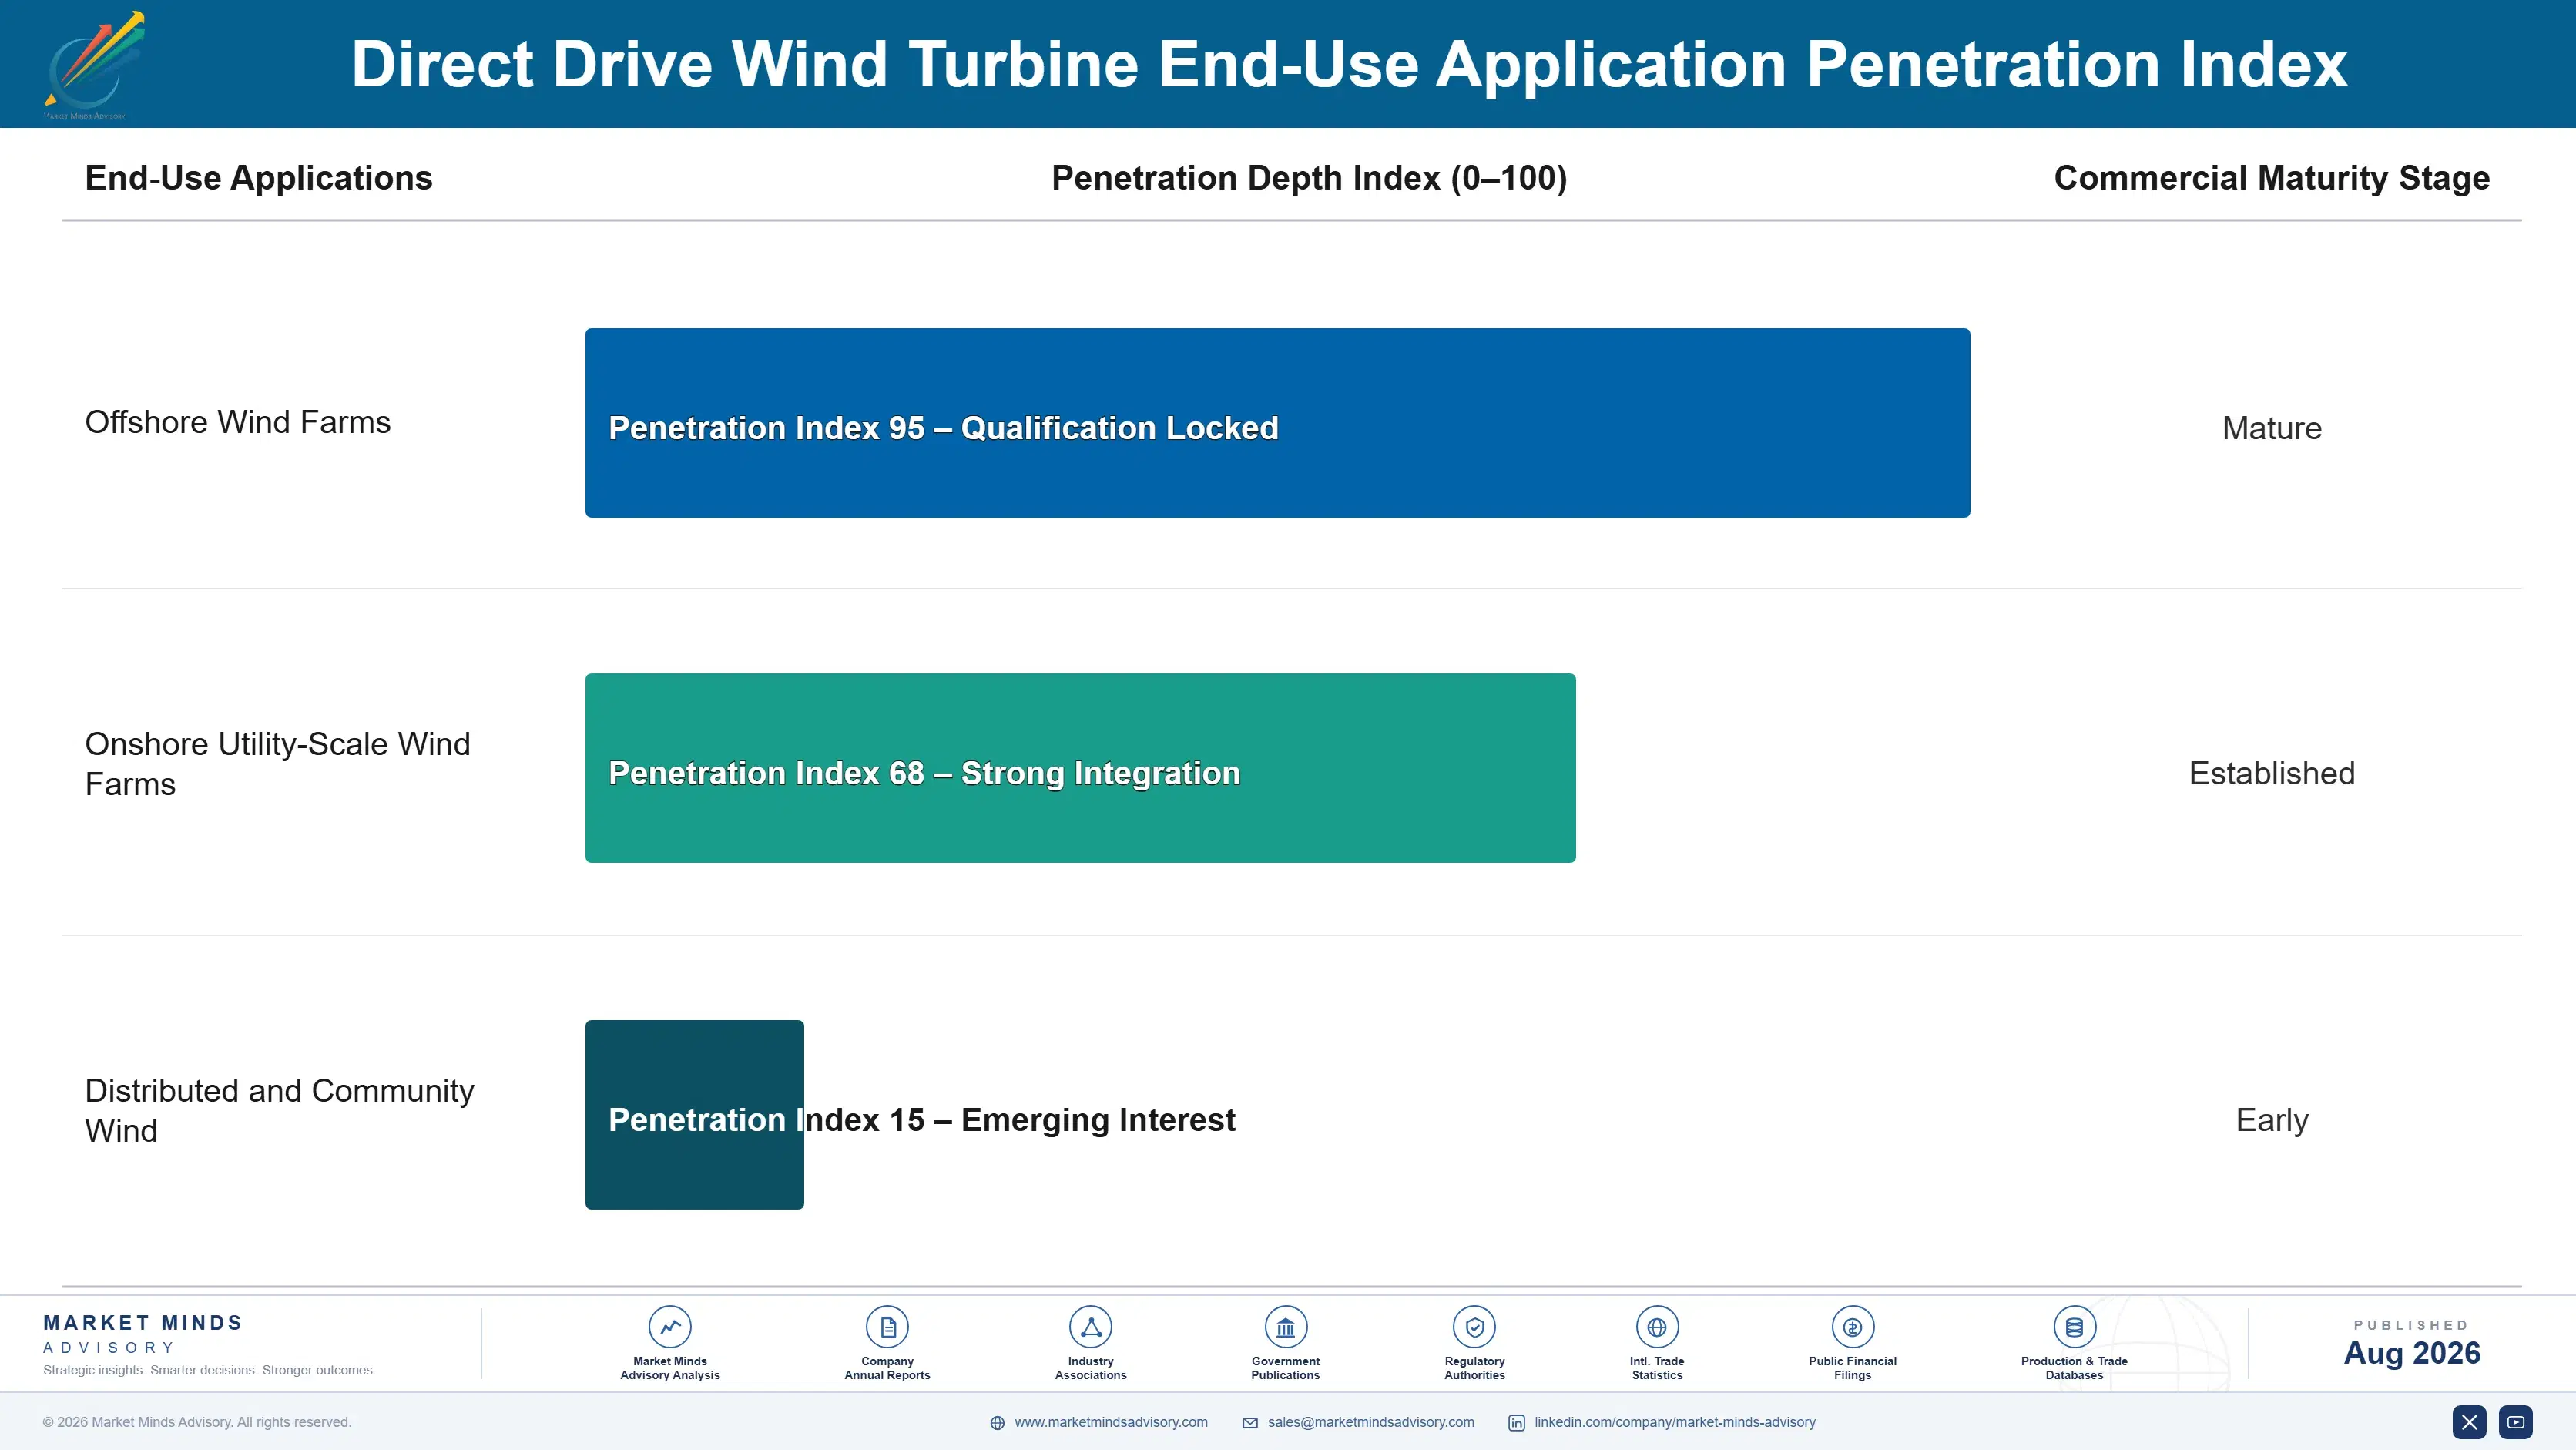
Adoption depth varies sharply by end-use vertical. Offshore wind projects are pushing hardest into the largest direct drive turbine classes to maximize energy capture per foundation, while onshore repowering projects adopt more selectively, replacing aging fleets gradually as they reach end of service life rather than converting entire portfolios simultaneously given more moderate return economics.

Buyer profiles are shifting generationally as project engineers who trained primarily on offshore-scale direct drive platforms increasingly influence procurement decisions alongside veteran developers who remember the geared turbine era before gearless designs became the offshore default. This is accelerating willingness to commit early to next-generation turbine capacity classes even among historically conservative onshore operators who once waited for mature, de-risked technology before committing capital.
direct-drive-wind-turbine-market-end-use-penetration-index-1787302243824

Where Turbine Manufacturing Strategy Should Focus

These are among the four positions where our research anticipates prominent divergence between winners and laggards over the coming forecast period. Each is grounded in the demand model, the regulatory perimeter, and the announced capacity pipeline.
01 / OFFSHORE CAPACITY INVESTMENT

Commit manufacturing capacity to above 10MW turbines now

Offshore developers increasingly specify the largest available turbine class to maximize energy capture per foundation, and manufacturers unwilling to commit capacity to the above 10 megawatt class risk losing multi-year framework agreements to rivals who scaled earlier. Developers now favor suppliers who guarantee delivery within committed windows over those offering marginally lower unit prices, reshaping the basis of competitive advantage across the category. Vendors that continue treating turbine sales as a spot transaction rather than a capacity partnership risk losing share to rivals willing to underwrite dedicated production expansion.
02 / RARE EARTH SUPPLY DIVERSIFICATION

Build electrically excited generator capability alongside magnets

Rare earth permanent magnet supply concentration exposed manufacturers to meaningful cost and delivery risk during the 2021 and 2022 shortage cycle, and that concentration risk has not meaningfully eased since. Manufacturers that develop credible electrically excited generator alternatives alongside their permanent magnet product lines will be better positioned to offer developers genuine supply chain diversification. Those remaining entirely dependent on permanent magnet designs risk losing offshore contracts specifically on supply security grounds as developers weigh geopolitical risk more heavily going forward.
03 / SERVICE CONTRACT MONETIZATION

Shift commercial models toward long-term availability guarantees

Hardware margins will keep compressing as Chinese manufacturers gain share at the onshore volume tier of the category, leaving little room for suppliers still pricing primarily around one-time turbine sales. Suppliers that convert availability guarantees, predictive maintenance, and remote monitoring into contracted recurring revenue will outperform peers slower to make that shift across the offshore fleet operator base. This also raises customer switching costs meaningfully, since replacing an enrolled service relationship requires displacing an entrenched, multi-decade maintenance partnership built on years of operating trust.
04 / CHINESE COMPETITIVE RESPONSE

Defend offshore reliability premium as Chinese suppliers scale

Chinese manufacturers are moving quickly from dominant domestic scale into export offshore contracts, initially competing on price but increasingly backed by genuine reliability data as installed fleets accumulate meaningful operating hours across multiple projects. Incumbents that fail to match this manufacturing scale and cost competitiveness risk ceding onshore and mid-capacity offshore share within the next several years of the forecast period. Defending the offshore reliability premium through proven service track records, rather than competing on unit price alone, offers the more durable long-term response available.

Engagement Snapshot From the Field

A live engagement with an industry participant carrying material or product regulatory and market exposure ahead of a defining policy shift, showing how our research translates into a defensible multi-year portfolio strategy.
MARKET MINDS ADVISORY · CLIENT ENGAGEMENT SUMMARY
Direct Drive Wind Turbine Producer Strategic Portfolio Review and Transition Roadmap 2026·Investment Scenario on Direct Drive Wind Turbine Exposure Evaluation 2025-26
CLIENT PROFILE
The client is a multinational offshore wind developer with projects under construction across three continents, generating revenue in the mid single digit billions from power generation operations (client-reported, unverified by MMA). Facing simultaneous project launches requiring turbine deliveries across overlapping timelines, the client's existing sourcing strategy relied on a single manufacturer relationship, creating exposure to delivery delays that threatened multiple project financing milestones simultaneously.
STRATEGIC CHALLENGE
Following delivery schedule pressure across its project pipeline, corporate leadership sought a diversified, multi-year turbine sourcing strategy spanning at least two qualified manufacturers across separate supply chains, while preserving existing project financing timelines already committed to lenders and equity investors across each individual development site and construction phase currently underway.
MMA APPROACH
MMA benchmarked six candidate turbine manufacturers against production capacity commitment terms, offshore reliability track record, and total cost of ownership over a twenty-five-year asset horizon, then modeled a diversified sourcing allocation designed to minimize single-supplier concentration risk across the client's global project portfolio and financing structure currently under active review.
KEY FINDINGS
  1. Four of six manufacturers evaluated could not guarantee production capacity commitments beyond twenty-four months without a signed framework agreement in place upfront.
  2. Diversifying across two qualified manufacturers was projected to reduce delivery delay risk by roughly 55% versus the client's prior single-supplier structure (client-reported, unverified by MMA).
  3. Electrically excited generator platforms offered a meaningful supply chain diversification benefit for the client's highest-risk project relative to permanent magnet alternatives evaluated.
  4. Manufacturers with dedicated offshore project management teams cut projected commissioning timeline risk by nearly three months on average across comparable projects reviewed.
CLIENT PROFILE
The client is a multinational offshore wind developer with projects under construction across three continents, generating revenue in the mid single digit billions from power generation operations (client-reported, unverified by MMA). Facing simultaneous project launches requiring turbine deliveries across overlapping timelines, the client's existing sourcing strategy relied on a single manufacturer relationship, creating exposure to delivery delays that threatened multiple project financing milestones simultaneously.
STRATEGIC CHALLENGE
Following delivery schedule pressure across its project pipeline, corporate leadership sought a diversified, multi-year turbine sourcing strategy spanning at least two qualified manufacturers across separate supply chains, while preserving existing project financing timelines already committed to lenders and equity investors across each individual development site and construction phase currently underway.
MMA APPROACH
MMA benchmarked six candidate turbine manufacturers against production capacity commitment terms, offshore reliability track record, and total cost of ownership over a twenty-five-year asset horizon, then modeled a diversified sourcing allocation designed to minimize single-supplier concentration risk across the client's global project portfolio and financing structure currently under active review.
KEY FINDINGS
  1. Four of six manufacturers evaluated could not guarantee production capacity commitments beyond twenty-four months without a signed framework agreement in place upfront.
  2. Diversifying across two qualified manufacturers was projected to reduce delivery delay risk by roughly 55% versus the client's prior single-supplier structure (client-reported, unverified by MMA).
  3. Electrically excited generator platforms offered a meaningful supply chain diversification benefit for the client's highest-risk project relative to permanent magnet alternatives evaluated.
  4. Manufacturers with dedicated offshore project management teams cut projected commissioning timeline risk by nearly three months on average across comparable projects reviewed.
RECOMMENDED STRATEGY
Phase 1: Phase 1 (Months 1-6): Qualify a second turbine manufacturer with strong offshore capacity commitments across a fully separate supply chain. Phase 2: Phase 2 (Months 7-14): Renegotiate existing contracts to include multi-year framework agreements with firmly guaranteed delivery windows fully secured now. Phase 3: Phase 3 (Months 15-24): Transition a portion of future project sourcing toward the highest-reliability qualified manufacturer identified through careful review.
OUTCOME
The client secured multi-year framework agreements across two qualified manufacturers spanning separate supply chains within the twenty-four month engagement window, reducing single-supplier concentration risk meaningfully (client-reported, unverified by MMA). Subsequent project milestones proceeded without turbine-related delivery delays, and the client reported an improved negotiating position during following capacity discussions.

Frequently Asked Questions

Foundational context covering the market sizes, CAGR, scope, country, region and competition that inform every finding below. This section is provided to cover basics and most often pre-purchase conversations, answered from the MMA Primary Research Dataset.

What is the current size of the Direct Drive Wind Turbine Market?

The global direct drive wind turbine market reached an estimated $19.5 billion in 2025. Growth is driven by offshore wind capacity expansion and the reliability advantages gearless drivetrains offer at sea.

How large will the Direct Drive Wind Turbine Market be by 2036?

The market is projected to reach approximately $47.8 billion by 2036, roughly 2.26 times its 2026 value. Turbines above 10 megawatts and offshore expansion drive most of the added value.

What is the CAGR for the Direct Drive Wind Turbine Market 2026 to 2036?

The base case CAGR is 8.5% through 2036. Bull and bear scenarios range from roughly 7.2% to 9.8%, depending on offshore permitting pace and rare earth material cost trends.

Which segment is growing fastest?

Turbines above 10 megawatts lead at a 15.5% CAGR, about 1.8x the overall market rate. Growth is concentrated among offshore developers maximizing energy capture per installed foundation.

Who are the major companies in the Direct Drive Wind Turbine Market?

Siemens Gamesa Renewable Energy, Goldwind, Enercon GmbH, Envision Energy, and MingYang Smart Energy lead the category. Combined, the top five suppliers hold roughly 64% of global revenue.

Which country is growing fastest?

China leads country level growth at an estimated 13.5% CAGR. Aggressive offshore capacity auctions and a deep domestic supply chain are driving sustained turbine order growth nationwide.

Report Segmentation Architecture

The full report scope spans multiple orthogonal segmentation dimensions, with cross-tabulated demand data provided for each dimension pair. Coverage extends further to regional breakdowns, trend trajectories, and the competitive detail needed to support segment-level decision-making.

By Turbine Capacity Class

  • Sub-3 MW Turbines
  • 3-6 MW Turbines
  • 6-10 MW Turbines
  • Above 10 MW Turbines
  • Repowering and Service Kits

By End-Use Application

  • Offshore Wind Farms
  • Onshore Utility-Scale Wind Farms
  • Distributed and Community Wind

By Commercial Dimension

  • Direct OEM Turbine Sales
  • EPC and Project Development Contracts
  • Long-Term Availability and Service Agreements
  • Repowering and Retrofit Services

By Region

  • North America
  • Western Europe
  • East Asia
  • South Asia and Pacific
  • Latin America
  • Middle East and Africa
  • Eastern Europe

Scope, Methodology, and Coverage

Every figure in this report is reproducible from documented input assumptions. The scope below maps the historical period, the forecast horizon, the segmentation dimensions, and the countries covered, alongside the underlying primary and qualitative methodology.
Historical Period
2020 to 2025
Forecast Period
2026 to 2036
Base Year
2025 (USD billions; MMA Primary Research Dataset, August 2026)
Market Definition
The direct drive wind turbine market covers gearless wind turbine systems in which the rotor connects directly to a low-speed generator without an intermediate gearbox, spanning permanent magnet and electrically excited synchronous generator designs across onshore and offshore applications. It includes new turbine sales, repowering kits, and directly bundled long-term service contracts.
Quantitative Units
USD billions (current prices); installed capacity in gigawatts where disclosed
Segmentation Dimensions
By Turbine Capacity Class; By End-Use Application; By Commercial Dimension; By Region
Regions Covered
North America, Western Europe, East Asia, South Asia and Pacific, Latin America, Middle East and Africa, Eastern Europe
Countries Covered
USA, China, Germany, France, UK, Japan, South Korea, India, Australia, Canada, Brazil, Mexico, Indonesia, Vietnam, Thailand, Malaysia, UAE, Saudi Arabia, South Africa, Nigeria, Turkey, Poland, Netherlands, Italy, Spain, Sweden, Switzerland, Argentina, Colombia, Singapore, and additional markets relevant to this sector
Key Companies Profiled
Siemens Gamesa Renewable Energy, Goldwind, Enercon GmbH, Envision Energy, MingYang Smart Energy, GE Vernova, Vestas Wind Systems, Nordex SE, Shanghai Electric Wind Power, CSSC Haizhuang, Windey, Sany Renewable Energy, Dongfang Electric, United Power, STX Heavy Industries, Zhuzhou CRRC Times Electric, Ingeteam, WEG Industries, Hitachi Energy, ABB
Quantitative Methodology
Primary survey, n=3,800 respondents, Q4 2025, six countries; demand-side model with trade association cross-validation
Qualitative Methodology
47 expert interviews, Q4 2025; applied to validate demand model assumptions, identify emerging dynamics, and assess competitive positioning
Report Format
PDF and XLSX data workbook (Word format preview document)
Publisher
Market Minds Advisory
Report Code
MMA-2026-ENE-106
Published
August 2026
Contact
sales@marketmindsadvisory.com | www.marketmindsadvisory.com

Purchase the full Direct Drive Wind Turbine Market Report (2026 to 2036).

The full report delivers a complete quantitative and qualitative assessment of the global direct drive wind turbine market through 2036. It includes detailed segmentation by turbine capacity class, end-use application, and commercial channel, alongside country level sizing across thirty markets covering every major offshore and onshore demand center. Competitive profiles cover twenty companies with capability, reliability, and service network benchmarking assessed on a consistent revenue basis. Buyers also receive access to the underlying primary survey and expert interview datasets referenced throughout the analysis, along with editable data tables.
Segment level CAGR and sizing tables
Regional and country level market breakdowns
Twenty company competitive profiles and benchmarks
Detailed offshore reliability capability benchmarking matrix
Input cost and supply chain risk analysis
Primary survey and expert interview datasets

Built For The People Who Decide

From boardroom strategy to bench-side execution, this report is read cover-to-cover by leaders shaping the next decade of their industry, turning demand scenarios, market dynamics and valuation benchmarks into decisions.
CXOs/ Presidents/ VPs/ Managers
M&A and Corporate Development
Strategy Teams and R&D Heads
Procurement and Product Directors
Regulatory and Compliance Leaders
Investor Relations and Equity Analysts