Market Minds Advisory
Electrolyzer Market

Electrolyzer Market: Iridium Scarcity, Stack Economics, and the Race to Bankable Hydrogen

Green hydrogen projects live or die on stack cost and iridium supply, and makers racing to scale gigawatt production are discovering manufacturing outran both the catalyst chain and the offtake contracts needed to finance it.

Lead Analyst

David Horsley

Published

September 2026

Make Smarter Decisions with Customized Research Insights

Request a free sample report and evaluate market opportunities, growth trends, and competitive dynamics relevant to your business needs.

2025 MARKET VALUE$5.5BMarket Size 2025
2036 FORECAST VALUE$24.4BBase Case , 2026 to 2036
CAGR 2026 TO 203614.5 %Bull 15.9% / Bear 13.2%
INCREMENTAL OPPORTUNITY$18.1BNet 10- year value creation
EXPANSION MULTIPLE3.88x2036 value over 2026 base
Strategic Levers
M&A Pipeline
Regional Outlook
Country Rankings
Competitive Intelligence
Segmental Deep-dive
Call-Us : 91 93563 13602

Executive Snapshot and Market Trajectory

Electrolyzer demand has moved from pilot-scale demonstration to gigawatt-scale procurement, because green hydrogen projects now clear final investment decision on the strength of signed offtake contracts rather than policy announcements alone. Manufacturers are converting order backlogs into expanded production capacity faster than the catalyst supply chain can comfortably support.
Commercial demand concentrates around green ammonia, refining decarbonisation, and steel sector hydrogen projects, where stack cost and system efficiency directly determine a project's levelised hydrogen cost and bankability. Solid oxide electrolyzers are pulling ahead of alkaline and PEM technology in efficiency-critical applications as manufacturers scale a technology that was pilot-only just a few years ago. East Asia leads deployment volume on China's manufacturing buildout.
Competitive character splits between diversified energy technology majors bundling electrolyzers into wider hydrogen project offerings and specialist stack manufacturers selling standalone equipment to independent developers. Regulatory pressure is a genuine constant here: production tax credits, carbon pricing, and national hydrogen strategies all directly shape project economics, and policy uncertainty in any major market can delay final investment decisions across an entire regional project pipeline. That dependency is a risk factor financiers weigh heavily.
Market Definition
The electrolyzer market covers water electrolysis systems for hydrogen production, including alkaline, PEM, solid oxide, and anion exchange membrane electrolyzer technologies, together with the balance-of-plant power electronics, gas handling, and water purification components sold as part of complete electrolyzer stack and system packages. It excludes downstream hydrogen storage, transport, and end-use equipment, and excludes the renewable power generation assets that feed the electrolyzer.
Base Year Value
$5.5B in 2025 (MMA Primary Research Dataset, August 2026)
Forecast Period
2026 to 2036, eleven discrete annual values
CAGR
14.5% base case. Bull 15.9%. Bear 13.2%.
Fastest Growth Segment
Solid Oxide Electrolyzer Cells: 22.0% CAGR
Fastest Growth Country
India: 17.1% CAGR
Fastest Growth Region
South Asia and Pacific: 16.5% CAGR
Largest Region
East Asia: 30% of 2025 global value
Market Leaders
Nel ASA, Thyssenkrupp Nucera, Cummins, ITM Power, Plug Power. Source: MMA Analysis based on company annual reports.
Primary Survey
n=3,800 procurement and R&D decision-makers, Q4 2025, six countries
Methodology
Demand-side build-up, cross-validated against public data, 47 expert interviews

Electrolyzer Market Forecast Scenarios

electrolyzer-market-size-forecast-scenario-1787302064945
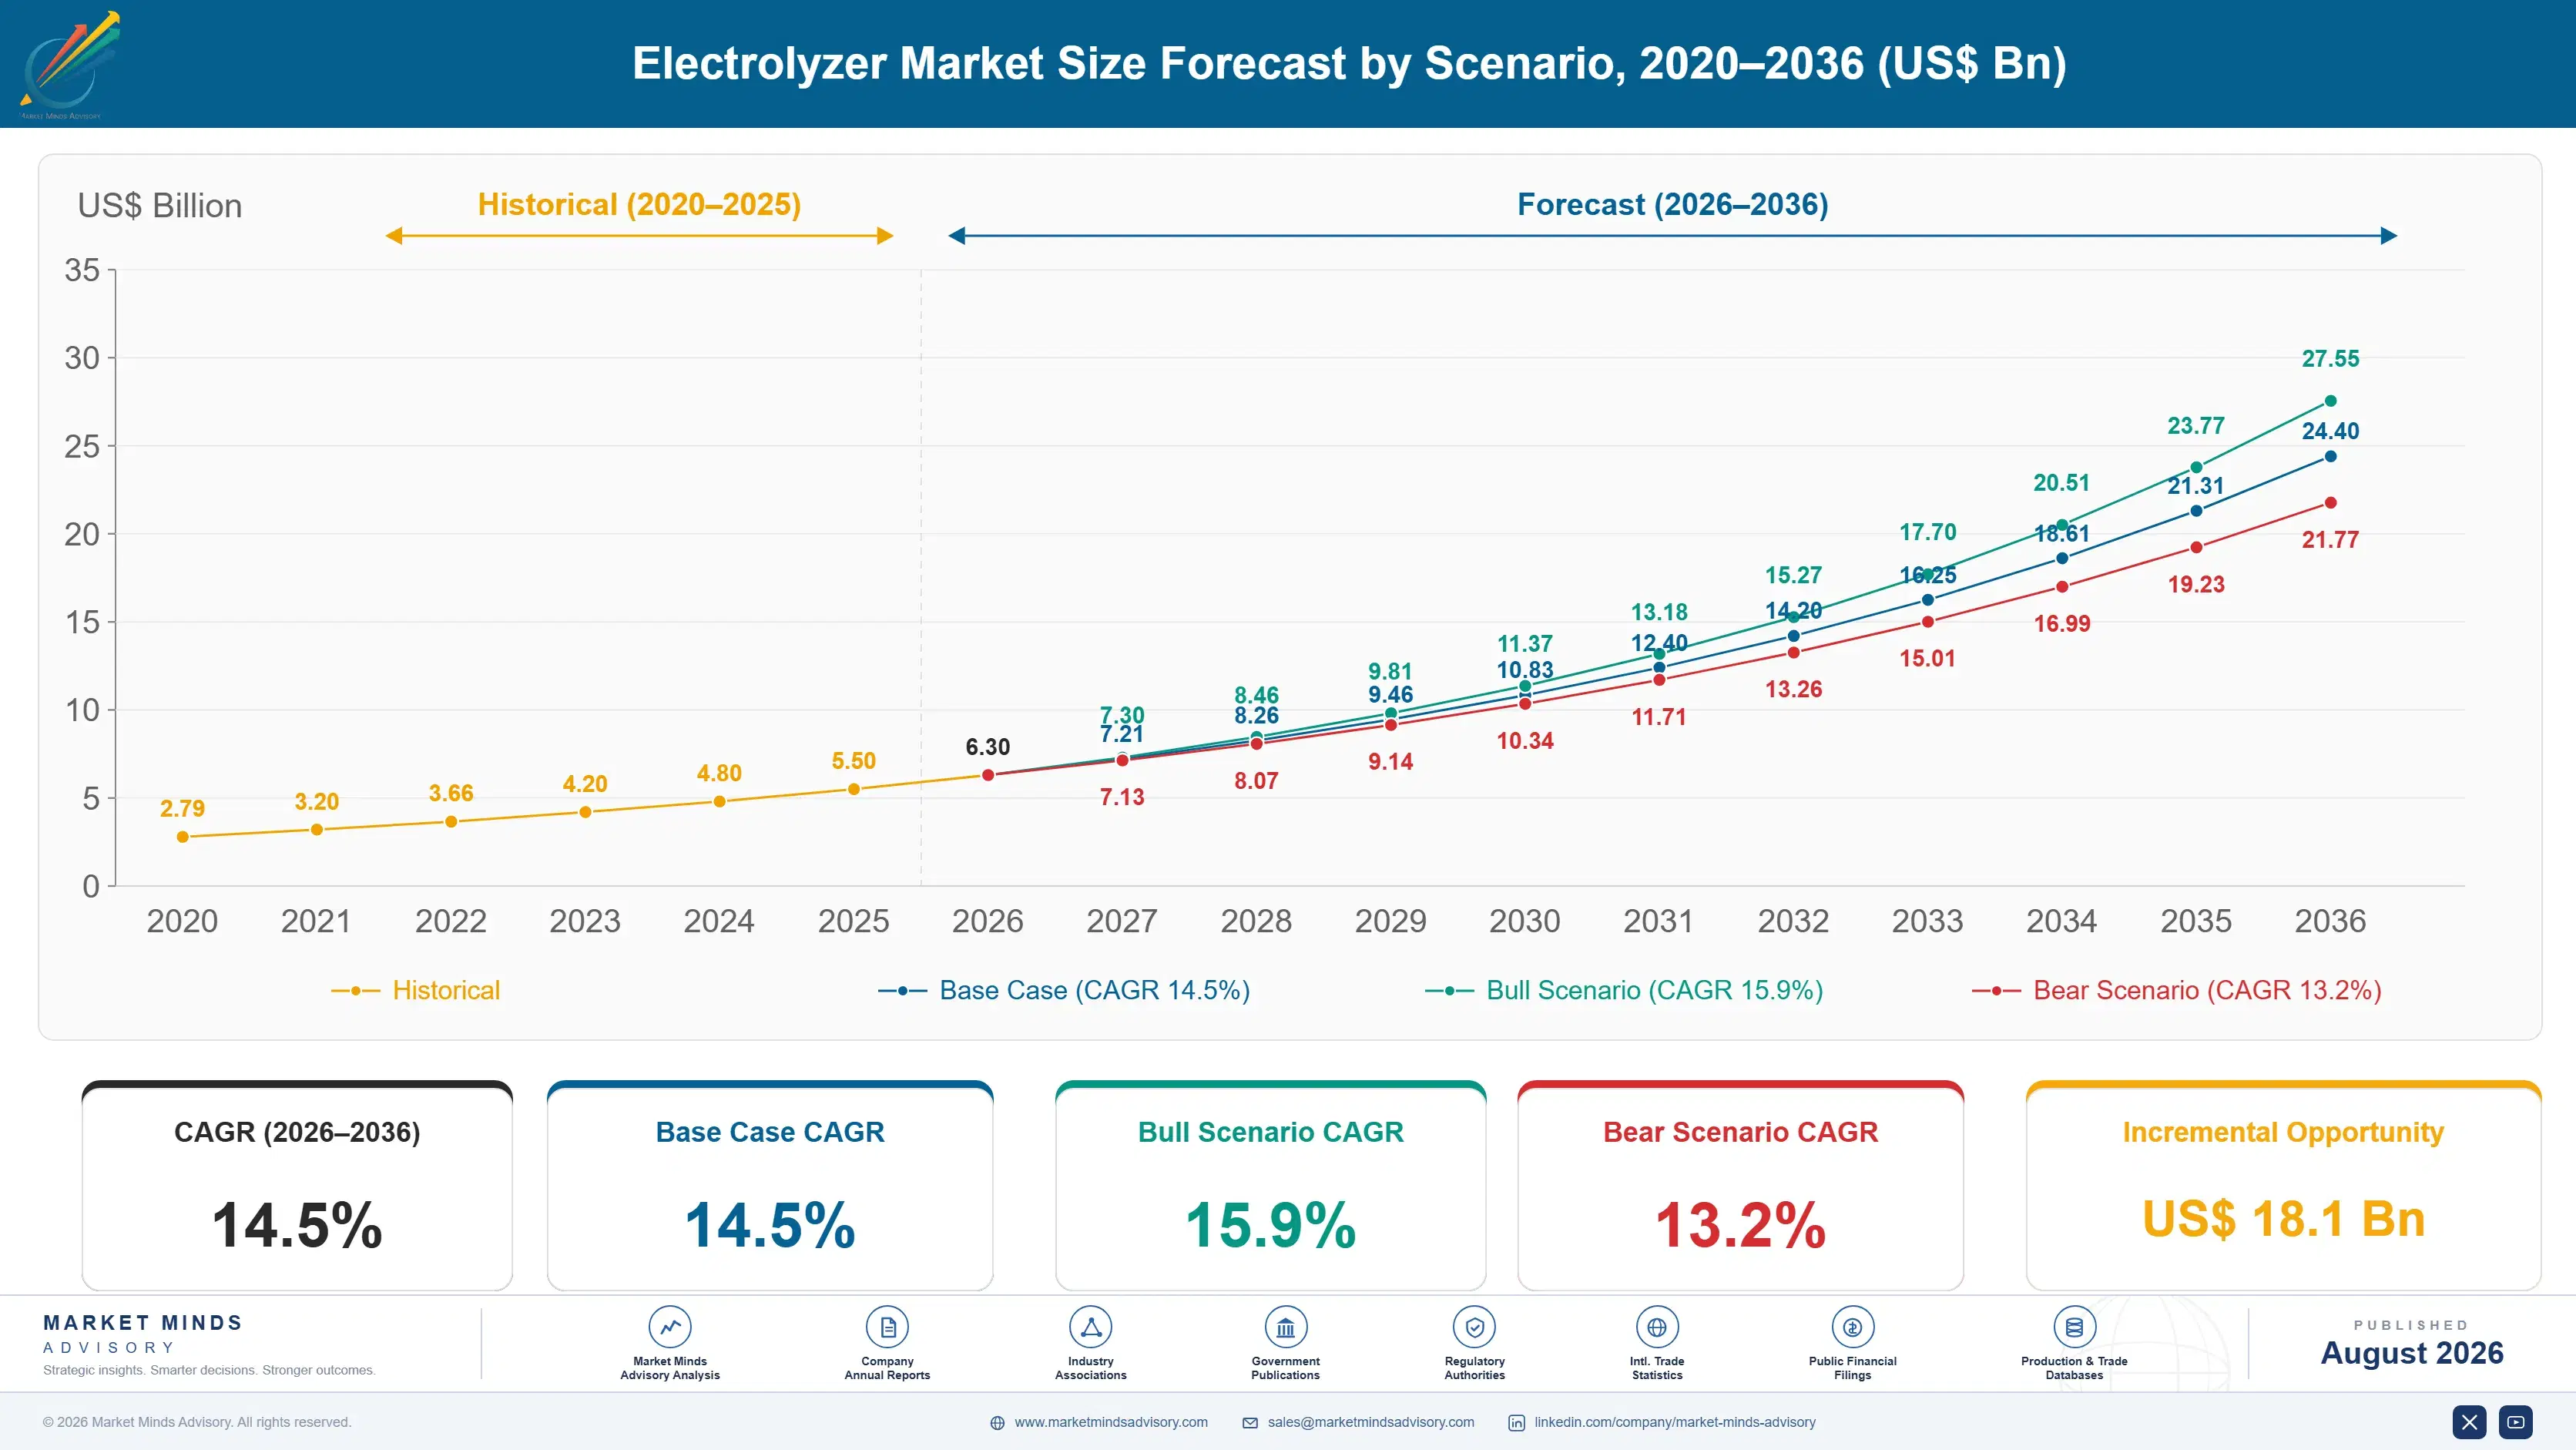
Between 2020 and 2025 the market grew at a 13.2% historical CAGR, driven mostly by pilot and demonstration-scale projects rather than the gigawatt orders now defining the category. Growth accelerated sharply from 2023 as final investment decisions cleared. Manufacturing capacity announcements consistently outran actual signed equipment orders across most of the period. Order visibility remained genuinely poor across most of the period.
The base case carries the market to a 14.5% CAGR through 2036 on three mechanisms. First, green ammonia and refining decarbonisation projects clearing final investment decision convert announced pipeline into signed equipment orders at an accelerating pace. Second, solid oxide and AEM technology maturation improves system efficiency enough to meaningfully lower levelised hydrogen cost across new projects. Third, national hydrogen strategies and production tax credits continue pulling electrolyzer specification earlier into project financing timelines.
The bull case reaches 15.9% if policy certainty around production tax credits holds across major markets, accelerating final investment decisions and pulling manufacturing orders forward across a compressed capacity build schedule. The bear case falls to 13.2% if policy uncertainty or offtake financing gaps continue stalling projects at the final investment decision stage, leaving announced capacity well ahead of actual signed orders.

Why Stack Economics Now Decide Project Viability

Three forces converge on electrolyzer demand at once. Green ammonia and refining decarbonisation projects clearing final investment decision convert announced pipeline into signed equipment orders at an accelerating pace. Solid oxide and AEM technology maturation improves system efficiency enough to meaningfully lower levelised hydrogen cost. And national hydrogen strategies continue pulling electrolyzer specification earlier into project financing timelines across major markets.
MARKET CONCENTRATIONCR5: 44%Diversified majors and specialist stack makers split nearly half
AVERAGE SELLING PRICEUSD 400 to 1,400 per kW installedPricing varies sharply by technology and system scale deployed
TOP PRODUCING COUNTRY SHAREChina: 38% of manufacturing capacityDomestic stack assembly concentrates heavily around a few clusters
CAPACITY UTILISATION48 to 58%Announced manufacturing capacity still runs well below utilisation
INPUT COST SHARE20 to 28% of COGSIridium and platinum group catalyst materials dominate cost spending
STACK REPLACEMENT CYCLE7 to 12 yearsMembrane and catalyst degradation sets the practical replacement interval
Commercially, the market behaves like capital equipment sold against project financing milestones rather than standard industrial procurement. Buyers specify by system efficiency, stack degradation rate, and catalyst loading rather than by price alone, because efficiency differences of even a few percentage points meaningfully change a project's levelised hydrogen cost over its operating life. That specification discipline protects margin for manufacturers with genuine electrochemical engineering depth and keeps generic power equipment makers from moving into technically demanding stack manufacturing.
Over the next decade, catalyst efficiency becomes the real differentiator. Solid oxide and AEM technology are closing the efficiency gap with mature alkaline and PEM systems as manufacturing scale improves unit economics considerably. Makers that combine reliable stack engineering with reduced precious metals dependence, rather than mature technology alone, will capture the gigawatt-scale contracts increasingly dominating new project specification.
"Everyone quotes stack capital cost per kilowatt, but the number that actually kills projects is degradation rate, because a stack that loses a few percent of output annually can turn a bankable project into an unbankable one over a twenty-year offtake contract."
Director, Hydrogen Production Technology Practice · MMA Hydrogen Production Equi

Market Trends

Solid Oxide Electrolyzers Move From Pilot Scale To Commercial Orders

Solid oxide electrolyzer cells, which operate at high temperature and achieve system efficiency well above conventional alkaline and PEM technology, have moved from pilot demonstration projects to commercial-scale orders as manufacturers including Sunfire and Bloom Energy have proven durability at scale sufficient to satisfy project financiers. That efficiency advantage translates directly into lower levelised hydrogen cost for projects with access to waste heat or high-temperature process integration, particularly in industrial decarbonisation applications where heat integration is genuinely available on site. Bloom Energy and Sunfire have both signed multiple commercial supply agreements since 2024.
Market Impact: Adds 0.5-2 GW orders per project

Iridium Scarcity Forces PEM Manufacturers Toward Alternatives

PEM electrolyzers depend on iridium catalyst coatings that face genuine supply scarcity, since global iridium production runs far below what gigawatt-scale PEM manufacturing capacity would require if built out at currently announced scale across every developer's stated pipeline. That scarcity is pushing PEM manufacturers to reduce iridium loading per stack considerably and to develop alternative catalyst formulations, while some developers are shifting specification toward alkaline or solid oxide technology specifically to avoid iridium exposure entirely. Cummins and ITM Power have both published roadmaps targeting substantial iridium loading reduction over the coming several years.
Market Impact: Requires 40-60% domestic content lo

Market Opportunities and Growth Drivers

Green Ammonia Projects Convert Pipeline Into Signed Orders

Green ammonia developers across multiple regions are clearing final investment decision at an accelerating pace as signed offtake agreements with fertiliser producers and shipping fuel buyers give lenders the revenue certainty needed to finance gigawatt-scale electrolyzer procurement. Each green ammonia project at commercial scale requires electrolyzer capacity measured in hundreds of megawatts to gigawatts, converting a single project's financial close into a substantial equipment order for whichever manufacturer wins the contract. That conversion from pipeline into signed orders is the clearest signal separating genuine near-term demand from unfinanced pipeline. That signal increasingly guides where manufacturers allocate scarce production slots.
Market Impact: Leaves capacity utilisation near 50

National Hydrogen Strategies Pull Specification Into Financing Timelines

Governments across multiple major markets have published national hydrogen strategies that tie production tax credits, grants, or preferential financing directly to electrolyzer specification and domestic content requirements, pushing developers to lock in equipment specification earlier in project planning than the industry's historical procurement timeline would otherwise suggest. That earlier specification timing gives manufacturers with established domestic manufacturing presence a meaningful advantage in markets where domestic content requirements apply, since imported equipment can face financing penalties or outright disqualification from incentive programmes. Manufacturers are responding by expanding domestic footprints in markets with the strongest content requirements.
Market Impact: Stalls 40-60% of announced pipeline

Market Restraints and Challenges

Manufacturing Capacity Outpaces Signed Equipment Orders

Announced global electrolyzer manufacturing capacity runs well ahead of actual signed equipment orders, the root cause being that manufacturers expanded capacity anticipating a project pipeline that has converted to final investment decision more slowly than early industry forecasts assumed. That gap leaves capacity utilisation running well below what manufacturers need to achieve the unit cost reductions their own pricing models assumed when capacity expansion decisions were made several years earlier. Manufacturers are responding by slowing further capacity expansion until backlogs catch up, and by diversifying into balance-of-plant and refurbishment revenue that does not depend on new capacity.
Market Impact: Cuts hydrogen production cost 15-20

Offtake Financing Gaps Stall Projects At Final Investment Decision

Many announced green hydrogen projects remain stalled at final investment decision because developers cannot secure offtake agreements at price levels that satisfy project lenders, the root cause being that green hydrogen still costs more than grey hydrogen or fossil alternatives across most applications. That financing gap means a large share of announced project pipeline may never convert into actual equipment orders, leaving manufacturers unable to distinguish genuine near-term demand from speculative pipeline announcements when planning capacity investment. Manufacturers are responding by prioritising engagement with developers who have secured offtake over those still pursuing pipeline.
Market Impact: Cuts loading 40-60% by 2035
3 additional market trends, 3 additional growth drivers, and 2 additional restraints and challenges are covered in the full report. Contact sales@marketmindsadvisory.com to access the complete intelligence.

Segment CAGR and Growth Architecture

Segmentation follows electrolyzer technology, the single engineering logic that determines efficiency, catalyst dependence, and operating temperature. Alkaline, PEM, solid oxide, and AEM electrolyzers, balance-of-plant systems, and stack replacement services each serve a genuinely distinct technical profile and are evaluated consistently throughout this report. Underlying renewable power generation assets sit outside this hierarchy entirely, evaluated separately.
electrolyzer-market-market-share-analysis-1787302065815

Solid Oxide Electrolyzer Cells

Solid oxide electrolyzer cells grow fastest at 22.0%, about 1.52 times the market's 14.5% overall rate, as high-temperature operation delivers system efficiency well above conventional alkaline and PEM technology, particularly where waste heat or process integration is genuinely available on site. Sunfire and Bloom Energy have both proven durability at commercial scale sufficient to satisfy project financiers, converting what was a purely pilot-scale technology into a bankable commercial option within a short span of years. Adoption concentrates first among industrial decarbonisation projects with waste heat access, spreading into standalone green hydrogen projects as manufacturing scale improves economics. Cost per kilowatt remains above alkaline technology but is falling fastest of any segment.
CAGR 22.0%

Anion Exchange Membrane Electrolyzers

Anion exchange membrane electrolyzers grow second-fastest at 19.0%, offering a genuine middle path between alkaline technology's low catalyst cost and PEM technology's compact footprint and dynamic response, without either alkaline's bulk or PEM's iridium dependence. Rather than requiring the platinum group catalyst loading that PEM systems depend on, AEM electrolyzers use lower-cost catalyst materials while still achieving compact system footprints suited to distributed and modular deployment. Enapter and other AEM specialists have expanded commercial product lines specifically to capture developers seeking PEM-like performance without PEM's precious metals exposure and associated supply risk. Adoption is fastest among distributed and modular hydrogen projects where footprint and dynamic response matter more than absolute lowest catalyst cost.
CAGR 19.0%
Full segment breakdown across 6 segments available in the complete report.

Regional Architecture and Country Demand Map

Global demand concentrates where manufacturing capacity and national hydrogen strategies run deepest. East Asia leads on China's manufacturing buildout, South Asia and Pacific follows on India's hydrogen mission, and Western Europe trails both on slower project financing. North America adds meaningful incremental demand behind both leaders.

North America

The United States drives regional demand through 45V clean hydrogen production tax credit certainty, which has pulled multiple green ammonia and industrial decarbonisation projects to final investment decision faster than most other markets outside China. Domestic manufacturing content requirements tied to incentive eligibility have pushed Cummins and Plug Power to expand United States-based stack manufacturing capacity considerably beyond their prior footprint. Canada adds a smaller layer through hydrogen hub programmes in Alberta and Quebec targeting both domestic use and export markets. Growth of 15.0% tracks the pace of final investment decisions more than any single policy renewal announcement. Texas and the Gulf Coast are emerging as the fastest-growing sub-region within North America specifically.
Share: 23% | CAGR: 15.0% (2026 to 2036)

Western Europe

Germany, France, and the Netherlands anchor demand through national hydrogen strategies that fund both electrolyzer manufacturing capacity and green hydrogen project development under the EU's broader hydrogen strategy framework. Thyssenkrupp Nucera and ITM Power both hold genuine home-market advantage across German and British project developer accounts, competing on alkaline and PEM technology depth respectively against global entrants. Project financing has moved more slowly than initially expected across several member states, with a number of announced projects still awaiting final investment decision well behind original timelines. Growth of 13.0% reflects that financing delay directly, sitting below the global rate despite the region's genuinely ambitious policy framework. Norway and Denmark contribute meaningful additional pipeline through offshore wind-linked hydrogen projects.
Share: 21% | CAGR: 13.0% (2026 to 2036)
Regional intelligence for 5 additional markets available in the complete report: East Asia, South Asia and Pacific, Latin America, Middle East and Africa, Eastern Europe. Contact sales@marketmindsadvisory.com.
electrolyzer-market-country-cagr-analysis-1787302066681

Where Electrolyzer Manufacturers Can Defend Margin

Procurement budgets are shifting toward manufacturers who can prove bankability alongside technical performance. The four levers below capture revenue once a project reaches final investment decision rather than during speculative early engagement, and each rewards makers who can demonstrate reliability credibly to project lenders specifically. That shift rewards manufacturers who prove bankability well before a term sheet is signed.

Sell Performance Guarantees Directly To Project Lenders

Project lenders increasingly require documented performance guarantees, degradation rate commitments, and warranty terms before financing a green hydrogen project, since stack underperformance directly threatens the revenue projections underlying the entire loan structure. Manufacturers that engage project lenders directly, rather than only the developer, build the credibility that accelerates financial close and differentiates their equipment from competitors offering comparable specifications on paper alone. Nel ASA reports that projects backed by direct lender engagement close financing roughly 20% faster than comparable projects without that engagement. That credibility increasingly determines which manufacturer wins the largest gigawatt-scale contracts.
Market Impact: Speeds financial close by roughly 2

Reduce Iridium Loading To Cut PEM System Cost

Iridium scarcity constrains how much PEM manufacturing capacity the global catalyst supply chain can actually support, and manufacturers that reduce iridium loading per stack without sacrificing certified performance capture cost advantage that translates directly into more competitive project bids. Cutting iridium loading by 30 to 50% per stack lowers total system cost enough to shift project economics meaningfully in competitive tenders against alkaline and solid oxide alternatives. Cummins and ITM Power have both invested heavily in catalyst loading reduction specifically to protect PEM's competitive position against lower-catalyst-cost technologies. Cummins reports meaningful stack cost reduction in its latest generation.
Market Impact: Cuts PEM system cost 15-25% per sta

Build Domestic Manufacturing To Capture Incentive-Linked Demand

National hydrogen strategies increasingly tie production tax credits and grants to domestic manufacturing content, and manufacturers without qualifying domestic production capacity find themselves excluded from incentive-eligible projects regardless of their equipment's technical merit. Building domestic manufacturing capacity in markets with the strongest incentive programmes captures demand that imported equipment simply cannot access under current policy structures. Plug Power has expanded United States manufacturing specifically to qualify for 45V-linked project demand that imported alternatives cannot capture. Manufacturers without qualifying domestic capacity typically face incentive penalties worth 20 to 30% of project value.
Market Impact: Captures 45V-linked demand tied to

Offer Stack Refurbishment To Extend Customer Relationships

Installed electrolyzer stacks degrade over a seven to twelve year operating life, and offering refurbishment services rather than requiring a full system replacement captures recurring revenue from a customer relationship that would otherwise end at the original installation. Manufacturers that build dedicated refurbishment capability retain customer relationships across multiple stack replacement cycles rather than losing that revenue to third-party service providers entering the growing installed base. Nel ASA has expanded refurbishment service capacity specifically to capture this recurring revenue as its early-installed base approaches replacement age. That refurbishment revenue now represents roughly 15% of Nel ASA's total service business.
Market Impact: Captures recurring revenue across e

Who Controls the Margin Pool

Concentration sits at CR5 44%, moderate-to-high for a capital equipment category still consolidating around a smaller number of proven manufacturers. Nel ASA and Thyssenkrupp Nucera lead on manufacturing scale, bundling electrolyzers into wider hydrogen project offerings, while the gap to specialists like ITM Power and Enapter is more about manufacturing scale than electrochemical engineering depth. All participants are assessed on one consistent basis, electrolyzer equipment revenue.
Current competitive activity runs across three dimensions. Technology development concentrates on solid oxide and AEM systems to close the efficiency gap with mature alkaline and PEM technology. Catalyst engineering investment focuses on reducing iridium dependence rather than manufacturing scale alone. And account structure centres on direct lender engagement and offtake-backed project relationships rather than speculative early developer outreach, a shift that rewards manufacturers with genuine bankability credibility.

Emerging pressure comes from Chinese manufacturers scaling behind the country's domestic alkaline manufacturing buildout, winning price-sensitive tenders that incumbents once assumed were theirs. Rankings will shift toward manufacturers combining reduced catalyst dependence with proven lender-backed delivery, since that is what large developers now specify. Manufacturers without a credible efficiency roadmap face the sharpest erosion ahead.
electrolyzer-market-company-positioning-matrix-1787302067534

Competitive Moat and Risk Dimensions

NEL ASA

Moat: Deep engineering track record

Nel ASA holds decades of accumulated electrolyzer engineering expertise across both alkaline and PEM technology, giving it a genuine credibility advantage with project lenders evaluating manufacturer track record that newer entrants cannot easily replicate without years of comparable field performance data. That accumulated track record is difficult for newer entrants to replicate quickly at comparable credibility.
NEL ASA

Risk: Exposed to Chinese pricing pressure

Nel ASA's alkaline technology faces direct price competition from Chinese manufacturers scaling behind domestic demand, leaving it more exposed than diversified rivals to margin pressure on standard technology tenders where price increasingly outweighs brand track record. That exposure grows as Chinese manufacturing scale continues improving on both cost and quality.
THYSSENKRUPP NUCERA

Moat: Large-scale alkaline manufacturing depth

Thyssenkrupp Nucera has manufactured large-scale alkaline electrolysis equipment for industrial chlor-alkali applications for decades, giving it genuine gigawatt-scale manufacturing and engineering experience that newer green hydrogen-focused entrants without comparable industrial manufacturing history cannot easily match. That manufacturing depth is difficult for newer green-hydrogen-only entrants to match quickly.
THYSSENKRUPP NUCERA

Risk: Concentrated European revenue base

A large share of Thyssenkrupp Nucera's project pipeline still ties to European and Gulf state accounts, leaving it more exposed than global rivals to European project financing delays and less positioned to capture China's faster-growing domestic manufacturing volume. That concentration leaves less room to absorb a European project financing slowdown than global rivals face.

Players Tracked

Prominent Players

Nel ASA
Thyssenkrupp Nucera
Cummins
ITM Power
Plug Power

Other Key Players

McPhy Energy S.A.
Sunfire GmbH
Bloom Energy Corporation
John Cockerill
Siemens Energy
Ohmium International
Enapter S.r.l.
HydrogenPro ASA
Green Hydrogen Systems A/S
Longi Hydrogen Technology
Sungrow Hydrogen
Peric Hydrogen Technology
Elogen
Hystar AS
Topsoe A/S

Recent Developments

MARCH 2025

Thyssenkrupp Nucera launches expanded large-scale alkaline product line

Thyssenkrupp Nucera introduced a new large-scale alkaline electrolyzer product line with expanded single-unit capacity, targeting gigawatt-scale green ammonia and industrial decarbonisation projects. This was an organic product launch rather than an acquisition, extending Thyssenkrupp Nucera's capacity range for the largest project tenders specifically. across gigawatt-scale project tenders.
Signal: Incumbents are scaling single-unit capacit
SEPTEMBER 2025

Plug Power acquires specialty stack manufacturing company

Plug Power completed the acquisition of a specialty electrolyzer stack manufacturing company with proprietary catalyst coating technology. The deal brought advanced manufacturing capability in-house, expanding Plug Power's domestic stack production capacity considerably beyond its prior direct manufacturing footprint. across its domestic manufacturing operations, expanding output meaningfully.
Signal: Domestic manufacturing capability is becom
JUNE 2025

Nel ASA signs supply agreement with green ammonia developer

Nel ASA entered a multi-year supply agreement to provide electrolyzer stacks across a green ammonia developer's multiple planned production facilities. The agreement was a commercial supply contract, not a joint venture or equity transaction, covering stack supply across the developer's full announced project pipeline. across the developer's full announced expansion.
Signal: Multi-year, multi-project supply agreement

Iridium And Precious Metals Catalyst Exposure

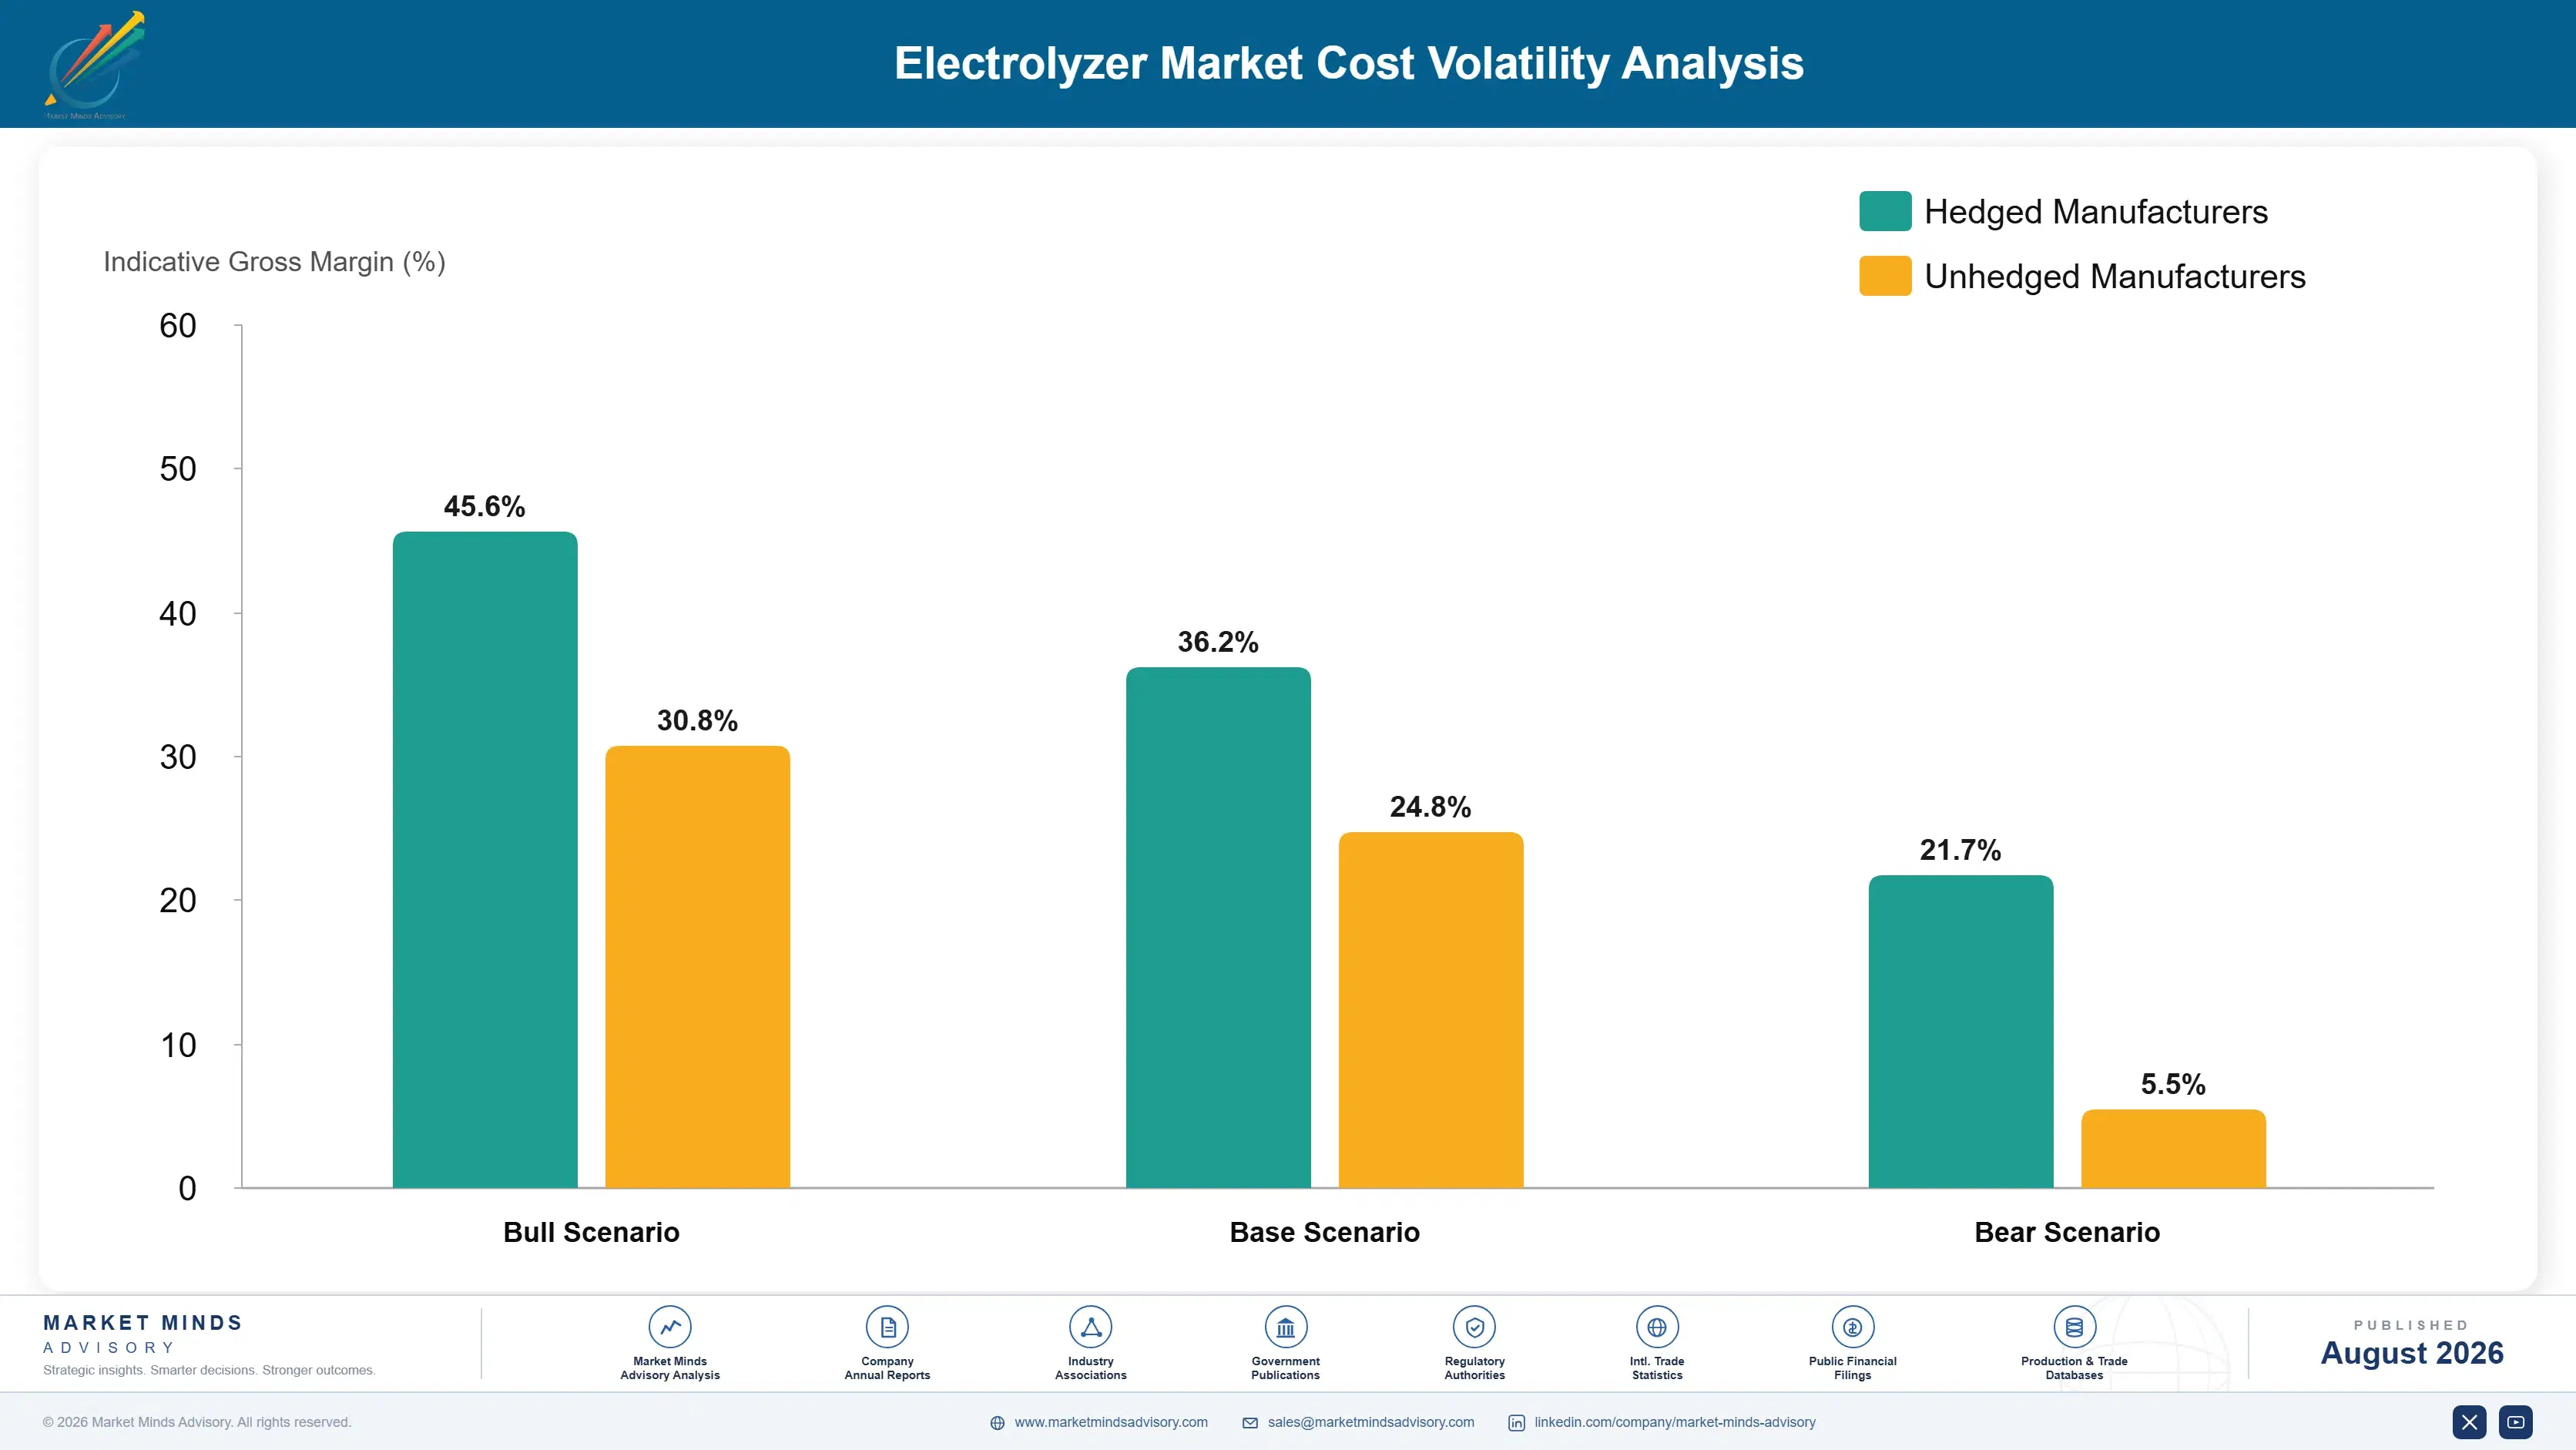
Iridium and platinum group catalyst materials used in PEM electrolyzer coatings run 20 to 28% of COGS on PEM systems specifically, sourced from a concentrated global supply base dominated by a small number of South African and Russian mining operations. Titanium bipolar plates and stack structural materials add a further 22 to 30%, with power electronics and control systems accounting for most of the remainder across all electrolyzer technologies.
The IEA's Global Hydrogen Review has repeatedly flagged iridium supply as a binding constraint on PEM electrolyzer manufacturing scale, noting announced gigawatt-scale PEM capacity would require iridium volumes exceeding current global mine production at current loading levels. ITM Power's 2022 Annual Report disclosed elevated catalyst material costs and supply chain constraints, attributing part of the pressure to precious metals price inflation and tightening availability that persisted through the year.

Exposure varies sharply by player type. Alkaline and solid oxide manufacturers face materially lower precious metals exposure than PEM specialists, giving them a durable cost advantage as catalyst prices rise across the broader precious metals market. Geography matters, since manufacturers with established precious metals relationships face less spot-price exposure than newer entrants buying on the open market.
electrolyzer-market-cost-volatility-analysis-1787302067857

Reduce Iridium Loading Through Catalyst Engineering

Reducing iridium loading per stack through improved catalyst coating techniques cuts precious metals exposure directly without requiring a full technology change. Several manufacturers have achieved meaningful loading reductions per stack over recent years, and further reduction remains an active engineering priority across the PEM manufacturer base. That progress is now closely tracked as a key competitive benchmark industry-wide.

Lock Precious Metals Supply Through Multi-Year Contracts

Fixed-volume, multi-year procurement contracts with established precious metals refiners smooth catalyst material costs across price cycles. Several manufacturers have moved a majority of their iridium and platinum purchasing onto contract pricing rather than spot markets since supply constraints tightened. That approach trades some upside during price dips for real protection against sharper spikes. Several have shifted meaningfully since 2022.

Shift Product Mix Toward Alkaline And Solid Oxide Technology

Alkaline and solid oxide electrolyzers use little or no iridium, giving diversified manufacturers a durable way to cut precious metals cost exposure over time simply by shifting sales mix as project developers increasingly weigh catalyst supply risk in technology selection. That shift also improves blended margin across manufacturers' diversified technology portfolios overall. Developers now weigh this factor explicitly.

Portfolio Architecture for Margin Defence

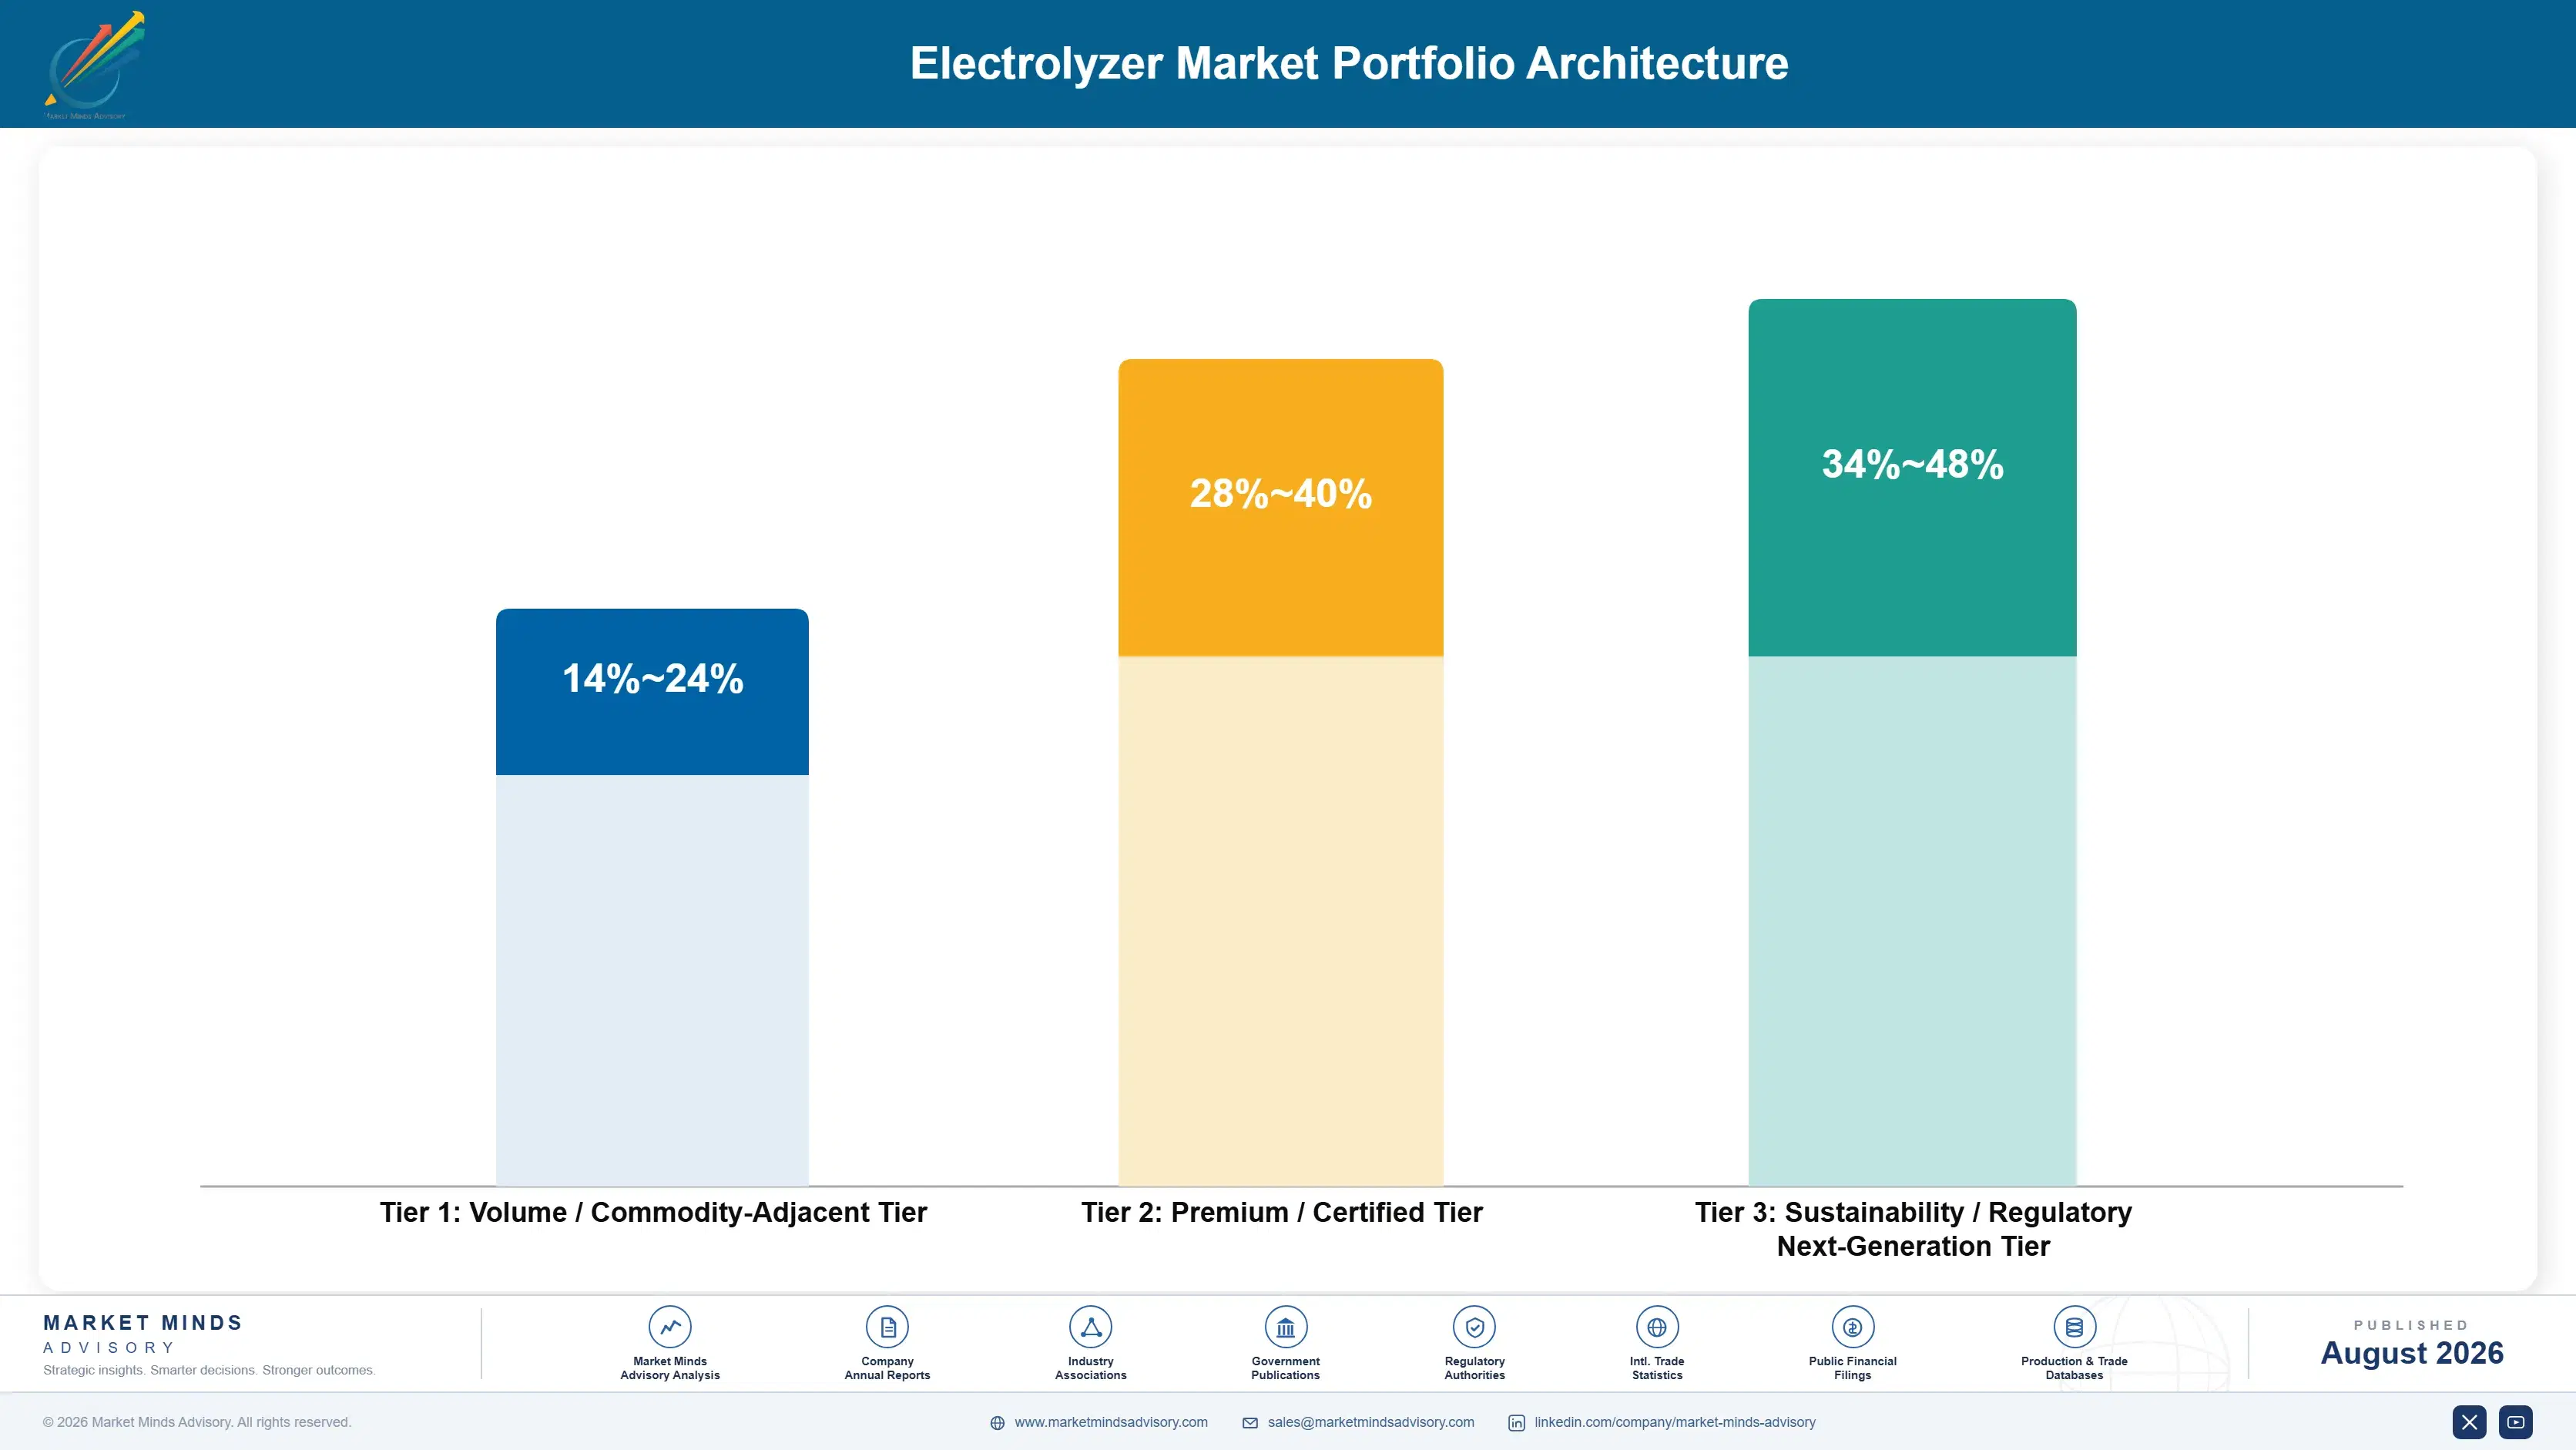
The portfolio splits into three tiers with real margin separation, and the gap between tiers has widened as catalyst efficiency becomes a genuine differentiator rather than a specification footnote. Volume-tier standard alkaline systems compete on price against Chinese manufacturing capacity and earn modestly. Premium PEM and lender-backed project supply earns considerably more because it solves a genuine bankability and performance problem that developers cannot engineer around cheaply.
The tension is between manufacturing volume and per-project engineering margin. Manufacturers selling standard alkaline systems into price-competitive tenders push hard on unit cost, while developers of gigawatt-scale green ammonia and industrial projects pay for performance guarantees and lender credibility rather than negotiating down to the last dollar on every megawatt. Manufacturers serving both buyer types run genuinely different sales motions under one brand.

High-value pools concentrate in solid oxide and AEM technology sold with performance guarantees and lender-backed project relationships, where switching cost is highest and price sensitivity lowest. Legacy standard alkaline business remains large in volume but persistently thin in margin, as Chinese manufacturing scale continues pressuring price across most standard technology tenders globally. Manufacturers without a credible next-generation roadmap risk being confined to the volume tier permanently.

Volume / Commodity-Adjacent Tier

Standard alkaline electrolyzer systems sold into price-competitive tenders, priced against Chinese manufacturing capacity. Margin stays thin because buyers negotiate primarily on cost per kilowatt. Buyers rarely differentiate between manufacturers on anything beyond cost per kilowatt delivered.
Gross Margin: 14-24%

Premium / Certified Tier

PEM systems and lender-backed project supply agreements sold into developers requiring documented performance guarantees. Buyers pay for reliability and bankability rather than for hardware alone. Lender due diligence and warranty terms matter as much as the hardware specification itself.
Gross Margin: 28-40%

Sustainability / Regulatory / Next-Generation Tier

Solid oxide and AEM technology sold into efficiency-critical and catalyst-scarcity-sensitive projects with domestic manufacturing incentive eligibility. Margin reflects both technology scarcity and policy support. Few manufacturers currently combine both elements convincingly at meaningful commercial scale.
Gross Margin: 34-48%
electrolyzer-market-portfolio-architecture-1787302068709

Offtake-Anchored Project Financing Demand

Demand behaves like project finance rather than a traditional annuity, because a single gigawatt-scale order converts years of pipeline engagement into revenue only once a developer secures offtake and clears final investment decision. That financing-gated demand pattern, combined with the underlying stack replacement and refurbishment demand it eventually generates, gives manufacturers a revenue profile that is lumpy in the near term but increasingly predictable as the installed base matures ac
Adoption depth varies sharply by end-use vertical. Green ammonia developers adopt fastest and deepest, since offtake agreements with fertiliser and shipping fuel buyers give lenders the revenue certainty needed to finance gigawatt-scale procurement. Industrial decarbonisation projects with waste heat access follow closely on solid oxide adoption specifically. Smaller distributed hydrogen projects adopt more selectively, often favouring AEM or PEM technology for footprint reasons over absolute lowest cost.

Buyer profiles are shifting generationally. Procurement once sat with project developers evaluating technology on paper specifications alone; it now increasingly involves project lenders and offtake counterparties who specify performance guarantees and manufacturer track record before a single stack is ordered. That shift moves the real purchasing decision earlier into the financing cycle and rewards manufacturers who can prove bankability credibly.
electrolyzer-market-end-use-penetration-index-1787302069321

Where Electrolyzer Value Concentrates

These are among the four positions where our research anticipates prominent divergence between winners and laggards over the coming forecast period. Each is grounded in the demand model, the regulatory perimeter, and the announced capacity pipeline.
01 / SOLID OXIDE TECHNOLOGY POSITIONING

Efficiency Leadership Now Decides Long-Run Category Position

Solid oxide electrolyzer cells are growing at 22.0%, about 1.52 times the market's 14.5% overall rate, and that gap is widening as manufacturers prove commercial-scale durability sufficient to satisfy project financiers. Manufacturers still anchored on mature alkaline technology alone risk losing the highest-efficiency, highest-margin industrial decarbonisation contracts to rivals offering proven high-temperature performance already validated in the field. The window to build credible solid oxide capability is closing within this forecast period, not the next one, and latecomers will find the largest reference projects already claimed.
02 / CATALYST SUPPLY STRATEGY

Reduced Iridium Dependence Is Becoming A Genuine Differentiator

Iridium scarcity increasingly constrains how much PEM manufacturing capacity the global catalyst supply chain can actually support, and manufacturers who reduce loading or shift toward lower-catalyst technologies capture cost advantage that translates directly into more competitive project bids. Those still dependent on high iridium loading will find their addressable market narrowing as developers increasingly weigh catalyst supply risk alongside technical performance in project selection decisions. That risk premium is already showing up in how project lenders price financing for iridium-dependent proposals specifically.
03 / LENDER ENGAGEMENT CHANNEL

Direct Lender Relationships Will Outcompete Developer-Only Sales

Project lenders are increasingly folding manufacturer track record and performance guarantees into their own financing due diligence rather than relying entirely on developer representations, concentrating real decision influence in a small number of lender relationships that smaller manufacturers cannot easily access at comparable credibility. Manufacturers who engage lenders directly capture financial close acceleration and pricing power that developer-only sales relationships simply cannot replicate at comparable scale. Those without that lender credibility risk losing gigawatt-scale contracts to better-positioned, longer-established competitors with proven financing track records.
04 / REGIONAL MANUFACTURING PRICING

Chinese Manufacturing Scale Will Keep Pressuring Global Pricing

China's domestic alkaline manufacturing buildout has scaled fast enough to win price-sensitive standard technology tenders that global incumbents once assumed were theirs by default, and that pricing pressure is starting to spread into broader regional procurement decisions across Latin America and the Middle East as well. Manufacturers competing purely on price against fast-scaling Chinese entrants will struggle to hold margin over any meaningful time horizon. The more durable response is competing on catalyst efficiency and lender-backed bankability, categories where Chinese entrants still visibly lag behind global incumbents.

Engagement Snapshot From the Field

A live engagement with an industry participant carrying material or product regulatory and market exposure ahead of a defining policy shift, showing how our research translates into a defensible multi-year portfolio strategy.
MARKET MINDS ADVISORY · CLIENT ENGAGEMENT SUMMARY
Electrolyzer Producer Strategic Portfolio Review and Transition Roadmap 2026·Investment Scenario on Electrolyzer Exposure Evaluation 2025-26
CLIENT PROFILE
A green ammonia project developer planning a large-scale facility in a water-scarce region approached MMA while evaluating electrolyzer technology ahead of final investment decision. The client reported a project capital budget in the low single-digit billions, with electrolyzer procurement representing a substantial share of total project cost and sitting on the critical path to signing its lead offtake agreement (client-reported, unverified by MMA).
STRATEGIC CHALLENGE
The client's engineering team favoured PEM technology for its compact footprint and dynamic response to variable renewable power input, but the project's lead lender flagged iridium supply risk as a financing concern given the project's twenty-year offtake horizon. Management needed a technology decision that satisfied both engineering preferences and lender risk tolerance before the offtake agreement could be finalised.
MMA APPROACH
MMA benchmarked PEM, alkaline, and AEM technology against the project's specific water chemistry, variable renewable input profile, and footprint constraints, modelling levelised hydrogen cost under each technology option across the full twenty-year offtake horizon. We assessed iridium supply risk specifically against the client's planned procurement timeline and evaluated AEM technology as a potential middle path satisfying both engineering and financing requirements.
KEY FINDINGS
  1. PEM technology's dynamic response advantage mattered less than engineering had initially assumed, since the project's renewable power input profile included battery buffering that smoothed most of the variability PEM was originally selected to handle.
  2. AEM technology delivered footprint and dynamic response performance close enough to PEM for this specific application while avoiding the iridium supply risk the lender had flagged as a financing concern.
  3. Modelled levelised hydrogen cost across the twenty-year horizon favoured AEM technology once iridium price risk was incorporated into the PEM cost projection at a probability-weighted basis.
  4. The lender's financing terms improved measurably once the client presented a technology selection that explicitly addressed the catalyst supply risk originally flagged during due diligence (client-reported, unverified by MMA).
CLIENT PROFILE
A green ammonia project developer planning a large-scale facility in a water-scarce region approached MMA while evaluating electrolyzer technology ahead of final investment decision. The client reported a project capital budget in the low single-digit billions, with electrolyzer procurement representing a substantial share of total project cost and sitting on the critical path to signing its lead offtake agreement (client-reported, unverified by MMA).
STRATEGIC CHALLENGE
The client's engineering team favoured PEM technology for its compact footprint and dynamic response to variable renewable power input, but the project's lead lender flagged iridium supply risk as a financing concern given the project's twenty-year offtake horizon. Management needed a technology decision that satisfied both engineering preferences and lender risk tolerance before the offtake agreement could be finalised.
MMA APPROACH
MMA benchmarked PEM, alkaline, and AEM technology against the project's specific water chemistry, variable renewable input profile, and footprint constraints, modelling levelised hydrogen cost under each technology option across the full twenty-year offtake horizon. We assessed iridium supply risk specifically against the client's planned procurement timeline and evaluated AEM technology as a potential middle path satisfying both engineering and financing requirements.
KEY FINDINGS
  1. PEM technology's dynamic response advantage mattered less than engineering had initially assumed, since the project's renewable power input profile included battery buffering that smoothed most of the variability PEM was originally selected to handle.
  2. AEM technology delivered footprint and dynamic response performance close enough to PEM for this specific application while avoiding the iridium supply risk the lender had flagged as a financing concern.
  3. Modelled levelised hydrogen cost across the twenty-year horizon favoured AEM technology once iridium price risk was incorporated into the PEM cost projection at a probability-weighted basis.
  4. The lender's financing terms improved measurably once the client presented a technology selection that explicitly addressed the catalyst supply risk originally flagged during due diligence (client-reported, unverified by MMA).
RECOMMENDED STRATEGY
Phase 1: Phase 1 (0 to 3 months): Complete detailed technical evaluation of AEM technology against the project's specific water chemistry and renewable input profile. Phase 2: Phase 2 (3 to 9 months): Finalise technology selection and present updated project economics to the lead lender ahead of financial close. Phase 3: Phase 3 (9 to 24 months): Execute equipment procurement and construction against the finalised technology specification and financing terms., incorporating lessons from lender feedback throughout.
OUTCOME
The client selected AEM technology and reported improved financing terms from its lead lender compared with the original PEM-based proposal, attributing the improvement directly to the addressed catalyst supply risk. The project cleared final investment decision within the client's original target timeline (client-reported, unverified by MMA).

Frequently Asked Questions

Foundational context covering the market sizes, CAGR, scope, country, region and competition that inform every finding below. This section is provided to cover basics and most often pre-purchase conversations, answered from the MMA Primary Research Dataset.

What is the current size of the Electrolyzer Market?

The market was valued at USD 5.5 billion in 2025, with demand concentrated in green ammonia, industrial decarbonisation, and export-oriented hydrogen projects. Growth is closely tied to offtake financing and national hydrogen strategy support.

How large will the Electrolyzer Market be by 2036?

The market is projected to reach USD 24.41 billion by 2036, an expansion multiple of 3.88 times its 2026 value. Solid oxide technology drives much of that growth.

What is the CAGR for the Electrolyzer Market 2026 to 2036?

The base case CAGR is 14.5%, with a bull case of 15.9% and a bear case of 13.2%. The range reflects uncertainty around offtake financing and policy support.

Which segment is growing fastest?

Solid oxide electrolyzer cells grow fastest at 22.0%, about 1.52 times the overall market rate, as high-temperature operation delivers efficiency advantages in waste-heat-rich industrial applications.

Who are the major companies in the Electrolyzer Market?

Nel ASA, Thyssenkrupp Nucera, Cummins, ITM Power, and Plug Power lead the market, with concentration at CR5 44% reflecting genuine electrochemical engineering depth across the category.

Which country is growing fastest?

India grows fastest at 17.1%, driven by its National Green Hydrogen Mission and domestic manufacturing requirements tied to incentives. China remains the largest market by manufacturing capacity.

Report Segmentation Architecture

The full report scope spans multiple orthogonal segmentation dimensions, with cross-tabulated demand data provided for each dimension pair. Coverage extends further to regional breakdowns, trend trajectories, and the competitive detail needed to support segment-level decision-making.

By Electrolyzer Technology

  • Alkaline Electrolyzers
  • PEM Electrolyzers
  • Solid Oxide Electrolyzer Cells
  • Anion Exchange Membrane Electrolyzers
  • Balance-of-Plant Systems and Components
  • Stack Replacement and Refurbishment Services

By End-Use Industry

  • Green Ammonia Production
  • Refining and Petrochemicals
  • Steel and Metals Decarbonisation
  • Power-to-Gas and Grid Balancing
  • Transport Fuel and Mobility

By Commercial Dimension

  • Gigawatt-Scale Project Supply Agreements
  • Standard System Sales
  • Performance Guarantee and Warranty Services
  • Stack Refurbishment Contracts

By Region

  • North America
  • Western Europe
  • East Asia
  • South Asia and Pacific
  • Latin America
  • Middle East and Africa
  • Eastern Europe

Scope, Methodology, and Coverage

Every figure in this report is reproducible from documented input assumptions. The scope below maps the historical period, the forecast horizon, the segmentation dimensions, and the countries covered, alongside the underlying primary and qualitative methodology.
Historical Period
2020 to 2025
Forecast Period
2026 to 2036
Base Year
2025 (USD billions; MMA Primary Research Dataset, August 2026)
Market Definition
The electrolyzer market comprises water electrolysis systems for hydrogen production, including alkaline, PEM, solid oxide, and anion exchange membrane electrolyzer technologies, together with the balance-of-plant power electronics, gas handling, and water purification components sold as part of complete electrolyzer stack and system packages. Downstream hydrogen storage, transport, and end-use equipment are excluded, as are the renewable power generation assets that feed the electrolyzer.
Quantitative Units
USD billions (current prices); installed and announced capacity in megawatts and gigawatts where applicable
Segmentation Dimensions
By Electrolyzer Technology; By End-Use Industry; By Commercial Dimension; By Region
Regions Covered
North America, Western Europe, East Asia, South Asia and Pacific, Latin America, Middle East and Africa, Eastern Europe
Countries Covered
USA, China, Germany, France, UK, Japan, South Korea, India, Australia, Canada, Brazil, Mexico, Indonesia, Vietnam, Thailand, Malaysia, UAE, Saudi Arabia, South Africa, Nigeria, Turkey, Poland, Netherlands, Italy, Spain, Sweden, Switzerland, Argentina, Colombia, Singapore, and additional markets relevant to this sector
Key Companies Profiled
Nel ASA, Thyssenkrupp Nucera, Cummins, ITM Power, Plug Power, McPhy Energy S.A., Sunfire GmbH, Bloom Energy Corporation, John Cockerill, Siemens Energy, Ohmium International, Enapter S.r.l., HydrogenPro ASA, Green Hydrogen Systems A/S, Longi Hydrogen Technology, Sungrow Hydrogen, Peric Hydrogen Technology, Elogen, Hystar AS, Topsoe A/S
Quantitative Methodology
Primary survey, n=3,800 respondents, Q4 2025, six countries; demand-side model with trade association cross-validation
Qualitative Methodology
47 expert interviews, Q4 2025; applied to validate demand model assumptions, identify emerging dynamics, and assess competitive positioning
Report Format
PDF and XLSX data workbook (Word format preview document)
Publisher
Market Minds Advisory
Report Code
MMA-2026-ENE-108
Published
August 2026
Contact
sales@marketmindsadvisory.com | www.marketmindsadvisory.com

Purchase the full Electrolyzer Market Report (2026 to 2036).

The full MMA Electrolyzer report sizes the market across six electrolyzer technologies, five end-use industries, four commercial dimensions, and seven regions through 2036. It profiles twenty participants on a consistent electrolyzer equipment revenue basis, scoring each on catalyst efficiency, manufacturing scale, and lender-backed project delivery capability. Scenario models quantify how offtake financing pace, national hydrogen strategy support, and iridium supply constraints move both demand and realised pricing. The report also includes delivered-cost modelling by electrolyzer technology and a project-financing benchmarking tool built for developers, lenders, and procurement teams.
Electrolyzer technology cost and efficiency benchmarking
Catalyst and iridium supply risk assessment framework
Green ammonia and industrial project pipeline tracker
National hydrogen strategy and incentive comparison model
Precious metals supply chain risk screen
Stack refurbishment and recurring service revenue model

Built For The People Who Decide

From boardroom strategy to bench-side execution, this report is read cover-to-cover by leaders shaping the next decade of their industry, turning demand scenarios, market dynamics and valuation benchmarks into decisions.
CXOs/ Presidents/ VPs/ Managers
M&A and Corporate Development
Strategy Teams and R&D Heads
Procurement and Product Directors
Regulatory and Compliance Leaders
Investor Relations and Equity Analysts