Market Minds Advisory
Cooling Water Treatment Chemicals Market

Cooling Water Treatment Chemicals Market: Service Contracts, Phosphorus Discharge Limits, and the Chemistry of Reusing Water Harder

Water scarcity is pushing industrial operators to reuse cooling water far harder than the chemistry was designed for, while discharge rules simultaneously remove the phosphorus compounds that made it possible.

Lead Analyst

Bilal Shaikh

Published

September 2026

Make Smarter Decisions with Customized Research Insights

Request a free sample report and evaluate market opportunities, growth trends, and competitive dynamics relevant to your business needs.

2025 MARKET VALUE$8.7BMarket Size 2025
2036 FORECAST VALUE$16.7BBase Case , 2026 to 2036
CAGR 2026 TO 20366.1 %Bull 7.3% / Bear 4.9%
INCREMENTAL OPPORTUNITY$7.5BNet 10- year value creation
EXPANSION MULTIPLE1.81x2036 value over 2026 base
Strategic Levers
M&A Pipeline
Regional Outlook
Country Rankings
Competitive Intelligence
Segmental Deep-dive
Call-Us : 91 93563 13602

Executive Snapshot and Market Trajectory

This is a service business that happens to sell chemicals. Roughly 68% of revenue arrives through contracted programmes bundling formulation, field testing, dosing equipment, and monitoring, and the chemistry itself is rarely what the customer is actually buying. They buy a clean heat exchanger and a technician who turns up.
Commercial power sits with providers holding field service density and monitoring platforms rather than with anyone able to blend the formulations. Biodegradable chelants and green polymers grow fastest at 10.8%, roughly 1.77 times the market, pulled by phosphorus discharge limits rather than by customer preference. East Asia holds 30% of global value, carried by Chinese power generation, steel, and petrochemical cooling loads. Service density decides the winners.
Concentration is high at roughly 47% for the top five, and contract renewal rates near 88% make displacement slow work for any challenger. Water scarcity is pushing operators toward higher cycles of concentration, which makes the water harder to treat and increases chemistry consumed per unit of makeup. Discharge rules are removing the tools that made it manageable. Discharge rules are removing exactly the chemistry that made high cycles manageable. Permits drive it.
Market Definition
The market comprises chemicals formulated for industrial and commercial cooling water systems, covering phosphonates and organophosphorus compounds, polymeric dispersants, azole and yellow metal inhibitors, oxidising biocides, non-oxidising biocides, and biodegradable chelants and green polymers. Value is measured at supplier level including contracted service programmes. Boiler water and steam chemicals, wastewater and effluent treatment, membrane and reverse osmosis chemicals, cooling equipment, and potable water treatment fall outside scope.
Base Year Value
$8.7B in 2025 (MMA Primary Research Dataset, August 2026)
Forecast Period
2026 to 2036, eleven discrete annual values
CAGR
6.1% base case. Bull 7.3%. Bear 4.9%.
Fastest Growth Segment
Biodegradable Chelants and Green Polymers: 10.8% CAGR
Fastest Growth Country
India: 9.2% CAGR
Fastest Growth Region
South Asia and Pacific: 8.4% CAGR
Largest Region
East Asia: 30% of 2025 global value
Market Leaders
Ecolab, Veolia Water Technologies, Solenis, Kurita Water Industries, and ChemTreat lead on cooling water treatment revenue. Source: company annual reports and MMA Analysis, July 2026.
Primary Survey
n=3,800 procurement and R&D decision-makers, Q4 2025, six countries
Methodology
Demand-side build-up, cross-validated against public data, 47 expert interviews

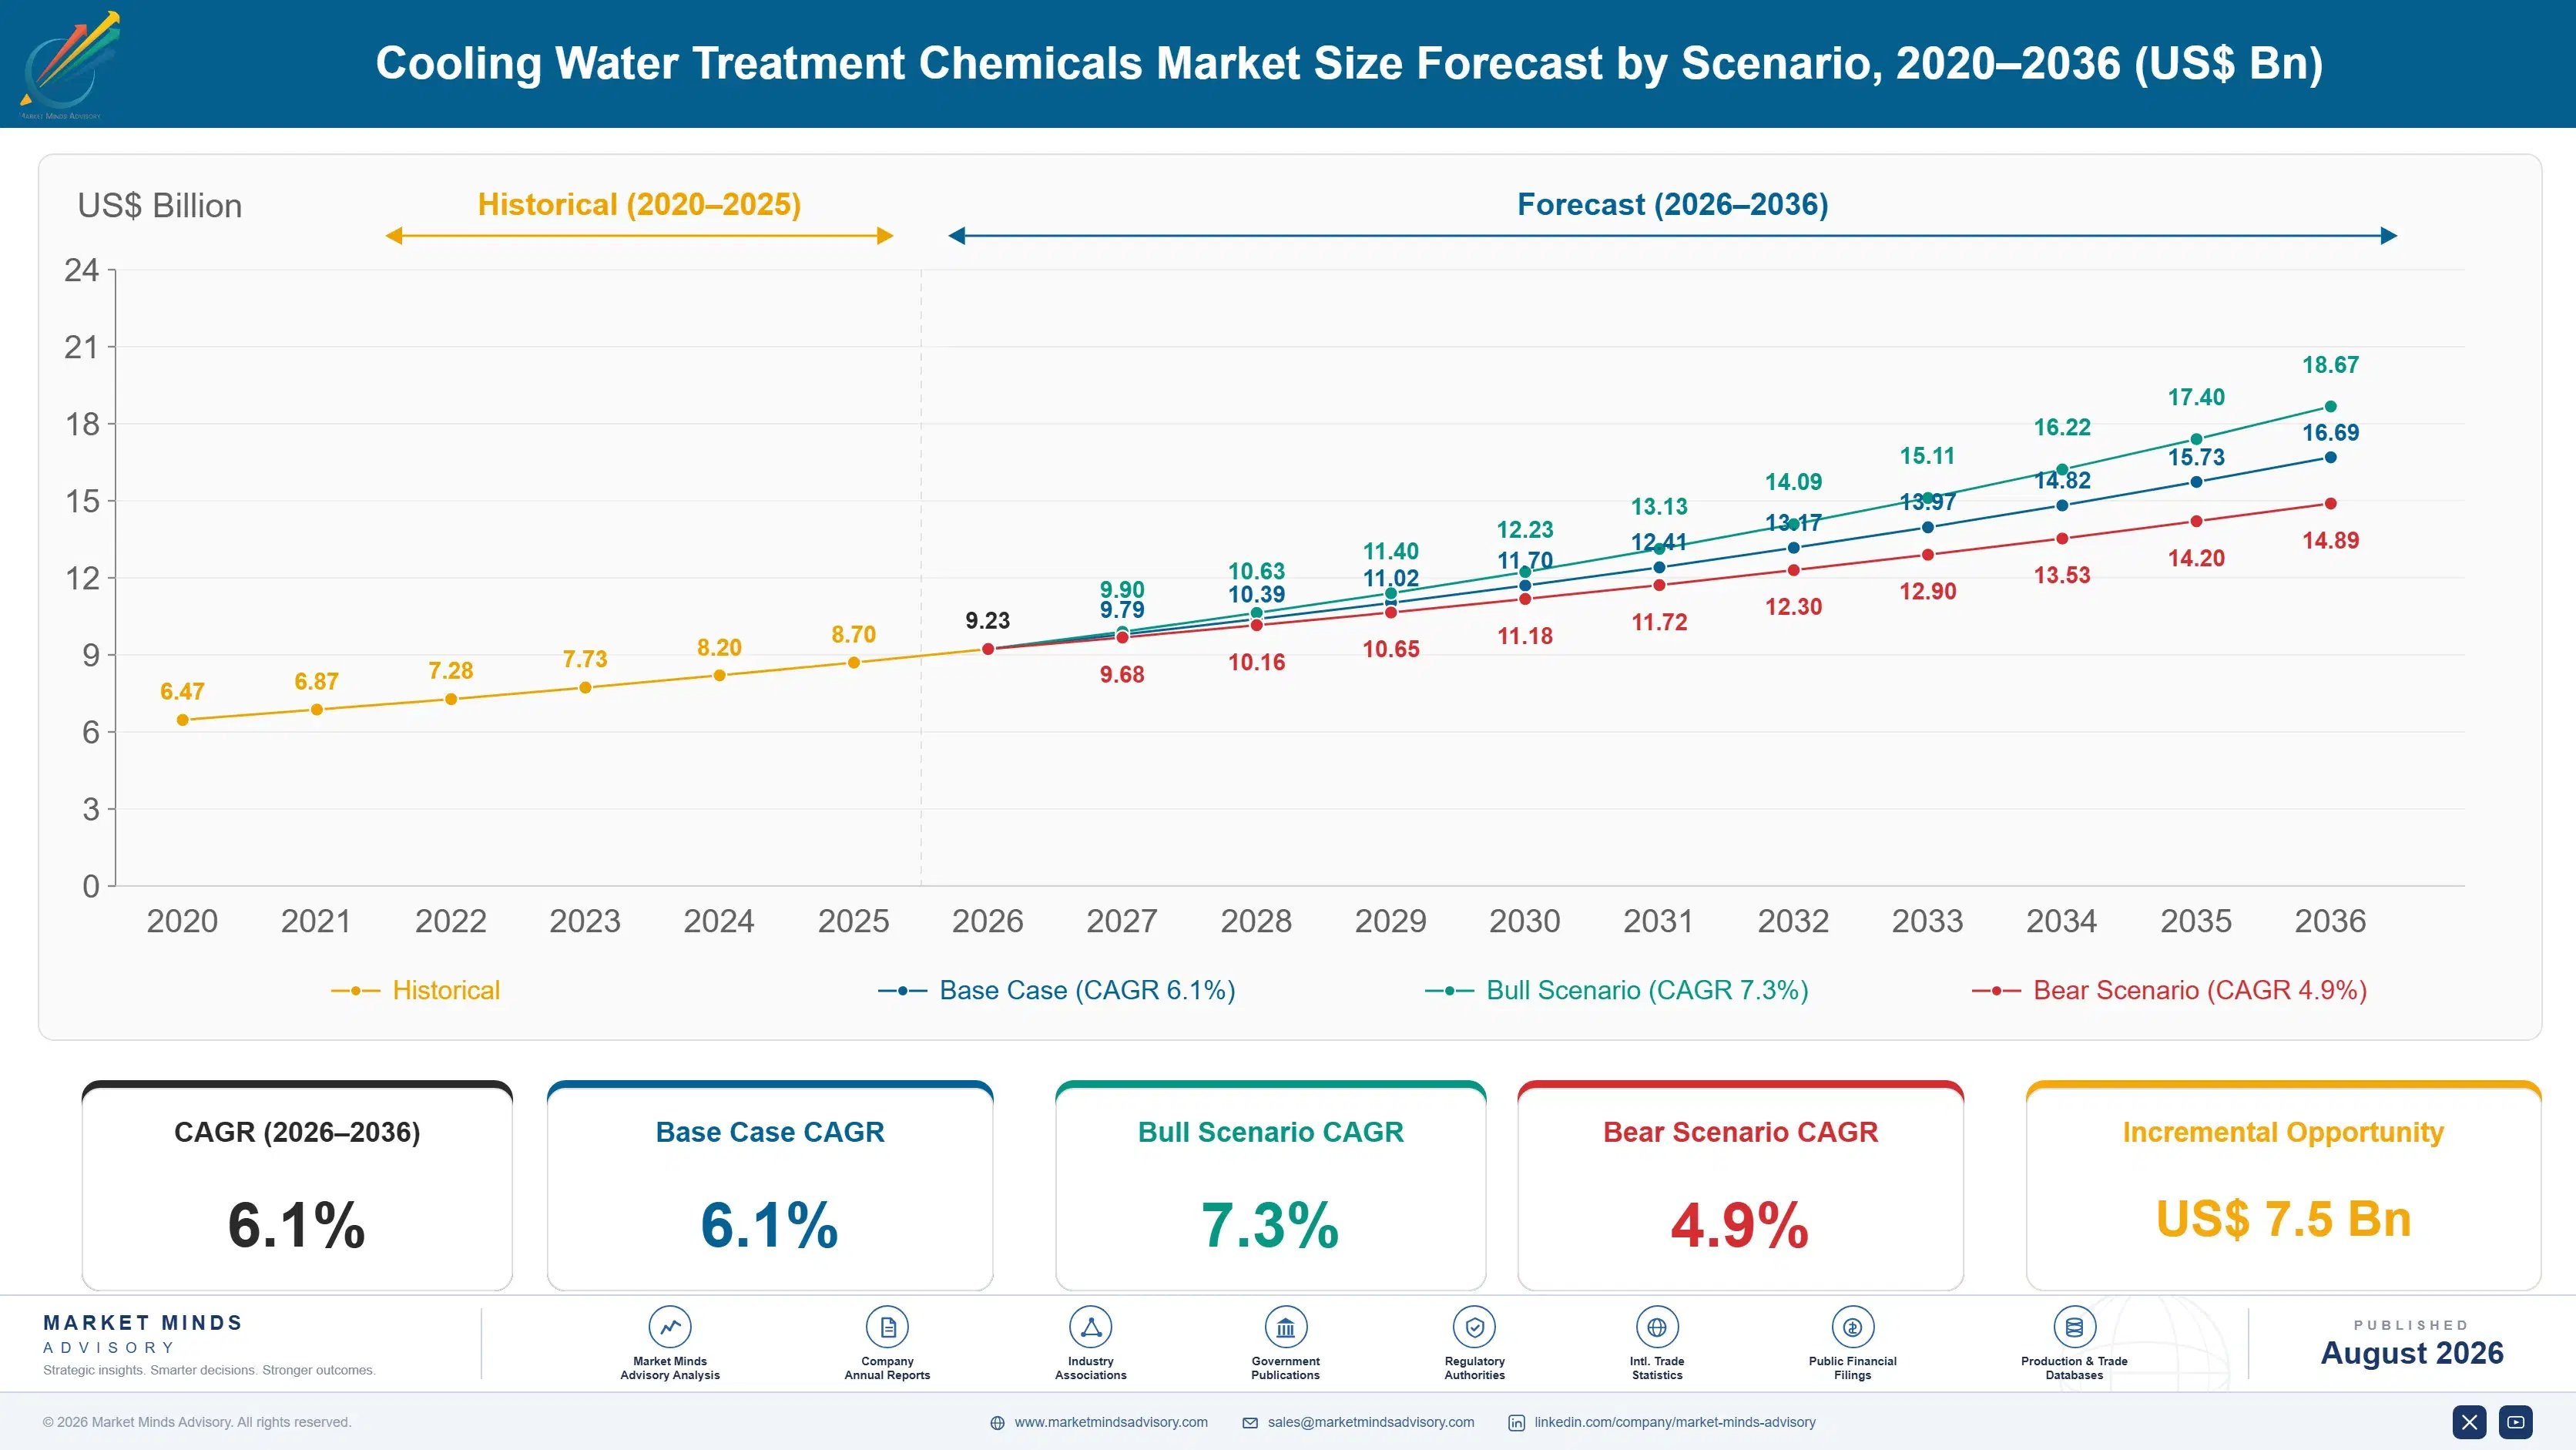
Cooling Water Treatment Chemicals Market Forecast Scenarios

cooling-water-treatment-chemicals-market-size-forecast-scenario-1787548990387
Between 2020 and 2025 the market grew on water constraint and regulation more than on industrial output. Cooling loads fell across European heavy industry while Asian capacity expanded, and drought pushed operators toward higher water reuse. Phosphorus discharge limits tightened in Europe and China. The 5.0% historical growth mixes Asian volume gains with reformulation value gains elsewhere.
The 6.1% base case rests on three mechanisms. Water scarcity keeps raising cycles of concentration, and every additional cycle makes the circulating water harder, more corrosive, and more expensive to treat per cubic metre of makeup. Discharge regulation is replacing cheap phosphonate chemistry with biodegradable chelants and polymers that cost considerably more. And data centre cooling adds a new demand pool with unusually demanding reliability requirements attached to it. Regulation and scarcity raise value without raising volume.
The 7.3% bull case assumes drought conditions persist and phosphorus limits extend to markets that currently lack them. The 4.9% bear case reflects shrinking European industrial cooling loads, data centres shifting toward air cooling, and procurement pushing programme pricing down. Neither case turns on industrial growth, which is unusual for a chemicals market. Public policy, not industrial growth, separates the two cases.

Selling Chemistry, Charging for Uptime

Three things set the commercial shape of this market. Service density comes first, because a programme means a technician visiting a site regularly, and a supplier without local coverage cannot serve the account whatever their chemistry costs. Water quality comes second, since makeup water composition determines the formulation and varies site by site. Discharge regulation comes third, and it is currently rewriting the chemistry everybody uses.
TOP-FIVE CONCENTRATION47%Share of global treatment chemical supply held by leading providers
AVERAGE PROGRAMME VALUEUSD 148,000Typical annual contracted spend per industrial cooling system site
SERVICE CONTRACT SHARE68%Portion of revenue delivered under contracted service programmes
PHOSPHONATE COST SHARE26%Phosphonate and polymer input within total formulation cost
CYCLES OF CONCENTRATION6.2Average water reuse ratio achieved across treated cooling systems
CONTRACT RENEWAL RATE88%Share of programme accounts retained at annual contract renewal
The service point explains the industry's structure. Customers do not buy corrosion inhibitor; they buy a guarantee that the heat exchangers stay clean, the tower does not foul, and nobody grows Legionella. That bundling makes accounts sticky, with renewal rates near 88%, and it makes displacement a matter of proving performance over months rather than quoting a lower price.
Water scarcity has changed the technical problem. Operators pushed to higher cycles of concentration are circulating water with several times the dissolved solids the systems were designed around, which raises scaling and corrosion risk together. That consumes more chemistry per cubic metre of makeup water and rewards providers who can hold performance in conditions that would previously have been considered unworkable.
"Every procurement department eventually decides that water treatment chemicals are a commodity and runs a reverse auction. About eighteen months later they have a fouled condenser, an unplanned outage, and a new appreciation for what they were actually buying. That cycle has funded this industry for forty years and shows no sign of breaking."
Practice Director, Water Treatment and Industrial Process Chemicals · MMA Chemicals and Materials Practice · August 2026

Market Trends

Higher Cycles of Concentration Make Water Harder to Treat

Operators under water constraint now run cooling systems at an average 6.2 cycles of concentration, well above historical practice, and several run considerably higher. Every cycle raises dissolved solids, hardness, and conductivity in the circulating water, which increases scaling and corrosion risk simultaneously rather than trading one against the other. Chemistry consumption per cubic metre of makeup rises accordingly, and formulations must work in conditions the original system design never contemplated. Providers who can hold performance at high cycles win accounts on technical grounds, which is unusual in a market that procurement keeps trying to commoditise.
Market Impact: Limits below 1 milligram per litre
Digital Monitoring Turns Programmes Into Continuous Relationships

Controllers now report conductivity, pH, oxidation reduction potential, and inhibitor residual continuously to a supplier platform rather than waiting for a technician's monthly test kit. That changes the commercial relationship in two ways. It catches problems before they become fouled exchangers, which is what customers actually pay for, and it produces a performance record that makes switching suppliers feel risky at renewal. Renewal rates near 88% owe as much to this data as to any chemistry advantage. The platforms also reduce service visit costs, improving margin on contracts already won.
Market Impact: Grows above 12% annually

Market Opportunities and Growth Drivers

Phosphorus Discharge Limits Force Wholesale Programme Reformulation

European water framework rules, Chinese discharge standards, and several American state permits have all tightened phosphorus limits on cooling tower blowdown, and phosphonates are the industry's traditional scale and corrosion workhorse. Reformulating toward biodegradable chelants and green polymers costs considerably more per treated cubic metre, which raises market value without raising treated volume at all. It also reopens accounts, because a reformulation is one of the few moments a customer genuinely re-evaluates their supplier. Providers with proven non-phosphorus programmes are using those moments to displace incumbents. Reformulation deadlines are published years ahead.
Market Impact: Dossiers cost above $5 million

Data Centre Cooling Adds Demand With Demanding Reliability Requirements

Evaporative and hybrid cooling at hyperscale data centres consumes large volumes of treated water, and the reliability requirement is unlike anything in traditional industry. A fouled heat exchanger in a refinery costs efficiency; in a data centre it threatens uptime that carries contractual penalties measured in millions. Operators pay accordingly and specify tightly. Water scarcity concerns around data centre siting also push toward higher cycles and reclaimed water sources, both of which make the treatment problem harder. This demand pool barely existed a decade ago and now grows faster than any traditional segment.
Market Impact: Auctions recur every 3 years

Market Restraints and Challenges

Biocide Registration Costs Have Consolidated Supply Sharply

The European Biocidal Products Regulation and comparable frameworks elsewhere require active substance dossiers costing millions per chemistry, and the review process runs for years. The root cause is regulatory design rather than any safety failure: the cost falls per active substance regardless of how much volume it carries, so smaller chemistries became uneconomic to defend. Several actives were simply withdrawn. That narrowed the formulator's toolkit precisely when resistant biofilms need more options. Providers mitigate by rotating remaining actives, combining oxidising and non-oxidising approaches, and investing in biofilm dispersant chemistry that avoids registration entirely.
Market Impact: Cycles average 6.2 and rising

Procurement Commoditisation Pressure Recurs on Predictable Cycles

Cooling water chemicals look like a commodity on a purchase order and behave nothing like one in a plant. The root cause is accounting: the chemical spend is visible in procurement systems while the avoided outage cost is not attributed anywhere. Reverse auctions and unbundling attempts recur every few years and typically reverse after a fouling or corrosion incident. Providers mitigate through performance-based contracting, documented savings reporting, and monitoring data that quantifies what the programme prevents. None of it stops the cycle recurring with each new procurement leadership. Documented savings reporting is the only real defence.
Market Impact: Supports 88% renewal rates
4 additional market trends, 3 additional growth drivers, and 2 additional restraints and challenges are covered in the full report. Contact sales@marketmindsadvisory.com to access the complete intelligence.

Segment CAGR and Growth Architecture

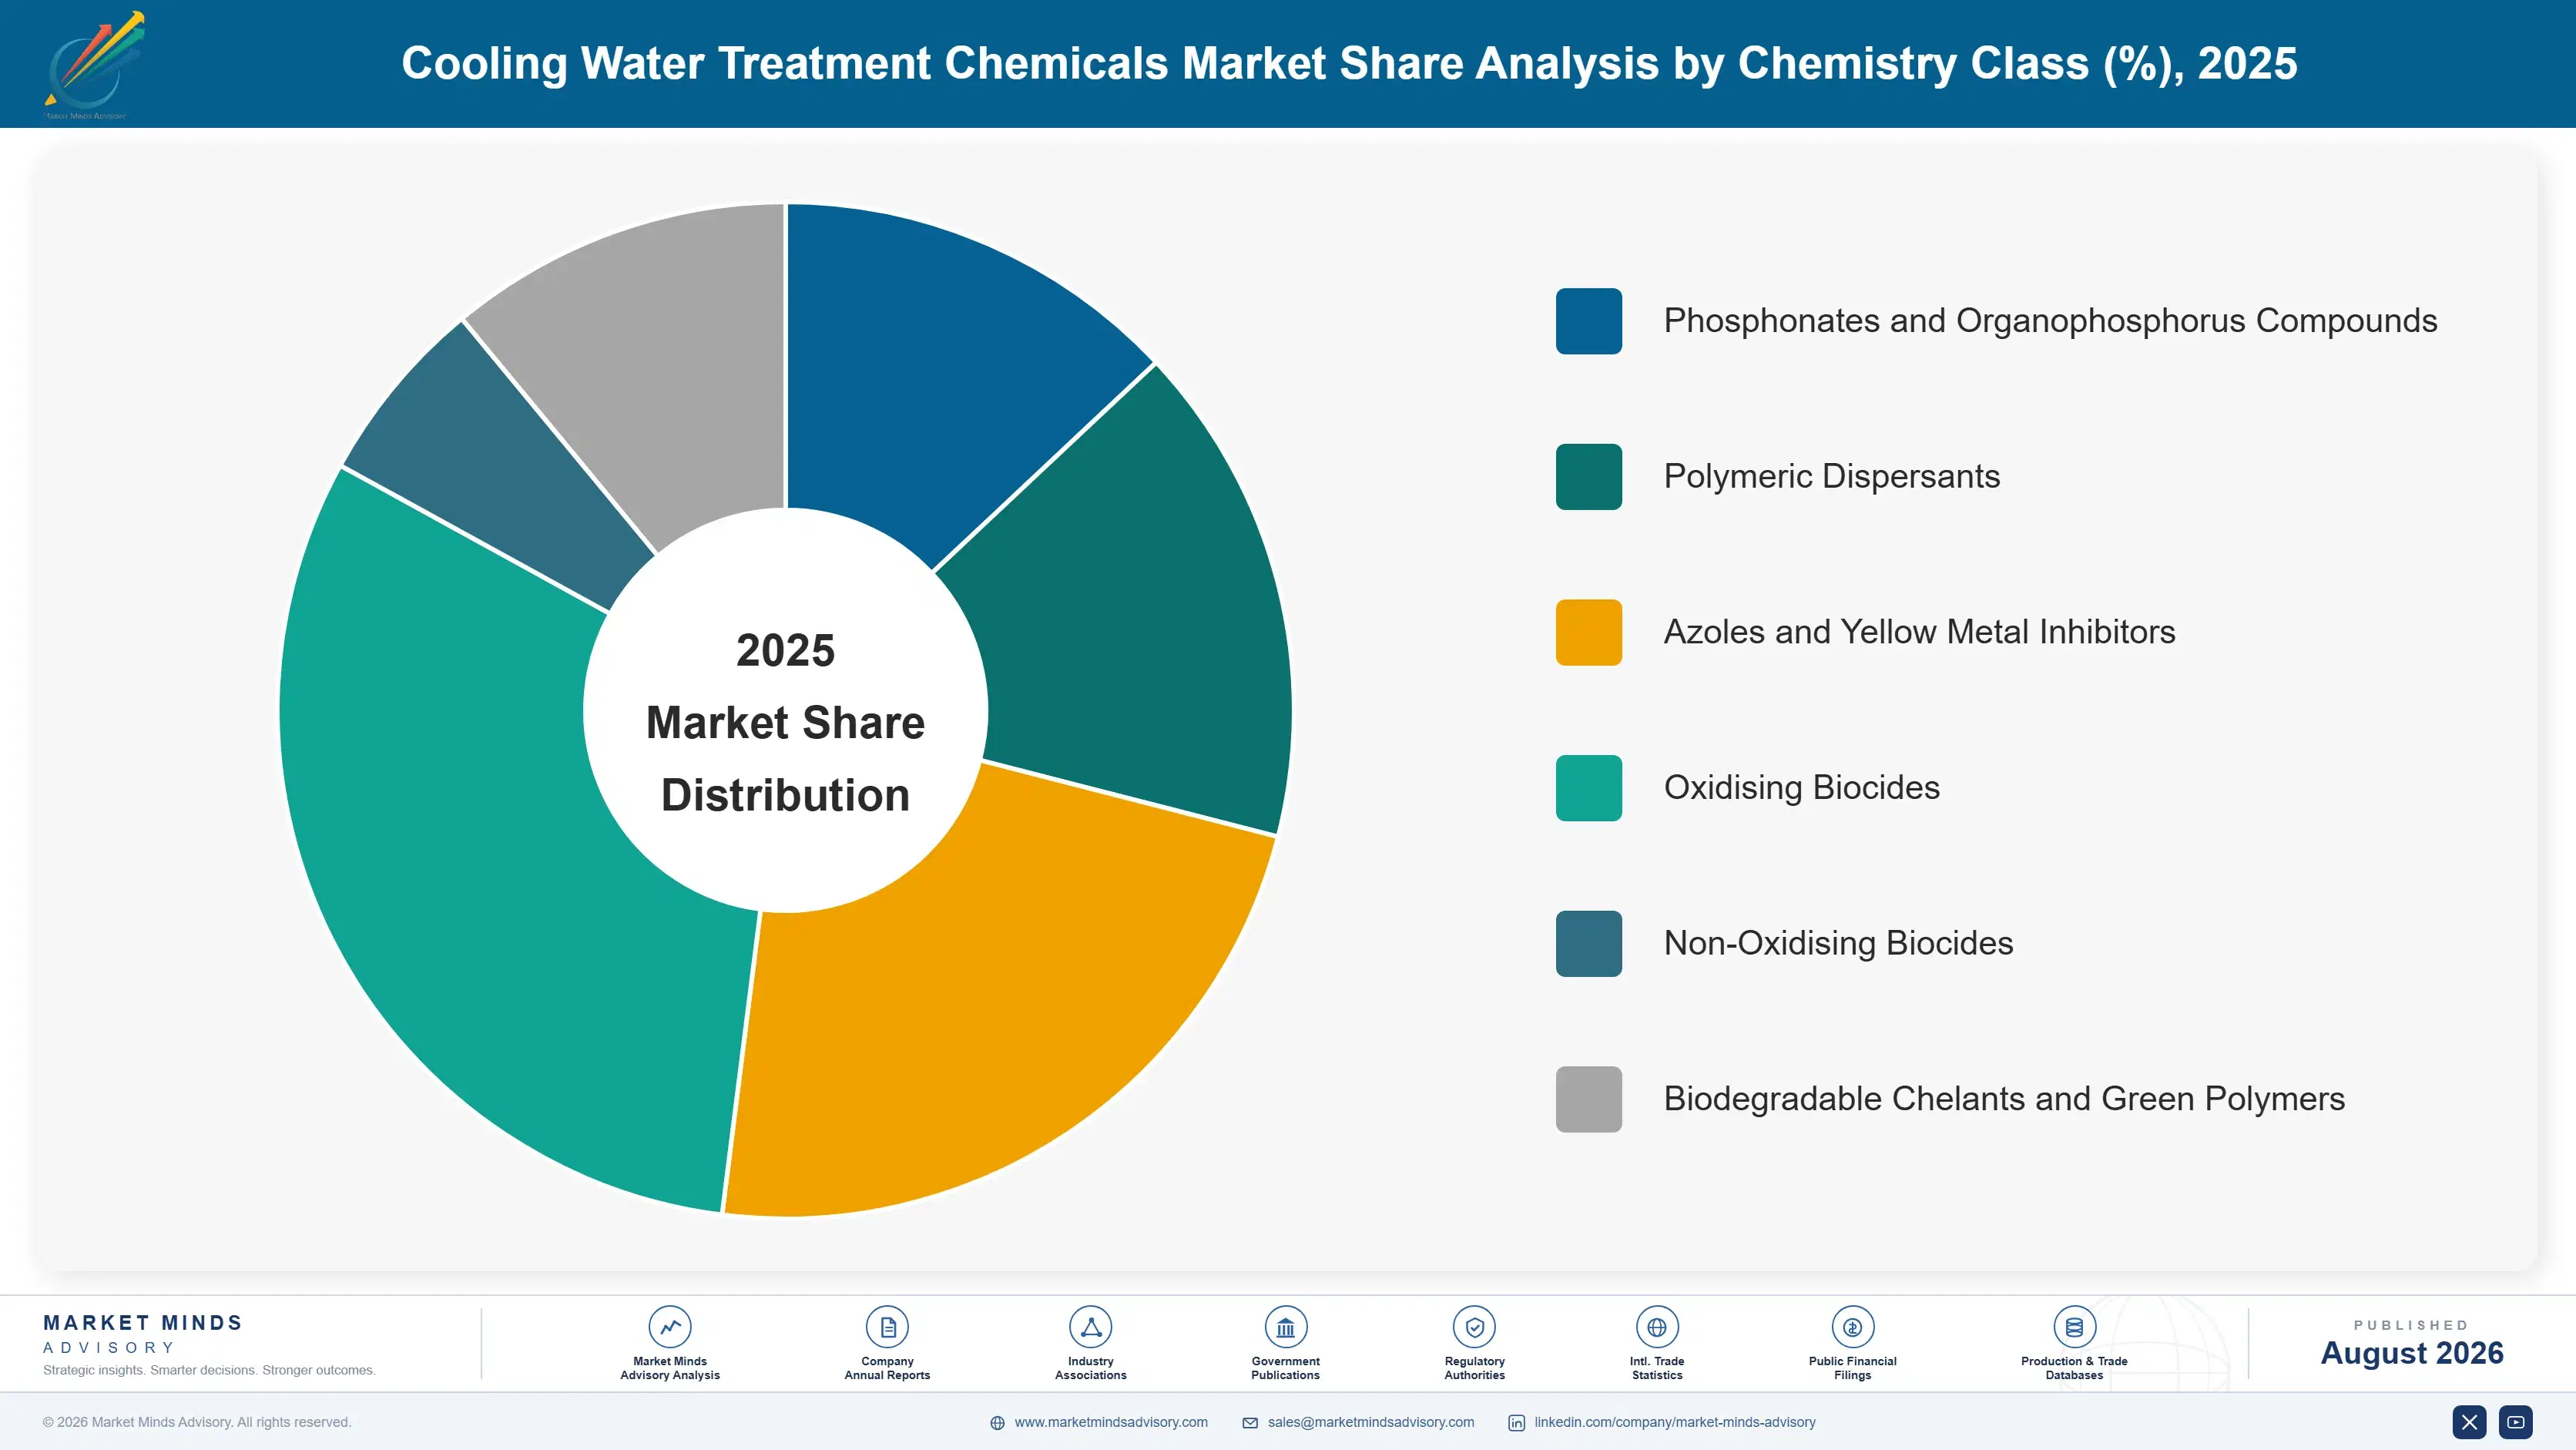
Segmentation follows chemistry class, because the active chemistry determines regulatory exposure, performance at high cycles, discharge implications, and cost per treated cubic metre. Six chemistry classes cover commercial supply, and they combine within programmes rather than competing directly, which means share shifts happen through reformulation rather than through substitution. Regulation moves the mix, and customers rarely choose it.
cooling-water-treatment-chemicals-market-market-share-analysis-1787548990927

Biodegradable Chelants and Green Polymers

The fastest-growing class at 10.8%, roughly 1.77 times the market, and growing on regulation rather than on performance advantage. Iminodisuccinate, glutamic acid diacetate, polyaspartate, and related biodegradable chemistries replace phosphonates where discharge limits make phosphorus unusable, and they cost meaningfully more per treated cubic metre while generally performing slightly worse on scale control. Customers adopt them because permits require it. That makes the growth unusually predictable, since it tracks regulatory schedules rather than purchasing decisions. Providers who developed proven non-phosphorus programmes early are using each reformulation as an opening to displace incumbents who have not. Adoption follows permit renewal dates rather than any commercial cycle, which makes demand easy to forecast and hard to accelerate through selling effort.
CAGR 10.8%

Non-Oxidising Biocides

Second fastest at 6.9%, covering isothiazolinones, dibromonitrilopropionamide, glutaraldehyde, and quaternary chemistries used where oxidising biocides cannot hold control. Higher cycles of concentration and increasing use of reclaimed makeup water both raise the microbiological load these products manage, and biofilm rather than planktonic bacteria is the real target. Regulatory registration cost has narrowed the available toolkit considerably, which supports pricing on the actives that survived review. Legionella management requirements across Europe and North America add a compliance dimension that makes this chemistry harder for customers to economise on than almost anything else in the programme. Rotation between actives to manage resistance keeps several chemistries in every serious programme, which supports the whole class rather than any single product.
CAGR 6.9%
Full segment breakdown across 6 segments available in the complete report.

Regional Architecture and Country Demand Map

Regional shares follow industrial cooling load and water constraint rather than economic size. Power generation, refining, steel, and petrochemicals dominate consumption, and how strictly discharge and Legionella rules are enforced explains most of the difference in value per treated cubic metre. Service model penetration varies just as widely.

North America

Refining, petrochemicals, and power generation supply the traditional demand base here, and much of it sits on infrastructure old enough that corrosion management rather than scale control is the daily problem. Data centre cooling has become the growth story, adding demand with reliability requirements that traditional industry never imposed and pricing to match. Drought conditions across the southwest have pushed operators toward higher cycles and reclaimed water, both of which raise chemistry consumption. Ecolab and ChemTreat hold dense field service networks that regional competitors cannot match on coverage. State-level phosphorus limits vary considerably, which fragments the reformulation timetable. Growth of 6.4% blends flat industrial cooling loads with genuinely fast data centre expansion.
Share: 25% | CAGR: 6.4% (2026 to 2036)

Western Europe

Regulation defines this market more than industrial activity does. Water framework phosphorus limits, the Biocidal Products Regulation, and national Legionella rules together make European programmes the most technically constrained and most expensive per treated cubic metre anywhere. Heavy industry cooling load has been shrinking as chemical and steel capacity closes or relocates, which offsets the value gains from reformulation. French, German, and Dutch operators run some of the most advanced non-phosphorus programmes in the world out of regulatory necessity rather than choice. Veolia and Solenis hold strong positions built on service depth. Growth of 4.6% is the slowest in the report and reflects contracting industrial demand rather than any regulatory easing.
Share: 19% | CAGR: 4.6% (2026 to 2036)
Regional intelligence for 5 additional markets available in the complete report: East Asia, South Asia and Pacific, Latin America, Middle East and Africa, Eastern Europe. Contact sales@marketmindsadvisory.com.
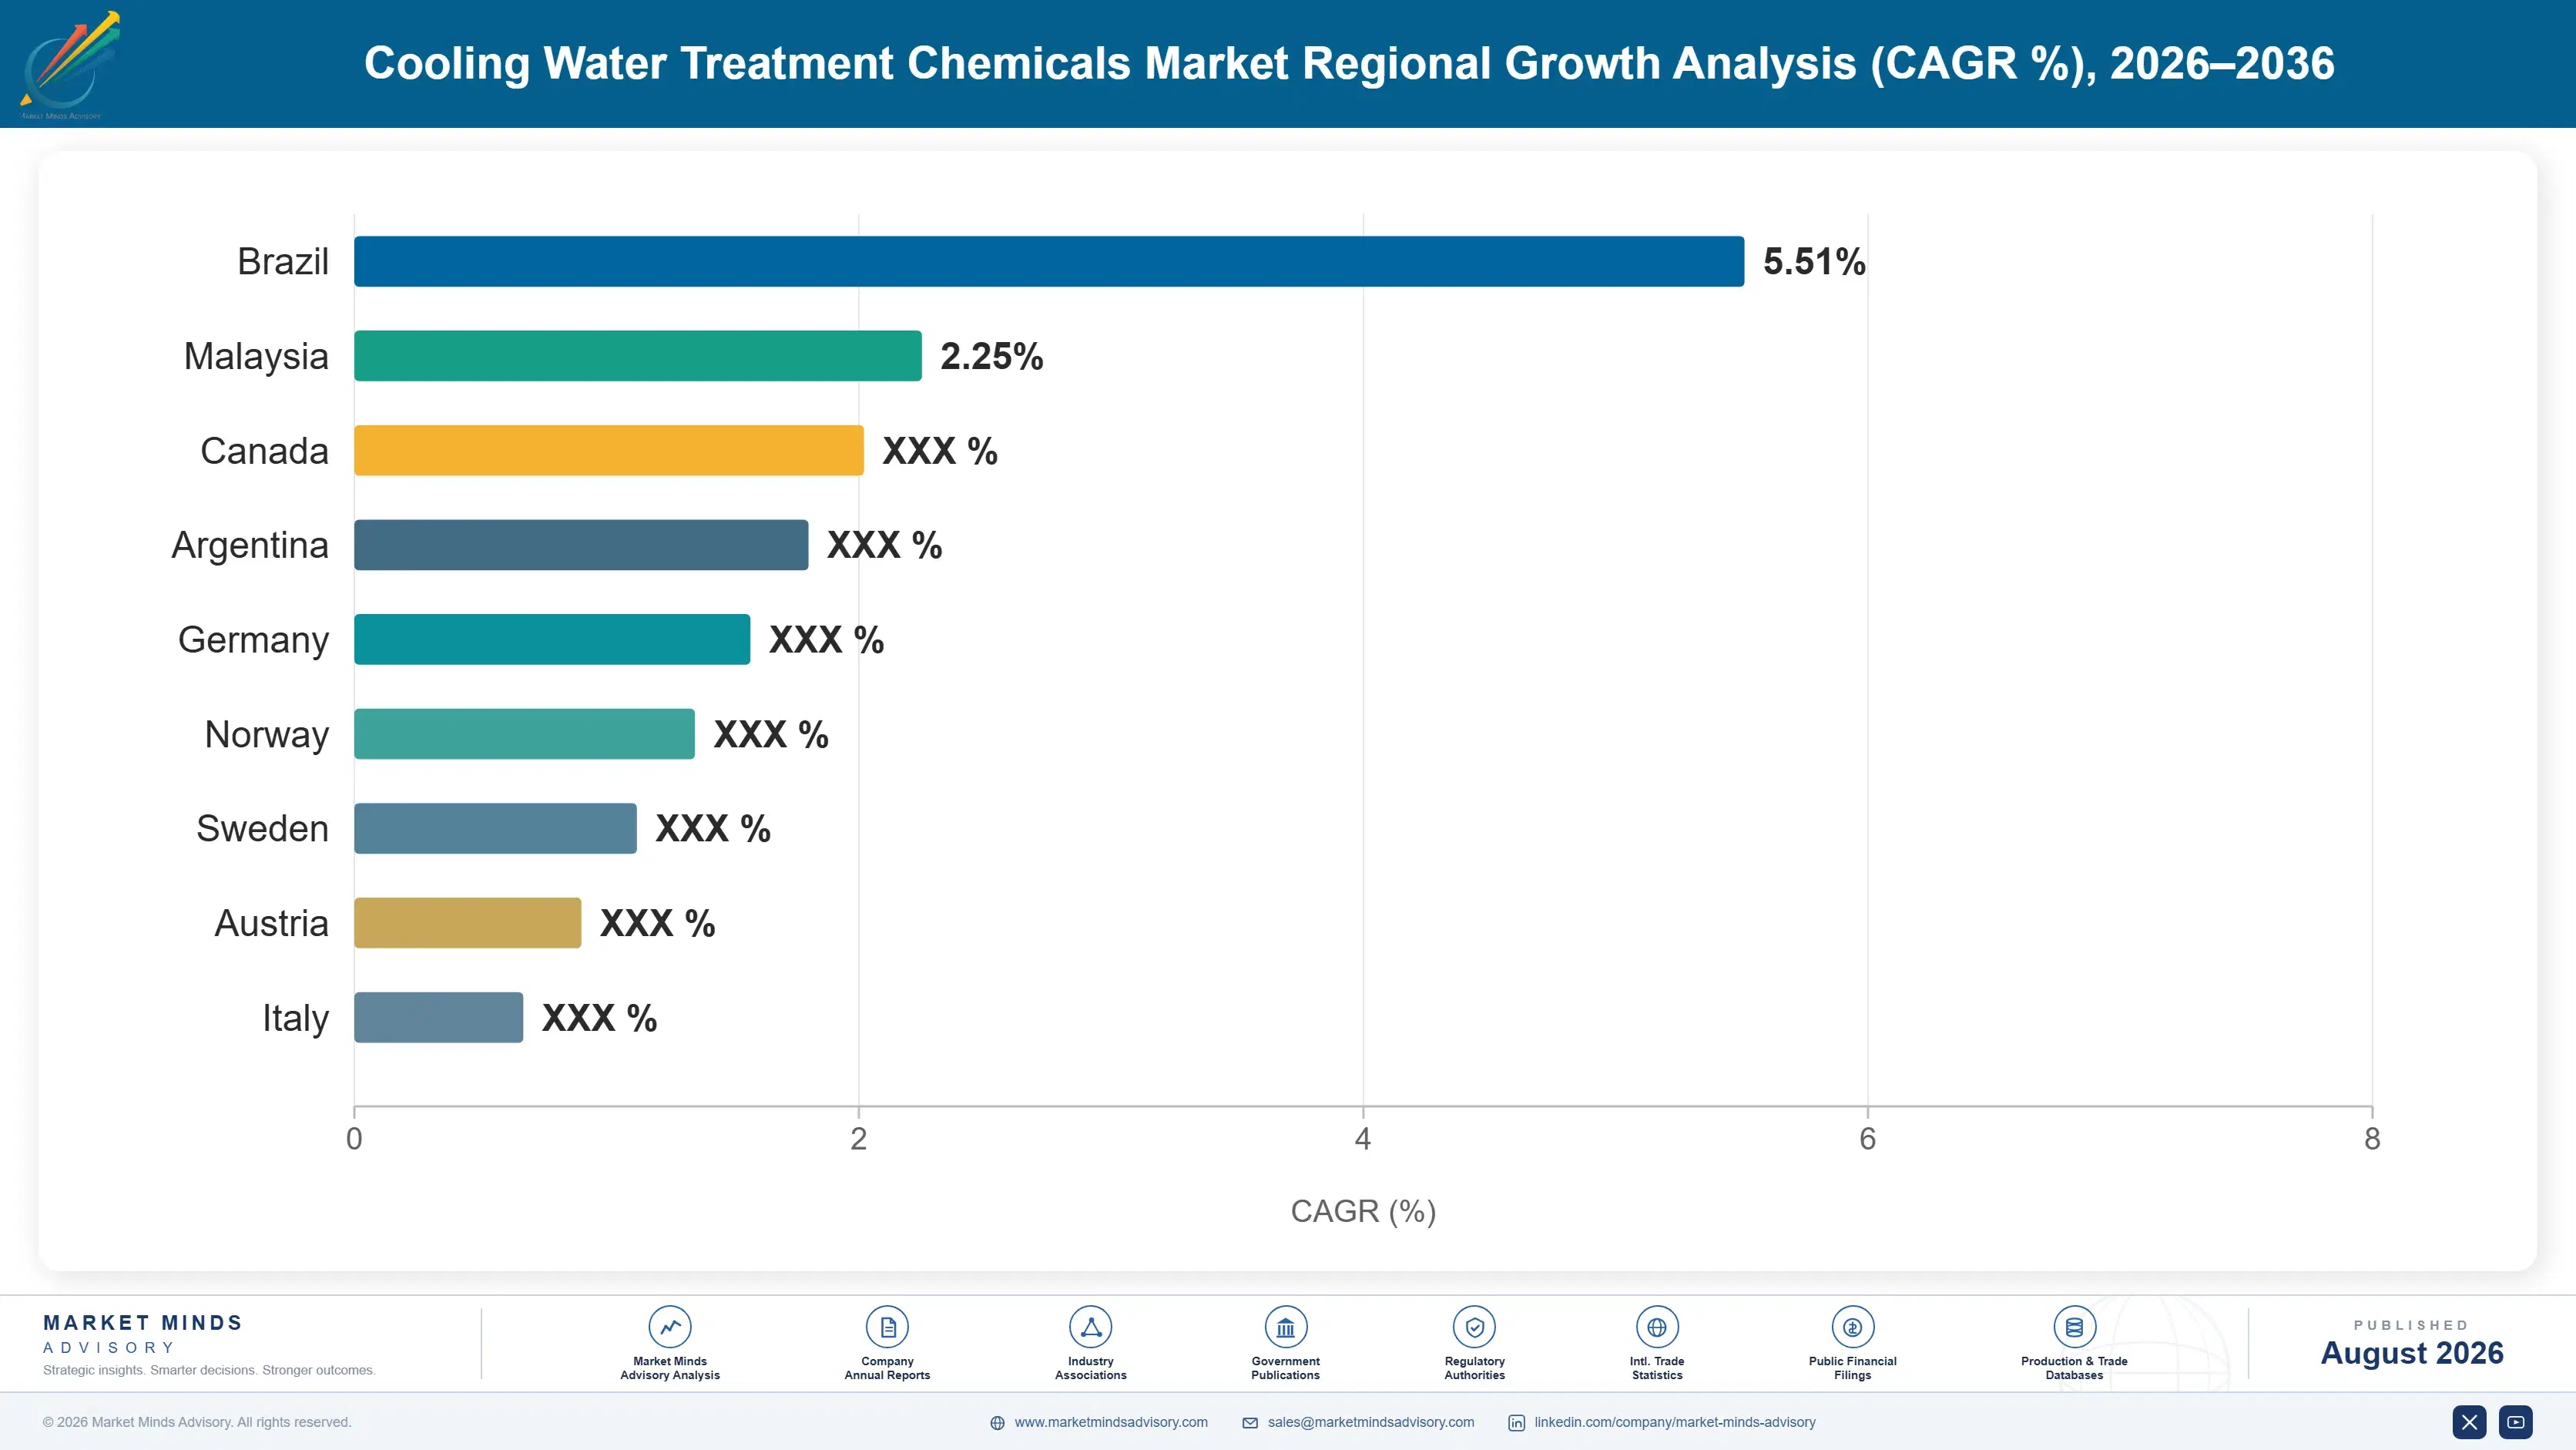
cooling-water-treatment-chemicals-market-country-cagr-analysis-1787548991447

Four Moves That Change the Economics

Advantage in this market comes from service density, monitoring data, and reformulation readiness rather than from chemistry innovation, which competitors match within a season. Four moves are worth capital and management attention across the forecast period, and three of them make accounts harder for any competitor to take. The fourth opens a customer type traditional industrial selling does not reach.

Attach monitoring platforms to every contracted account

Continuous controllers reporting conductivity, residual, and oxidation reduction potential cost perhaps $4,000 to $9,000 per installed system and pay back twice over. They cut service visit frequency, improving contract margin 5 to 9 percentage points, and they generate a documented performance record that makes switching feel risky when procurement runs its next review. Renewal rates near 88% across the industry owe more to this data than to any formulation advantage. Accounts without monitoring are the ones that get lost to reverse auctions, because nobody can demonstrate what the programme prevented.
Market Impact: Improves contract margin by 5 to 9 points

Build proven non-phosphorus programmes ahead of the rules

Phosphorus discharge limits are tightening on published timetables across Europe, China, and several American states, and reformulation is one of the very few moments a customer genuinely reconsiders their supplier. Providers arriving with documented non-phosphorus performance data displace incumbents who arrive with a proposal to develop something. Biodegradable chelant programmes cost 25 to 40% more per treated cubic metre, which raises account value at the same time. The development work must be finished before the deadline, not started at it, and the deadlines are entirely knowable in advance. Preparation is entirely a scheduling discipline rather than a technical gamble.
Market Impact: Raises account value by 25 to 40% overall

Specialise for high cycle and reclaimed water chemistry

Water constraint is pushing operators to 6.2 cycles on average and considerably higher in scarce regions, and reclaimed or desalinated makeup water introduces chemistry most programmes were never designed around. Providers who can hold corrosion and scale control under those conditions win on technical grounds rather than price, which is the only durable defence against procurement commoditisation. Programme value per site runs 30 to 50% above conventional accounts. The capability requires applications laboratories and field data rather than new manufacturing, so the investment is people and instruments. Field data from difficult sites is the real asset being built.
Market Impact: Lifts programme value by 30 to 50% overall

Target data centre cooling with uptime-based contracting

Hyperscale operators face contractual uptime penalties that dwarf any chemical spend, and they buy accordingly rather than through the procurement logic traditional industry applies. This demand pool grows above 12% annually and barely existed a decade ago. Contracting on guaranteed heat transfer performance rather than on delivered chemical volume aligns the commercial model with what the customer actually values and prices out competitors selling drums. Winning requires reliability references and rapid response coverage near data centre clusters, which is a deliberate footprint decision rather than a sales effort. Chemical cost barely features in the customer's decision at all.
Market Impact: Targets a demand pool growing above 12% annually

Who Controls the Margin Pool

Concentration is high: the top five hold roughly 47% of global cooling water treatment revenue, and field service density rather than chemistry portfolio separates them. Ecolab leads on service network reach and account coverage across industrial and commercial segments. Veolia competes with water technology breadth that extends well beyond chemicals, while Solenis, Kurita, and ChemTreat hold positions built on industrial specialisation and regional service depth respectively. None competes on chemistry cost in any account worth having.
Competitive activity runs on three fronts. Service coverage is the first, because a site needs a technician and coverage gaps simply exclude a bidder. Monitoring and data capability is the second, and it increasingly decides renewals rather than initial wins. Non-phosphorus reformulation readiness is the third, and it is where accounts are currently changing hands as discharge deadlines arrive. All three favour incumbents with scale.

Pressure is building from two directions. Regional and domestic suppliers, particularly across China and India, compete effectively where customers buy product rather than programmes. And equipment and controls companies are entering from the monitoring side, offering the data layer without the chemistry behind it. Whether either erodes the service-based positions is the open question.
cooling-water-treatment-chemicals-market-company-positioning-matrix-1787548991966

Competitive Moat and Risk Dimensions

ECOLAB

Moat: Service network density everywhere

The field service footprint reaches industrial and commercial sites at a density no competitor matches, which turns coverage itself into a barrier because a bidder without local technicians cannot credibly serve a multi-site account. Combined with monitoring data across an enormous installed base, it makes displacement a multi-year effort rather than a pricing decision.
ECOLAB

Risk: Exposure to procurement unbundling

A premium service model is precisely what procurement departments target when they decide chemicals are a commodity, and the industry sees that cycle every few years. Where customers succeed in separating chemical supply from service, the value proposition fragments and regional suppliers with lower cost bases become genuinely competitive on the product alone.
VEOLIA WATER TECHNOLOGIES

Moat: Water technology breadth beyond chemicals

Supplying equipment, membranes, reuse systems, and treatment chemistry together lets Veolia address a customer's whole water balance rather than one loop within it, which matters increasingly as scarcity forces operators to think about reuse across the site. That breadth is difficult to answer for competitors selling chemicals and service alone.
VEOLIA WATER TECHNOLOGIES

Risk: Integration complexity after consolidation

Absorbing a major water technology business alongside existing operations creates organisational complexity that competitors with simpler structures can exploit during the transition. Customers notice inconsistent service coverage and account ownership during integration periods, and specialist competitors are actively targeting exactly those accounts while the work continues.

Players Tracked

Prominent Players

Ecolab
Veolia Water Technologies
Solenis
Kurita Water Industries
ChemTreat

Other Key Players

BASF
Dow
Kemira
Italmatch Chemicals
Buckman Laboratories
Thermax
Ion Exchange India
Arkema
Lonza
Nouryon
Innospec
SNF Group
Clariant
Shandong Taihe Water Treatment Technologies
Chemtex Speciality

Recent Developments

MARCH 2025

Solenis expands non-phosphorus programme range

The company broadened its portfolio of phosphorus-free scale and corrosion programmes aimed at European and Chinese operators facing tightening discharge limits. The launch followed several years of field validation work, and it targets the reformulation moments when customers genuinely reconsider incumbent supplier relationships. Field data was the selling argument.
Signal: Discharge deadlines are the openings where accounts change hands, and prepared challengers are exploiting them deliberately
JULY 2025

Ecolab extends digital monitoring across industrial accounts

Additional connected controllers and analytics coverage were rolled out across industrial cooling accounts, extending a platform the company has developed over several years. The stated aim is reduced service visit frequency alongside documented performance reporting that customers can use internally at budget time. Coverage extends across four regions.
Signal: Monitoring data is becoming the renewal argument, quietly displacing chemistry performance as the primary retention mechanism
OCTOBER 2025

Kurita targets data centre cooling contracts

The company directed commercial resource toward hyperscale and colocation data centre cooling, an application with reliability requirements and pricing tolerance quite unlike traditional industrial accounts. Water scarcity concerns around data centre siting are pushing operators toward higher cycles and reclaimed makeup water. Contract structures differ markedly from industrial norms.
Signal: Data centres buy uptime rather than chemicals, which suits providers who can contract on performance guarantees

What Sets the Cost Base

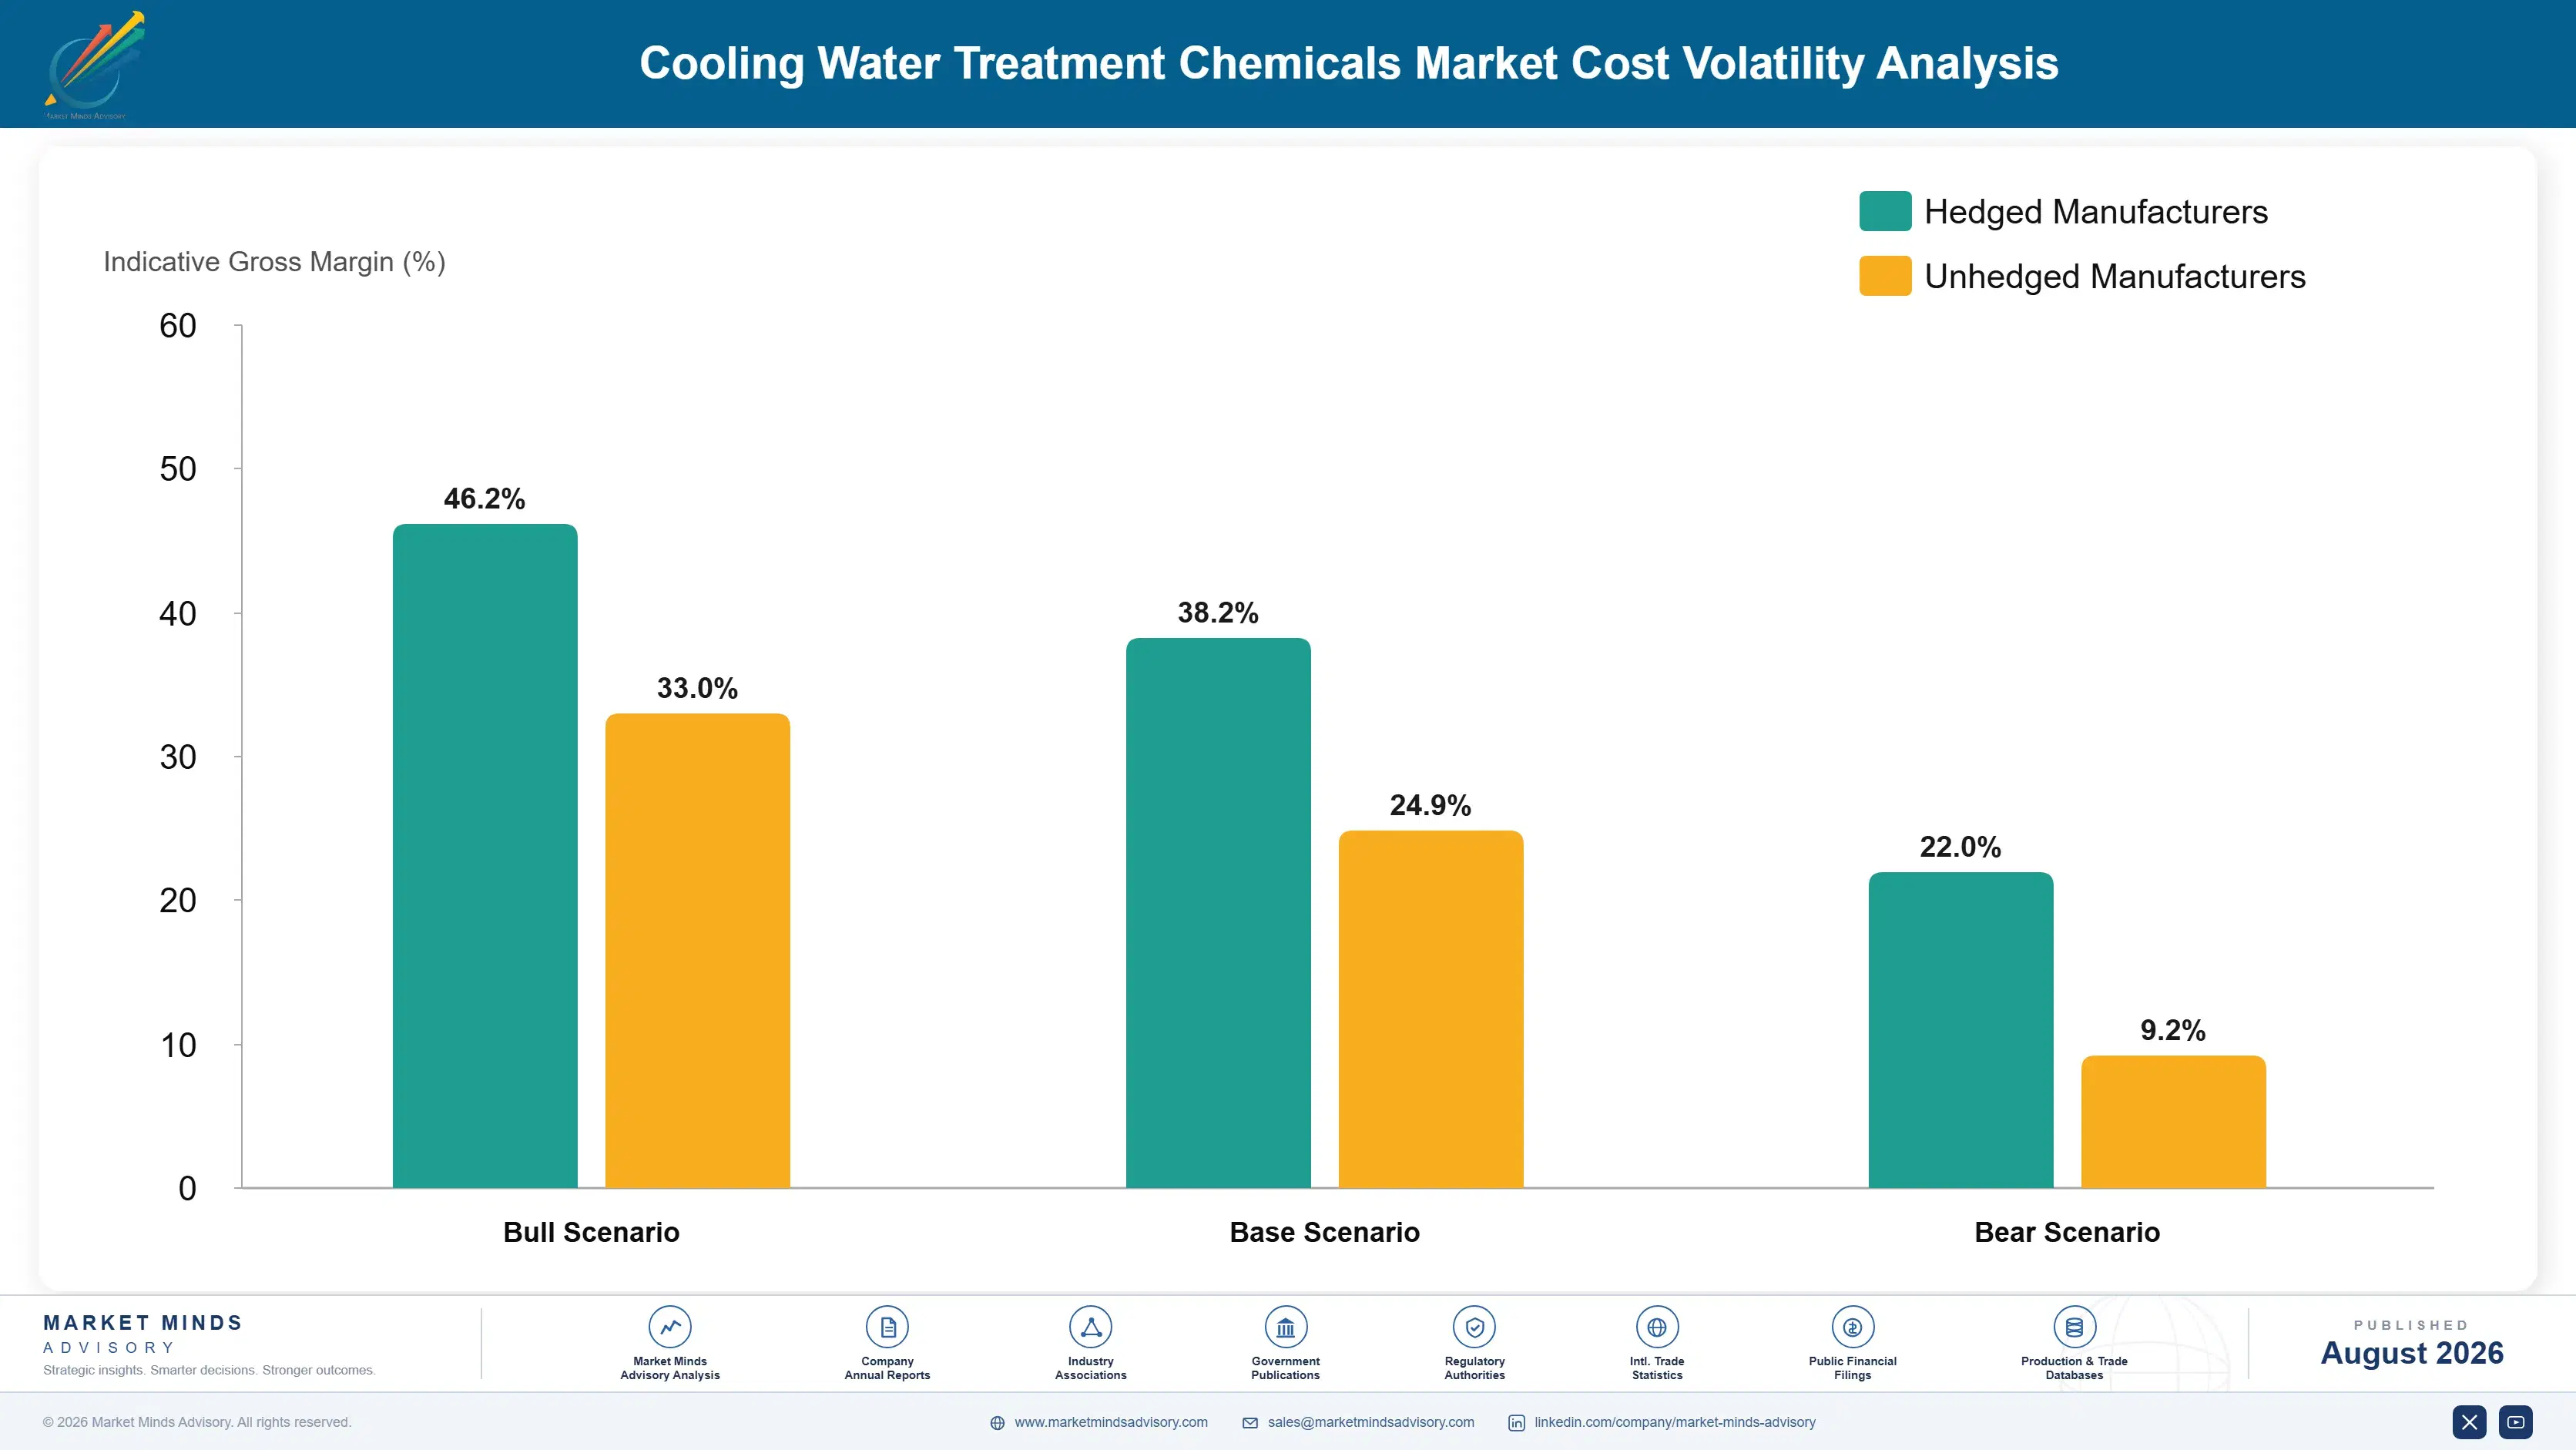
Phosphonates and polymeric dispersants together account for roughly 26% of formulation cost, both tracking phosphorus and acrylate feedstock markets. Biocide actives take a further 18%, a share inflated by registration costs recovered through pricing rather than by manufacturing economics. Field service labour is the largest single line at 31% across contracted programmes, which is what makes this a service business. Logistics, packaging, dosing equipment, and monitoring hardware absorb the balance.
Phosphorus feedstock volatility through 2021 and 2022 exposed the formulation side directly. Chinese export restrictions on phosphate products tightened supply while European energy costs raised conversion cost, and phosphonate pricing rose sharply across both years. Ecolab and Kemira both referenced raw material cost pressure and pricing actions across their reporting for that period. Annual fixed-price programmes could not reprice inside the contract year, compressing margin until renewal.

Exposure divides on contract structure rather than on chemistry sourcing. Providers running annual fixed-price programmes absorbed the full feedstock increase while those with index clauses passed it through within a quarter. Service labour cost varies enormously by region and is the dominant exposure in mature markets, where wage inflation matters far more than any chemical input. Product-only suppliers face the opposite balance.
cooling-water-treatment-chemicals-market-cost-volatility-analysis-1787548992161

Index programme contracts to published feedstock benchmarks

Annual fixed pricing left providers absorbing phosphorus and acrylate increases for up to twelve months during the last cycle. Indexing to published benchmarks moves that risk to customers better able to carry it across their whole input basket. Resistance is real in competitive tenders, and it softens considerably in the year following any severe raw material cycle.

Reduce service visit frequency through continuous monitoring

Field labour is 31% of programme cost and rises with regional wage inflation that no procurement action offsets. Connected controllers reporting continuously let providers move from scheduled visits to exception-based attendance, cutting visits materially without weakening control. The hardware pays back inside two years on most industrial accounts, and it improves the performance record at the same time.

Formulate around actives that survived regulatory review

Biocide registration costs are recovered in active pricing, and chemistries facing renewal review carry the risk of sudden withdrawal alongside their cost. Concentrating formulations on actives with secure registration status avoids reformulating an entire programme portfolio under deadline pressure. It narrows the technical toolkit, which biofilm dispersant chemistry partly compensates for without triggering registration.

Portfolio Architecture for Margin Defence

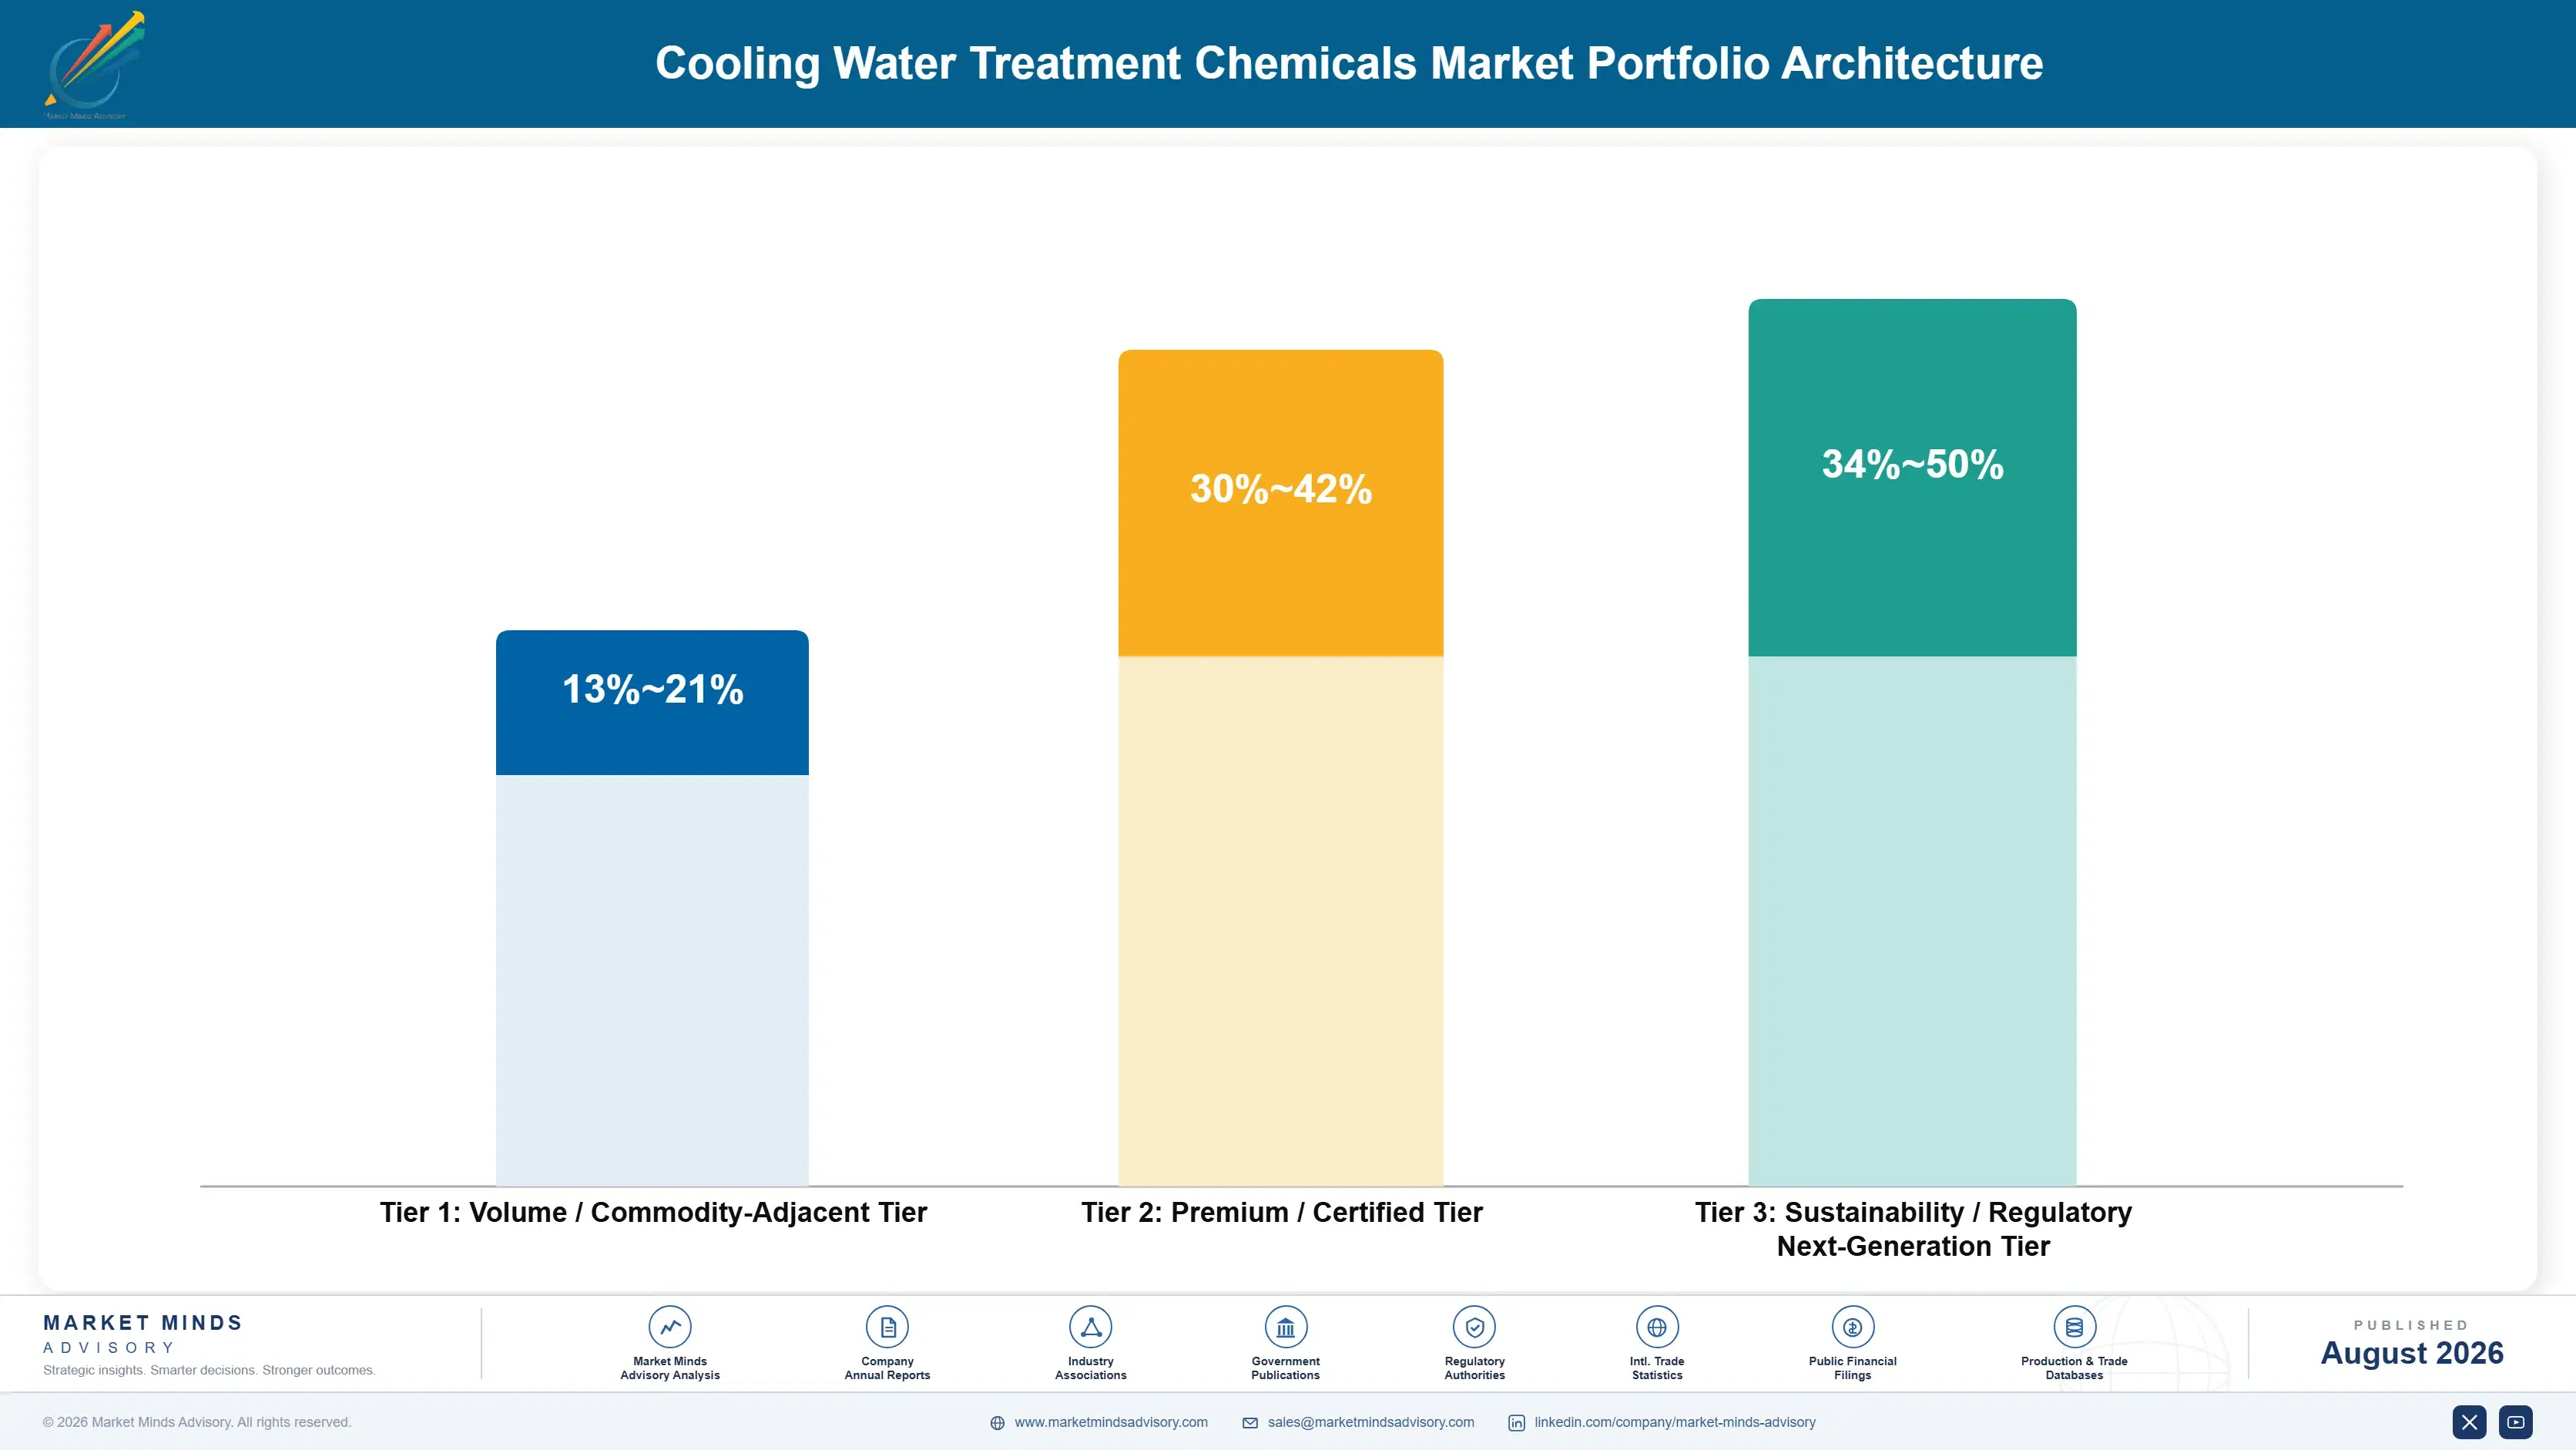
Margin follows service attachment rather than chemistry. Product-only supply into distributor and commodity accounts earns low to mid teens gross margin, because the formulations are well understood and buyers compare price per kilogram. Contracted programmes bundling chemistry, testing, dosing equipment, and monitoring earn roughly double, since the customer is buying heat exchanger cleanliness and outage avoidance rather than drums of inhibitor.
The volume and premium tension plays out in coverage economics rather than in plant loading. Service density is expensive to build and only pays above a certain account concentration in any given territory, so providers take marginal product-only business to justify the technician who serves the profitable programme accounts nearby. That works until a competitor with better route density undercuts the whole territory.

High-value pools concentrate in three places: high cycle and reclaimed water programmes, data centre cooling contracts, and non-phosphorus reformulation work. Each is defended by technical capability or reliability record rather than by price. Price competition arrives in each only when a competitor matches the applications capability, the reliability record, or the validated non-phosphorus data, and building any of those takes years rather than a quarter of commercial effort.

Volume / Commodity-Adjacent Tier

Product-only supply of standard inhibitors, dispersants, and oxidising biocides through distributors into price-led accounts. Competes on cost per kilogram. The range reflects large differences in feedstock position and regional manufacturing cost.
Gross Margin: 13%-21%

Premium / Certified Tier

Full contracted programmes bundling formulation, field service, dosing equipment, and monitoring with performance commitments. The customer buys outage avoidance rather than chemistry, and renewal rates near ninety percent follow from that.
Gross Margin: 30%-42%

Sustainability / Regulatory / Next-Generation Tier

Non-phosphorus biodegradable programmes, high cycle and reclaimed water chemistry, and uptime-guaranteed data centre contracts. Regulation and scarcity drive adoption. The range is wide because performance contracting terms vary enormously between accounts.
Gross Margin: 34%-50%
cooling-water-treatment-chemicals-market-portfolio-architecture-1787548992657

High-value Sub-segments and Strategic Watch-out

High Cycle and Reclaimed Water Programmes

Water scarcity forces operators into conditions conventional chemistry cannot hold, which turns the account into a technical sale rather than a price comparison. Programme value runs well above conventional sites. This is the strongest available defence against procurement commoditisation. Applications capability is what wins these accounts.
Gross Margin: 36%-48%

Data Centre Cooling Contracts

Uptime penalties dwarf any chemical spend, so operators buy reliability and pay for it without the usual procurement resistance. The pool grows above twelve percent annually from almost nothing a decade ago. Response coverage near clusters decides who can bid. Reliability references matter more than any pricing argument.
Gross Margin: 34%-46%

Standard Industrial Programme Accounts

The revenue foundation and the route density engine. These accounts justify the technician coverage that makes premium work servable, and they renew reliably while nobody runs a reverse auction. Defend them with monitoring data rather than with price. Instrument them before procurement schedules its next review.
Gross Margin: 28%-38%

Product-Only Distributor Supply

The strategic watch-out. Competes purely on cost per kilogram against regional producers with lower manufacturing cost and no service overhead to carry. It fills trucks and holds territory presence, and it should be priced for exactly that. Expect contribution and coverage, nothing beyond that. Nothing more.
Gross Margin: 13%-20%

How Demand Actually Reaches Providers

This is one of the best annuities in industrial chemicals. Cooling systems run continuously, chemistry is consumed continuously, and the contract renews annually with roughly 88% of accounts staying put. Nothing about the demand is project-linked or cyclical in the way equipment sales are, and a site once won generates revenue for as long as the plant operates. That predictability is why the sector attracts consistent investor interest despite unremarkable headline growth rates.
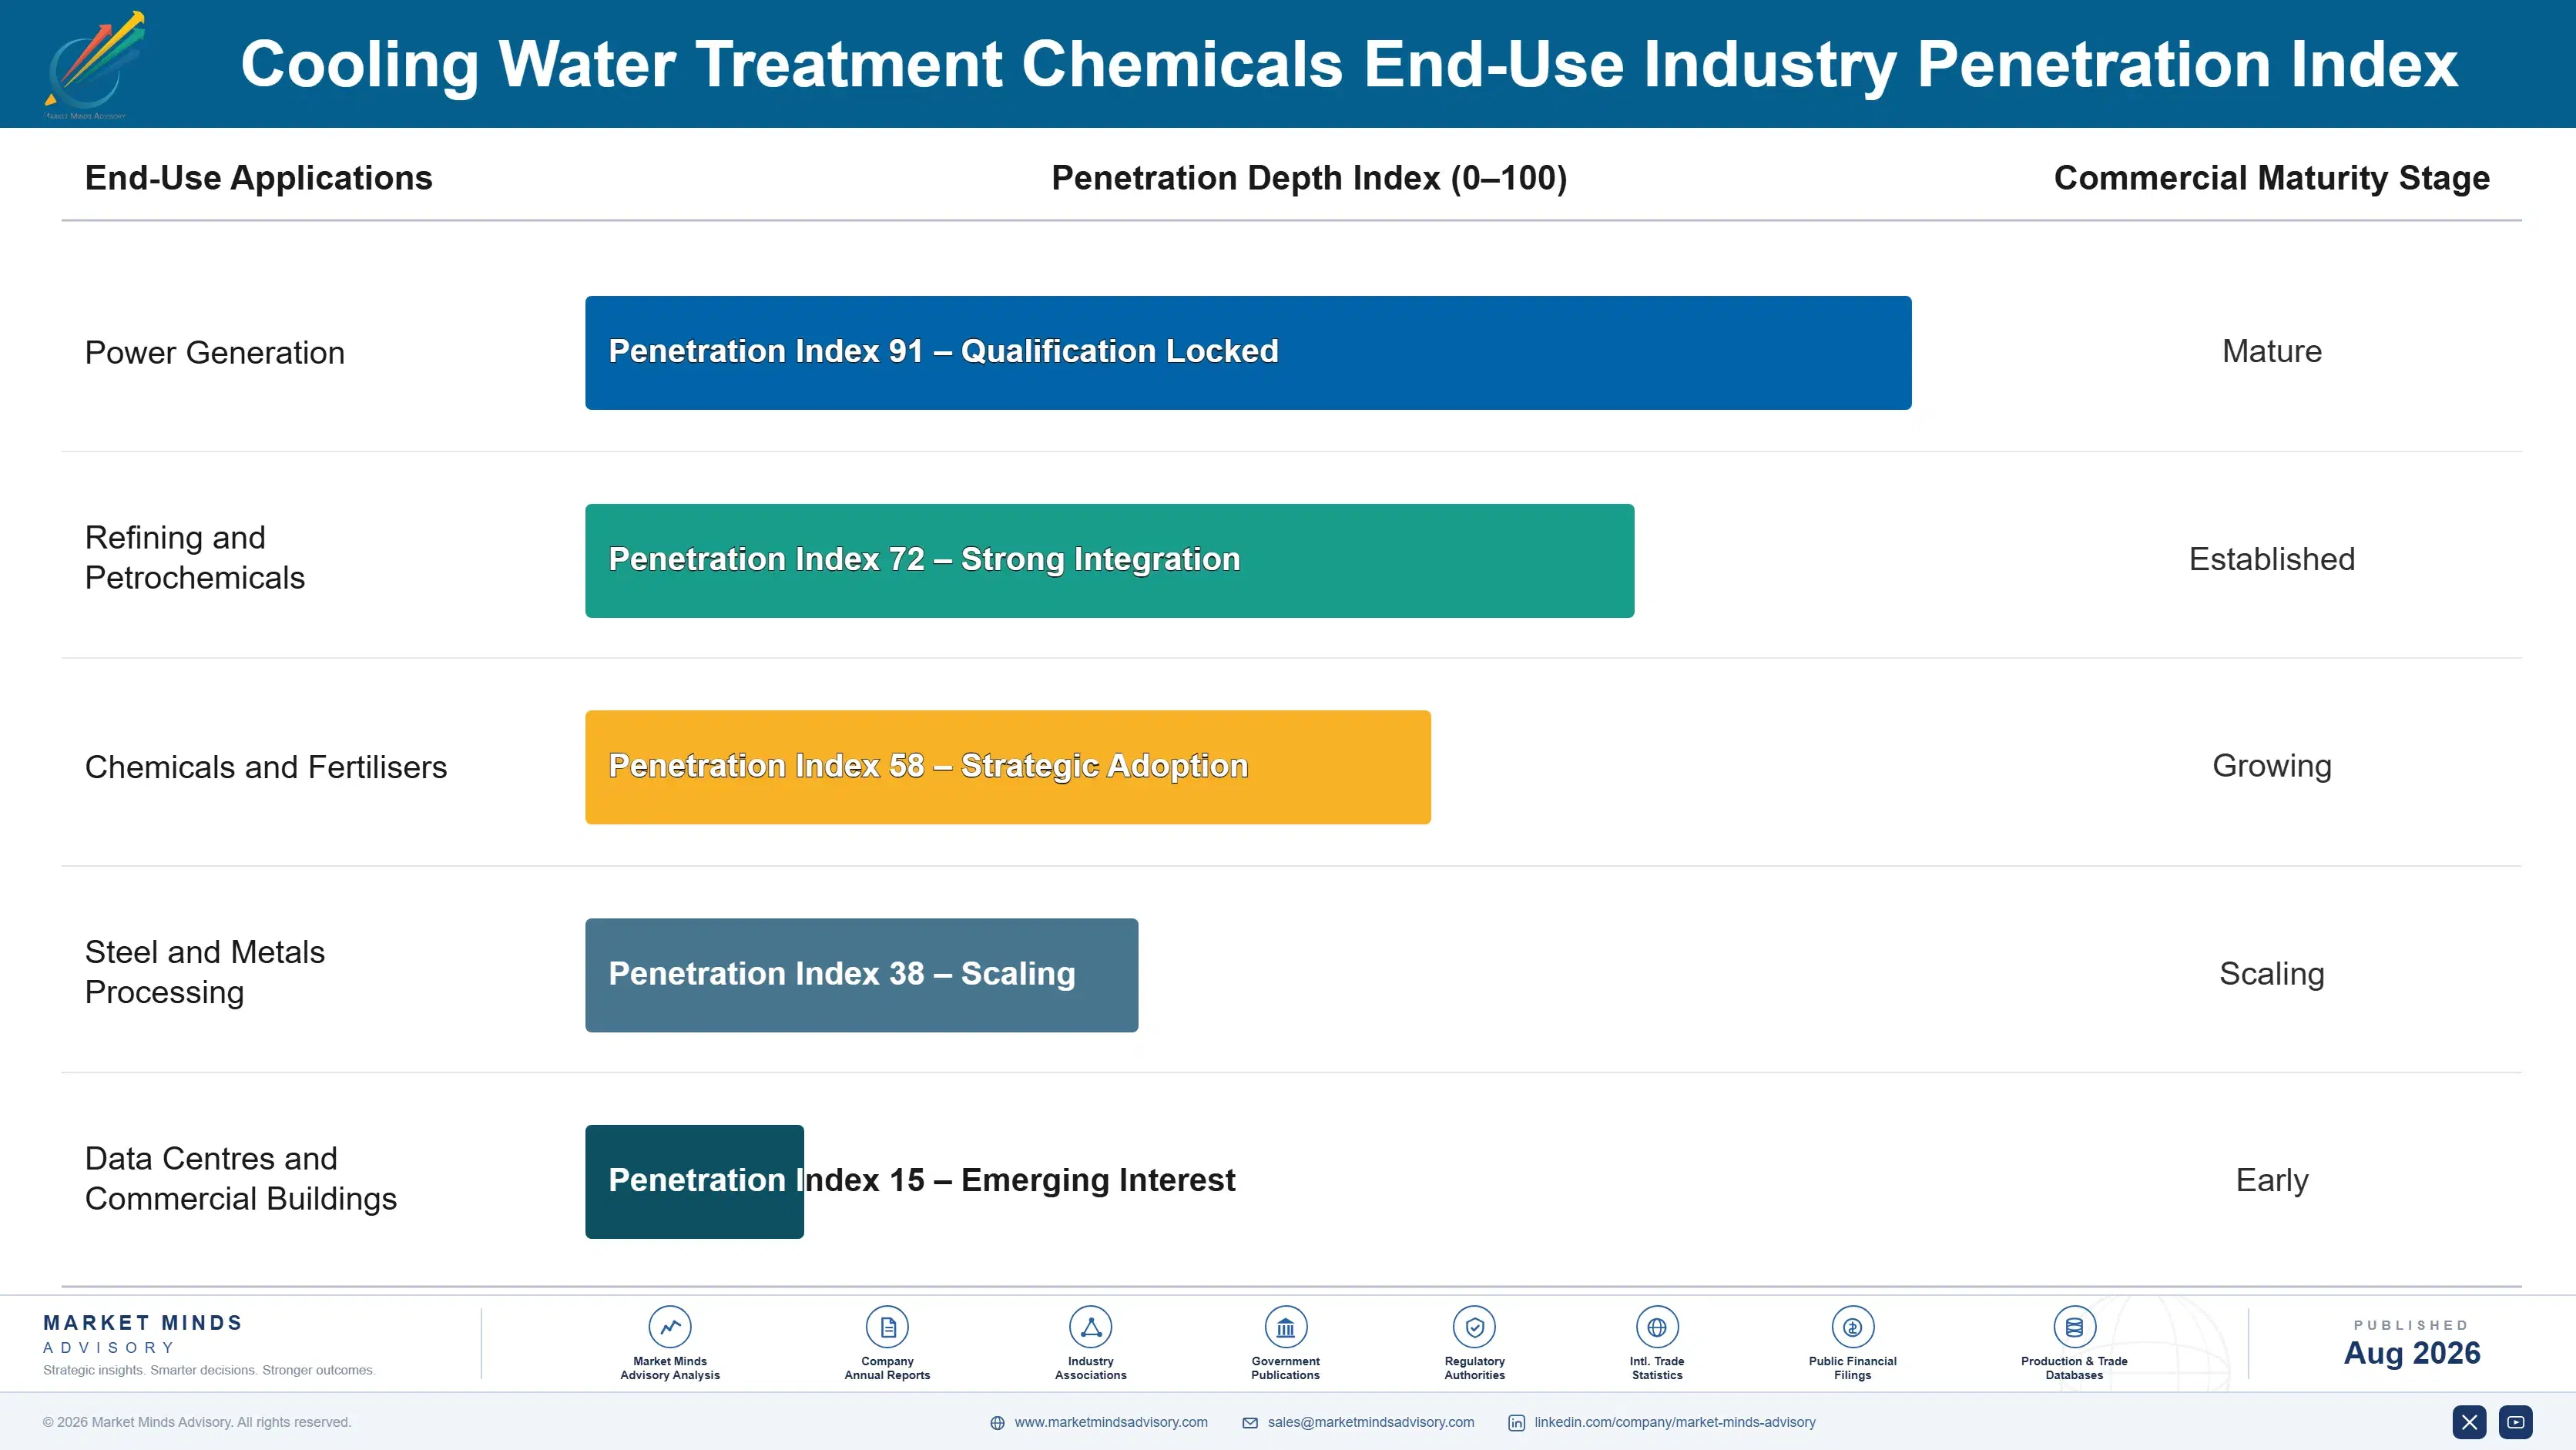
Adoption depth varies sharply by vertical. Refining and petrochemical operators run the deepest programmes because a fouled exchanger costs throughput measured in barrels per day. Data centres buy on uptime with almost no price resistance. Power generation sits between the two, with regulated utilities more programme-oriented than merchant operators. Commercial building operators are the shallowest, buying minimum Legionella compliance and switching freely.

The buyer has shifted toward sustainability and water stewardship functions. Water reuse targets and discharge reporting now sit in corporate disclosures, which pulls specification authority away from plant maintenance. Those functions care about cubic metres saved and phosphorus discharged rather than about corrosion rates, and they evaluate suppliers on reporting quality as much as on treatment performance, which favours providers with monitoring platforms.
cooling-water-treatment-chemicals-market-end-use-penetration-index-1787548993154

Where the Money Sits

These are among the four positions where our research anticipates prominent divergence between winners and laggards over the coming forecast period. Each is grounded in the demand model, the regulatory perimeter, and the announced capacity pipeline.
01 / MONITORING DATA ATTACHMENT

Instrument every account, because data wins the renewal

Continuous controllers cost roughly $4,000 to $9,000 per installed system and cut service visit frequency enough to improve contract margin 5 to 9 percentage points on their own. The larger return is defensive, because a documented performance record is what stops procurement treating the programme as a commodity at review time. Industry renewal rates near 88% rest on that evidence far more than on any chemistry advantage, and the accounts without instrumentation are consistently the ones that end up being lost.
02 / REFORMULATION TIMING READINESS

Finish non-phosphorus development before the deadline arrives

Phosphorus discharge limits tighten on published timetables, and reformulation is one of the very few moments when a customer genuinely reconsiders an incumbent supplier relationship. A provider arriving with validated field data displaces one arriving with a development proposal, and biodegradable programmes raise account value 25 to 40% at the same time. The work has to be complete before the deadline rather than started at it, and every single deadline in this market is entirely knowable years ahead of time.
03 / SCARCITY CHEMISTRY CAPABILITY

Own the hard water, because nobody commoditises difficult chemistry

Operators pushed beyond 6.2 cycles of concentration, or onto reclaimed and desalinated makeup water, present operating conditions that standard treatment programmes simply cannot hold reliably at all. Providers holding the applications laboratory and the field data to perform reliably there sell on technical grounds, and they command programme values 30 to 50% above conventional accounts. It remains the only durable answer to the recurring reverse auction cycle, and it requires applications people and instruments rather than any manufacturing investment whatsoever.
04 / DATA CENTRE CONTRACTING

Sell uptime guarantees, because that is what hyperscalers buy

Data centre cooling grows above 12% annually and the customers face contractual uptime penalties that make any chemical spend look trivial by comparison. Contracting on guaranteed heat transfer performance rather than on delivered chemical volume matches how these particular operators actually think and prices out competitors still selling drums against a specification. Winning needs reliability references and response coverage near the clusters, which is a deliberate footprint decision that has to be made well before any of the bids arrive.

Engagement Snapshot From the Field

A live engagement with an industry participant carrying material or product regulatory and market exposure ahead of a defining policy shift, showing how our research translates into a defensible multi-year portfolio strategy.
MARKET MINDS ADVISORY · CLIENT ENGAGEMENT SUMMARY
Cooling Water Treatment Chemicals Producer Strategic Portfolio Review and Transition Roadmap 2026·Investment Scenario on Cooling Water Treatment Chemicals Exposure Evaluation 2025-26
CLIENT PROFILE
A European water treatment chemicals provider serving industrial cooling accounts across four countries, with revenue near EUR 130 million (client-reported, unverified by MMA). Roughly half of revenue came from product-only supply through distributors and half from contracted programmes, and the business ran no connected monitoring platform behind any of its accounts. Renewal rates had slipped below the industry norm.
STRATEGIC CHALLENGE
Two large refining accounts had been lost to reverse auctions in eighteen months, and phosphorus discharge deadlines were approaching across three of the four countries served without any validated non-phosphorus programme ready. Management needed to know whether to defend on price, invest in monitoring, or accelerate reformulation, and which would protect revenue fastest.
MMA APPROACH
MMA analysed account-level renewal and loss patterns against service intensity and monitoring coverage, mapped phosphorus deadline timetables by country and permit type, and modelled margin outcomes for product-only against fully contracted programmes. Forty-seven expert interviews with plant engineers, procurement leads, and water stewardship managers established what actually decides renewals. Loss patterns proved unusually clear.
KEY FINDINGS
  1. Every account lost to reverse auction in the period lacked continuous monitoring, while no instrumented account had been lost at all, a pattern management had not previously connected.
  2. Phosphorus deadlines in two countries fell inside eighteen months, and no validated non-phosphorus programme could be field-proven in time without immediate development commitment.
  3. Product-only distributor revenue earned barely a third of the margin of contracted programmes while consuming comparable working capital and delivering none of the account stickiness.
  4. High cycle accounts running above eight cycles of concentration paid roughly 40% more per treated cubic metre and had never once been put out to competitive tender.
CLIENT PROFILE
A European water treatment chemicals provider serving industrial cooling accounts across four countries, with revenue near EUR 130 million (client-reported, unverified by MMA). Roughly half of revenue came from product-only supply through distributors and half from contracted programmes, and the business ran no connected monitoring platform behind any of its accounts. Renewal rates had slipped below the industry norm.
STRATEGIC CHALLENGE
Two large refining accounts had been lost to reverse auctions in eighteen months, and phosphorus discharge deadlines were approaching across three of the four countries served without any validated non-phosphorus programme ready. Management needed to know whether to defend on price, invest in monitoring, or accelerate reformulation, and which would protect revenue fastest.
MMA APPROACH
MMA analysed account-level renewal and loss patterns against service intensity and monitoring coverage, mapped phosphorus deadline timetables by country and permit type, and modelled margin outcomes for product-only against fully contracted programmes. Forty-seven expert interviews with plant engineers, procurement leads, and water stewardship managers established what actually decides renewals. Loss patterns proved unusually clear.
KEY FINDINGS
  1. Every account lost to reverse auction in the period lacked continuous monitoring, while no instrumented account had been lost at all, a pattern management had not previously connected.
  2. Phosphorus deadlines in two countries fell inside eighteen months, and no validated non-phosphorus programme could be field-proven in time without immediate development commitment.
  3. Product-only distributor revenue earned barely a third of the margin of contracted programmes while consuming comparable working capital and delivering none of the account stickiness.
  4. High cycle accounts running above eight cycles of concentration paid roughly 40% more per treated cubic metre and had never once been put out to competitive tender.
RECOMMENDED STRATEGY
Phase 1: Phase one: instrument every contracted account with connected controllers, prioritising the sites with the largest spend and the nearest procurement review dates. Phase 2: Phase two: accelerate non-phosphorus field validation in the two countries with imminent deadlines, targeting competitor accounts facing the same reformulation requirement. Phase 3: Phase three: reposition product-only distributor business as territory coverage priced for contribution, and redirect commercial resource toward high cycle industrial sites.
OUTCOME
The client instrumented 82% of contracted accounts within a year and lost no further sites to competitive tender. Non-phosphorus programmes were validated ahead of both deadlines and won three competitor accounts, and blended gross margin improved 5.3 percentage points across two years (client-reported, unverified by MMA).

Frequently Asked Questions

Foundational context covering the market sizes, CAGR, scope, country, region and competition that inform every finding below. This section is provided to cover basics and most often pre-purchase conversations, answered from the MMA Primary Research Dataset.

What is the current size of the Cooling Water Treatment Chemicals Market?

The market was valued at USD 8.7 billion in 2025, rising to an estimated USD 9.23 billion in 2026. East Asia holds the largest regional share at 30% of global value.

How large will the Cooling Water Treatment Chemicals Market be by 2036?

MMA forecasts USD 16.69 billion by 2036 under the base case, an expansion multiple of 1.81 times the 2026 value. That represents USD 7.46 billion of incremental value across the forecast period.

What is the CAGR for the Cooling Water Treatment Chemicals Market 2026 to 2036?

The base case CAGR is 6.1%, with a bull case of 7.3% and a bear case of 4.9%. The spread reflects uncertainty over industrial cooling loads and discharge regulation timing.

Which segment is growing fastest?

Biodegradable chelants and green polymers grow fastest at 10.8%, roughly 1.77 times the market rate. Non-oxidising biocides follow at 6.9%, supported by higher cycles and reclaimed water use.

Who are the major companies in the Cooling Water Treatment Chemicals Market?

Ecolab, Veolia Water Technologies, Solenis, Kurita Water Industries, and ChemTreat lead on treatment revenue. The top five hold roughly 47% of global value, with service density separating them.

Which country is growing fastest?

India grows fastest at 9.2%, driven by refinery, power, steel, and fertiliser capacity additions under severe water constraint. High cycles and reclaimed makeup water are standard from the outset.

Report Segmentation Architecture

The full report scope spans multiple orthogonal segmentation dimensions, with cross-tabulated demand data provided for each dimension pair. Coverage extends further to regional breakdowns, trend trajectories, and the competitive detail needed to support segment-level decision-making.

By Chemistry Class

  • Phosphonates and Organophosphorus Compounds
  • Polymeric Dispersants
  • Azoles and Yellow Metal Inhibitors
  • Oxidising Biocides
  • Non-Oxidising Biocides
  • Biodegradable Chelants and Green Polymers

By End-Use Industry

  • Power Generation
  • Refining and Petrochemicals
  • Chemicals and Fertilisers
  • Steel and Metals Processing
  • Data Centres and Commercial Buildings

By Sales Model

  • Contracted Service Programmes
  • Performance-Based Uptime Contracts
  • Product-Only Direct Supply
  • Distributor and Reseller Channel
  • Original Equipment Manufacturer Partnership

By Region

  • North America
  • Western Europe
  • East Asia
  • South Asia and Pacific
  • Latin America
  • Middle East and Africa
  • Eastern Europe

Scope, Methodology, and Coverage

Every figure in this report is reproducible from documented input assumptions. The scope below maps the historical period, the forecast horizon, the segmentation dimensions, and the countries covered, alongside the underlying primary and qualitative methodology.
Historical Period
2020 to 2025
Forecast Period
2026 to 2036
Base Year
2025 (USD billions; MMA Primary Research Dataset, August 2026)
Market Definition
The market comprises chemicals formulated for industrial and commercial cooling water systems including open recirculating towers, closed loops, and once-through systems, covering phosphonates and organophosphorus compounds, polymeric dispersants, azole and yellow metal inhibitors, oxidising biocides, non-oxidising biocides, and biodegradable chelants and green polymers. Value is measured at supplier level and includes contracted service programme revenue. Boiler and steam chemicals, wastewater and effluent treatment, membrane and reverse osmosis chemicals, cooling equipment, and potable water treatment fall outside scope.
Quantitative Units
USD billions (current prices); metric tonnes of active chemistry supplied annually; USD per treated cubic metre of circulating water
Segmentation Dimensions
By Chemistry Class; By End-Use Industry; By Sales Model; By Region
Regions Covered
North America, Western Europe, East Asia, South Asia and Pacific, Latin America, Middle East and Africa, Eastern Europe
Countries Covered
United States, Canada, Mexico, Germany, France, United Kingdom, Netherlands, Italy, Spain, Belgium, Poland, Czechia, Romania, China, Japan, South Korea, Taiwan, India, Australia, Singapore, Brazil, Chile, Peru, Saudi Arabia, United Arab Emirates, Egypt, South Africa
Key Companies Profiled
Ecolab, Veolia Water Technologies, Solenis, Kurita Water Industries, ChemTreat, BASF, Dow, Kemira, Italmatch Chemicals, Buckman Laboratories, Thermax, Ion Exchange India, Arkema, Lonza, Nouryon, Innospec, SNF Group, Clariant, Shandong Taihe Water Treatment Technologies, Chemtex Speciality
Quantitative Methodology
Primary survey, n=3,800 respondents, Q4 2025, six countries; demand-side model with trade association cross-validation
Qualitative Methodology
47 expert interviews, Q4 2025; applied to validate demand model assumptions, identify emerging dynamics, and assess competitive positioning
Report Format
PDF and XLSX data workbook (Word format preview document)
Publisher
Market Minds Advisory
Report Code
MMA-2026-CHM-126
Published
August 2026
Contact
sales@marketmindsadvisory.com | www.marketmindsadvisory.com

Purchase the full Cooling Water Treatment Chemicals Market Report (2026 to 2036).

The full report sizes cooling water treatment demand across six chemistry classes, five end-use categories, and seven regions with 2026 to 2036 forecasts under base, bull, and bear cases. It separates contracted programme revenue from product-only supply, which behave as different businesses with different margin structures. Competitive profiles cover twenty providers assessed consistently on cooling water treatment revenue, service network density, and reformulation readiness. Cost analysis traces phosphorus and acrylate feedstock exposure alongside field service labour inflation. Commercial guidance addresses monitoring attachment, non-phosphorus preparation, scarcity chemistry capability, and data centre contracting.
Six chemistry classes sized separately by region
Contracted programme revenue separated from product-only supply
Phosphorus discharge deadlines mapped by country and permit
Service network density assessed across twenty providers
High cycle and reclaimed water programme premiums quantified
Data centre cooling demand modelled as a distinct pool

Built For The People Who Decide

From boardroom strategy to bench-side execution, this report is read cover-to-cover by leaders shaping the next decade of their industry, turning demand scenarios, market dynamics and valuation benchmarks into decisions.
CXOs/ Presidents/ VPs/ Managers
M&A and Corporate Development
Strategy Teams and R&D Heads
Procurement and Product Directors
Regulatory and Compliance Leaders
Investor Relations and Equity Analysts