
Market Minds Advisory
Glass Container Market

Glass Container Market Size, Segments and Regional Outlook 2026-2036

Glass containers cost more to ship and break if mishandled, yet brand owners across food, beverage, pharma, and cosmetics keep specifying glass anyway, because nothing else signals quality as reliably.

Lead Analyst

Bilal Shaikh

Published

November 2026

Make Smarter Decisions with Customized Research Insights

Request a free sample report and evaluate market opportunities, growth trends, and competitive dynamics relevant to your business needs.

2025 MARKET VALUE$58.0BMarket Size 2025
2036 FORECAST VALUE$91.2BBase Case , 2026 to 2036
CAGR 2026 TO 20364.2 %Bull 5.5% / Bear 3.0%
INCREMENTAL OPPORTUNITY$30.8BNet 10- year value creation
EXPANSION MULTIPLE1.51x2036 value over 2026 base
Strategic Levers
M&A Pipeline
Regional Outlook
Country Rankings
Competitive Intelligence
Segmental Deep-dive
Call-Us : 91 93563 13602

Glass Container Market at a Glance

Glass containers remain the packaging format of choice wherever brand owners need to signal quality or guarantee chemical inertness, sustaining demand that heavier, costlier shipping economics have never managed to displace toward lighter alternative materials at scale. That durability is exactly why the category keeps defying substitution forecasts.
Pharmaceutical containers are growing fastest as aging populations and expanding chronic disease treatment volumes lift regulated packaging demand, while cosmetics and personal care containers benefit from premiumization trends that favor glass's perceived quality signal over plastic alternatives. East Asia anchors the largest regional market, reflecting enormous domestic beverage and food manufacturing volume concentrated in China specifically. Cosmetics brand owners are reversing a drift toward plastic to recapture that shelf signal.
Five producers hold nearly half of global capacity, a concentration that reflects the enormous capital cost of furnace construction and the multi-decade asset life that rewards scale incumbents able to amortize that investment across huge production runs. Recycled-content specification is reshaping competitive positioning fastest, as regulation and brand owner sustainability commitments both push toward higher cullet content furnace operation simultaneously. That shift is already visible in how the five scale leaders are allocating new capital.
Market Definition
The glass container market covers rigid glass bottles and jars used for food, beverage, pharmaceutical, cosmetics and personal care, and household and industrial chemical packaging, segmented by end-use industry. It excludes glass tableware and drinkware, glass manufactured for non-packaging uses such as flat or fiberglass, premium spirits bottles carrying bespoke embossing or decoration programs, and specialty pharmaceutical vials, ampoules, and cartridges, each of which is covered under a separate market scope. Linked demand sits in the mason jars & canning supplies market, projected by MMA to reach USD 4.8 billion by 2036 on a 4.6% CAGR.
Base Year Value
$58.0B in 2025 (MMA Primary Research Dataset, October 2026)
Forecast Period
2026 to 2036, eleven discrete annual values
CAGR
4.2% base case. Bull 5.5%. Bear 3.0%.
Fastest Growth Segment
Pharmaceutical Containers: 6.5% CAGR
Fastest Growth Country
India: 7.0% CAGR
Fastest Growth Region
South Asia and Pacific: 6.2% CAGR
Largest Region
East Asia: 27% of 2025 global value
Market Leaders
O-I Glass, Vidrala, Ardagh Group, Verallia, and BA Glass lead the market. Source: MMA Analysis based on company annual reports and investor filings.
Primary Survey
n=3,800 procurement and R&D decision-makers, Q4 2025, six countries
Methodology
Demand-side build-up, cross-validated against public data, 47 expert interviews

Glass Container Revenue Scenarios

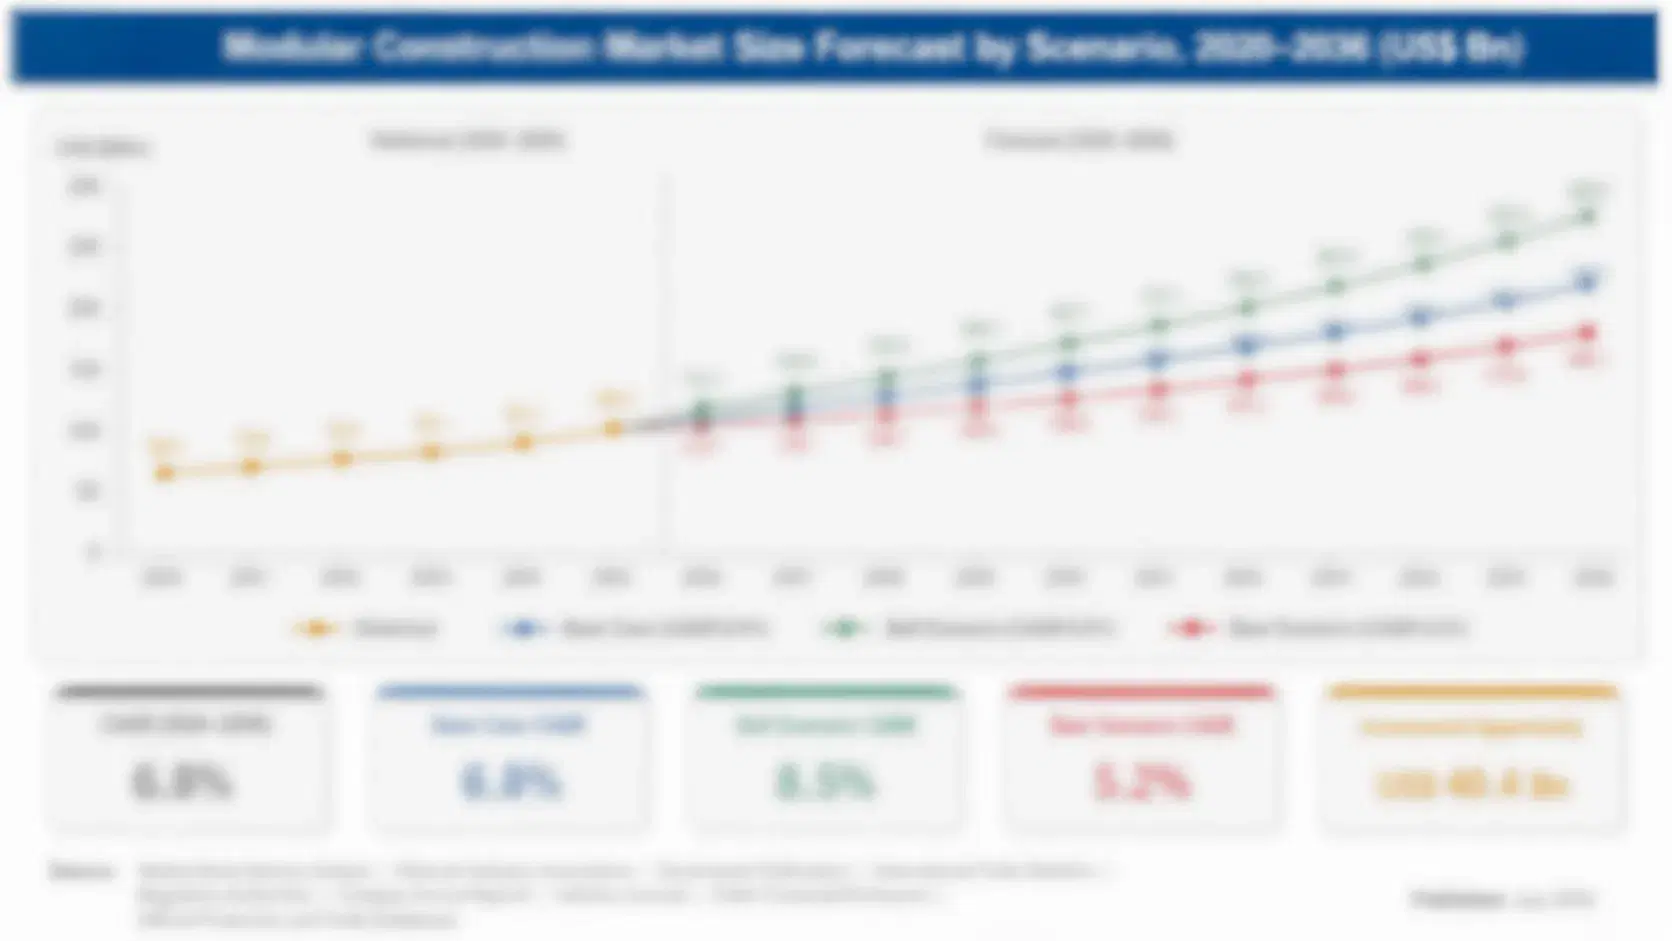
container-glass-market-size-forecast-scenario-1791419222614
Glass container demand grew steadily but unspectacularly between 2020 and 2025, as mature beverage and food end-uses offset pandemic-era volatility in away-from-home consumption channels. The market grew at a historical compound annual growth rate of 3.6%, a pace now set to accelerate modestly as pharmaceutical and premium cosmetics demand expand faster than the mature beverage base.
The base case assumes continued pharmaceutical container demand tied to aging populations, steady cosmetics premiumization favoring glass over plastic, and gradual recycled-content specification increases across furnace operations responding to tightening waste regulation. Brand owners keep specifying glass wherever quality signaling matters more than shipping weight economics, regulators keep favoring glass for its chemical inertness, and furnace operators keep investing in cullet capacity to meet recycled-content targets. Together these mechanisms sustain modest but durable above-historical growth across a genuinely global production base.
The bull case centers on faster-than-expected premiumization in cosmetics and spirits packaging lifting average selling price meaningfully across those categories specifically. The bear case is continued lightweighting and material substitution pressure from plastic and aluminum alternatives in price-sensitive beverage categories, eroding glass's historical volume base faster than pharmaceutical and premium growth can offset. Either outcome hinges on how fast brand owners move, since furnace retooling takes time.

Why Weight Economics Never Killed Glass

Glass containers hold their position against lighter, cheaper alternative materials because brand owners in regulated and premium categories specifically need glass's chemical inertness, barrier performance, and quality signaling, properties that plastic and aluminum substitutes cannot fully replicate regardless of their cost or weight advantage. This is why material substitution studies keep underestimating glass's staying power in regulated and premium categories specifically. Adjacent demand is captured in the thin wall glass container market, which MMA expects to grow from USD 6.8 billion in 2025 to USD 18.3 billion by 2036.
MARKET CONCENTRATION (CR5)48%Top five producers hold nearly half of global capacity
AVERAGE SELLING PRICE$0.18/unitBlended global average price per standard glass container
TOP PRODUCING COUNTRY SHARE19%China supplies roughly a fifth of global container output
CAPACITY UTILIZATION83%Furnace operators run production near four fifths capacity
SODA-ASH AND ENERGY COST46%Raw material and furnace energy dominate producer cost base
RECYCLED CULLET CONTENT38%Average recycled glass share of total furnace feedstock globally
Commercially, the market splits between enormous mature beverage and food volume competing largely on price and furnace efficiency, and smaller but faster-growing pharmaceutical and cosmetics segments where producers compete on regulatory certification and surface finishing quality instead. Producers serving only commodity beverage accounts face thin margins, while those with pharmaceutical-grade certification capture meaningfully better economics. Producers that never built pharmaceutical or cosmetics certification depth remain stuck competing almost entirely on furnace efficiency and freight distance. The growlers market is a natural companion read, sized by MMA at USD 1.6 billion in 2025 with 6.8% annual growth ahead.
Over the next decade, the forces reshaping the category center on recycled-content furnace operation becoming a competitive necessity rather than a sustainability add-on, and on lightweighting technology narrowing glass's historical cost disadvantage against plastic alternatives in mainstream beverage categories specifically. Producers slow to adapt to either shift risk ceding the segments generating the most industry profit growth over the coming decade to faster-moving competitors.
"Every material substitution study for the past decade has predicted glass's decline in mainstream beverage categories. The decline keeps not happening, because brand owners keep deciding the quality signal is worth the extra freight cost."
Director, Packaging and Materials Practice · MMA Packaging and Materials Practice · October 2026

What Is Changing in Glass Container

Recycled Cullet Content Becomes a Competitive Requirement

Furnace operators are increasing recycled cullet content well beyond historical levels, driven by packaging waste regulation that increasingly sets minimum recycled-content thresholds alongside brand owner sustainability commitments that treat cullet share as a procurement scoring criterion. This shift is reshaping competitive positioning meaningfully, since cullet use reduces both energy consumption and raw material cost simultaneously, giving producers with strong regional collection infrastructure a durable cost advantage over producers reliant on virgin raw material inputs. Producers in Western Europe, where bottle collection infrastructure is most mature, are capturing disproportionate benefit from this shift relative to regions with weaker recycling collection rates. A closely related view comes from the glass bottles market, which MMA projects to grow at a 3.9% CAGR to USD 104.2 billion by 2036.
Market Impact: Adds 5 to 8% regulated demand
Lightweighting Technology Narrows the Cost Gap With Plastic

Glass container producers continue refining lightweighting technology that reduces container weight without compromising structural strength, narrowing the historical cost and carbon footprint disadvantage glass has carried against plastic alternatives in mainstream beverage categories specifically. This technology shift is helping glass defend share in categories where it might otherwise have lost ground entirely to lighter, cheaper substitute materials over the past decade. Producers with the strongest lightweighting engineering capability are winning disproportionate share of new beverage contracts specifically tied to sustainability-conscious brand owner specifications. Brand owners increasingly specify maximum container weight thresholds directly in packaging contracts.
Market Impact: Adds 6 to 9% premium volume

Glass Container Growth Opportunities

Pharmaceutical Inertness Requirements Sustain Regulated Demand

Pharmaceutical regulators across major markets continue favoring glass containers for injectable and sensitive formulation packaging specifically, since glass's chemical inertness prevents the leaching and interaction risk that plastic alternatives can introduce into drug formulations over extended shelf life periods. This regulatory preference sustains durable pharmaceutical container demand growth that tracks healthcare spending and aging population trends more closely than discretionary consumer packaging cycles. Producers with pharmaceutical-grade certification and documented quality systems are capturing disproportionate share of this expanding regulated volume as generic drug manufacturing continues growing globally. This gives pharmaceutical-certified producers a demand floor commodity beverage producers lack.
Market Impact: Adds 15 to 20% freight cost

Premiumization Favors Glass Across Cosmetics and Spirits

Premium cosmetics and spirits brand owners continue favoring glass containers over plastic alternatives specifically because glass carries a quality signal that consumers associate with premium positioning, supporting pricing power that brand owners are unwilling to sacrifice by switching to lighter materials. This premiumization-driven demand sustains meaningful glass volume in categories where material substitution economics would otherwise favor plastic on pure cost grounds. Producers with decorative finishing and custom mold capability are capturing disproportionate share of this premium demand relative to commodity container producers. Brand owners here treat packaging material as part of the product experience, not just protection.
Market Impact: Energy can reach 25% of cost

Glass Container Challenges and Constraints

Shipping Weight Economics Favor Lighter Substitute Materials

Glass's weight relative to plastic and aluminum alternatives imposes a persistent freight cost disadvantage that becomes more pronounced the further a container must travel from its filling point to the end consumer, pressuring brand owners in cost-sensitive categories to consider material substitution despite glass's quality advantages. The root cause is basic physics: glass simply weighs more per unit of contained volume than its common substitute materials, and no amount of lightweighting engineering fully closes that gap. Producers are mitigating this by building regional furnace capacity closer to filling operations, reducing the shipping distance that amplifies the weight disadvantage.
Market Impact: Lifts cullet content 8 to 12%

Energy-Intensive Furnace Operation Exposes Producers to Price Volatility

Glass furnace operation requires sustained high-temperature heat that makes producers unusually exposed to natural gas and electricity price volatility compared with packaging producers using lower-temperature processes, creating margin risk that intensifies during energy market disruptions specifically. The underlying cause is that furnaces cannot be cycled on and off economically, forcing producers to run continuously regardless of short-term demand fluctuations or energy cost spikes. Producers are mitigating this by pursuing long-term energy supply contracts and investing in furnace efficiency technology that reduces energy consumption per unit of output over time. Smaller producers without hedging capability feel this exposure most acutely.
Market Impact: Cuts container weight 10 to 15%
3 additional market trends, 4 additional growth drivers, and 3 additional restraints and challenges are covered in the full report. Contact sales@marketmindsadvisory.com to access the complete intelligence.

Glass Container Segment CAGR Comparison

End-use industry, not glass color or container shape alone, is the clearest segmentation lens, since regulatory requirements, growth rate, and pricing power all vary primarily by what product the container ultimately holds. Six categories cover global volume: food, beverage, alcoholic beverage, pharmaceutical, cosmetics and personal care, and household and industrial chemical containers. No other dimension splits the category this cleanly.
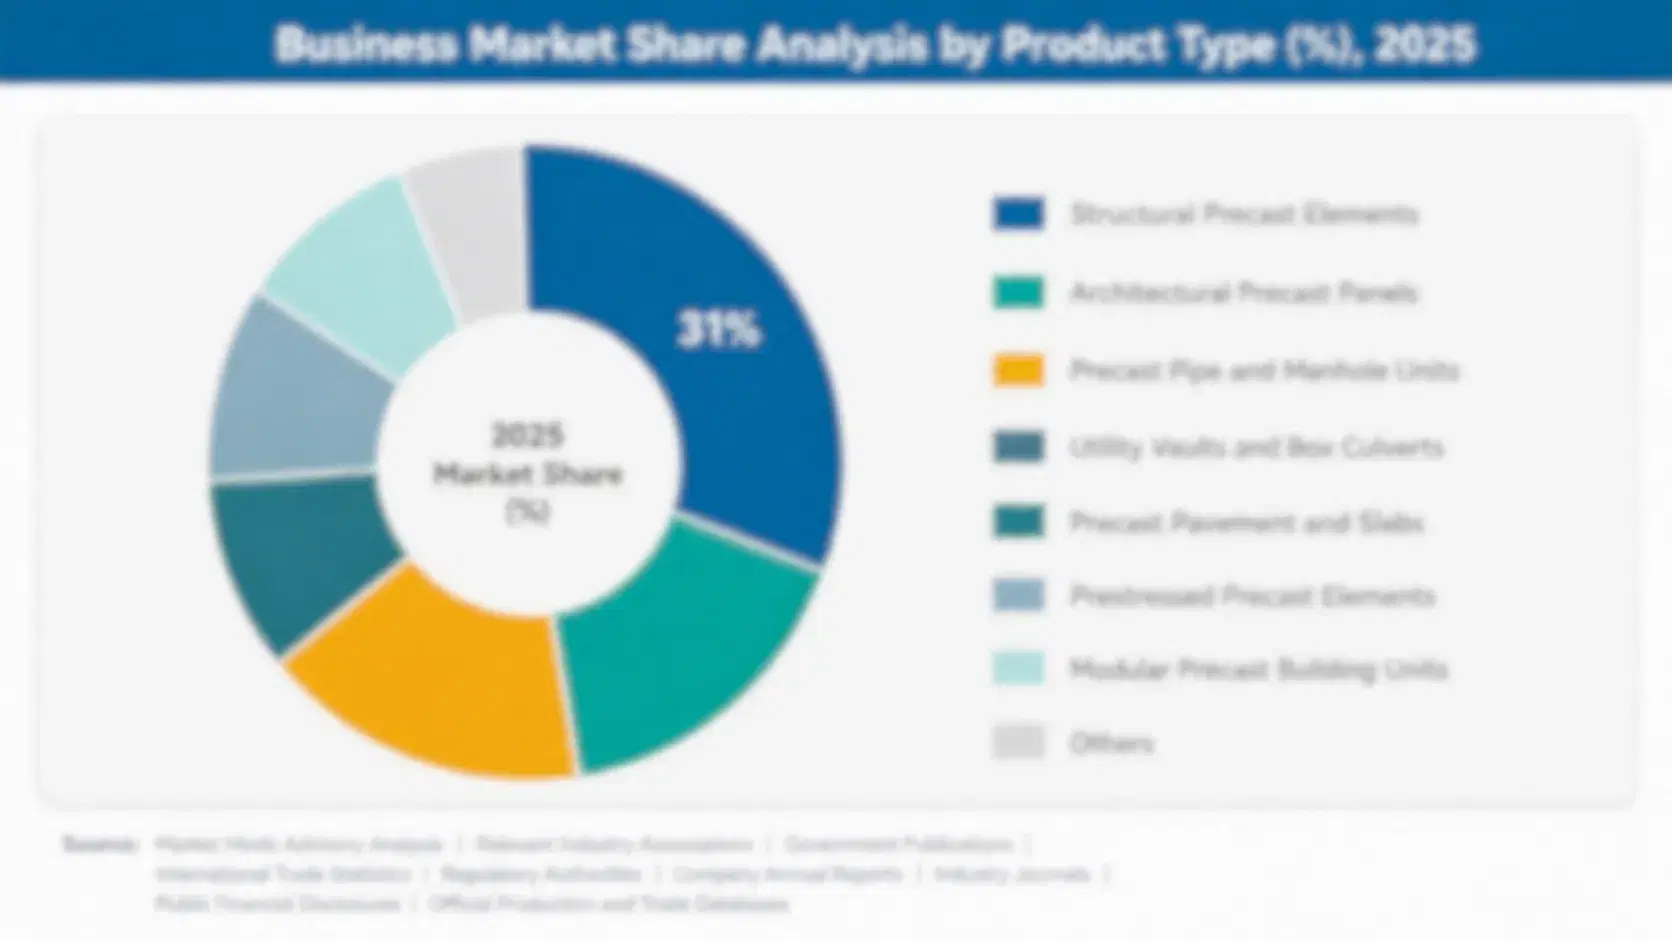
container-glass-market-market-share-analysis-1791419222864

Pharmaceutical Containers

Pharmaceutical containers are the fastest-growing category because aging populations and expanding chronic disease treatment volumes continue lifting regulated packaging demand well above the mature beverage base that still dominates total glass container volume worldwide. Producers with pharmaceutical-grade certification and documented quality systems are capturing disproportionate share of this expanding regulated volume as generic drug manufacturing continues growing across both developed and emerging markets. Pharmaceutical containers command meaningfully higher average selling price than commodity beverage containers, reflecting the certification and quality documentation involved in production. Several major generic drug manufacturers have announced expanded glass packaging programs tied to growing injectable formulation volume specifically. Regulatory qualification timelines remain the main constraint still limiting faster capacity entry among new producers.
CAGR 6.5%

Cosmetics and Personal Care Containers

Cosmetics and personal care containers are the second-fastest category, growing as premium brand owners continue favoring glass over plastic alternatives specifically because glass carries a quality signal that supports premium pricing positioning at retail. Producers with decorative finishing and custom mold capability are capturing disproportionate share of this premium demand relative to commodity container producers focused purely on standard shapes. Brand owners favor this approach because it lets them differentiate on shelf in ways that plastic packaging alternatives cannot replicate as convincingly to premium-conscious consumers. Capacity additions are concentrated among producers already serving established premium cosmetics customers expanding their product range into new categories. Pricing power here holds up even during spending slowdowns, reflecting premium buyer price insensitivity.
CAGR 5.8%
Full segment breakdown across 6 segments available in the complete report.

Where Glass Container Demand Is Growing

East Asia anchors the largest regional market, reflecting enormous domestic beverage and food manufacturing volume in China. Western Europe follows closely on its deep glass packaging heritage across wine, beer, and spirits, while South Asia and Pacific posts the fastest regional growth rate of any market tracked in this report. That demand is tracked in the beer packaging market, which MMA expects to expand at 4.2% a year to USD 100.6 billion by 2036.

North America

North America's glass container demand centers on mature beverage categories alongside a steadily growing pharmaceutical segment tied to the region's large generic drug manufacturing base. US producers including O-I Glass operate extensive furnace networks positioned near major beverage filling operations to minimize shipping distance and the weight-related freight cost disadvantage glass carries against lighter materials. Canada contributes meaningful furnace capacity serving both domestic beverage and pharmaceutical demand. Mexico's production base serves both domestic consumption and cross-border supply into the United States beverage market specifically. US producers are increasingly investing in lightweighting technology to defend mainstream beverage volume against plastic and aluminum substitution pressure that has intensified across cost-sensitive retail categories over the past several years.
Share: 24% | CAGR: 4.0% (2026 to 2036)

Western Europe

Western Europe's glass container demand reflects a long packaging heritage across wine, beer, and spirits categories where consumers and regulators alike continue favoring glass over alternative materials for quality and recyclability reasons. France and Italy anchor regional wine bottle demand through their substantial domestic wine production industries, while Germany contributes significant beer and pharmaceutical container volume. The region's bottle collection and recycling infrastructure is the most mature in the world, giving regional producers an advantage in meeting rising recycled-content specification requirements. The United Kingdom contributes meaningful spirits and pharmaceutical container demand of its own. Spain and Portugal contribute additional wine bottle capacity tied to their own export-oriented wine industries. This heritage is why European producers still set the global standard for decorative glass finishing. Buyers can benchmark this against the glass bottle and container market, which MMA values at USD 64.0 billion in 2025.
Share: 25% | CAGR: 2.7% (2026 to 2036)
Regional intelligence for 5 additional markets available in the complete report: East Asia, South Asia and Pacific, Latin America, Middle East and Africa, Eastern Europe. Contact sales@marketmindsadvisory.com.
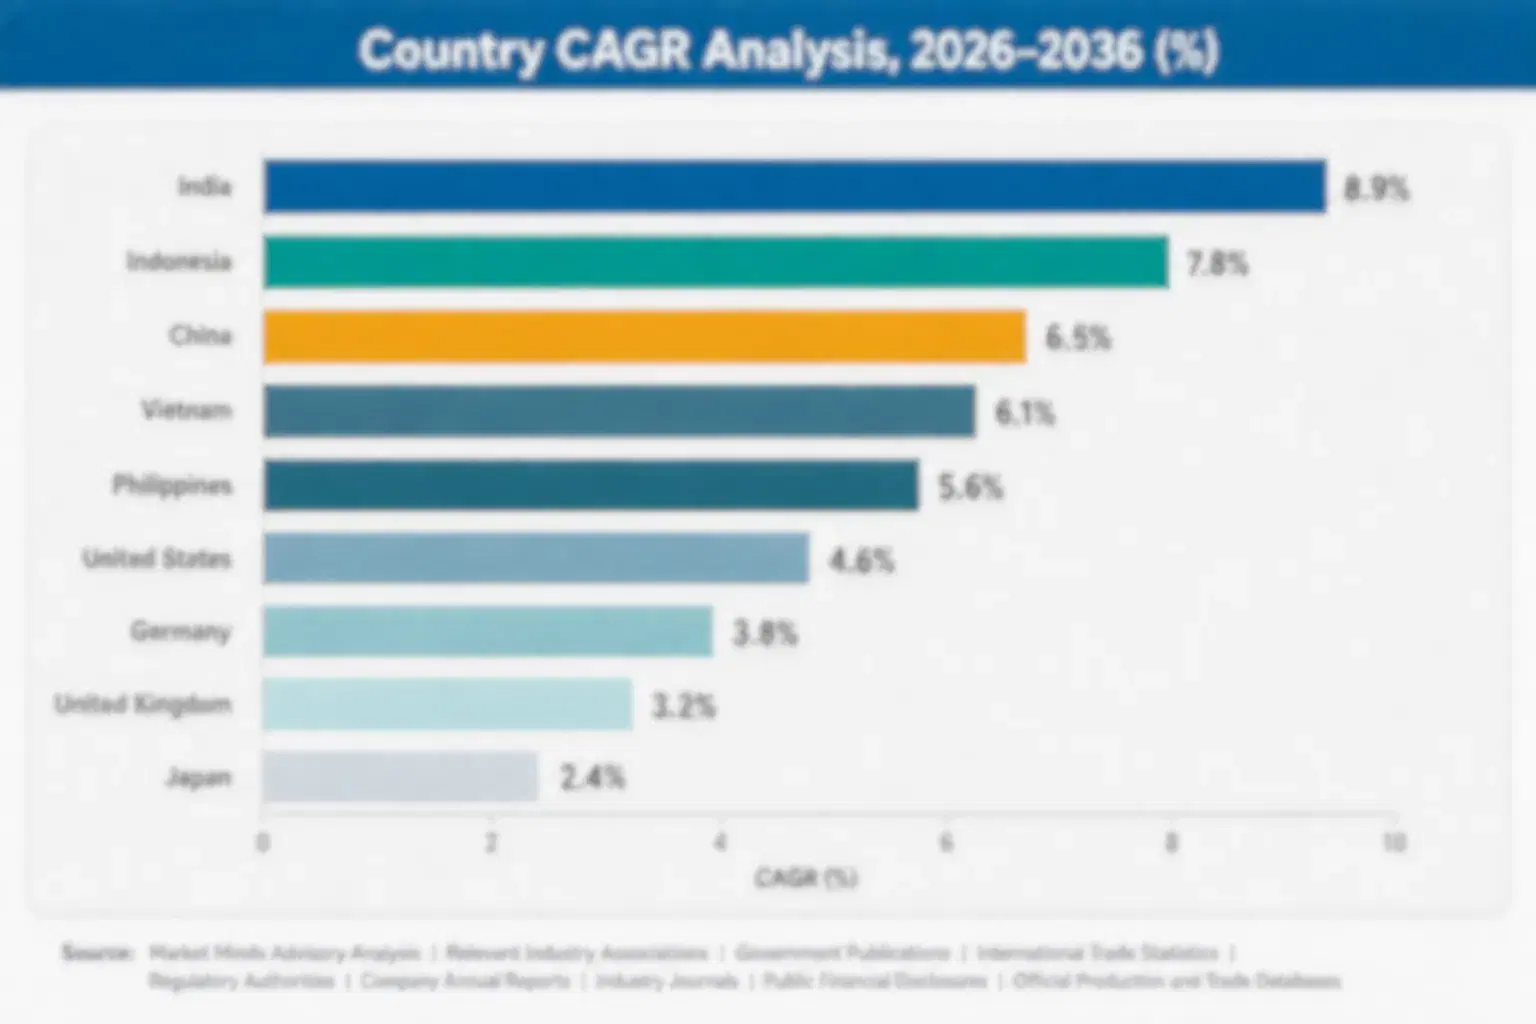
container-glass-market-country-cagr-analysis-1791419223159

Where Glass Producers Can Expand Margin

Producers sitting on commodity beverage container volume face intense price competition from furnace efficiency rivals, so the clearest paths to margin expansion run through pharmaceutical certification, premium cosmetics finishing, and recycled-content leadership that customers will pay for directly. Four approaches stand out as genuinely available to most mid-sized producers. These suit mid-sized producers without furnace-scale capital budgets.

Developing Pharmaceutical-Grade Container Quality Certification Early

Producers that invest in pharmaceutical-grade quality certification can win regulated container volume that commodity beverage producers cannot access, since this category requires documented quality systems and dimensional precision most basic furnace operations never developed. This path requires meaningful investment in quality documentation and facility standards but opens a growing, higher-margin volume pool largely closed to uncertified competitors. Producers with existing pharmaceutical-adjacent experience can typically achieve certification faster than producers starting from a pure commodity background, capturing roughly 20 to 28% premium pricing once qualified. This certification pathway typically pays back its upfront investment within two to three years of qualification.
Market Impact: Commands roughly a 20 to 28 percent premium

Building Decorative Finishing Capability for Premium Brands

Producers that develop specialized decorative finishing capability, including custom mold design, surface texturing, and premium color formulation, can capture premium pricing from cosmetics and spirits brand owners seeking shelf differentiation that standard commodity containers cannot provide. A mid-sized producer winning even a modest share of a major premium cosmetics brand's packaging volume can generate substantial incremental revenue given typical premium container pricing. Producers serving this category report commanding pricing premiums of 25 to 35% over standard commodity container formats. Producers that invest early are winning multi-year exclusive arrangements rather than competing contract by contract.
Market Impact: Commands roughly a 25 to 35 percent premium

Leading on Recycled-Content Furnace Capability Early

Producers that invest early in high-cullet-content furnace operation can capture brand owner sustainability-driven contract preference ahead of competitors still relying primarily on virgin raw material input, since procurement teams increasingly score recycled content as a qualification criterion rather than a nice-to-have attribute. This approach requires investment in cullet processing and furnace chemistry adjustment, but rewards producers willing to invest early with durable multi-year supply relationships. Producers with established high-cullet operations report order growth considerably above the category average, often 8 to 12% faster annually. This positioning also reduces raw material price exposure, a secondary benefit beyond contract preference.
Market Impact: Grows contract volume 8 to 12 percent yearly

Expanding Regional Furnace Capacity Near Fast-Growing Demand

Producers that build new furnace capacity in South Asia and other fast-growing regional markets, rather than exporting from mature-market facilities, can capture greenfield demand while also minimizing the shipping weight disadvantage that erodes glass's cost competitiveness over long distances. This approach requires substantial upfront capital investment given furnace construction cost and multi-decade asset life, but rewards early movers with durable regional cost leadership. Producers with new regional capacity report margins running 10 to 15% above comparable exported volume once the facility reaches full utilization. Producers that delay risk losing first-mover advantage to rivals already breaking ground.
Market Impact: Adds roughly 10 to 15 percent regional margin

Glass Container Pricing and Margins

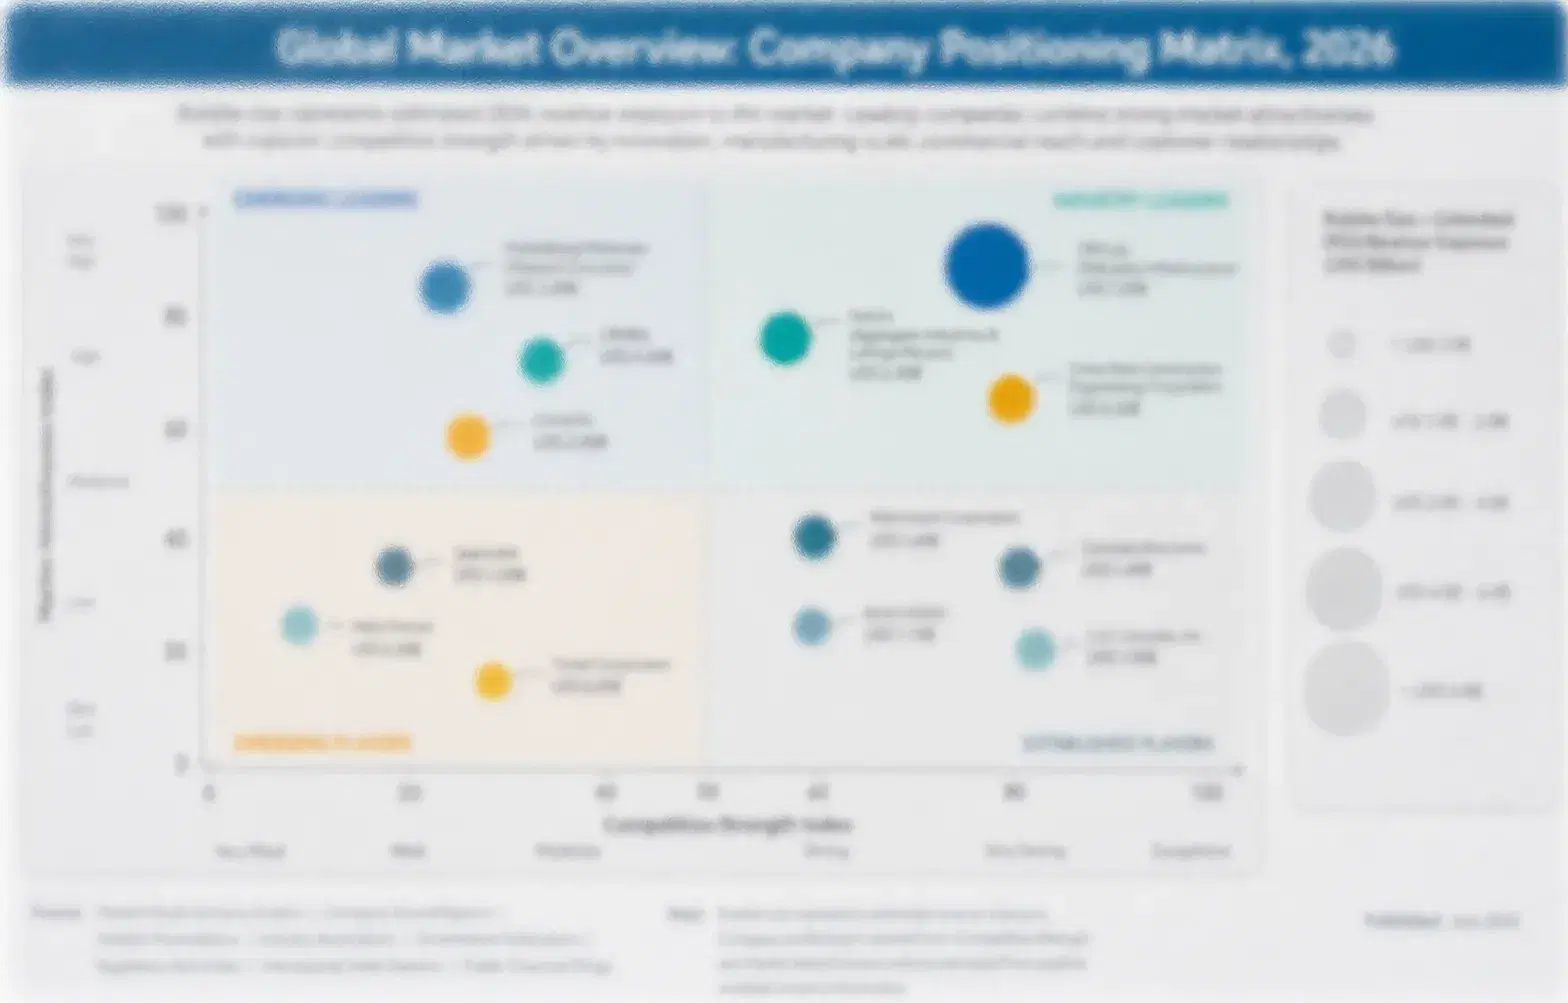
Five producers hold nearly half of global capacity, a concentration that reflects the enormous capital cost of furnace construction and the multi-decade asset life that rewards scale incumbents able to amortize that investment across huge production runs. O-I Glass and Verallia sit ahead of the next tier on furnace network breadth and pharmaceutical certification depth, while regional producers compete mainly on price for commodity beverage volume.
Competition plays out across three dimensions: pharmaceutical-grade certification that opens regulated volume, decorative finishing capability that commands premium cosmetics and spirits pricing, and recycled-content furnace leadership that captures sustainability-driven brand owner preference. Producers that can credibly deliver on all three are winning the fastest-growing, highest-margin volume, while those competing purely on commodity beverage price face continuous margin pressure from regional entrants.

Emerging pressure is coming from Chinese and Indian producers adding furnace capacity fast enough to challenge established Western producers on price within export markets, aided by lower labor and energy cost in several regions. Cullet processing and recycling technology companies are also becoming unexpected competitive factors, since producers with the strongest recycled-content supply chains are winning contracts that sustainability-focused brand owners once awarded based on price alone.
container-glass-market-company-positioning-matrix-1791419223447

Glass Container Competitive Landscape

O-I GLASS INC

Moat: Largest Global Furnace Network

O-I Glass operates the largest global furnace network across both mature and emerging markets, giving it unmatched scale to serve multinational beverage and pharmaceutical brand owners consistently across regions, while its purchasing scale secures raw material and energy pricing that smaller competitors cannot match. This advantage compounds during energy spikes, when smaller rivals cannot match its hedged terms.
O-I GLASS INC

Risk: High Legacy Debt Burden

O-I Glass carries a meaningfully higher debt load than several peers following past acquisitions and restructuring, constraining its flexibility to fund new furnace capacity investment as quickly as better-capitalized competitors during periods of rising interest rates. Investors have pushed the company to prioritize deleveraging over capacity expansion in recent reporting periods.
VERALLIA SA

Moat: European Wine and Spirits Depth

Verallia holds the deepest furnace network across Europe's wine and spirits producing regions, giving it unmatched relationships with premium beverage brand owners who value decorative finishing capability and reliable supply tied to harvest season timing specifically. That reliability is particularly valuable to premium wine brand owners who cannot afford packaging shortfalls during a narrow bottling window.
VERALLIA SA

Risk: Concentrated European Exposure

Verallia's revenue remains heavily concentrated in European wine and spirits categories, leaving it more exposed to European consumer demand cycles and energy price volatility than competitors with more geographically diversified furnace networks spanning multiple continents. A sustained downturn in European wine consumption would weigh on Verallia more heavily than on geographically diversified competitors.

Players Tracked

Prominent Players

O-I Glass Inc
Vidrala S.A.
Ardagh Group S.A.
Verallia SA
BA Glass S.A.

Other Key Players

Sisecam Group
Vetropack Holding AG
Piramal Glass Private Limited
Zignago Vetro S.p.A.
Heye International GmbH
Wiegand-Glas GmbH
Consol Glass Proprietary Limited
Nihon Yamamura Glass Co Ltd
Koa Glass Co Ltd
Shandong Jinjing Technology Co Ltd
Anchor Glass Container Corporation
Beatson Clark Limited
Allied Glass Containers Limited
Gerresheimer AG
Pacific Glass Corporation

Recent Developments

MARCH 2025

Verallia Acquires Regional Bottle Producer in South America

Verallia acquired a regional glass bottle producer in South America, expanding its Latin American furnace footprint to serve growing wine and beverage demand across Brazil and neighboring countries while reducing its historical reliance on European export volume into the region. The deal reflects a shift toward regional production.
Signal: Signals European leaders are building regional presence rather than exporting goods abroad.
JULY 2024

O-I Glass Forms Furnace Joint Venture in Southeast Asia

O-I Glass formed a joint venture with a Southeast Asian partner to build new furnace capacity serving the region's expanding beverage and pharmaceutical manufacturing base, sharing capital investment risk while gaining local market access and distribution relationships. The structure lets O-I Glass scale in without bearing full construction cost.
Signal: Signals joint ventures remain the preferred route into fast-growing Asian capacity now.
NOVEMBER 2024

Ardagh Group Commissions Lightweighted Furnace Line

Ardagh Group commissioned a new furnace line in Eastern Europe dedicated to lightweighted glass container production, adding capacity to meet rising brand owner demand for reduced-weight packaging that narrows the cost gap with plastic alternatives. The investment positions Ardagh ahead of demand for reduced-weight packaging across beverage categories.
Signal: Signals lightweighting investment is accelerating quickly among established scale producers today.

Energy and Raw Material Dominate Producer Cost

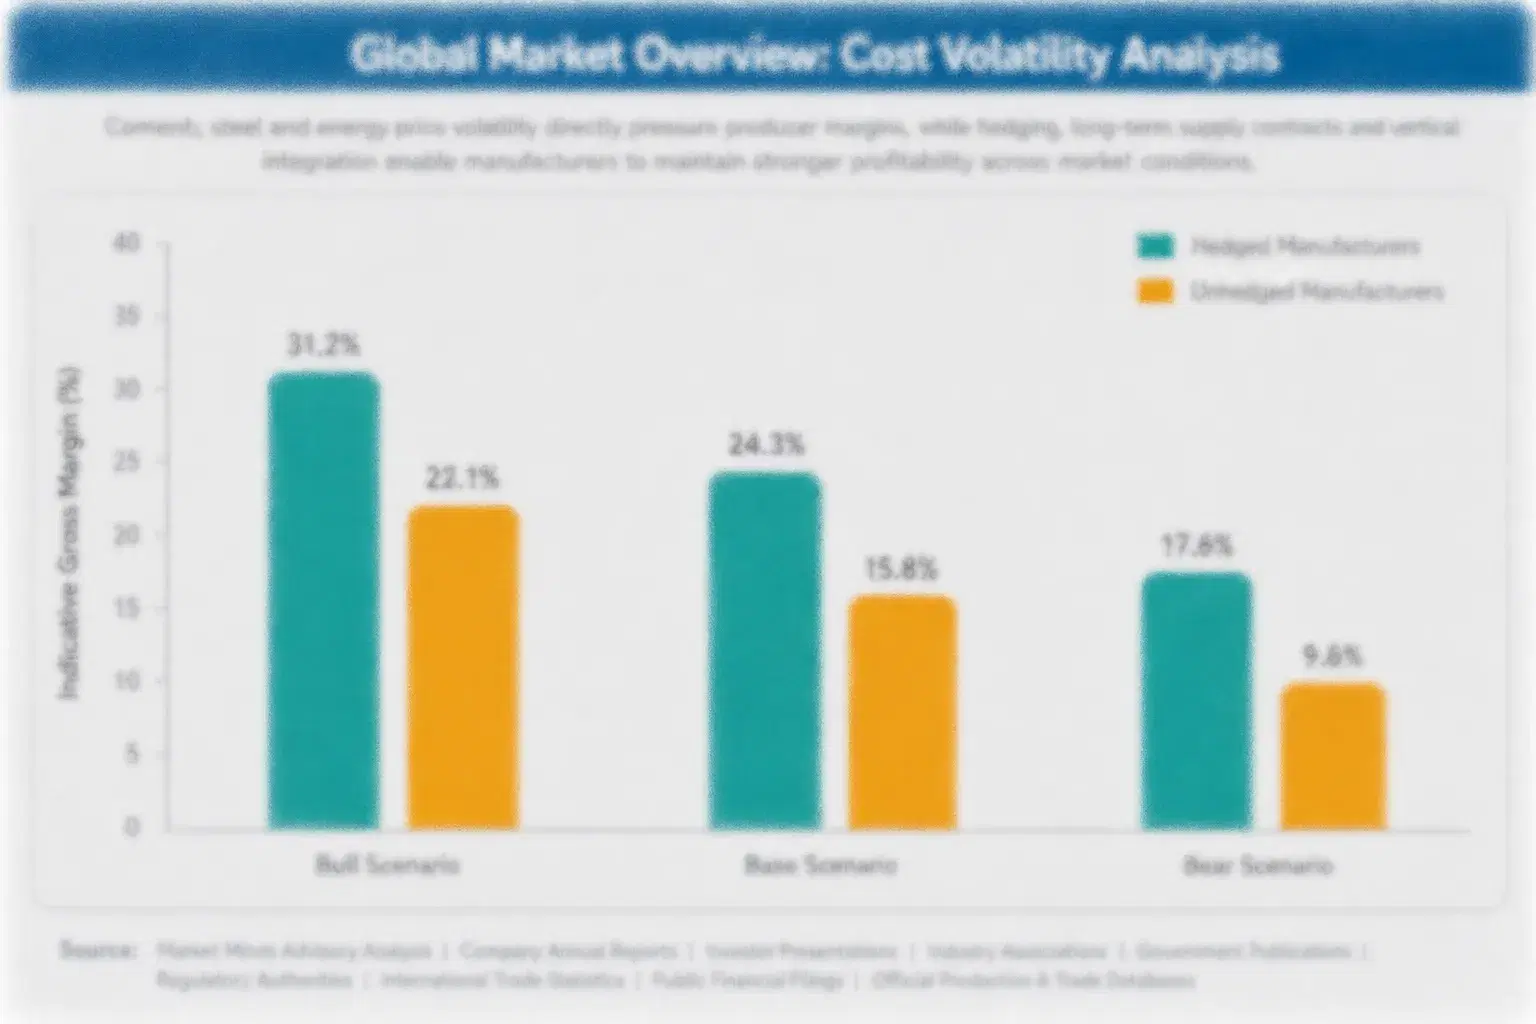
Soda ash, silica sand, and furnace energy together account for roughly 42 to 48% of producer cost of goods sold, with recycled cullet increasingly substituting for virgin raw material input as collection infrastructure improves across major markets. Furnace energy depends heavily on natural gas and electricity pricing, exposing producer costs directly to broader energy market volatility that other packaging materials processed at lower temperatures avoid.
Natural gas prices spiked sharply during 2022 as European supply disruptions squeezed industrial energy markets, compressing glass producer margins across the continent according to European Commission energy market reporting from that period. Producers without long-term energy supply contracts absorbed much of the cost increase directly, while producers with hedged procurement positions and flexible fuel-switching furnace technology protected margin considerably better through the same window. The disruption pushed several smaller operators toward temporary idling.

Smaller regional producers typically carry greater exposure to energy and raw material price swings than scale leaders, since they lack the purchasing volume to negotiate long-term fixed-price contracts with energy suppliers and raw material providers. This compounds during volatility spikes, pushing smaller producers toward idling or consolidation while scale leaders gain volume.
container-glass-market-cost-volatility-analysis-1791419223758

Long-Term Energy Supply Agreements With Price Caps

Producers increasingly negotiate multi-year energy supply agreements that cap price increases within a defined band in exchange for committed purchase volume, trading spot-market flexibility for budget predictability that supports fixed-price quotations given to beverage and pharmaceutical customers well in advance of delivery. This approach has become close to standard practice among scale producers over the past several contract renewal cycles.

Expanding Recycled Cullet Processing Capacity

Producers are investing in dedicated cullet processing and sorting capacity to increase recycled content in furnace feedstock, reducing both energy consumption and virgin raw material cost simultaneously while also meeting tightening regulatory recycled-content requirements across major consumer markets. Several producers now operate dedicated cullet sorting lines adjacent to their furnace facilities specifically to secure feedstock reliability.

Fuel-Switching Furnace Technology Investment

Producers are investing in furnace technology capable of switching between natural gas and electric heating depending on relative pricing, reducing exposure to any single energy source's volatility and providing operational flexibility during periods of unusual price divergence between fuel types. Early adopters of this dual-fuel capability report meaningfully smoother margin performance during recent energy price swings.

Portfolio Architecture for Margin Defence

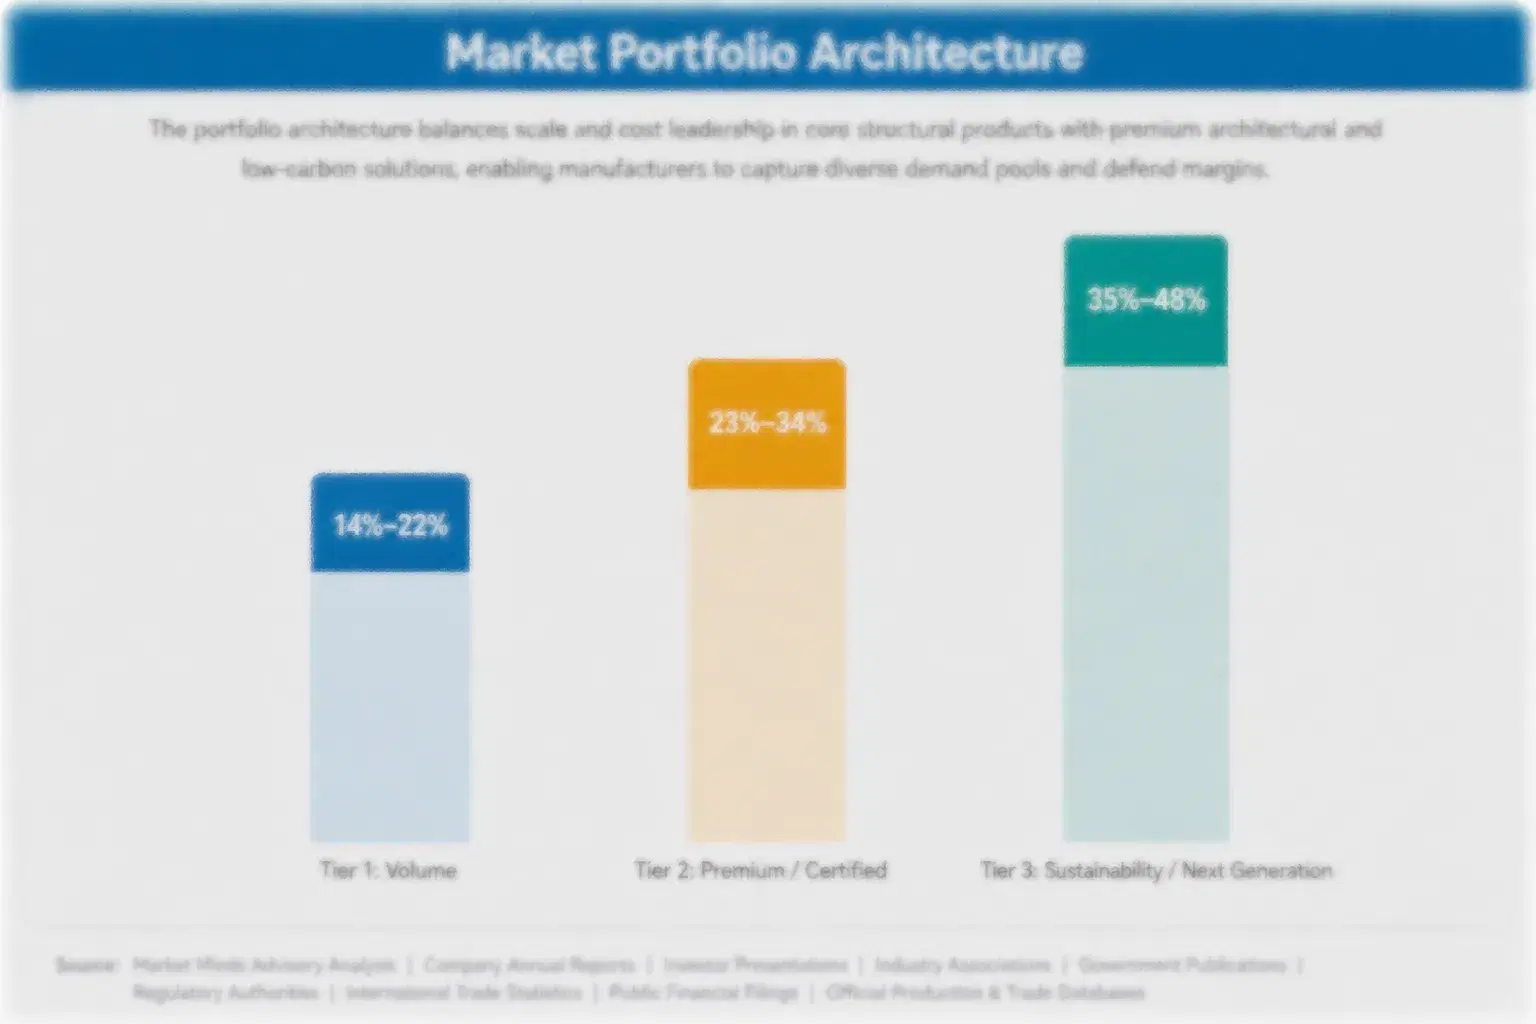
Producers generally run a three-tier portfolio spanning commodity beverage and food containers sold mainly on price and furnace efficiency, premium pharmaceutical and cosmetics containers commanding better economics tied to certification and finishing capability, and next-generation high-recycled-content and lightweighted structures still scaling toward full commercial volume. Gross margin varies substantially across these tiers, with commodity containers competing hardest on price.
The tension between commodity volume and premium tiers shapes producer capital allocation directly, since commodity furnace capacity generates steady cash flow but minimal margin expansion room, while premium pharmaceutical and cosmetics capability requires upfront certification and finishing investment before generating comparable returns. Producers without a clear tier strategy risk getting squeezed from both directions as regional entrants undercut commodity pricing. That dynamic is pushing some mid-sized producers toward consolidation.

High-value margin pools are concentrating in pharmaceutical and premium cosmetics containers, categories where customers are willing to pay meaningfully above commodity beverage pricing for certification and finishing quality. Producers positioned early in these categories are capturing a disproportionate share of total industry margin growth relative to their volume share today, a gap that keeps widening as certification becomes a bigger qualification hurdle for new entrants.

Volume / Commodity-Adjacent Tier

Beverage and food containers sold mainly on price and furnace efficiency to large-scale brand owners and regional bottlers across mature consumption categories. Margins here depend heavily on furnace utilization rates and proximity to filling operations.
Gross Margin: 12-18%

Premium / Certified Tier

Pharmaceutical and premium cosmetics containers carrying regulatory certification and decorative finishing capability, sold to customers willing to pay for documentation and quality. Producers in this tier typically maintain dedicated quality teams separate from commodity production lines.
Gross Margin: 24-32%

Sustainability / Regulatory / Next-Generation Tier

High-recycled-content and lightweighted structures still scaling toward full commercial volume, commanding premium pricing tied to sustainability compliance value across major markets. Adoption here is accelerating as more brand owners publish specific recycled-content targets.
Gross Margin: 20-28%
container-glass-market-portfolio-architecture-1791419224100

High-value Sub-segments and Strategic Watch-out

Pharmaceutical Containers

Pharmaceutical containers combine the fastest unit growth in the category with premium pricing tied to regulatory certification, making this the segment producers are prioritizing most heavily for new quality investment over the next several forecast years. Several producers have announced dedicated pharmaceutical production lines separate from their commodity furnace capacity.
Gross Margin: 26-34%

Cosmetics and Personal Care Containers

Cosmetics containers command strong pricing tied to premiumization trends and decorative finishing capability, representing the category's clearest path to margin growth beyond commodity beverage volume across most mature consumer markets today. Brand owners here pay a meaningful premium for custom mold designs that differentiate products on crowded shelves.
Gross Margin: 22-30%

Beverage Containers

Beverage containers remain the format's largest volume base, generating steady revenue even as growth moderates relative to higher-margin tiers, particularly across mature North American and Western European consumption markets. Producers serving this segment compete primarily on furnace efficiency and proximity to bottling operations rather than on specification depth.
Gross Margin: 10-16%

Household and Industrial Chemical Containers

Chemical containers face the most direct material substitution pressure from plastic alternatives and offer the least room for differentiation, making this segment a candidate for continued share erosion over the forecast period ahead. Producers still serving this segment treat it as a byproduct of existing capacity, not a growth priority.
Gross Margin: 8-13%

Why Glass Relationships Outlast Most Contracts

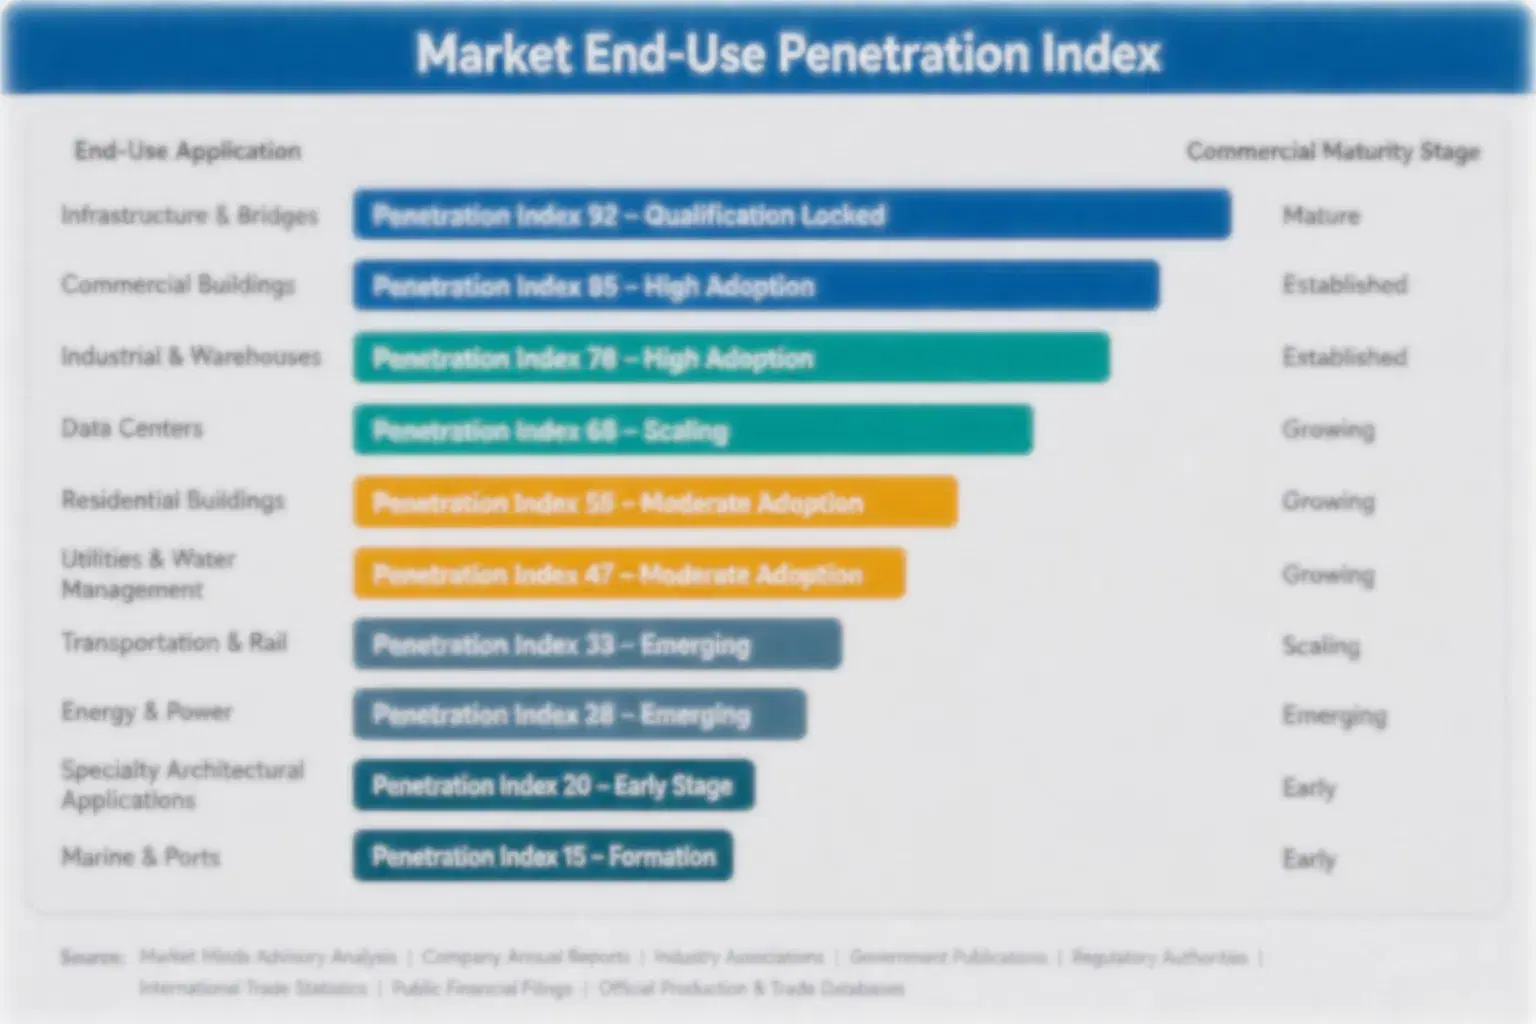
Glass container supply relationships function like genuine annuities in pharmaceutical and premium cosmetics categories, since regulatory qualification and custom mold tooling investment create real switching friction once a producer wins the initial contract. Commodity beverage relationships behave more like competitive utility contracts, since brand owners can and do shift volume between qualified producers based on price more readily than in premium categories. Switching a qualified pharmaceutical supplier mid-contract is rare.
Adoption depth varies sharply by end-use vertical. Beverage and food container use is fully mature with minimal remaining conversion opportunity, representing stable but price-competitive demand. Cosmetics and personal care adoption remains mid-stage, with meaningful volume still packaged in plastic alternatives that premiumization trends are gradually converting toward glass. Pharmaceutical adoption keeps expanding steadily, tracking healthcare spending growth more closely than discretionary consumer demand cycles.

Brand owner procurement increasingly separates commodity beverage sourcing, handled through competitive bidding focused on price and furnace proximity, from premium category sourcing, which emphasizes certification depth and decorative finishing capability. This split is becoming more pronounced as procurement teams specialize by category rather than treating all glass sourcing as a single undifferentiated decision across the organization.
container-glass-market-end-use-penetration-index-1791419224422

What Glass Producers Should Prioritize

These are among the four positions where our research anticipates prominent divergence between winners and laggards over the coming forecast period. Each is grounded in the demand model, the regulatory perimeter, and the announced capacity pipeline.
01 / PHARMACEUTICAL CERTIFICATION PRIORITY

Build pharmaceutical-grade certification ahead of demand growth

Producers investing in pharmaceutical-grade quality certification now are capturing meaningfully better pricing than those still relying on commodity beverage production alone, and that gap is widening as aging populations and generic drug manufacturing both accelerate demand for regulated packaging volume. Commodity beverage capacity still generates useful cash flow, but it offers little room for margin expansion as regional entrants keep adding capacity at similar cost structures. Producers that delay this certification risk ceding the fastest-growing, highest-margin volume to competitors who moved earlier.
02 / RECYCLED CONTENT LEADERSHIP

Build high-cullet furnace capability before regulation forces it

Brand owners are already shortlisting producers based on recycled-content capability, not waiting for regulation to fully mandate higher thresholds before shifting procurement preference toward producers with proven cullet processing infrastructure. Producers without this capability risk exclusion from sustainability-focused brand owner contracts entirely, since procurement teams increasingly score recycled content as a qualification criterion. Early positioning is becoming a precondition for winning this higher-margin business at meaningful scale, though producers evaluating this path should expect a multi-year payback window rather than immediate returns.
03 / REGIONAL FURNACE EXPANSION

Build South Asian furnace capacity ahead of confirmed demand

Beverage and pharmaceutical manufacturers across India and Southeast Asia are actively seeking producers with proven regional furnace presence, creating opportunity for producers willing to invest ahead of fully confirmed order volume given furnace construction lead times. Producers that wait for confirmed demand before building this capacity risk losing the business entirely to competitors who invested earlier and can offer shorter supply distances. This dynamic is reshaping where global furnace investment flows over the next several years, and capital committed now locks in capacity years before competitors can match it.
04 / ENERGY PROCUREMENT STRATEGY

Lock in long-term energy contracts before the next volatility cycle

Energy price volatility hit producers without long-term supply agreements hardest during the 2022 natural gas spike, and nothing about current global energy market conditions suggests that kind of shock cannot recur within the forecast period covered by this report. That risk tends to widen further once volatility actually materializes across the broader industrial sector, catching unhedged producers at their most vulnerable moment. Producers that negotiate multi-year, price-capped energy agreements now are trading some short-term flexibility for meaningfully better protection against the next volatility cycle facing the industry.

Engagement Snapshot From the Field

A live engagement with an industry participant carrying material or product regulatory and market exposure ahead of a defining policy shift, showing how our research translates into a defensible multi-year portfolio strategy.
MARKET MINDS ADVISORY · CLIENT ENGAGEMENT SUMMARY
Glass Container Producer Strategic Portfolio Review and Transition Roadmap 2026·Investment Scenario on Glass Container Exposure Evaluation 2025-26
CLIENT PROFILE
The client is a multinational beverage brand owner with annual revenue exceeding $4 billion (client-reported, unverified by MMA), sourcing glass containers across multiple regions from a mix of long-standing and newer regional producers for its flagship bottled product lines. The company faced growing pressure from retail partners and investors to demonstrate measurable progress on packaging recycled-content commitments across its global supply base.
STRATEGIC CHALLENGE
The client needed to evaluate which of its existing glass container suppliers could realistically meet rising recycled-content targets within the committed timeline, without a clear internal framework for assessing supplier cullet processing capability or the capital investment required to close any gaps identified. The client also lacked visibility into which suppliers were already furthest along versus which would need years of additional investment.
MMA APPROACH
MMA's team benchmarked recycled-content capability across the client's twelve largest glass suppliers, modeled the capital investment each supplier would need to reach target thresholds, and facilitated supplier scorecarding discussions that informed the client's updated long-term sourcing allocation strategy across its global production network. The engagement concluded with a prioritized supplier shortlist mapped against investment timeline and risk.
KEY FINDINGS
  1. Only four of twelve suppliers already operated furnace infrastructure capable of meeting the client's recycled-content target without meaningful additional capital investment on their part.
  2. Suppliers in Western Europe demonstrated meaningfully higher baseline cullet content than suppliers in other regions, reflecting the maturity of regional bottle collection infrastructure.
  3. Three suppliers indicated willingness to co-invest in cullet processing capacity if the client committed to multi-year volume guarantees supporting that capital investment.
  4. Reallocating volume toward higher-cullet suppliers was projected to improve the client's blended recycled-content metric meaningfully within eighteen months of implementation. within the client's existing annual sourcing cycle.
CLIENT PROFILE
The client is a multinational beverage brand owner with annual revenue exceeding $4 billion (client-reported, unverified by MMA), sourcing glass containers across multiple regions from a mix of long-standing and newer regional producers for its flagship bottled product lines. The company faced growing pressure from retail partners and investors to demonstrate measurable progress on packaging recycled-content commitments across its global supply base.
STRATEGIC CHALLENGE
The client needed to evaluate which of its existing glass container suppliers could realistically meet rising recycled-content targets within the committed timeline, without a clear internal framework for assessing supplier cullet processing capability or the capital investment required to close any gaps identified. The client also lacked visibility into which suppliers were already furthest along versus which would need years of additional investment.
MMA APPROACH
MMA's team benchmarked recycled-content capability across the client's twelve largest glass suppliers, modeled the capital investment each supplier would need to reach target thresholds, and facilitated supplier scorecarding discussions that informed the client's updated long-term sourcing allocation strategy across its global production network. The engagement concluded with a prioritized supplier shortlist mapped against investment timeline and risk.
KEY FINDINGS
  1. Only four of twelve suppliers already operated furnace infrastructure capable of meeting the client's recycled-content target without meaningful additional capital investment on their part.
  2. Suppliers in Western Europe demonstrated meaningfully higher baseline cullet content than suppliers in other regions, reflecting the maturity of regional bottle collection infrastructure.
  3. Three suppliers indicated willingness to co-invest in cullet processing capacity if the client committed to multi-year volume guarantees supporting that capital investment.
  4. Reallocating volume toward higher-cullet suppliers was projected to improve the client's blended recycled-content metric meaningfully within eighteen months of implementation. within the client's existing annual sourcing cycle.
RECOMMENDED STRATEGY
Phase 1: Phase 1 (Months 1-3): Benchmark recycled-content capability and capital investment needs across the client's twelve largest suppliers. across the client's global supplier base. Phase 2: Phase 2 (Months 4-8): Negotiate co-investment and volume guarantee terms with suppliers willing to expand cullet processing capacity. backed by multi-year purchase commitments. Phase 3: Phase 3 (Months 9-18): Reallocate sourcing volume toward higher-cullet suppliers and track blended recycled-content metric improvement. on a rolling quarterly basis going forward.
OUTCOME
The client reallocated a meaningful share of its sourcing volume toward higher-cullet suppliers and reported recycled-content metric improvement in line with projections (client-reported, unverified by MMA) within the first year of implementation. The client has since extended the same supplier scorecarding approach to its broader packaging portfolio beyond glass specifically.

Frequently Asked Questions

Foundational context covering the market sizes, CAGR, scope, country, region and competition that inform every finding below. This section is provided to cover basics and most often pre-purchase conversations, answered from the MMA Primary Research Dataset.

What is the current size of the Glass Container Market?

The global glass container market reached $58.0 billion in base year 2025. Growth is driven primarily by pharmaceutical demand and premiumization trends in cosmetics and spirits packaging.

How large will the Glass Container Market be by 2036?

MMA projects the market will reach approximately $91.2 billion by 2036, roughly 1.5 times the 2026 figure. This reflects sustained pharmaceutical and premium category growth.

What is the CAGR for the Glass Container Market 2026 to 2036?

The market is forecast to grow at a compound annual growth rate of 4.2% between 2026 and 2036. That pace reflects continued pharmaceutical and premiumization-driven demand.

Which segment is growing fastest?

Pharmaceutical containers are the fastest-growing segment, expanding at roughly 1.55 times the overall market CAGR. Aging populations and expanding chronic disease treatment volumes are driving this growth.

Who are the major companies in the Glass Container Market?

O-I Glass, Vidrala, Ardagh Group, Verallia, and BA Glass lead the global market. Together they hold an estimated 48% of global capacity, reflecting enormous furnace construction capital barriers.

Which country is growing fastest?

India is the fastest-growing country market, expanding at roughly 7.0% annually, driven by its position as a leading global generic drug manufacturing and export hub.

Glass Container Segmentation by Type and Use

The full report scope spans multiple orthogonal segmentation dimensions, with cross-tabulated demand data provided for each dimension pair. Coverage extends further to regional breakdowns, trend trajectories, and the competitive detail needed to support segment-level decision-making.

By End-Use Industry

  • Food
  • Beverage
  • Alcoholic Beverage
  • Pharmaceutical
  • Cosmetics and Personal Care
  • Household and Industrial Chemicals

By Commercial Dimension

  • Branded Retail
  • Private Label
  • Contract and Custom Mold Supply

By Distribution Channel

  • Direct-to-Brand-Owner Supply
  • Co-Packer and Contract Filler Supply
  • Regional Distributor Networks

By Region

  • North America
  • Western Europe
  • East Asia
  • South Asia and Pacific
  • Latin America
  • Middle East and Africa
  • Eastern Europe

Scope, Methodology, and Coverage

Every figure in this report is reproducible from documented input assumptions. The scope below maps the historical period, the forecast horizon, the segmentation dimensions, and the countries covered, alongside the underlying primary and qualitative methodology.
Historical Period
2020 to 2025
Forecast Period
2026 to 2036
Base Year
2025 (USD billions; MMA Primary Research Dataset, October 2026)
Market Definition
The glass container market covers rigid glass bottles and jars used for food, beverage, pharmaceutical, cosmetics and personal care, and household and industrial chemical packaging, segmented by end-use industry. It excludes glass tableware and drinkware, glass manufactured for non-packaging uses such as flat or fiberglass, premium spirits bottles carrying bespoke embossing or decoration programs, and specialty pharmaceutical vials, ampoules, and cartridges, each of which is covered under a separate market scope.
Quantitative Units
USD billions (current prices); billion units of converted volume where applicable
Segmentation Dimensions
By End-Use Industry; By Commercial Dimension; By Distribution Channel; By Region
Regions Covered
North America, Western Europe, East Asia, South Asia and Pacific, Latin America, Middle East and Africa, Eastern Europe
Countries Covered
USA, China, Germany, France, Italy, UK, Japan, South Korea, India, Vietnam, Indonesia, Australia, Canada, Brazil, Mexico, Argentina, UAE, Saudi Arabia, South Africa, Nigeria, Turkey, Poland, Netherlands, Spain, Sweden, Switzerland, Romania, Czech Republic, and additional markets relevant to this sector
Key Companies Profiled
O-I Glass Inc, Vidrala S.A., Ardagh Group S.A., Verallia SA, BA Glass S.A., Sisecam Group, Vetropack Holding AG, Piramal Glass Private Limited, Zignago Vetro S.p.A., Heye International GmbH, Wiegand-Glas GmbH, Consol Glass Proprietary Limited, Nihon Yamamura Glass Co Ltd, Koa Glass Co Ltd, Shandong Jinjing Technology Co Ltd, Anchor Glass Container Corporation, Beatson Clark Limited, Allied Glass Containers Limited, Gerresheimer AG, Pacific Glass Corporation
Quantitative Methodology
Primary survey, n=3,800 respondents, Q4 2025, six countries; demand-side model with trade association cross-validation
Qualitative Methodology
47 expert interviews, Q4 2025; applied to validate demand model assumptions, identify emerging dynamics, and assess competitive positioning
Report Format
PDF and XLSX data workbook (Word format preview document)
Publisher
Market Minds Advisory
Report Code
MMA-2026-PAC-219
Published
October 2026
Contact
sales@marketmindsadvisory.com | www.marketmindsadvisory.com

Purchase the full Glass Container Market Report (2026 to 2036).

The full report provides detailed market sizing and ten-year forecasts across all six end-use segments and all seven world regions, supported by producer-level capacity benchmarking and primary interview findings. It includes in-depth competitive profiles of the top five producers alongside second-tier player coverage, energy and raw material cost exposure analysis, and recycled-content tracking across major consumer markets. Segment-specific margin and pricing data is broken out separately from headline market figures to support both strategic planning and tactical sourcing decisions. Buyers receive the full data set in editable format alongside the formatted report document itself.
Ten-year market sizing across six end-use segments
Producer capacity benchmarking on a consistent basis
Recycled-content tracking across major consumer markets
Energy and raw material cost exposure analysis
Editable data tables alongside the formatted report
Primary interview findings from 47 industry experts

Built For The People Who Decide

From boardroom strategy to bench-side execution, this report is read cover-to-cover by leaders shaping the next decade of their industry, turning demand scenarios, market dynamics and valuation benchmarks into decisions.
CXOs/ Presidents/ VPs/ Managers
M&A and Corporate Development
Strategy Teams and R&D Heads
Procurement and Product Directors
Regulatory and Compliance Leaders
Investor Relations and Equity Analysts