Market Minds Advisory
Beer Packaging Market

Beer Packaging Market: Can Conversion, Glass Legacy, and the Aluminum Cost Cycle

Brewers keep shifting volume from glass to cans faster than glass makers can redeploy furnace capacity, even as can sheet pricing swings with metal markets and African growth pulls fresh capacity investment.

Lead Analyst

Bilal Shaikh

Published

September 2026

Make Smarter Decisions with Customized Research Insights

Request a free sample report and evaluate market opportunities, growth trends, and competitive dynamics relevant to your business needs.

2025 MARKET VALUE$64.0BMarket Size 2025
2036 FORECAST VALUE$100.6BBase Case , 2026 to 2036
CAGR 2026 TO 20364.2 %Bull 5.5% / Bear 2.9%
INCREMENTAL OPPORTUNITY$33.9BNet 10- year value creation
EXPANSION MULTIPLE1.51x2036 value over 2026 base
Strategic Levers
M&A Pipeline
Regional Outlook
Country Rankings
Competitive Intelligence
Segmental Deep-dive
Call-Us : 91 93563 13602

Executive Snapshot and Market Trajectory

Aluminum cans are pulling share from glass at a pace few packaging forecasts anticipated, as sustainability positioning, lower shipping weight, and craft brewer preference all point the same direction simultaneously across nearly every major beer market tracked worldwide this year and next.
Glass bottles still carry the largest existing volume, but aluminum cans and PET bottles pull growth fastest as portability and lightweighting both reward formats glass simply cannot match on cost today. East Asia produces the largest packaging tonnage on Chinese beer volume alone, while Middle East and Africa compounds meaningfully as Nigerian and broader African brewery capacity expansion pulls local packaging investment that imports increasingly cannot serve fast enough.
Five suppliers hold roughly half of a moderately concentrated global market, and Ball Corporation's can manufacturing scale and sustainability positioning have proven durable even as O-I Glass defends deep brewer relationships across glass-dominant European and Latin American markets specifically, consistently, and profitably. Aluminum price volatility, glass-to-can conversion economics, and emerging market brewery capacity expansion now decide who wins large brewer contracts faster than any single packaging design innovation moving through this category this decade.
Market Definition
The market covers primary containers used to package beer for retail and hospitality sale, including aluminum cans, glass bottles, PET bottles, stainless steel kegs, and bag-in-box formats, sold to brewers and co-packers. Secondary packaging, closures, and labels sold as standalone components are excluded.
Base Year Value
$64.0B in 2025 (MMA Primary Research Dataset, August 2026)
Forecast Period
2026 to 2036, eleven discrete annual values
CAGR
4.2% base case. Bull 5.5%. Bear 2.9%.
Fastest Growth Segment
Aluminum Cans: 6.8% CAGR
Fastest Growth Country
Nigeria: 8.5% CAGR
Fastest Growth Region
South Asia and Pacific: 6.3% CAGR
Largest Region
East Asia: 30% of 2025 global value
Market Leaders
Ball Corporation, Crown Holdings Inc., Ardagh Group S.A., O-I Glass Inc., CANPACK S.A. Source: MMA Analysis based on company annual reports.
Primary Survey
n=3,800 procurement and R&D decision-makers, Q4 2025, six countries
Methodology
Demand-side build-up, cross-validated against public data, 47 expert interviews

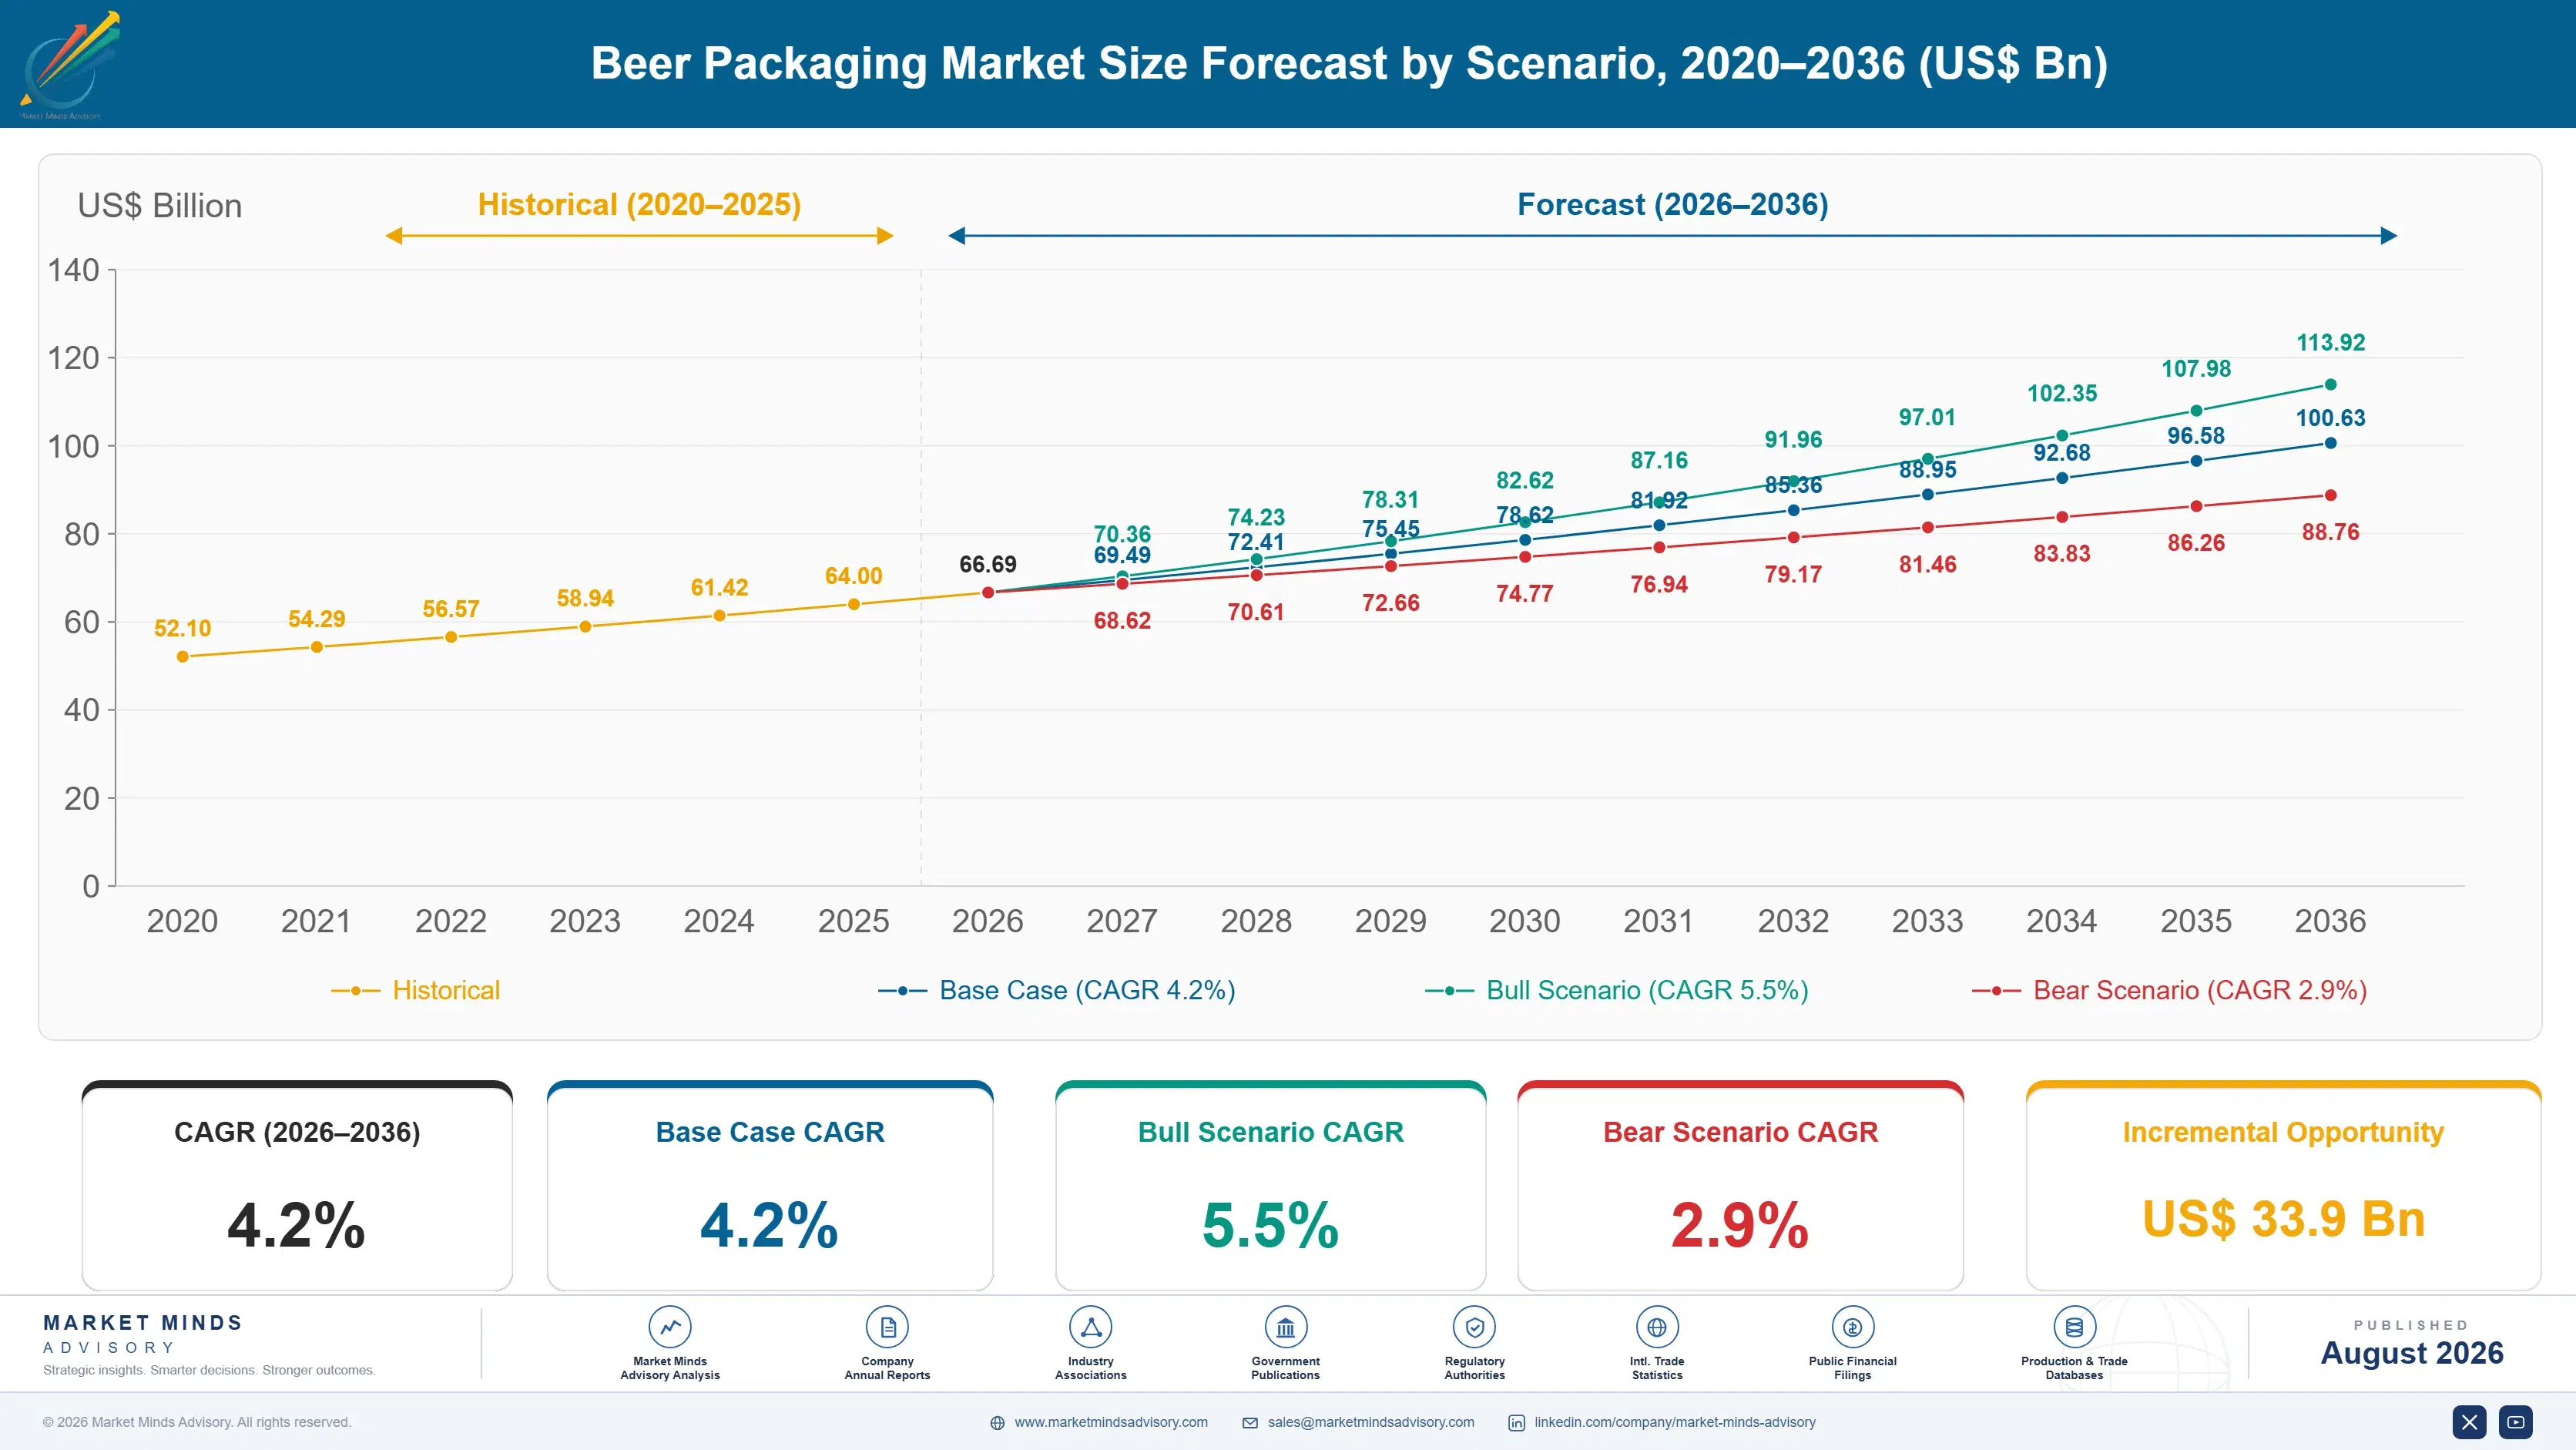
Beer Packaging Market Forecast Scenarios

beer-packaging-market-size-forecast-scenario-1787300837915
Beer packaging demand grew near 3.2% annually between 2020 and 2025, held back by 2020 to 2021 on-premise channel closures before at-home consumption growth and reopened bars and restaurants restored steadier volume through the back half of the period across most major consuming markets tracked worldwide, particularly across emerging African and Southeast Asian markets specifically.
The base case reaches 4.2% on three mechanisms. First, glass-to-can conversion keeps advancing as brewers and retailers both favour aluminum's lighter shipping weight and stronger recyclability positioning over traditional glass bottling. Second, African and Southeast Asian beer consumption growth outpaces mature-market volume as rising incomes and urbanization pull first-time drinkers toward branded packaged beer. Third, craft and premium segment growth sustains steady demand for smaller-format cans and bottles that carry higher per-unit packaging value.
The bull case at 5.5% assumes can conversion accelerates faster than currently modelled and African brewery capacity expansion proceeds ahead of schedule across multiple markets simultaneously and reliably. The bear case at 2.9% assumes aluminum price volatility discourages capacity investment and a broader consumer spending slowdown reduces packaged beer volume growth across price-sensitive emerging markets specifically.

Can Conversion Economics Reshaping Brewer Contracts

Beer packaging behaves like a shipping cost equation wearing a branding label. Aluminum cans compete on weight, recyclability, and craft brand appeal, while glass bottles compete on premium positioning and markets where returnable bottle deposit systems remain economically dominant across an entirely different retail channel structure, and both draw on overlapping metal and glass supply chains that a single feedstock shock can disrupt at once.
CR5 CONCENTRATION48%Top five suppliers hold roughly half the global market
AVERAGE SELLING PRICEUSD 0.09 per containerBlended price across cans, bottles, and kegs today
LEADING PRODUCING COUNTRYChina, 22% shareOne country produces the largest packaging tonnage globally
CAN CONVERSION RATE58% of new volumeShare of new packaging orders now specifying aluminum
TRADE INTENSITY16% cross-borderMost finished containers stay within their producing region
ALUMINUM SHARE OF COGS42-50%Can sheet aluminum dominates the total production cost base
Commercial activity concentrates around brewer capacity contracts rather than packaging design innovation alone. Suppliers that secure long-term can sheet aluminum supply and hold capacity near major brewery clusters win large contracts that import-dependent competitors increasingly cannot match on cost or delivery lead time, since freight on empty containers erodes margin quickly across long shipping distances and multiple border crossings.
Over the next decade, aluminum price cycles and glass-to-can conversion pace will matter more than any single packaging format innovation introduced this cycle across the industry. African brewery capacity build-out, returnable bottle system economics, and can sheet supply security will decide who captures the next wave of large brewer contracts before customers lock multi-year supply agreements that are costly to unwind.
"Everybody talks about branding. What actually decides a brewer contract now is whether a supplier can guarantee aluminum supply through the next metal price cycle without flinching."
Director, Beverage Packaging Practice · MMA Beverage Container Packaging Practic

Market Trends

Craft Brewers Rapidly Accelerate Glass-To-Can Conversion

Craft and independent brewers, once glass bottling's most loyal customer base, have shifted decisively toward cans over the past several years as portability, lower shipping cost, and stronger shelf branding real estate all favour aluminum over traditional glass bottling. Ball Corporation and Crown Holdings have both reported growing craft segment order volume even as overall can demand from large national brewers stayed comparatively steady. This shift matters because craft brewers historically anchored premium glass bottle demand, and their departure removes a customer segment glass makers had counted on to offset volume losses elsewhere in the category.
Market Impact: Cuts packaging carbon footprint by 35%

African Brewery Capacity Expansion Pulls Local Packaging Investment

Heineken, AB InBev, and Diageo have all announced new or expanded brewery capacity across Nigeria, and several other African markets over the past several years, responding to a young, urbanizing population that is driving some of the world's fastest beer consumption growth. This capacity expansion pulls packaging investment alongside it, since brewers increasingly prefer local can and bottle production over imported packaging that adds cost and lead time to already thin margins. Nampak and other regional packaging suppliers are expanding capacity specifically to serve this brewery buildout, though qualified capacity still trails brewer expansion plans in several markets.
Market Impact: Adds 45 million new drinkers yearly

Market Opportunities and Growth Drivers

Sustainability Positioning Favours Aluminum Over Glass Packaging

Aluminum cans carry meaningfully higher recycled content rates than glass bottles in most major markets, and cans are lighter to ship, both factors that increasingly matter to retailers and brewers pursuing corporate sustainability commitments tied to packaging carbon footprint. Major retailers have begun favouring can formats in shelf allocation decisions specifically, citing both recyclability messaging and the lower freight emissions lighter aluminum packaging enables across long supply chains. This retailer-level preference is pulling brewer packaging decisions toward cans even in markets where glass previously held a strong cultural or premium positioning advantage.
Market Impact: Swings aluminum cost 35% in months

Emerging Market Beer Consumption Growth Outpaces Mature Markets

Beer consumption across Africa and Southeast Asia continues growing meaningfully faster than mature Western European and North American markets, where per-capita consumption has plateaued or modestly declined amid changing consumer preferences toward other beverage categories. Rising incomes, urbanization, and a young population structure across these emerging markets are pulling first-time drinkers toward branded packaged beer rather than informal or homemade alternatives that dominated consumption previously. This consumption growth translates directly into packaging demand, since nearly all commercially sold beer in these markets requires can, bottle, or keg packaging regardless of local manufacturing capacity constraints.
Market Impact: Strands 15% of installed capacity

Market Restraints and Challenges

Aluminum Price Volatility Compresses Can Manufacturer Margins

Aluminum prices swung by more than 35% between 2021 and 2023, driven by pandemic-disrupted supply chains and subsequent energy cost inflation affecting smelting capacity across major producing regions simultaneously. The root cause is thin global smelting capacity relative to demand swings, layered onto energy cost volatility that directly affects aluminum production cost given how electricity-intensive smelting remains. Can manufacturers that quoted fixed-price annual contracts during the 2021 order surge absorbed losses when aluminum costs spiked before contract renewal. Several suppliers are now negotiating aluminum price-adjustment clauses into brewer agreements to share that risk directly rather than absorb it alone.
Market Impact: Shifts 30% of craft volume

Glass Furnace Redeployment Lag Strands Legacy Capacity

Glass furnaces require months of planned downtime to reconfigure production, and the capital cost of converting or closing furnace capacity as demand shifts toward cans creates a genuine mismatch between installed glass capacity and actual brewer demand. The root cause is the sunk capital nature of furnace investment, which glass makers cannot simply redirect toward can manufacturing without an entirely separate capital programme. This leaves glass makers carrying underutilised capacity in markets converting fastest to cans, compressing returns on assets that still have years of operating life remaining. Some producers are responding by consolidating production into fewer, more efficient furnaces.
Market Impact: Adds 12 new brewery lines regionally
3 additional market trends, 4 additional growth drivers, and 2 additional restraints and challenges are covered in the full report. Contact sales@marketmindsadvisory.com to access the complete intelligence.

Segment CAGR and Growth Architecture

Segmentation follows container material, a single classification logic grounded in the substrate and manufacturing process each format uses, from extruded aluminum sheet to blown glass and molded PET resin. Each material carries its own capital equipment, recyclability profile, and brewer qualification process, so commercial position tracks material chemistry rather than beer style or brand positioning.
beer-packaging-market-market-share-analysis-1787300838447

Aluminum Cans

Aluminum cans grow fastest at 6.8%, about 1.62 times the overall 4.2% rate, as craft brewer conversion, retailer sustainability preference, and lighter shipping weight all pull volume away from traditional glass bottling. Ball Corporation and Crown Holdings dominate global can manufacturing capacity, having both invested heavily in new lines specifically to serve craft segment growth that barely existed at meaningful scale a decade ago. Recycled content rates for aluminum cans run meaningfully higher than glass bottles in most markets, giving brewers a genuine sustainability marketing argument that resonates with younger consumers specifically. Can sheet aluminum supply security increasingly separates suppliers who can reliably fulfil large brewer contracts from those exposed to spot market volatility during tight metal cycles.
CAGR 6.8%

PET Bottles

PET bottles grow second-fastest at 5.9%, driven overwhelmingly by emerging market growth where lighter weight and lower breakage risk than glass matter more to distribution economics than any premium positioning glass bottles carry in mature markets. India and several African markets have seen PET adoption accelerate specifically as brewers expand distribution into regions with underdeveloped cold-chain and retail infrastructure that glass bottles handle poorly given breakage risk during transport. Amcor and other global packaging suppliers have expanded PET bottle manufacturing capacity in these regions specifically to capture this growth. The format remains a genuinely small share of packaging in mature Western markets, where consumer perception still favours glass or cans over plastic for beer specifically.
CAGR 5.9%
Full segment breakdown across 6 segments available in the complete report.

Regional Architecture and Country Demand Map

Seven regions divide between manufacturing scale and consumption growth momentum currently. East Asia produces the largest packaging tonnage on Chinese beer volume, while South Asia and Pacific compounds fastest as Vietnamese and Indian beer consumption growth pulls local packaging capacity that imports increasingly cannot serve.

North America

Craft brewing pioneered the modern can conversion trend here, and Ball Corporation and Crown Holdings both maintain extensive domestic manufacturing capacity specifically to serve a market where can share of new packaging orders now exceeds every other region tracked. Large national brewers including Anheuser-Busch and Molson Coors run substantial in-house canning lines alongside third-party supplier relationships, limiting opportunity for independent suppliers competing purely on price. State-level bottle deposit and extended producer responsibility rules add compliance complexity that varies meaningfully by jurisdiction across the country. Growth trails East Asia and South Asia because per-capita beer consumption has plateaued here, so incremental growth comes mainly from format conversion rather than new volume.
Share: 23% | CAGR: 4.0% (2026 to 2036)

Western Europe

Germany, Belgium, and the UK maintain the world's deepest glass bottle heritage, where returnable bottle deposit systems remain economically dominant in several markets and cultural preference for glass persists even as cans gain share elsewhere. Vetropack and Verallia both anchor substantial regional glass manufacturing capacity specifically to serve this entrenched preference across the bloc. Ardagh Group runs significant can and glass capacity simultaneously, positioning it to capture share regardless of which format wins in any specific national market. Growth trails every faster-growing region because per-capita consumption is already mature and the region's returnable bottle infrastructure, while environmentally efficient, moves format conversion more slowly than markets without comparable deposit systems in place.
Share: 19% | CAGR: 2.8% (2026 to 2036)
Regional intelligence for 5 additional markets available in the complete report: East Asia, South Asia and Pacific, Latin America, Middle East and Africa, Eastern Europe. Contact sales@marketmindsadvisory.com.
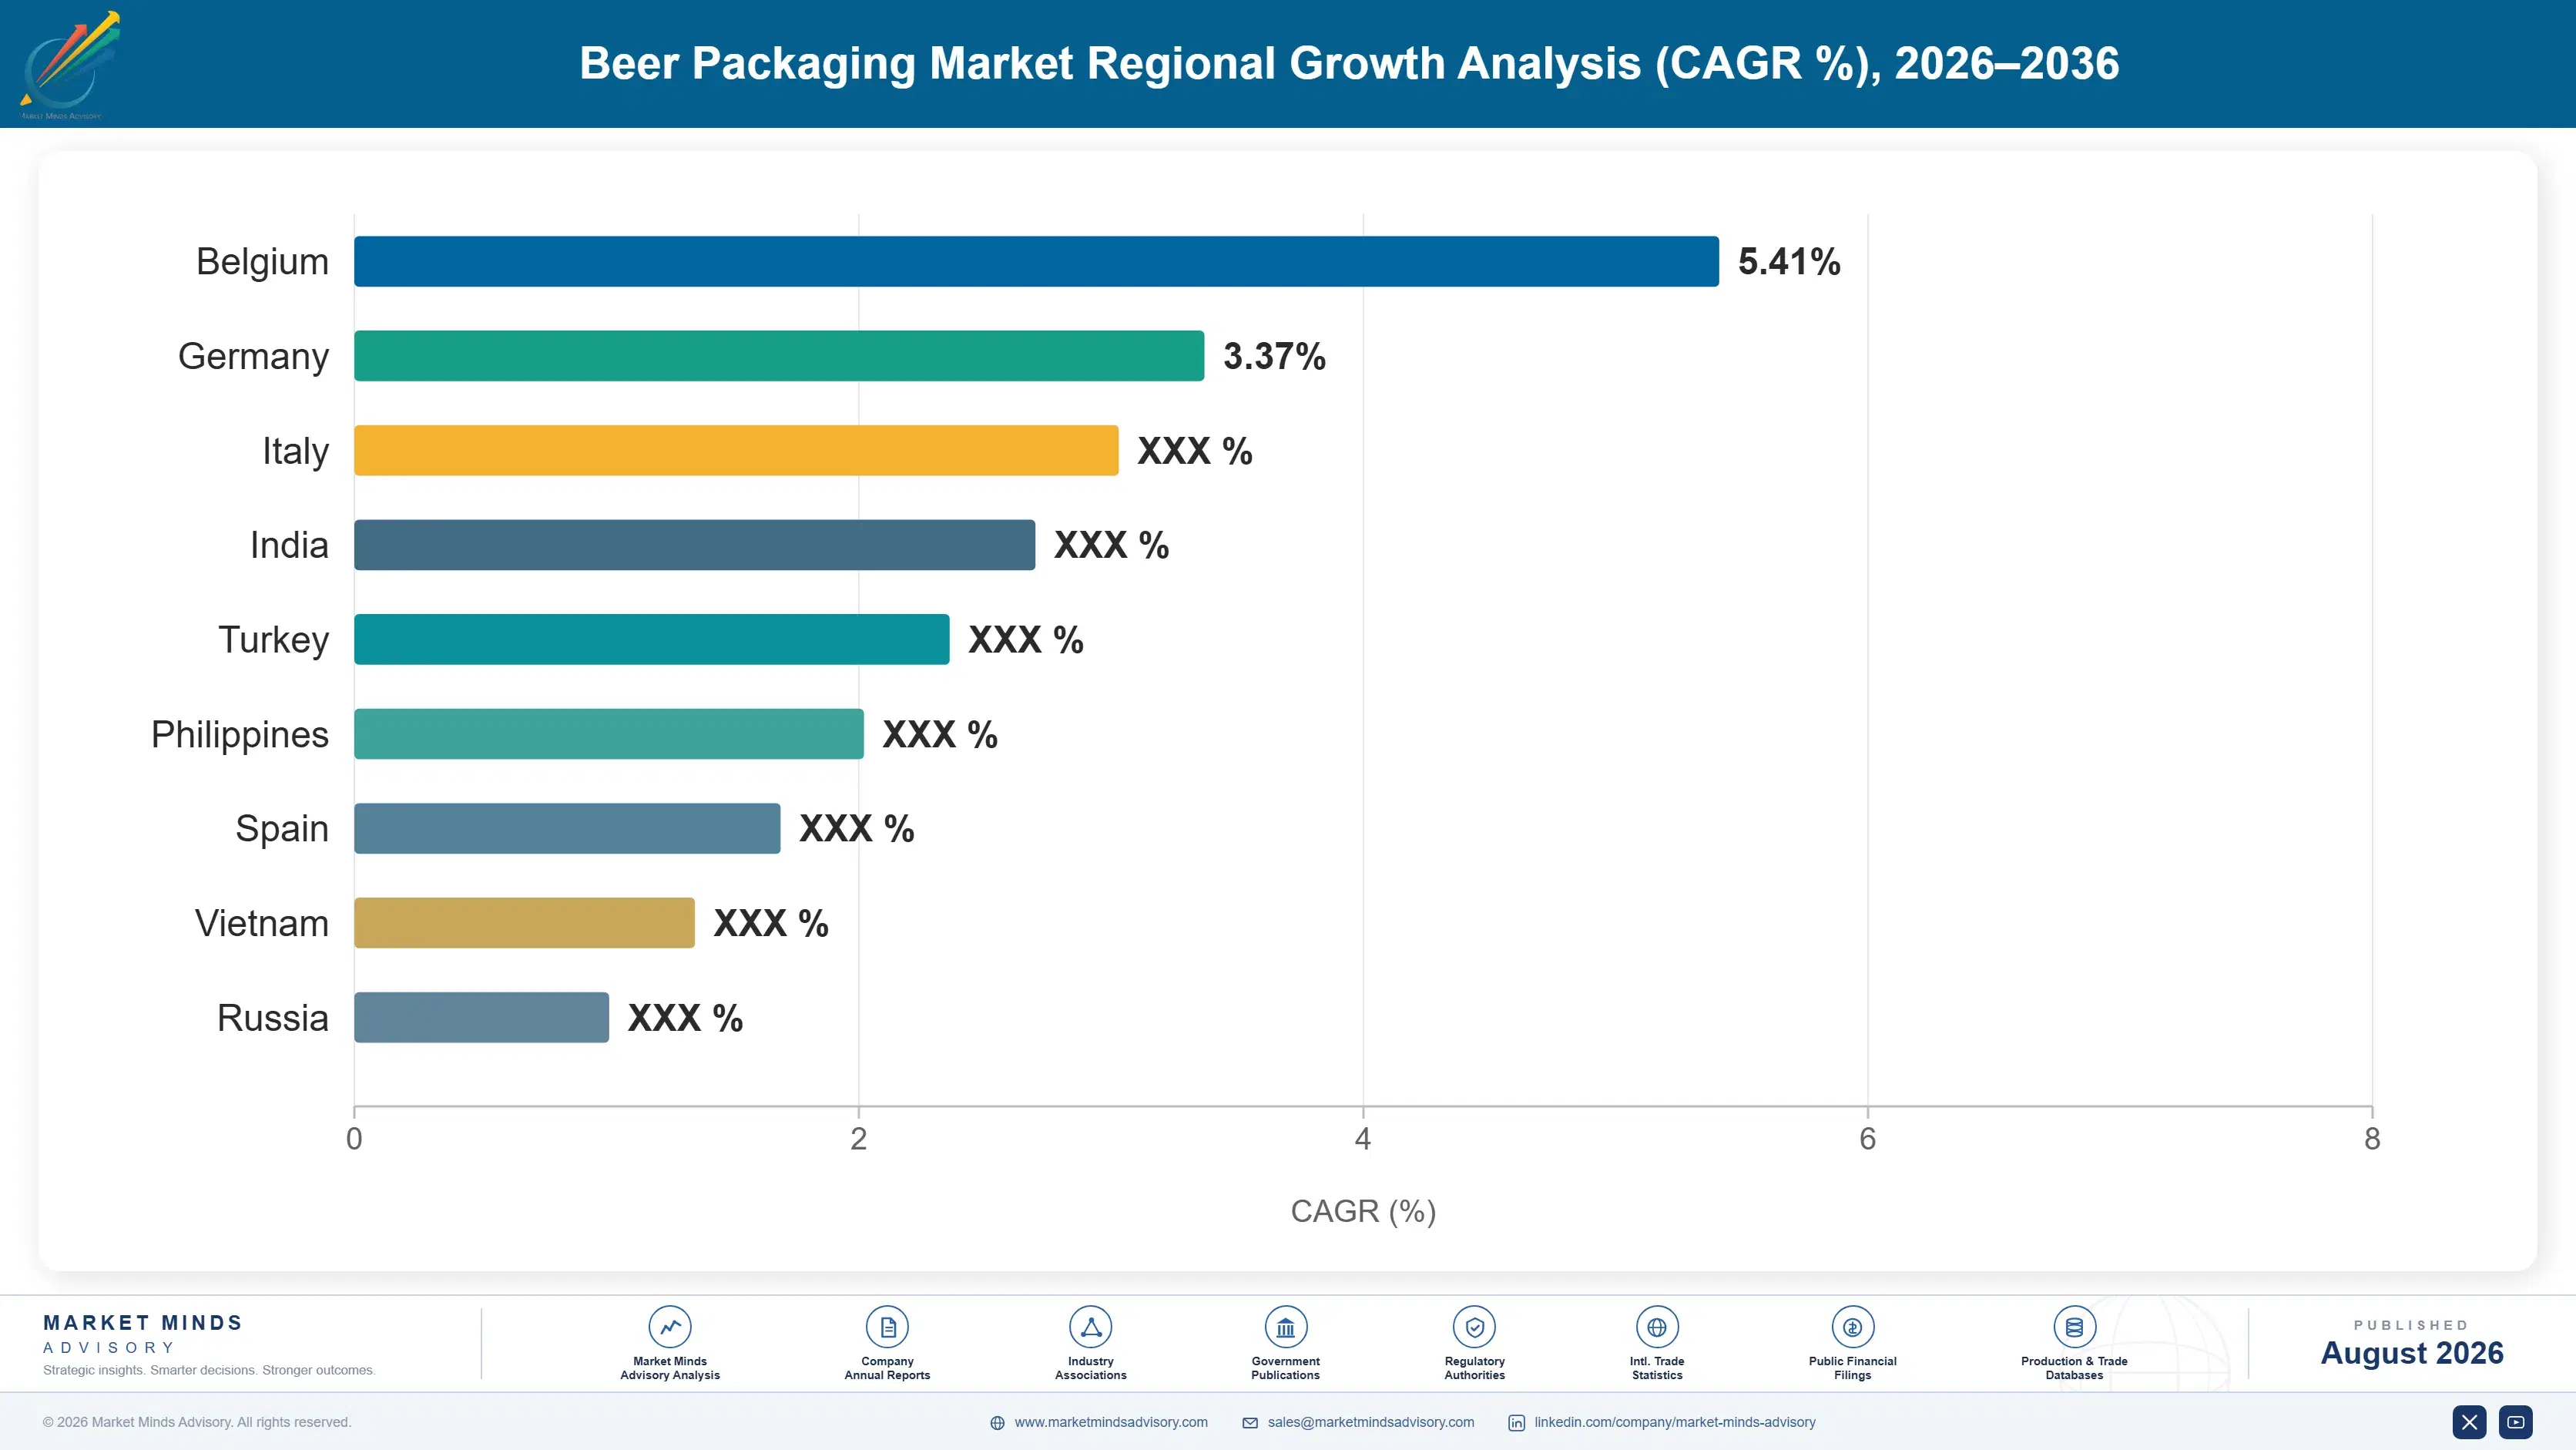
beer-packaging-market-country-cagr-analysis-1787300838953

How Packaging Suppliers Can Capture More Margin

Margin in this market concentrates where aluminum supply security, brewery-proximate manufacturing, and sustainability certification protect a supplier from metal volatility and glass conversion pressure simultaneously across the full brewer relationship. The four moves below shift revenue toward brewers who pay for supply reliability and lighter logistics rather than packaging priced purely off unit cost.

Build The Logistics Case For Glass-Loyal Brewer Conversion

Brewers still committed to glass bottling often underestimate the freight savings aluminum cans deliver across long-distance distribution, since cans weigh roughly a third less than equivalent glass bottles and stack more densely on pallets and in retail coolers. Suppliers quantifying this savings explicitly, typically worth 8% to 12% of total delivered packaging and freight cost, are converting brewers that resisted purely aesthetic sustainability arguments for years. This approach works especially well with export-oriented brewers, where freight cost as a share of landed price runs highest and the can conversion case is hardest to dismiss on economic grounds alone.
Market Impact: Saves 8% to 12% on delivered freight cost

Secure Long-Term Can Sheet Aluminum Supply Agreements

Aluminum price swings exceeding 35% within a two-year window have repeatedly forced can manufacturers to either walk away from fixed-price brewer contracts or absorb losses on agreements signed before delivery. Suppliers locking multi-year can sheet supply agreements with domestic or regional smelters, rather than buying entirely on the spot market, can quote brewer contracts with roughly 6% to 10% tighter pricing margins because the underlying metal cost is no longer a live risk during the contract term. That pricing confidence increasingly wins large brewer framework agreements against competitors still quoting on spot aluminum assumptions.
Market Impact: Tightens brewer contract margins by 6% to 10%

Expand Manufacturing Capacity Near African Brewery Buildout

Heineken, AB InBev, and Diageo are all expanding brewery capacity across Nigeria and broader African markets faster than regional packaging manufacturing has scaled to match, creating a genuine supply gap for suppliers willing to invest ahead of confirmed demand. Establishing local can or bottle manufacturing capacity, rather than exporting finished packaging from established manufacturing bases, cuts delivered cost by roughly 15% to 20% while also shortening lead times that matter to brewers running tight production schedules. Suppliers that positioned regional capacity ahead of major brewery openings are now securing multi-year supply agreements that later entrants importing product cannot match.
Market Impact: Cuts delivered packaging cost by 15% to 20%

Certify Recycled Content To Command Sustainability Premium Pricing

Major retailers and brewers increasingly specify minimum recycled content thresholds in packaging procurement, treating verified recycled aluminum or glass content as a genuine differentiator rather than a marketing afterthought in supplier evaluation criteria. Suppliers with certified recycled content supply chains, verified through independent audit rather than self-reported claims, can command pricing roughly 5% to 9% above uncertified equivalent packaging from competitors unable to document their recycled material sourcing. This premium is becoming standard practice among suppliers serving brewers with public sustainability commitments tied to specific packaging targets and reporting deadlines.
Market Impact: Commands a 5% to 9% recycled content premium

Who Controls the Margin Pool

Concentration is moderate at CR5 48%, assessed on installed can and bottle manufacturing capacity, and the gap between leader and challenger reflects format positioning as much as raw scale. Ball Corporation's can manufacturing lead and O-I Glass's deep brewer relationships in glass-dominant markets neither has fully displaced the other.
Three dimensions define current activity. Can capacity racing continues as suppliers commission new lines to serve craft segment and emerging market conversion faster than glass makers can redeploy furnace capacity. Aluminum supply security is accelerating, as can manufacturers lock long-term sheet supply to insulate margin from spot metal volatility. African manufacturing expansion keeps advancing too, as suppliers establish brewery-proximate capacity ahead of confirmed brewery buildout timelines.

Pressure is building from two directions at once. Regional can manufacturers across Africa and Southeast Asia are expanding capacity to serve fast-growing domestic brewery demand, testing whether global suppliers can match local cost structures. Meanwhile large brewers themselves are increasingly bringing packaging production in-house or through dedicated co-packer arrangements, disintermediating independent suppliers on their largest-volume contracts. Rankings will shift toward suppliers combining aluminum supply security with brewery-proximate manufacturing, not toward whoever holds the most total capacity globally.
beer-packaging-market-company-positioning-matrix-1787300839466

Competitive Moat and Risk Dimensions

BALL CORPORATION

Moat: Can Scale And Sustainability Position

Ball Corporation's global can manufacturing scale, paired with strong recycled content and lighter-shipping-weight positioning, gives it a genuine advantage as brewers and retailers both increasingly favour aluminum over glass options. That positioning compounds as more brewers pursue public sustainability commitments tied to specific packaging targets.
BALL CORPORATION

Risk: Aluminum Price And Customer Concentration

A substantial share of Ball's beverage can revenue concentrates among a handful of large global brewers, exposing it to both aluminum price volatility and any single major customer's capital spending or volume decisions. A material slowdown at one large brewer would compress revenue faster than diversified competitors would feel it.
O-I GLASS INC.

Moat: Deep Glass-Dominant Brewer Relationships

O-I Glass holds long-standing relationships with brewers in markets where returnable bottle systems and cultural glass preference remain genuinely economically dominant, particularly across Western Europe and parts of Latin America specifically. That relationship depth gives it defensible share even as can conversion advances elsewhere globally.
O-I GLASS INC.

Risk: Sustained Share Loss To Cans

Glass bottle share is contracting steadily as brewers convert to cans across nearly every market tracked, leaving O-I Glass managing a declining category even where its individual brewer relationships remain genuinely strong. Continued furnace underutilisation would compress returns faster than can-focused competitors are currently experiencing.

Key Players

Ball Corporation
Crown Holdings Inc.
Ardagh Group S.A.
O-I Glass Inc.
CANPACK S.A.

Others

Vetropack Holding AG
Verallia SA
Stölzle Glass Group
Trivium Packaging
Silgan Holdings Inc.
Micro Matic A/S
Blefa GmbH
Schäfer Container Systems GmbH
Encirc Ltd
BA Glass
Amcor plc
KHS GmbH
Toyo Seikan Group Holdings Inc.
Showa Aluminum Can Corporation
Nampak Ltd

Recent Developments

FEBRUARY 2026

Ball Corporation expands African can capacity

Ball Corporation announced an expansion of its can manufacturing capacity specifically targeted at serving African brewery demand, adding qualified production lines to supply Heineken and AB InBev's expanding regional brewery network ahead of several new facility openings scheduled across multiple countries over the next several years.
Signal: Organic capacity expansion, not an acquisition, signals continued confidence in sustained African brewery buildout continuing steadily.
SEPTEMBER 2025

US states finalize extended producer responsibility rules

Several major US states finalized updated extended producer responsibility regulations covering beverage packaging specifically, clarifying recycled content and collection requirements that had created compliance ambiguity for brewers and packaging suppliers since the original legislation passed in prior years across multiple jurisdictions and product categories nationwide.
Signal: A regulatory clarification, not a corporate transaction, removes ambiguity that had slowed some suppliers' compliance investment.
JUNE 2025

O-I Glass extends European returnable bottle agreement

O-I Glass signed a multi-year supply agreement extension with a major European brewer committed to returnable glass bottle systems, securing contracted volume in one of the few markets where glass retains a genuine cost advantage over aluminum cans given existing deposit return infrastructure already in place.
Signal: A supply agreement extension, not a joint venture, defends O-I's position in glass's strongest remaining stronghold.

Aluminum, Glass Sand, and Cost

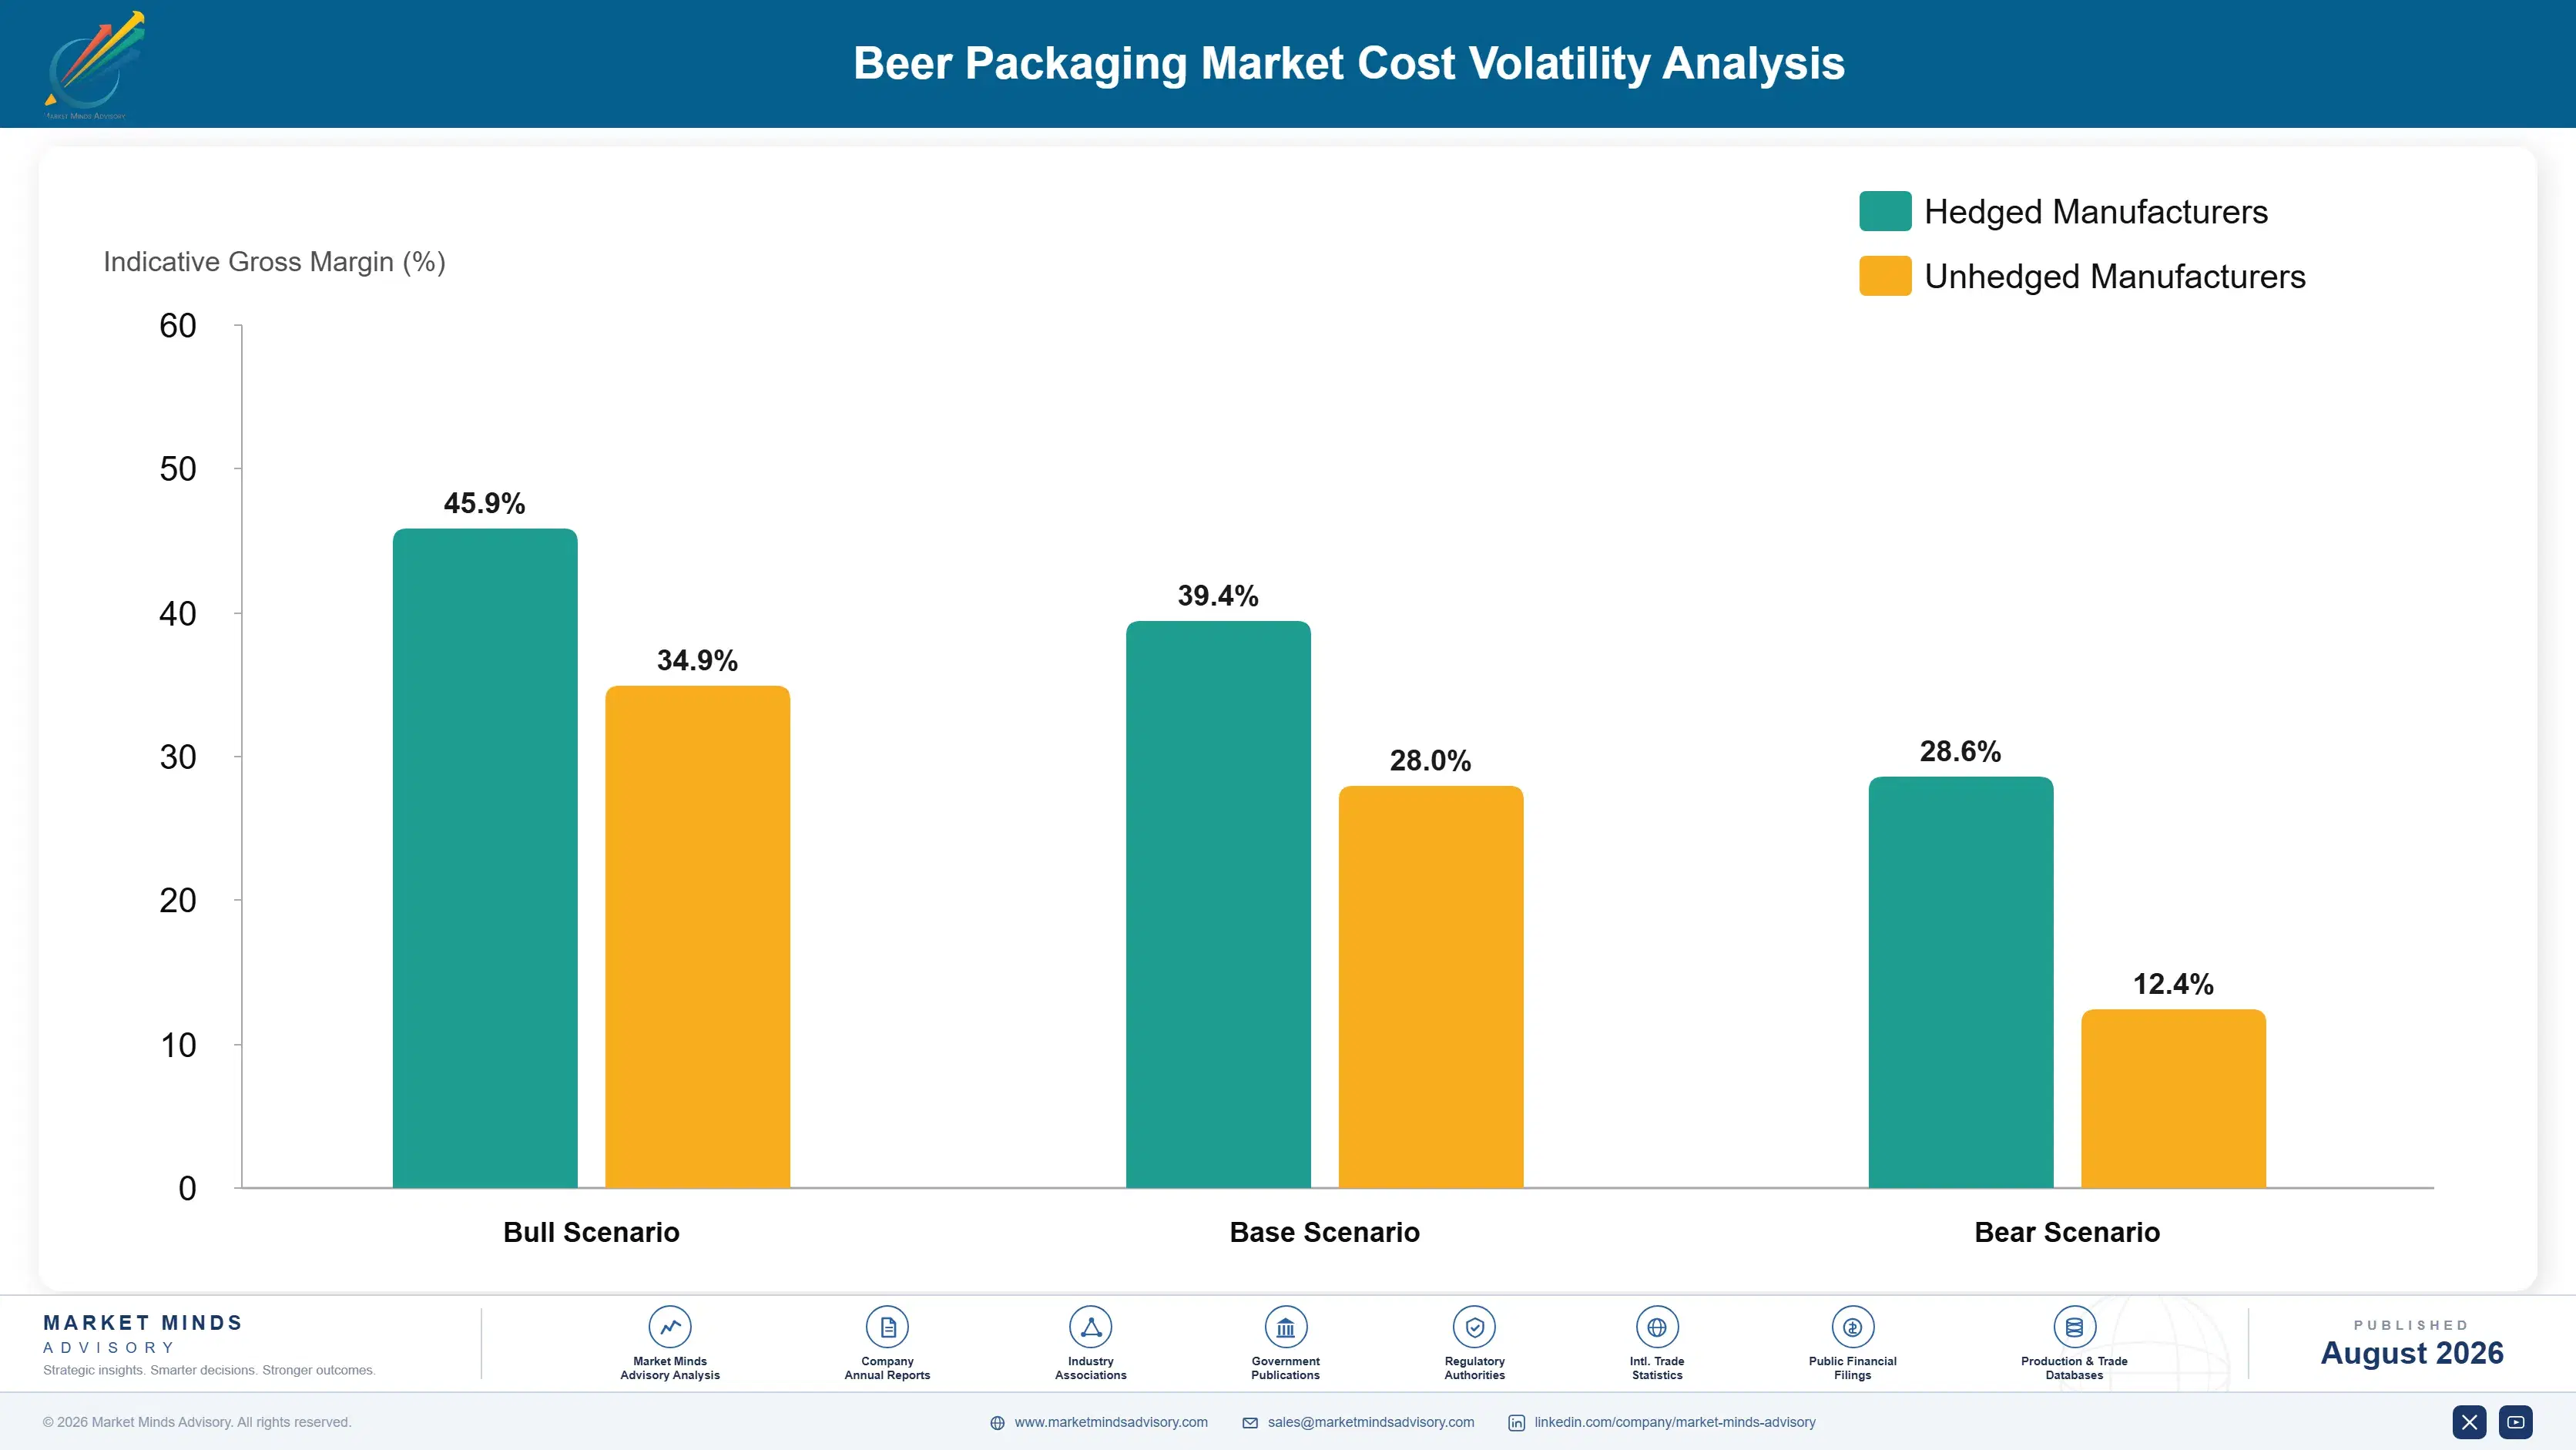
Primary and recycled aluminum together account for 42% to 50% of cash cost of goods sold in can manufacturing, sourced from smelters concentrated in China, the Gulf, and North America. Silica sand and soda ash for glass manufacturing contribute 20% to 26% of glass bottle production cost, with energy for furnace operation making up most of the remainder.
The 2021 to 2022 aluminum price spike remains the sector's defining volatility event. Pandemic-disrupted supply chains and subsequent energy cost inflation pushed aluminum prices up more than 35% within roughly eighteen months, driven partly by smelting curtailments in energy-constrained regions. Ball Corporation and Crown Holdings both disclosed materially higher input costs in subsequent annual reports, a pattern smaller can manufacturers felt more acutely given thinner margins. LME data confirmed the spike traced to smelting curtailment and energy pressure.

Exposure separates suppliers with diversified aluminum sourcing and hedging capability from single-source formulators dependent on spot market purchasing. Ball and Crown, holding broader supplier relationships and hedging programmes, absorb aluminum swings more gradually than smaller regional can makers whose entire cost base moves with spot metal prices. Suppliers without comparable hedging capability face genuine margin compression during tight metal cycles.
beer-packaging-market-cost-volatility-analysis-1787300839662

Hedge Aluminum Exposure Through Futures Contracts

Locking a share of expected aluminum tonnage through futures contracts, matched to the brewer contract delivery window, removes the exposure that turned fixed-price 2021 agreements into 2022 losses for several can manufacturers across the industry. It costs a modest premium but converts unpredictable metal cost into a budgetable line finance teams can actually plan around.

Diversify Smelter Sourcing Across Multiple Regions

Qualifying aluminum from multiple regional smelters, rather than concentrating purchases with any single energy-constrained region, reduces exposure to any one area's curtailment or feedstock shock during future tight cycles across the industry and calendar year. Suppliers with diversified smelter relationships also negotiate more favourable terms during periods of genuine regional supply tightness and disruption.

Invest In Cullet Recycling To Offset Glass Sand Cost

Increasing recycled glass cullet content in bottle manufacturing reduces virgin silica sand and soda ash requirements while also lowering furnace energy consumption, since cullet melts at meaningfully lower temperatures than raw batch materials require to process reliably. Glass makers with higher cullet ratios report measurably lower per-unit energy cost than competitors relying more heavily on virgin raw materials.

Portfolio Architecture for Margin Defence

The portfolio splits into three margin tiers separated by brand positioning, sustainability certification, and manufacturing complexity rather than volume alone. Standard mass-market cans and bottles compete almost entirely on unit cost and delivery reliability, while premium craft formats and certified high-recycled-content packaging earn considerably more because fewer suppliers can differentiate on brand appeal or verified sustainability credentials at meaningful scale.
The tension running through every supplier's strategy is volume against premium. Standard packaging funds manufacturing overhead and keeps production lines running, but it earns thin single-digit to low-double-digit margins that barely survive a bad aluminum quarter. Premium craft and certified sustainable formats carry the earnings upside, yet they demand brand relationship management, certification investment, and smaller production runs that larger commodity-focused manufacturers often resist prioritising over higher-volume standard orders.

High-value pools concentrate wherever brand differentiation or certification matters most: craft can formats, certified recycled-content packaging for brewers with public sustainability targets, and brewery-proximate African manufacturing all sit here. Standard mass-market cans and bottles, sold into distributed retail channels, remain the volume anchor that keeps manufacturing lines utilised but contribute comparatively little to blended profitability across a typical supplier's full customer mix.

Volume / Commodity-Adjacent Tier

Standard mass-market aluminum cans and glass bottles sold on unit cost and delivery reliability, competing directly against regional manufacturers on landed cost with minimal brand differentiation across most categories and markets.
Gross Margin: 8-16%

Premium / Certified Tier

Premium craft can and bottle formats carrying brand-specific tooling and shelf presentation that mass-market suppliers without comparable design capability cannot credibly offer growing independent brewery customers seeking real differentiation today.
Gross Margin: 18-28%

Sustainability / Regulatory / Next-Generation Tier

Certified high-recycled-content packaging for brewers with public sustainability targets, plus brewery-proximate African manufacturing capacity, commanding a genuine premium for verified credentials and logistical proximity to fast-growing regional demand centres today.
Gross Margin: 22-34%
beer-packaging-market-portfolio-architecture-1787300840157

High-value Sub-segments and Strategic Watch-out

Aluminum Cans

Aluminum cans are the high-value, high-growth pool, expanding at 6.8% as craft conversion and sustainability preference both pull volume from glass. The wide margin range reflects brand positioning: craft-focused suppliers capture the top end, while commodity can producers earn considerably less on the same underlying format.
Gross Margin: 16-28%

PET Bottles

PET bottles form the high-value, moderate-growth pool at 5.9%, driven by emerging market lightweighting where breakage risk and distribution cost matter more than mature-market premium positioning does. The wide range reflects regional manufacturing maturity, since established producers earn more than newer entrants still scaling capacity.
Gross Margin: 10-20%

Glass Bottles

Glass bottles are the volume core, the largest existing segment by far and the one legacy manufacturers depend on to keep furnaces running through demand cycles. Margins stay thin because pricing tracks sand, soda ash, and energy cost closely, leaving limited room for differentiation across competing regional supply.
Gross Margin: 8-15%

Stainless Steel Kegs

Kegs are the strategic watch-out, exposed to on-premise channel volatility that pandemic-era closures exposed sharply and at-home consumption shifts continue to test in several mature markets specifically. The wide range reflects that premium draft-focused suppliers still earn well while standard keg rental economics increasingly compress.
Gross Margin: 10-24%

How Packaging Demand Actually Repeats

Demand here runs on multi-year supply agreements rather than one-off purchases, since brewers need continuous can and bottle supply matched to production line speed rather than periodic batch orders. Large brewer contracts typically run three to five years, giving suppliers holding these agreements a revenue base far more predictable than construction-style project-driven demand elsewhere.
Adoption depth varies sharply by vertical. Large national brewers, once a supplier's packaging line clears qualification, rarely switch mid-contract, since requalifying a new supplier risks production downtime that costs far more than any price gap could offset. Craft brewers sit closer to the middle, loyal within a product line but genuinely open-bid at renewal given their smaller volume leverage. Export-oriented brewers sit at the far end, prioritising suppliers who can guarantee consistent quality across varying regulatory markets.

Buyer profiles have shifted generationally too. Procurement teams increasingly weigh recycled content and supply chain sustainability as heavily as unit price, a shift that has elevated sustainability officers into packaging sourcing decisions that used to sit purely with production managers. Younger brand managers also treat verified recycled content as a genuine marketing asset, a change starting to influence supplier selection beyond regulatory minimums.
beer-packaging-market-end-use-penetration-index-1787300840644

Where Packaging Suppliers Should Bet Next

These are among the four positions where our research anticipates prominent divergence between winners and laggards over the coming forecast period. Each is grounded in the demand model, the regulatory perimeter, and the announced capacity pipeline.
01 / CAN CONVERSION STRATEGY

The economic case for glass conversion is stronger than brewers currently realise

Suppliers quantifying freight and logistics savings explicitly, rather than relying purely on sustainability messaging, are converting brewers that resisted aesthetic arguments for years despite the clear cost advantage aluminum offers over glass. Export-oriented brewers represent the largest remaining conversion opportunity, since freight cost as a share of landed price runs highest precisely where the can conversion case is hardest for a rational buyer to dismiss. Suppliers still pitching sustainability alone, without the accompanying freight math, are leaving an easier sale on the table entirely.
02 / ALUMINUM HEDGING DISCIPLINE

Long-term metal supply agreements are becoming a genuine competitive differentiator

The 2021 to 2022 aluminum spike taught the industry a lesson some manufacturers still have not fully internalised, given how many fixed-price brewer contracts were signed without any hedge against underlying metal cost exposure. Producers locking multi-year smelter agreements or futures positions ahead of major brewer tenders now price contracts with materially tighter, more defensible margins than competitors still quoting purely on spot aluminum assumptions. This discipline increasingly separates suppliers who win large framework agreements from those still exposed to the next metal price shock.
03 / AFRICAN CAPACITY POSITIONING

Brewery-proximate manufacturing captures demand before regional competitors can respond

Heineken, AB InBev, and Diageo are all expanding brewery capacity across Nigeria and broader African markets faster than regional packaging manufacturing has scaled to match, creating a genuine supply gap for suppliers willing to invest ahead of confirmed demand. Suppliers establishing local capacity now are securing multi-year agreements that later entrants importing finished packaging cannot match on cost or lead time once brewery buildout accelerates further. Waiting for demand to fully materialise before investing means arriving after the best contracts are already locked.
04 / RECYCLED CONTENT CERTIFICATION

Verified sustainability credentials now command real pricing power with major brewers

Major retailers and brewers increasingly specify minimum recycled content thresholds in packaging procurement, treating independently verified content as a genuine differentiator rather than a marketing afterthought that self-reported claims once satisfied entirely. Suppliers with certified recycled content supply chains are capturing premium pricing that uncertified competitors, unable to document their sourcing credibly, simply cannot match regardless of underlying manufacturing cost or scale. This premium will keep widening as more brewers formalise sustainability commitments into binding procurement policy rather than voluntary aspiration.

Engagement Snapshot From the Field

A live engagement with an industry participant carrying material or product regulatory and market exposure ahead of a defining policy shift, showing how our research translates into a defensible multi-year portfolio strategy.
MARKET MINDS ADVISORY · CLIENT ENGAGEMENT SUMMARY
Beer Packaging Producer Strategic Portfolio Review and Transition Roadmap 2026·Investment Scenario on Beer Packaging Exposure Evaluation 2025-26
CLIENT PROFILE
A mid-sized craft brewer exporting to six countries approached MMA while evaluating whether to complete its remaining glass-to-can conversion and consolidate to a single packaging supplier ahead of a planned export volume expansion. The client reported annual packaging spend near USD 18 million, split roughly evenly between cans and glass bottles currently (client-reported, unverified by MMA).
STRATEGIC CHALLENGE
Management believed can conversion made sense economically but could not quantify the freight savings precisely enough to justify the capital cost of retiring remaining glass bottling capacity, while also worrying that some export markets still culturally preferred glass for premium positioning specifically and might penalise the brand for switching entirely.
MMA APPROACH
MMA modelled delivered cost across all six export markets under full can conversion versus the client's current mixed-format approach, incorporating freight, packaging material, and retail shelf positioning data by market specifically and in detail. We also surveyed comparable craft brewers' export experience with can-only positioning in similar premium retail channels.
KEY FINDINGS
  1. Full can conversion would cut blended freight cost by an estimated 9%, driven mainly by the client's two furthest export markets where shipping distance mattered most.
  2. Two of six export markets showed no measurable retail sales impact from can-only positioning, while one premium market retained a modest but real glass preference.
  3. Retiring remaining glass bottling capacity would require an estimated USD 2.4 million in equipment costs, recoverable within roughly twenty months at modelled freight savings (client-reported, unverified by MMA).
  4. A hybrid approach, converting five of six markets while retaining limited glass capacity for the one glass-preferring market, balanced savings against brand risk most effectively.
CLIENT PROFILE
A mid-sized craft brewer exporting to six countries approached MMA while evaluating whether to complete its remaining glass-to-can conversion and consolidate to a single packaging supplier ahead of a planned export volume expansion. The client reported annual packaging spend near USD 18 million, split roughly evenly between cans and glass bottles currently (client-reported, unverified by MMA).
STRATEGIC CHALLENGE
Management believed can conversion made sense economically but could not quantify the freight savings precisely enough to justify the capital cost of retiring remaining glass bottling capacity, while also worrying that some export markets still culturally preferred glass for premium positioning specifically and might penalise the brand for switching entirely.
MMA APPROACH
MMA modelled delivered cost across all six export markets under full can conversion versus the client's current mixed-format approach, incorporating freight, packaging material, and retail shelf positioning data by market specifically and in detail. We also surveyed comparable craft brewers' export experience with can-only positioning in similar premium retail channels.
KEY FINDINGS
  1. Full can conversion would cut blended freight cost by an estimated 9%, driven mainly by the client's two furthest export markets where shipping distance mattered most.
  2. Two of six export markets showed no measurable retail sales impact from can-only positioning, while one premium market retained a modest but real glass preference.
  3. Retiring remaining glass bottling capacity would require an estimated USD 2.4 million in equipment costs, recoverable within roughly twenty months at modelled freight savings (client-reported, unverified by MMA).
  4. A hybrid approach, converting five of six markets while retaining limited glass capacity for the one glass-preferring market, balanced savings against brand risk most effectively.
RECOMMENDED STRATEGY
Phase 1: Phase 1 (0 to 6 months): Convert five of six export markets fully to cans, retaining glass only for the premium-preference market. Phase 2: Phase 2 (6 to 14 months): Retire excess glass bottling capacity and reinvest freed capital into expanded can production lines. Phase 3: Phase 3 (14 to 30 months): Reassess the remaining glass market annually as consumer preference data accumulates over time and volume.
OUTCOME
The client proceeded with the hybrid conversion, and freight savings tracked within 1 percentage point of MMA's modelled estimate through the first two full quarters of implementation. The board approved the glass capacity retirement ahead of the original twenty-month payback estimate (client-reported, unverified by MMA).

Frequently Asked Questions

Foundational context covering the market sizes, CAGR, scope, country, region and competition that inform every finding below. This section is provided to cover basics and most often pre-purchase conversations, answered from the MMA Primary Research Dataset.

What is the current size of the Beer Packaging Market?

The global beer packaging market was valued at USD 64.0 billion in 2025. Aluminum cans and PET bottles account for the fastest-growing share of that total.

How large will the Beer Packaging Market be by 2036?

The market is projected to reach USD 100.6 billion by 2036, up from USD 66.7 billion in 2026. That represents an incremental opportunity of roughly USD 33.9 billion across the decade.

What is the CAGR for the Beer Packaging Market 2026 to 2036?

The base case CAGR is 4.2% annually. MMA models a bull case of 5.5% if can conversion accelerates further, and a bear case of 2.9% if aluminum volatility discourages capacity investment.

Which segment is growing fastest?

Aluminum cans grow fastest at 6.8% CAGR, about 1.62 times the overall market rate, as craft conversion and sustainability preference both pull volume away from traditional glass bottling.

Who are the major companies in the Beer Packaging Market?

Ball Corporation, Crown Holdings, Ardagh Group, O-I Glass, and CANPACK lead on installed manufacturing capacity. Ball Corporation holds the largest global can manufacturing scale specifically.

Which country is growing fastest?

Nigeria posts the fastest national CAGR at 8.5%, driven by young-population-led beer consumption growth and brewery capacity expansion from Heineken, AB InBev, and Diageo across the country.

Report Segmentation Architecture

The full report scope spans multiple orthogonal segmentation dimensions, with cross-tabulated demand data provided for each dimension pair. Coverage extends further to regional breakdowns, trend trajectories, and the competitive detail needed to support segment-level decision-making.

By Container Material

  • Aluminum Cans
  • PET Bottles
  • Glass Bottles
  • Stainless Steel Kegs
  • Bag-in-Box
  • Crowlers

By End-Use Channel

  • Off-Premise Retail
  • On-Premise Hospitality
  • Export and Distribution
  • Craft and Independent Brewing
  • Direct-to-Consumer

By Commercial Dimension

  • Direct Brewer Supply Contracts
  • Co-Packer and Contract Filling
  • Distributor and Wholesale Channels
  • Brewery-Proximate Manufacturing Agreements

By Region

  • North America
  • Western Europe
  • East Asia
  • South Asia and Pacific
  • Latin America
  • Middle East and Africa
  • Eastern Europe

Scope, Methodology, and Coverage

Every figure in this report is reproducible from documented input assumptions. The scope below maps the historical period, the forecast horizon, the segmentation dimensions, and the countries covered, alongside the underlying primary and qualitative methodology.
Historical Period
2020 to 2025
Forecast Period
2026 to 2036
Base Year
2025 (USD billions; MMA Primary Research Dataset, August 2026)
Market Definition
The market covers primary containers used to package beer for retail and hospitality sale, including aluminum cans, glass bottles, PET bottles, stainless steel kegs, and bag-in-box formats, sold to brewers and co-packers. Secondary packaging, closures, and labels are excluded from the defined scope.
Quantitative Units
USD billions (current prices); millions of containers shipped where applicable
Segmentation Dimensions
By Container Material; By End-Use Channel; By Commercial Dimension; By Region
Regions Covered
North America, Western Europe, East Asia, South Asia and Pacific, Latin America, Middle East and Africa, Eastern Europe
Countries Covered
USA, China, Germany, France, UK, Japan, South Korea, India, Australia, Canada, Brazil, Mexico, Indonesia, Vietnam, Thailand, Malaysia, UAE, Saudi Arabia, South Africa, Nigeria, Turkey, Poland, Netherlands, Italy, Spain, Sweden, Switzerland, Argentina, Colombia, Singapore, and additional markets relevant to this sector
Key Companies Profiled
Ball Corporation, Crown Holdings Inc., Ardagh Group S.A., O-I Glass Inc., CANPACK S.A., Vetropack Holding AG, Verallia SA, Stölzle Glass Group, Trivium Packaging, Silgan Holdings Inc., Micro Matic A/S, Blefa GmbH, Schäfer Container Systems GmbH, Encirc Ltd, BA Glass, Amcor plc, KHS GmbH, Toyo Seikan Group Holdings Inc., Showa Aluminum Can Corporation, Nampak Ltd
Quantitative Methodology
Primary survey, n=3,800 respondents, Q4 2025, six countries; demand-side model with trade association cross-validation
Qualitative Methodology
47 expert interviews, Q4 2025; applied to validate demand model assumptions, identify emerging dynamics, and assess competitive positioning
Report Format
PDF and XLSX data workbook (Word format preview document)
Publisher
Market Minds Advisory
Report Code
MMA-2026-PAC-107
Published
August 2026
Contact
sales@marketmindsadvisory.com | www.marketmindsadvisory.com

Purchase the full Beer Packaging Market Report (2026 to 2036).

The full MMA Beer Packaging report sizes the market across six container materials, five end-use channels, four commercial dimensions, and seven regions through 2036. It profiles 20 participants on a consistent installed manufacturing capacity basis, scoring the top two on can conversion positioning, aluminum supply security, and brewery-proximate capacity. Scenario models quantify how can conversion pace, aluminum price cycles, and African brewery expansion move both demand and realised pricing. The report also includes delivered-cost modelling by material, a feedstock exposure screen, brewery capacity investment tracking, and a recycled content certification prioritisation framework built for strategy, procurement, and investment teams.
Six-material segmentation with unit and value forecasts
Seven-region demand map with country-level detail
Twenty-company competitive profiles on manufacturing capacity
Aluminum and glass feedstock cost sensitivity modelling
Can conversion and recycled content law tracking
African brewery capacity investment readiness playbook

Built For The People Who Decide

From boardroom strategy to bench-side execution, this report is read cover-to-cover by leaders shaping the next decade of their industry, turning demand scenarios, market dynamics and valuation benchmarks into decisions.
CXOs/ Presidents/ VPs/ Managers
M&A and Corporate Development
Strategy Teams and R&D Heads
Procurement and Product Directors
Regulatory and Compliance Leaders
Investor Relations and Equity Analysts