Market Minds Advisory
Bacterial Diagnostics in Aquaculture Market

Bacterial Diagnostics in Aquaculture Market: Latency, Pond-Side Testing, and the Residue Compliance Driver

By the time a laboratory result returns four days later the pond has already been treated blind or lost, which is why diagnosis in aquaculture is moving out of the laboratory entirely.

Lead Analyst

Alice Ballenger

Published

September 2026

Make Smarter Decisions with Customized Research Insights

Request a free sample report and evaluate market opportunities, growth trends, and competitive dynamics relevant to your business needs.

2025 MARKET VALUE$0.2BMarket Size 2025
2036 FORECAST VALUE$0.8BBase Case , 2026 to 2036
CAGR 2026 TO 203611.4 %Bull 12.6% / Bear 10.2%
INCREMENTAL OPPORTUNITY$0.5BNet 10- year value creation
EXPANSION MULTIPLE2.93x2036 value over 2026 base
Strategic Levers
M&A Pipeline
Regional Outlook
Country Rankings
Competitive Intelligence
Segmental Deep-dive
Call-Us : 91 93563 13602

Executive Snapshot and Market Trajectory

A bacterial outbreak can empty a shrimp pond within days, and a centralised laboratory result takes four. That mismatch means most treatment decisions are made blind, and it explains why the growth in this market sits entirely outside the laboratory. Nothing in this category matters more than that gap.
Isothermal amplification compounds at 17.1%, a full 1.50x the market rate, because a single-temperature reaction runs in a heat block at the pond edge without a thermocycler and frequently without any cold chain at all. East Asia holds the largest share at 34%, well above the standard band, since China alone accounts for more farmed aquatic production than the rest of the world combined.
Concentration is low at 41%, because each farmed species carries different pathogens in different geographies and no universal panel exists. Only 23% of farms test routinely, which is unusual for any diagnostic market. Antibiotic residue limits in export markets have turned identification into a compliance requirement rather than a husbandry choice. Adoption therefore tracks export exposure far more closely than disease burden. Producers facing identical pathogens in domestic markets frequently never test at all.
Market Definition
This market covers diagnostic products and services used to detect and identify bacterial pathogens in farmed aquatic animals, spanning bacterial culture and biochemical identification, real-time PCR and quantitative molecular assays, isothermal amplification assays, immunoassay and lateral flow tests, and sequencing or metagenomic panels, measured at supplier revenue including reagents, instruments and laboratory service fees. Viral, parasitic and fungal diagnostics, water quality and environmental monitoring, vaccines and therapeutics, genetics and breeding services, and farm management software are excluded.
Base Year Value
$0.2B in 2025 (MMA Primary Research Dataset, August 2026)
Forecast Period
2026 to 2036, eleven discrete annual values
CAGR
11.4% base case. Bull 12.6%. Bear 10.2%.
Fastest Growth Segment
Isothermal Amplification Assays: 17.1% CAGR
Fastest Growth Country
Ecuador: 18.4% CAGR
Fastest Growth Region
South Asia and Pacific: 13.4% CAGR
Largest Region
East Asia: 34% of 2025 global value
Market Leaders
Thermo Fisher Scientific, PatoGen, IDEXX Laboratories, Zoetis, and Genics. Source: MMA Primary Research Dataset, July 2026.
Primary Survey
n=3,800 procurement and R&D decision-makers, Q4 2025, six countries
Methodology
Demand-side build-up, cross-validated against public data, 47 expert interviews

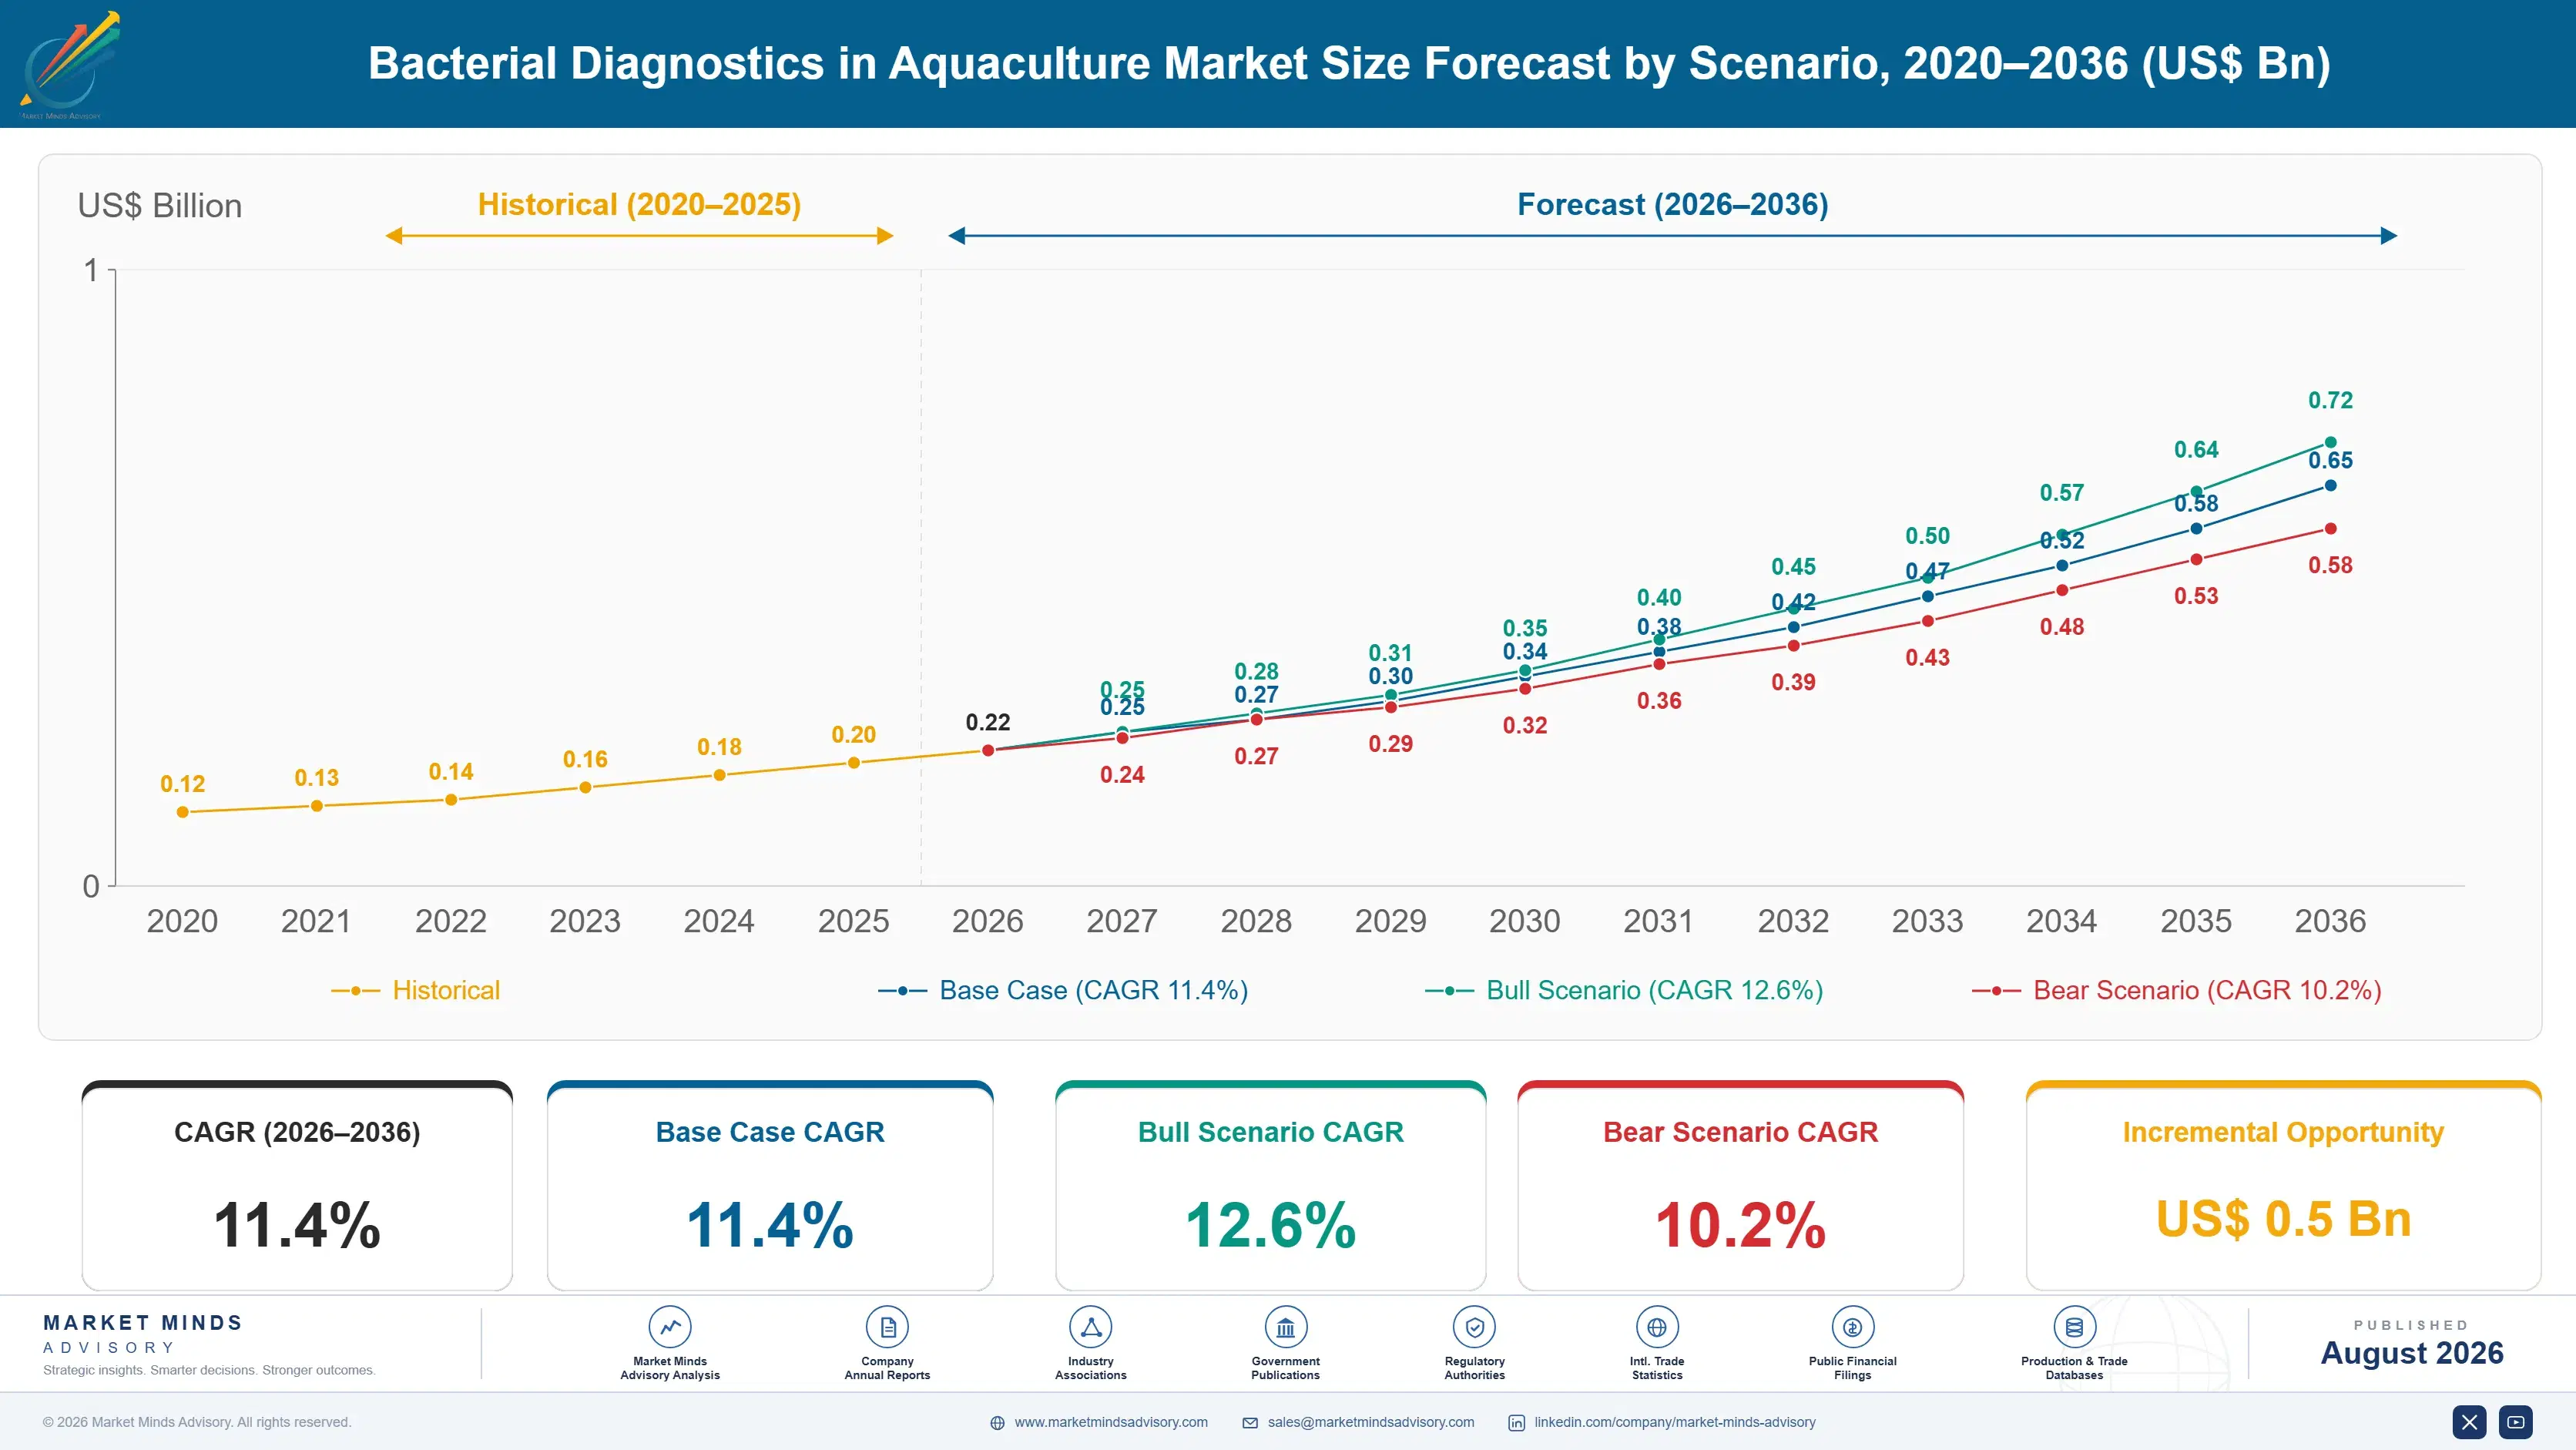
Bacterial Diagnostics in Aquaculture Market Forecast Scenarios

bacterial-diagnostics-in-aquaculture-market-size-forecast-scenario-1787304840635
Growth ran near 10.2% from 2020 to 2025 as two forces pushed in the same direction. Bacterial losses in shrimp farming intensified, with acute hepatopancreatic necrosis spreading across producing regions faster than management practice adapted. At the same time importing markets tightened antibiotic residue enforcement, which turned pathogen identification from an optional husbandry step into something export buyers began auditing directly.
Base case growth of 11.4% rests on three mechanisms. Field-deployable isothermal assays remove the laboratory from the decision loop, which converts diagnosis from a retrospective record into an operational tool. Multiplex panels screening a single sample against many pathogens improve the economics per test enough to reach farms that never tested. And export residue requirements keep tightening, making identification a condition of market access rather than a cost. None of the three requires the others to arrive first.
The bull case at 12.6% assumes multiplex pond-side testing reaches price parity with a single laboratory assay, which would move routine testing well beyond the current 23% of farms. The bear case at 10.2% is smallholder economics: test cost per pond stays high against crop value across much of Asia, farms keep treating empirically, and adoption remains concentrated among large exporters.

Aquaculture Bacteriology: Latency, Residues and Adoption

Everything here follows from one arithmetic problem. A vibriosis outbreak can take a shrimp pond from healthy to catastrophic in seventy two hours, and a sample sent to a central laboratory returns a result in four days. The farmer makes the treatment decision before the diagnosis arrives, so the test confirms what happened rather than guiding what to do. Diagnostics that cannot beat the disease clock have limited value.
TOP FIVE CONCENTRATION41%Fragmented across species, pathogens and producing regions without universal panels
AVERAGE TEST COSTUSD 18Blended cost per sample across laboratory and field assay formats
RESULT TURNAROUND TIME4 daysTypical interval from sampling to result through centralised laboratory testing
ROUTINE FARM TESTING RATE23%Producers testing on schedule rather than only during outbreaks
BACTERIAL DISEASE MORTALITY11%Average stock loss attributed to bacterial disease across species
COLD CHAIN DEPENDENT ASSAYS68%Share of available tests requiring refrigerated reagent transport and storage
That is why the technology moving fastest is the one that leaves the laboratory. Isothermal amplification runs at a single temperature in a simple heat block, needs no thermocycler, and in several formats requires no refrigerated reagent transport at all. Roughly 68% of available tests still depend on cold chain, which in tropical producing regions is a genuine constraint. Removing it changes who can test and where.
The commercial driver, though, is not disease at all. It is residues. Importing markets audit antibiotic residues in farmed shrimp and fish, and a rejected consignment costs more than any pond. A producer unable to identify the pathogen either treats broadly and risks detection, or withholds treatment and loses stock. Identification resolves that, which is why export-facing producers test and others largely do not.
"Farmers are not buying certainty about what killed their shrimp. They are buying permission to sell the survivors into Europe. Once you see the residue audit as the customer rather than the fish, the adoption pattern in this market stops looking irrational."
Principal Analyst, Aquaculture Health and Animal Diagnostics Practice · MMA Agri

Market Trends

Isothermal chemistry moves testing from laboratory to pond edge

Loop-mediated and recombinase polymerase amplification run at a single constant temperature, which removes the thermocycler entirely and allows detection in a simple heat block on a boat or beside a pond. Several formats use lyophilised reagents that need no refrigeration, against 68% of available tests that still do. The segment compounds at 17.1% because it converts diagnosis from a four day laboratory service into a same-day operational decision, which is the only form of it that changes what a farmer actually does. Sensitivity is adequate for the pathogen loads that matter clinically, and producers accept that trade readily.
Market Impact: Ecuador compounding at 18.4% annual
Multiplex panels change the economics of routine screening

Screening one sample against a dozen bacterial and viral targets simultaneously costs far less than running each assay separately, and it matches how disease actually presents, since co-infection is common and single-target testing frequently misses the organism doing the damage. That shift makes scheduled screening affordable where single assays never were. Only 23% of producers currently test on a routine basis, and panel economics rather than any change in disease awareness is what will move that number. Co-infection is common enough that single-target testing frequently misses the organism causing the damage, so panels improve accuracy as well as unit economics.
Market Impact: Mortality reaching 11% annually

Market Opportunities and Growth Drivers

Export residue enforcement makes identification a market access condition

Importing markets in the European Union, Japan and the United States test farmed shrimp and fish consignments for antibiotic residues, and rejection costs a producer the shipment, the buyer relationship and frequently the certification behind both. A farm that cannot identify the pathogen treats broadly and risks detection. Ecuador compounds at 18.4% substantially on this pressure, as the largest shrimp exporter facing the most scrutiny. Buyers increasingly audit testing records directly rather than relying on residue sampling alone. Certification schemes have added testing records to their audit criteria, which converts a commercial preference into a documented requirement.
Market Impact: Turnaround lagging by 4 days

Bacterial disease losses justify testing on pond value alone

Bacterial disease removes roughly 11% of stock across major farmed species in an average year, and considerably more in outbreak conditions, against a pond whose crop value can run to substantial sums for even a modest operation. Acute hepatopancreatic necrosis in shrimp and piscirickettsiosis in salmon are both capable of taking most of a cycle. The arithmetic favours testing comfortably once assay cost falls below a small fraction of expected loss, which it now has for larger producers. Large integrated producers reached that threshold years ago while smallholders have not, which explains the adoption gap.
Market Impact: Testing reaching only 23% of farms

Market Restraints and Challenges

Laboratory turnaround arrives after the treatment decision

Centralised testing returns a result in roughly four days while a bacterial outbreak can empty a pond in three, so the farmer treats empirically and receives confirmation afterwards. The root cause is sample logistics rather than assay speed, since producing regions are rural and laboratories are not. Commercial impact is a product that documents rather than directs, which limits what producers will pay. Participants are pursuing field-deployable isothermal formats, mobile laboratory services and regional laboratory networks closer to farms. Sample logistics remain the harder half of the problem to solve.
Market Impact: Compounding at 17.1% each year

Smallholder economics keep most farms outside routine testing

Only 23% of producers test on a scheduled basis, and across much of Asian aquaculture a single test at roughly USD 18 represents a meaningful proportion of margin on a small pond. The root cause is fragmented production, with millions of small operators rather than a consolidated industry. Commercial impact is an addressable market far smaller than production statistics imply. Participants are pursuing pooled sampling, cooperative testing arrangements and processor-funded programmes that shift cost up the chain. Production statistics therefore overstate the addressable market considerably. Cooperative arrangements are the only realistic route into that population.
Market Impact: Routine testing reaching 23% today
3 additional market trends, 4 additional growth drivers, and 2 additional restraints and challenges are covered in the full report. Contact sales@marketmindsadvisory.com to access the complete intelligence.

Segment CAGR and Growth Architecture

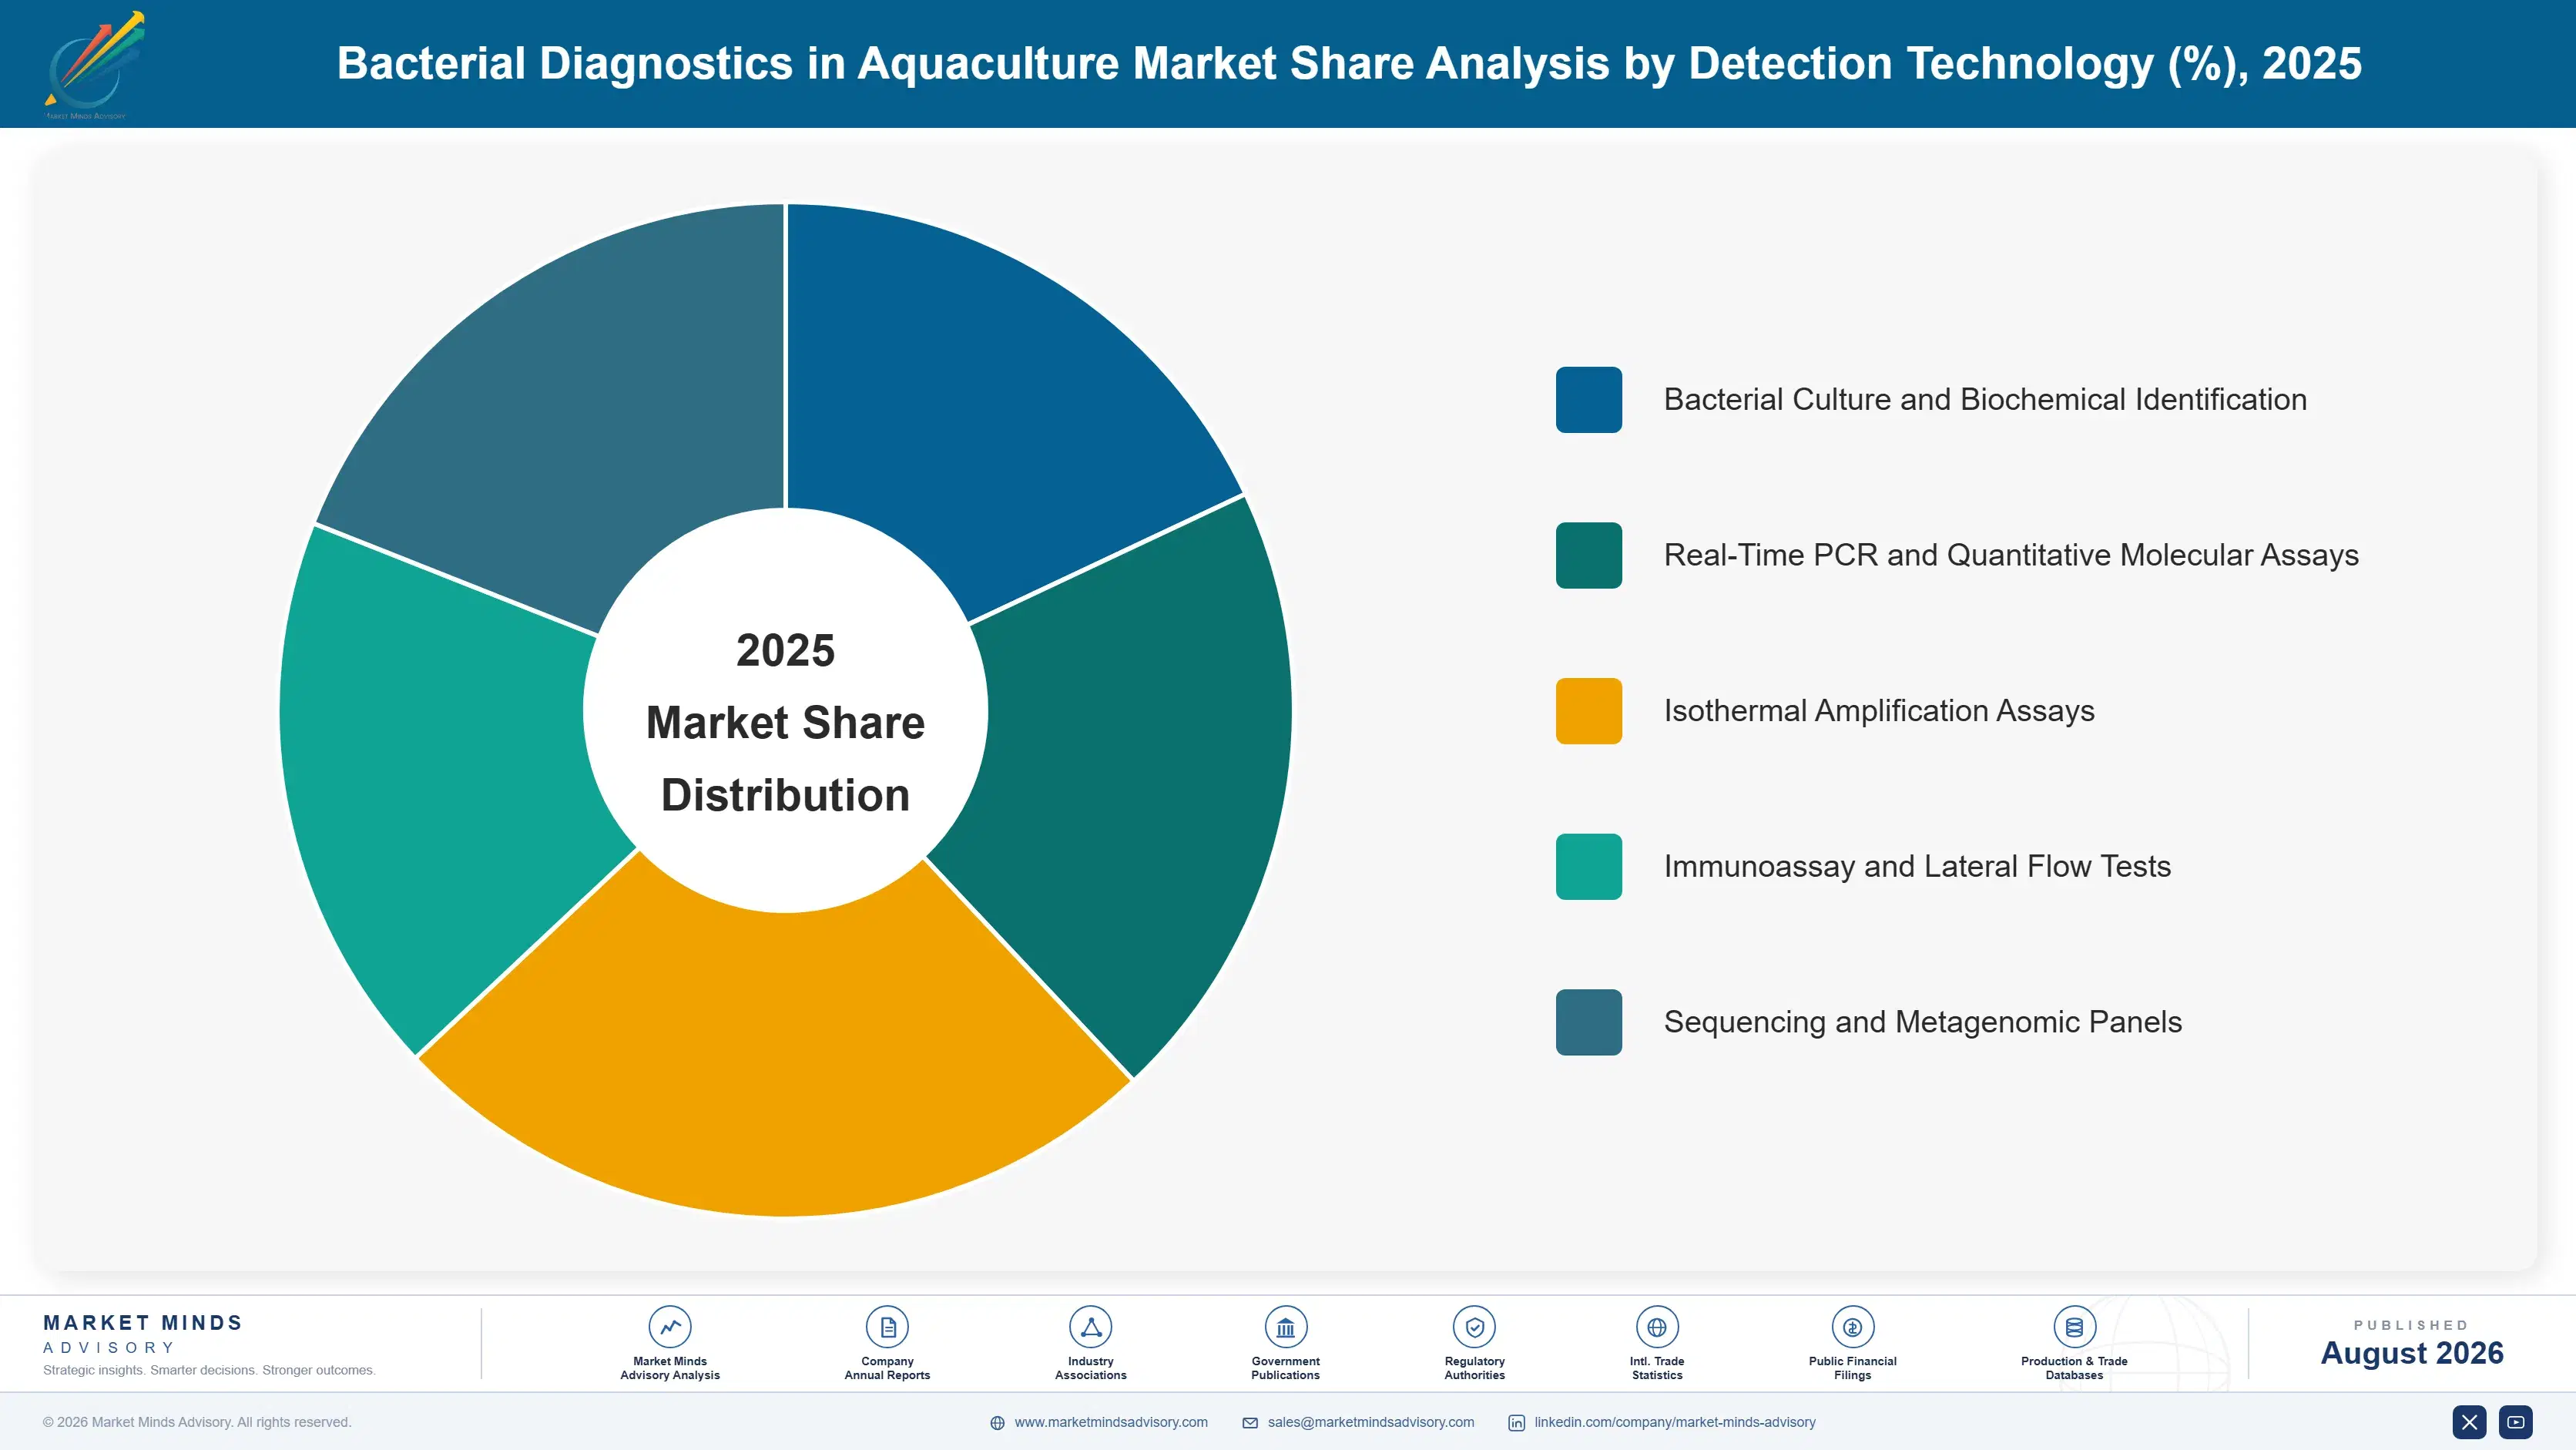
Segmentation follows detection technology, because technology determines where a test can be performed, how quickly it returns a result, what equipment and cold chain it requires and what it costs per sample. Five detection technologies cover bacterial diagnostics supply in aquaculture without overlap. Farmed species and pathogen target cut across every technology and are treated as use attributes.
bacterial-diagnostics-in-aquaculture-market-market-share-analysis-1787304841171

Isothermal Amplification Assays

Growing at 17.1%, a full 1.50x the market rate, isothermal chemistry amplifies bacterial DNA at a single constant temperature, which eliminates the thermocycler and allows a result at the pond edge rather than four days later through a central laboratory. Lyophilised reagent formats remove the cold chain that 68% of available tests still require, and in tropical producing regions that is a genuine operational barrier rather than a convenience question. Sensitivity is adequate for the pathogen loads that matter clinically. The commercial argument is timing: only a same-day result changes what a farmer actually does. Distribution through agricultural dealers becomes possible once refrigeration is no longer required at any point.
CAGR 17.1%

Sequencing and Metagenomic Panels

Sequencing approaches grow at 14.8% from a small base, driven less by routine farm use than by outbreak investigation, pathogen surveillance and antimicrobial resistance monitoring across producing regions. Metagenomic sampling identifies organisms that targeted assays were never designed to look for, which matters in a sector where novel bacterial syndromes have repeatedly appeared before any assay existed for them. Cost and turnaround keep it well outside routine decision-making. Integrated producers and national surveillance programmes are the realistic customers, not individual farms, and that shapes how the segment is sold. Antimicrobial resistance monitoring is an emerging application that regulators and certification bodies are beginning to require, which may broaden the customer base beyond research use over the forecast period.
CAGR 14.8%
Full segment breakdown across 5 segments available in the complete report.

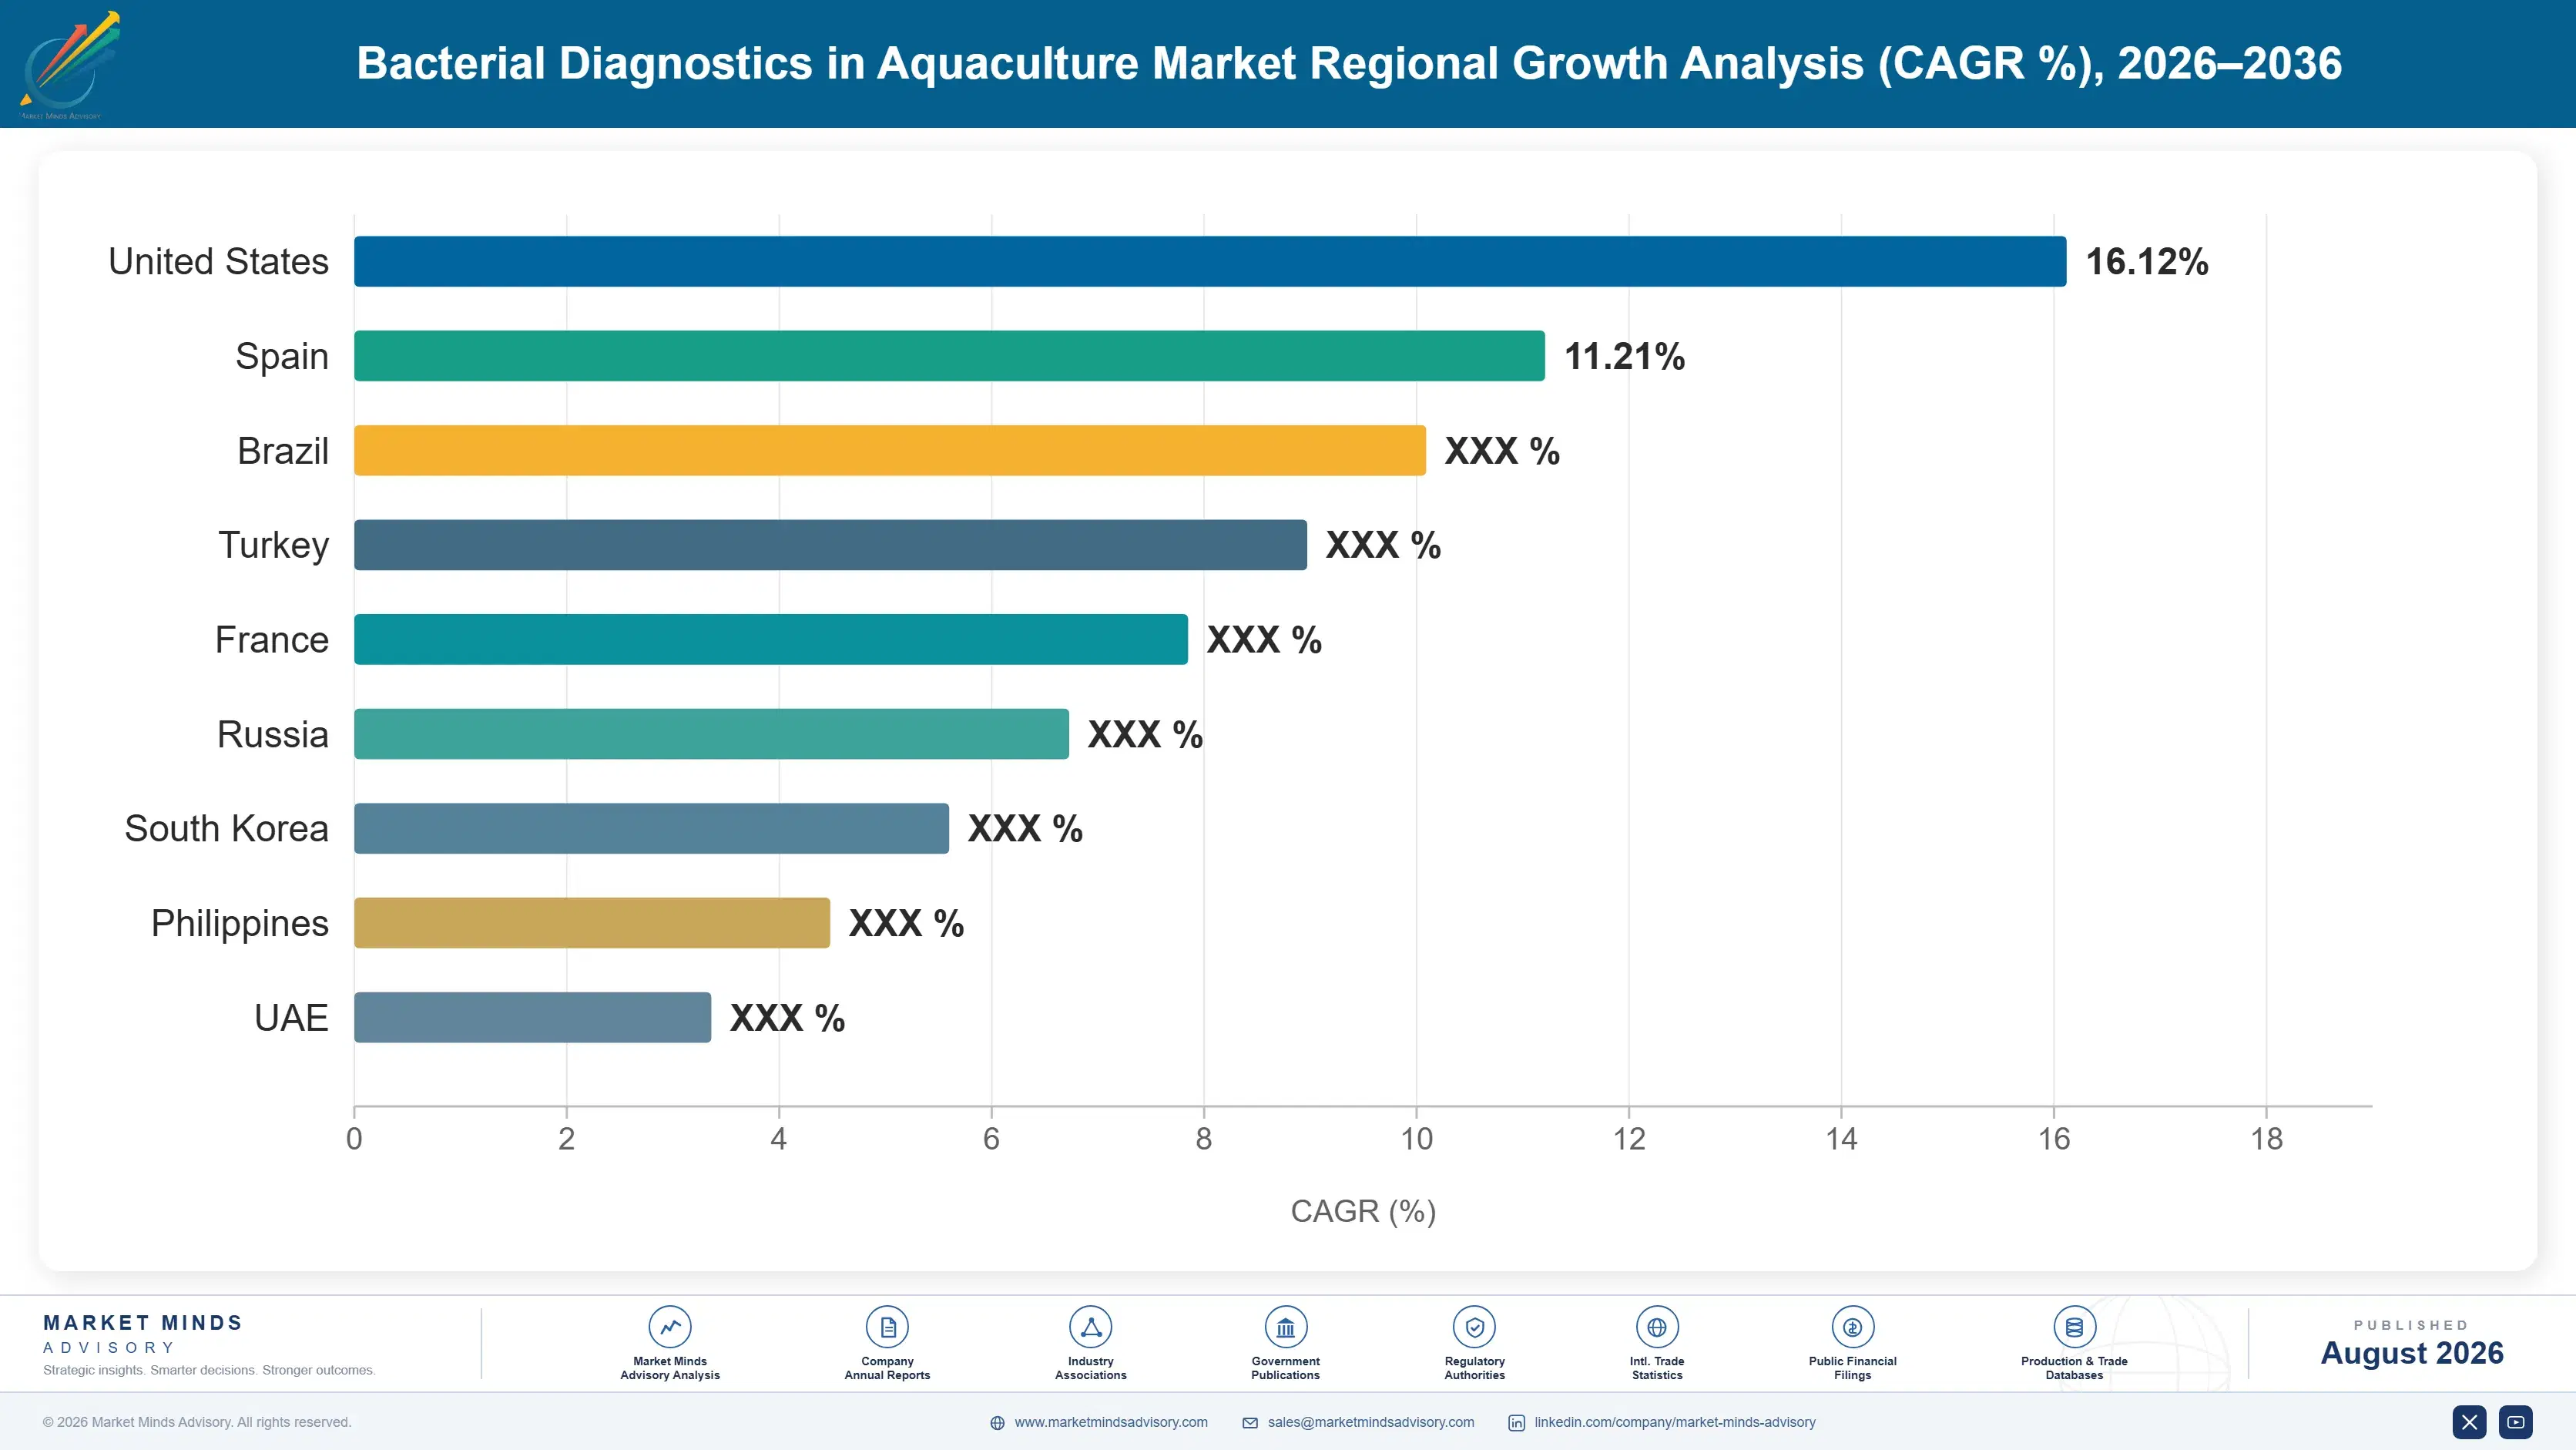
Regional Architecture and Country Demand Map

Regional shares here follow farmed production volume and export exposure rather than economic size, which puts this market in almost the opposite places to most diagnostics categories. Note: several regional positions sit outside standard bands accordingly. Production volume rather than health spending sets the pattern below.

East Asia

East Asia holds the largest share at 34%. Note: this sits above the standard regional band because China alone produces more farmed aquatic animals than the rest of the world combined, across carp, tilapia, shrimp and marine finfish. Testing capacity has expanded through provincial laboratories and domestic assay manufacturers offering molecular kits at prices international suppliers cannot match. Antibiotic restriction in Chinese aquaculture has tightened materially, which pushes producers toward identification before treatment. Japanese and South Korean production is smaller and considerably more intensively managed, with routine testing already standard practice. Domestic assay quality has converged enough that large producers now buy locally as a matter of routine. Provincial laboratory capacity varies considerably.
Share: 34% | CAGR: 12.4% (2026 to 2036)

South Asia and Pacific

Twenty-six per cent of value and the fastest regional growth at 13.4%. Note: this greatly exceeds the standard band because India, Vietnam, Indonesia, Thailand and Bangladesh together form the heartland of export shrimp and freshwater fish farming. Indian and Vietnamese shrimp producers face the most demanding residue scrutiny of any suppliers into European and Japanese markets, which drives testing adoption directly. Production is highly fragmented across millions of small operators, so cooperative and processor-funded testing arrangements matter more here than anywhere else in reaching farms. Vietnamese and Indian processors have begun funding testing across contracted producer bases, which consolidates purchasing considerably and reaches volumes that direct farm selling never assembled.
Share: 26% | CAGR: 13.4% (2026 to 2036)
Regional intelligence for 5 additional markets available in the complete report: Latin America, Western Europe, North America, Middle East and Africa, Eastern Europe. Contact sales@marketmindsadvisory.com.
bacterial-diagnostics-in-aquaculture-market-country-cagr-analysis-1787304841827

Where Aquaculture Diagnostics Value Concentrates

A result arriving after the treatment decision has limited value, and most producers are too small to fund routine testing on their own account. Value therefore accrues to formats that beat the disease clock, to panel economics that make screening affordable, and to whoever the residue audit actually holds responsible. Assay performance is rarely the binding constraint.

Sell to whoever the residue audit holds responsible

Processors and exporters bear the cost of a rejected consignment, not the individual farm, and they are consolidated enough to fund testing across their entire supply base. Only 23% of farms test routinely when purchasing decisions sit at farm level. Programmes funded by the processor and applied across contracted producers reach volumes that direct farm sales never will, and they align the payer with the party actually carrying the commercial risk. That reframing matters more than any assay improvement. Purchasing consolidates enormously once it moves up the chain. Certification auditors are already asking for the records.
Market Impact: Lifts adoption well beyond 23% of a

Design assays to beat the disease clock

A centralised result takes 4 days while an outbreak takes three, so sensitivity improvements that keep a test in the laboratory improve a product nobody can act upon. Isothermal formats compound at 17.1% precisely because they trade a modest amount of analytical performance for a same-day answer at the pond edge. Development programmes benchmarking against laboratory reference methods are optimising the wrong specification, since operational usefulness rather than analytical equivalence determines what producers will pay for. Producers are buying a decision, not an analytical result, and they price it accordingly.
Market Impact: Beats a 4 day central laboratory de

Remove cold chain dependence from field product design

Roughly 68% of available assays require refrigerated reagent transport and storage, which in tropical producing regions across Southeast Asia, Ecuador and West Africa is a genuine barrier rather than a logistics detail. Lyophilised and ambient-stable formulations cost formulation development effort rather than new chemistry, and they open distribution routes through agricultural dealers that refrigerated products cannot use. Suppliers treating cold chain as the customer's problem are limiting their own reach far more than they generally recognise. Formulation development is a one-time engineering cost set against a recurring distribution saving. Wastage from cold chain failure is rarely quantified.
Market Impact: Removes a barrier affecting 68% of

Price multiplex panels against pond value rather than per target

Co-infection is common and single-target testing frequently misses the organism causing the damage, so a panel screening a dozen targets at once matches how disease actually presents. Bacterial disease removes roughly 11% of stock annually, and panel pricing set against that expected loss rather than against per-assay cost changes the purchasing conversation entirely. Producers evaluate testing against crop value, not against reagent cost, and suppliers pricing on the latter consistently leave margin unclaimed. Panels also improve accuracy, since co-infection is common and single-target testing regularly misses the organism doing the damage. Both arguments support the same pricing conversation.
Market Impact: Addresses the 11% of annual farmed

Who Controls the Margin Pool

Concentration is low at 41% across the top five, measured on annual revenue from aquaculture bacterial diagnostic reagents, instruments and laboratory services, the single basis applied throughout. Thermo Fisher Scientific and PatoGen lead through opposite approaches, one a global reagent and platform supplier and one a species-specialist embedded in Norwegian salmon health management. IDEXX, Zoetis and Genics hold the remaining leading positions across veterinary and shrimp-focused testing.
Competition is fragmented because the market is. Each farmed species carries different dominant pathogens in different geographies, so a shrimp vibriosis assay in Ecuador competes against nobody selling salmonid bacteriology in Norway. Platform suppliers compete on reagent breadth and instrument installed base. Species specialists compete on local veterinary relationships and pathogen depth. Domestic Asian manufacturers compete almost entirely on price against both.

Pressure builds from two directions. Chinese and Taiwanese assay manufacturers supply molecular kits at prices international suppliers cannot approach, and their quality has improved enough that large producers now use them routinely. Separately, field-deployable formats favour companies with formulation capability over those with laboratory instrument positions. Rankings shift most where a supplier reaches processors rather than farms, since processor-funded programmes carry volume that farm-level selling never assembles.
bacterial-diagnostics-in-aquaculture-market-company-positioning-matrix-1787304842417

Competitive Moat and Risk Dimensions

THERMO FISHER SCIENTIFIC

Moat: Global reagent platform breadth

A molecular reagent and instrument portfolio spanning veterinary, food safety and research applications lets Thermo Fisher amortise development across markets far larger than aquaculture alone could ever justify. Installed thermocycler base in producing region laboratories creates a consumable relationship, and validated assay libraries across many aquatic pathogens give breadth that species specialists cannot assemble.
THERMO FISHER SCIENTIFIC

Risk: Laboratory-centred product design

The portfolio assumes a laboratory with equipment, trained staff and cold chain, which describes a shrinking share of where testing decisions actually need to happen. Field-deployable isothermal formats favour formulation capability over instrument installed base. Chinese and Taiwanese manufacturers undercut reagent pricing substantially in the largest producing markets.
PATOGEN

Moat: Salmonid pathogen specialist depth

Deep specialisation in salmonid bacteriology, built alongside Norwegian fish health veterinarians over many years, gives PatoGen assay depth and interpretive capability that general diagnostic suppliers cannot replicate through breadth. Embedding within regulated health management plans and mandatory reporting obligations makes the service part of how the industry operates rather than a purchased consumable.
PATOGEN

Risk: Narrow species and geography

The position depends on salmonid farming in a small number of high-value regions, which represents a modest share of global aquaculture volume and offers limited expansion room. Extending into shrimp or tropical finfish bacteriology means competing without the veterinary relationships that underpin the current business. Norwegian production growth is constrained by licensing.

Players Tracked

Prominent Players

Thermo Fisher Scientific
PatoGen
IDEXX Laboratories
Zoetis
Genics

Other Key Players

Qiagen
Bio-Rad Laboratories
Neogen
GeneReach Biotechnology
Aquatic Diagnostics
OptiGene
Takara Bio
Agilent Technologies
Merck KGaA
Promega
Pharmaq Analytiq
Fish Vet Group
Bioneer
Sansure Biotech
Hangzhou Bioer Technology

Recent Developments

FEBRUARY 2025

Processor-funded testing programmes extend across contracted shrimp supply bases

Shrimp processors in Ecuador and Vietnam extended diagnostic testing programmes across their contracted producer bases, an organic commercial shift that placed the cost with the party carrying residue rejection risk rather than with individual farms. Certification auditors had begun requesting testing records directly. Producer participation was contractual rather than voluntary.
Signal: Moving the payer up the supply chain reach
JULY 2025

Ambient-stable isothermal formats reach commercial field deployment

Isothermal amplification assays using lyophilised reagents requiring no refrigeration reached commercial deployment across tropical producing regions, removing the cold chain dependence that still constrains roughly two thirds of available diagnostic products. Distribution through agricultural dealers became possible for the first time as a result of the change.
Signal: Formulation rather than detection chemistr
NOVEMBER 2025

Asian assay manufacturers expand molecular kit supply into export producers

Chinese and Taiwanese diagnostic manufacturers widened molecular assay supply to large export-oriented producers across Southeast Asia through organic commercial competition, offering validated kits at prices international suppliers could not profitably match. Quality had converged sufficiently that few of those producers intend returning to imported reagents at any point.
Signal: Price competition has already reached aqua

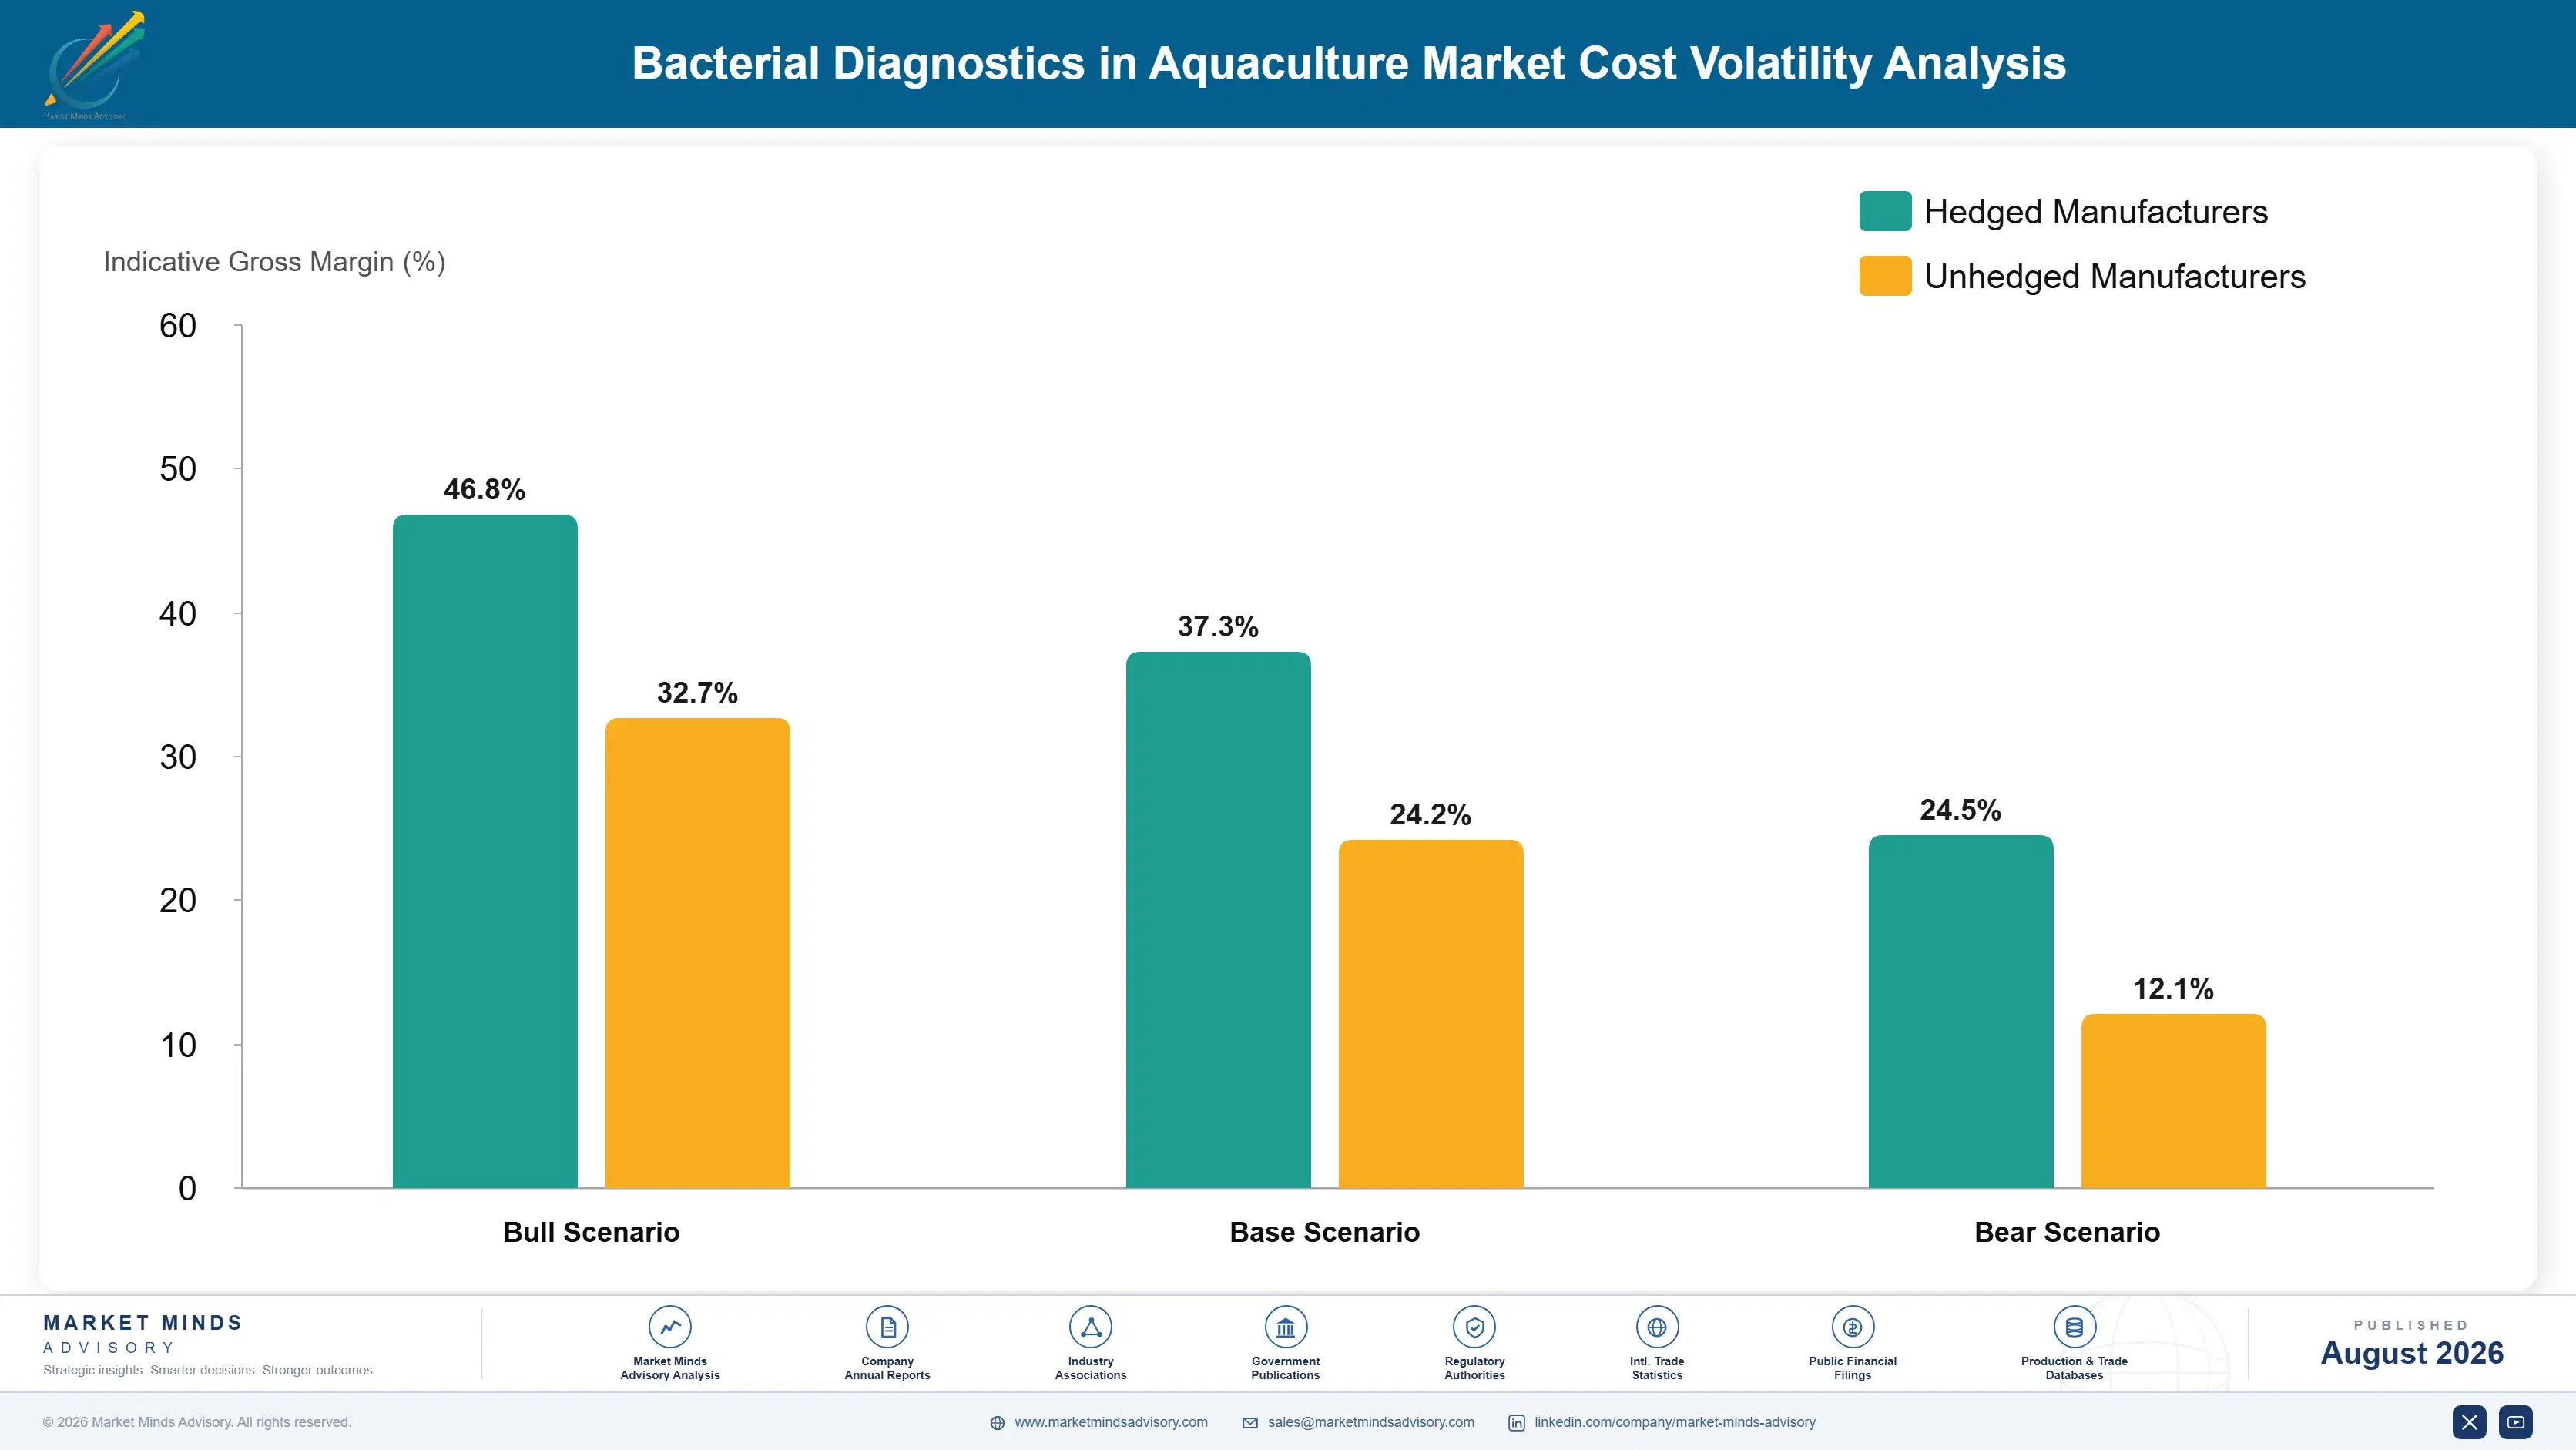
Enzyme, Antibody and Laboratory Network Costs

Reagent economics dominate this category. Polymerases, reverse transcriptases and associated enzymes account for roughly 36% of molecular assay cost of goods, sourced from a concentrated group of specialist enzyme manufacturers in North America, Western Europe and increasingly China. Antibody production for immunoassay formats adds comparable cost in that segment. Laboratory service revenue carries an entirely different structure, dominated by sample logistics and technician labour rather than b
Enzyme and consumable supply tightened severely through 2021 and 2022 as clinical diagnostic demand absorbed capacity that veterinary and agricultural applications normally rely upon, and aquaculture sat at the back of every allocation queue given its modest volumes. Supplier annual reports documented both the constraint and the subsequent expansion. Plastic consumable availability proved as limiting as enzyme supply for several manufacturers. Several suppliers have since expanded capacity substantially.

Exposure varies most by business model rather than by scale. Reagent suppliers carry enzyme cost on every test sold, while laboratory service providers carry fixed network and logistics cost that only volume amortises. Geography compounds it: Chinese enzyme production now supplies domestic assay manufacturers at costs Western suppliers cannot match, which explains the price gap across Asian markets.
bacterial-diagnostics-in-aquaculture-market-cost-volatility-analysis-1787304842617

Qualify second-source enzyme supply before allocation tightens again

Aquaculture diagnostic volumes command no priority whatsoever when clinical demand absorbs enzyme capacity, as several manufacturers discovered at considerable cost during recent disruption. Qualifying alternate enzyme sources during normal conditions costs validation work rather than capital, and it removes an exposure that arrives without warning. Chinese suppliers now offer genuinely viable alternatives at materially lower cost.

Shift laboratory networks toward regional hubs near production

Sample logistics rather than assay cost dominates laboratory service economics, and shipping samples from rural producing regions to distant central laboratories adds both cost and the delay that limits the product's value. Regional hubs close to major producing clusters reduce both simultaneously. The capital requirement is modest relative to the turnaround improvement achieved. Turnaround improvement is what producers actually notice.

Design lyophilised formats to eliminate refrigerated distribution cost

Cold chain distribution into tropical producing regions carries cost and wastage that ambient-stable lyophilised formulations remove entirely, while also opening agricultural dealer channels that refrigerated products cannot use. Formulation development is a one-time cost against a recurring distribution saving, and two thirds of available assays still carry this burden. Cold chain failure also invalidates samples at rates few quantify.

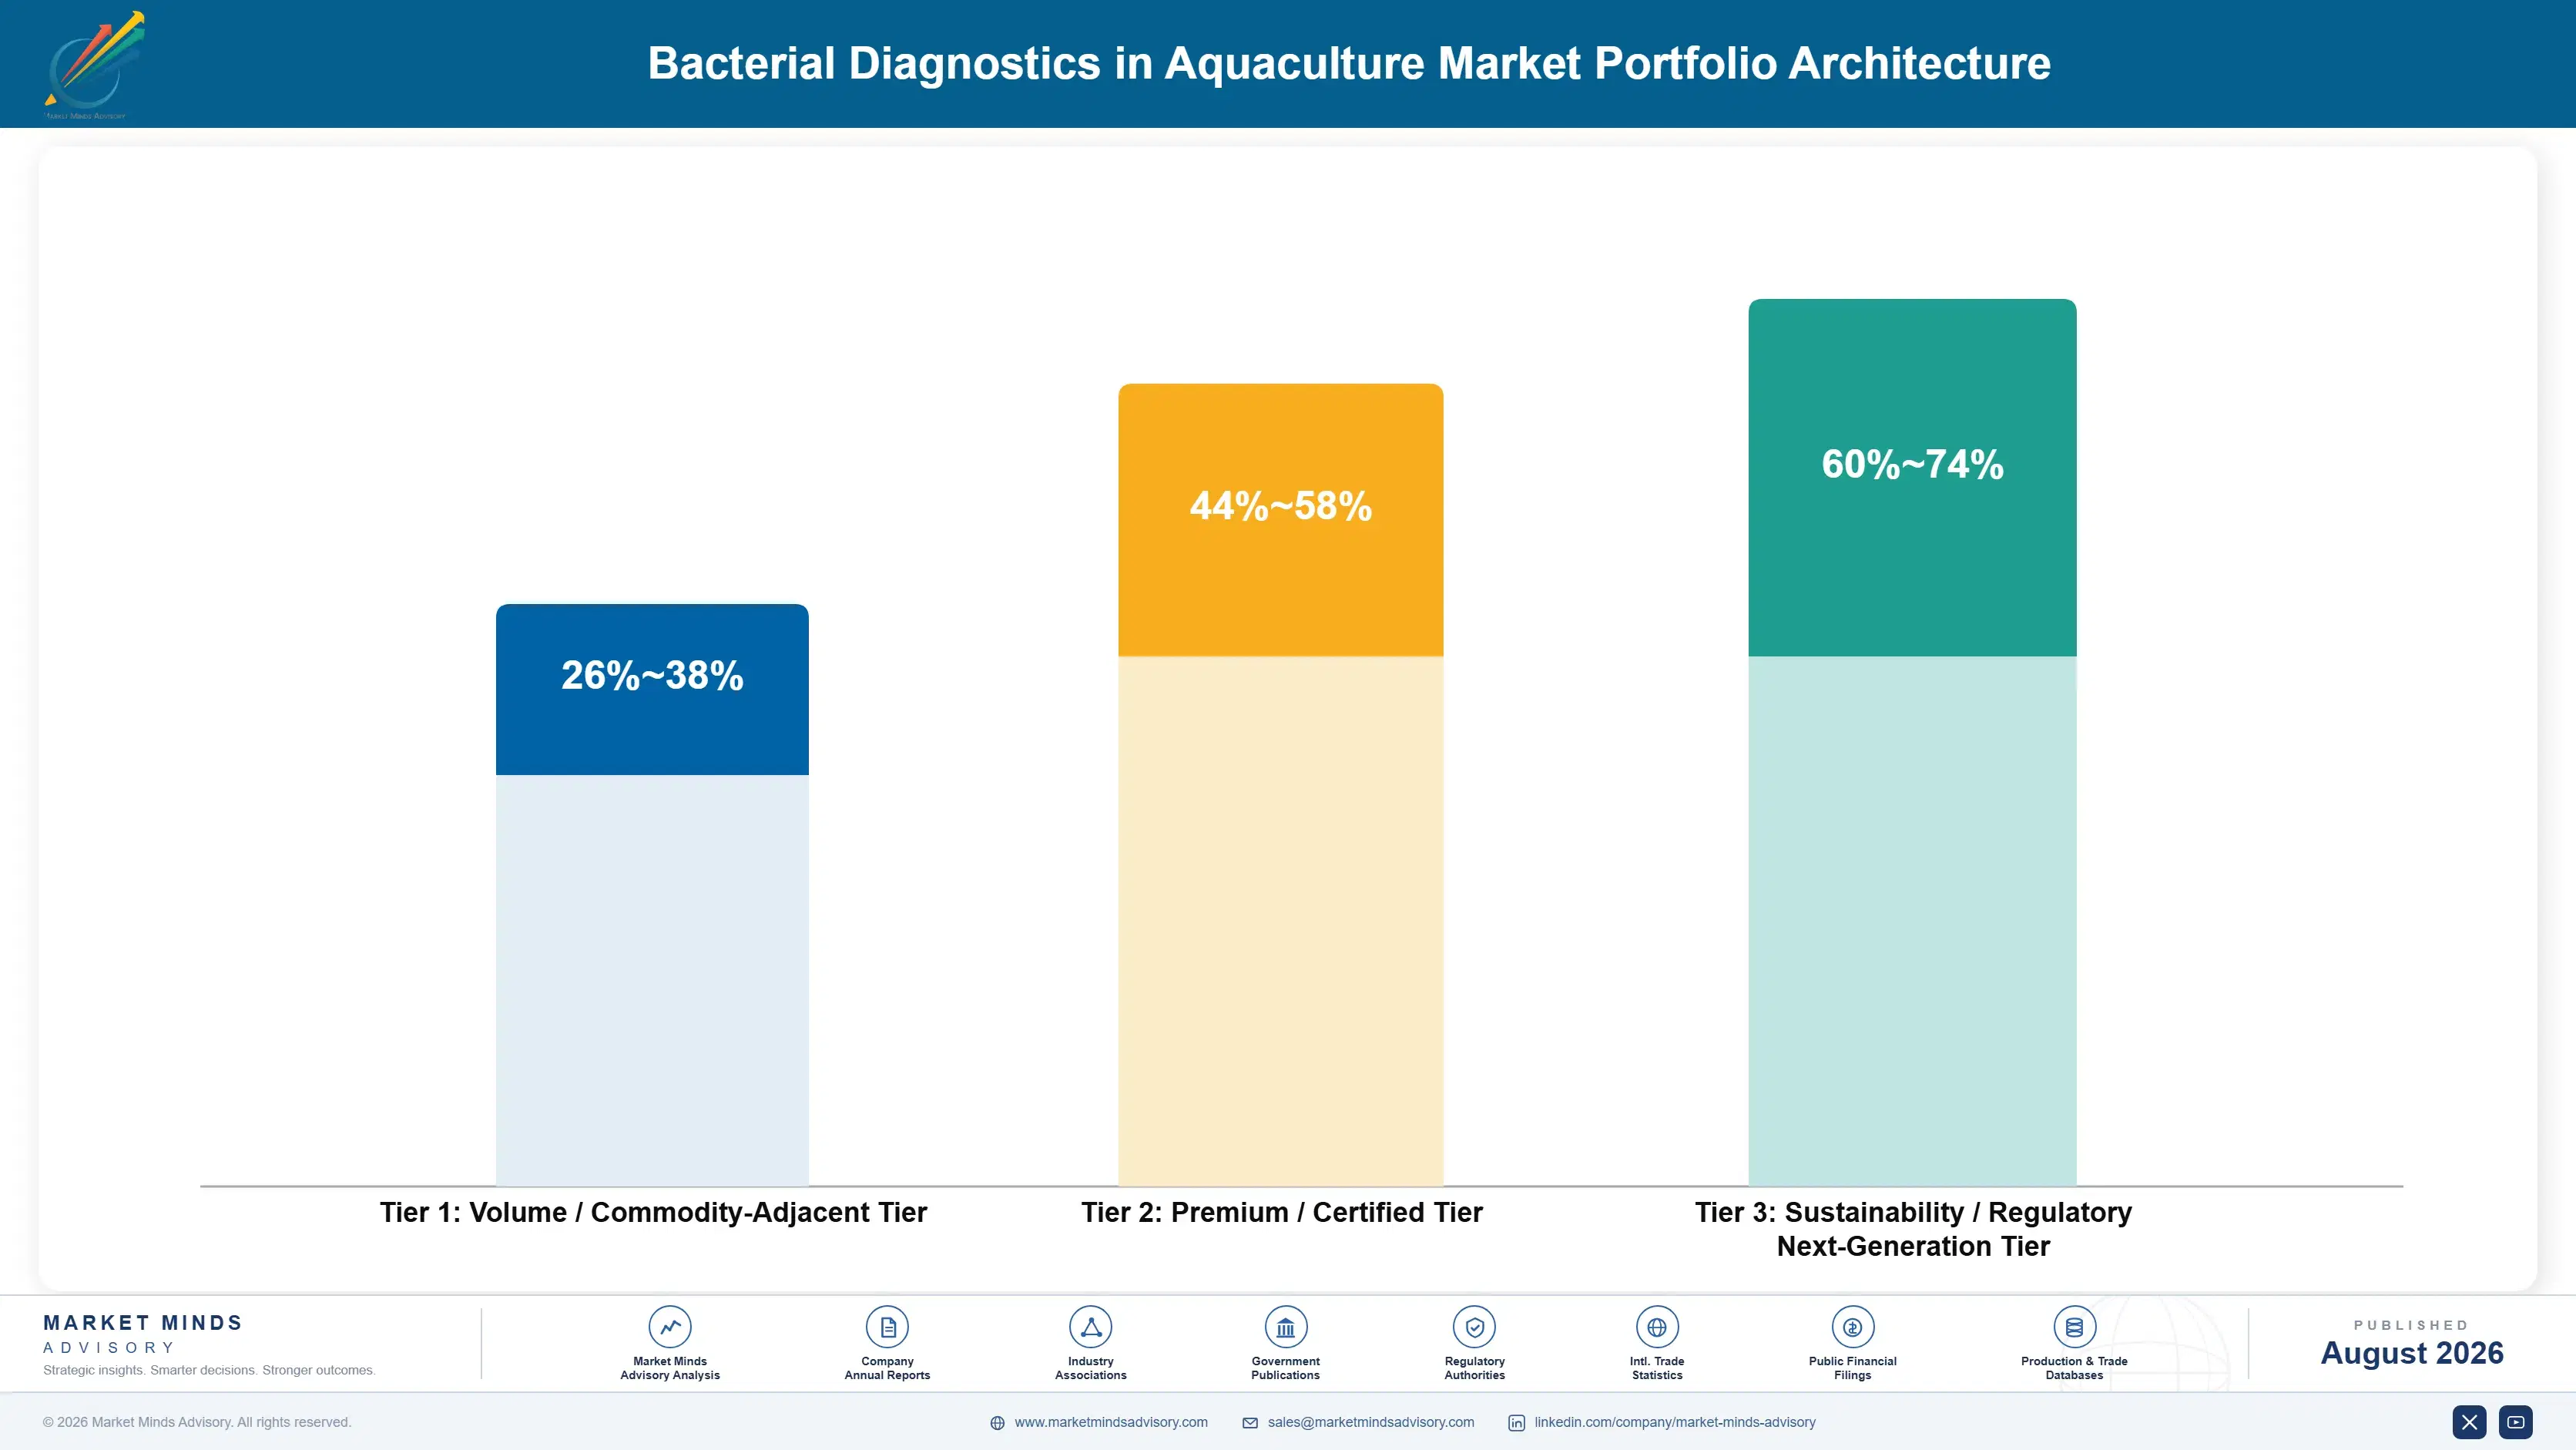
Portfolio Architecture for Margin Defence

Margin architecture separates on where a test can be performed. Laboratory reagents sold into producing region laboratories compete against domestic Asian manufacturers on price and earn accordingly, with quality differences narrowing steadily. Laboratory services carry network and logistics cost that only volume amortises, and they earn well only where sample density is high. Field-deployable formats earn best, because very few suppliers offer them and producers value the timing enormously.
The volume against premium tension runs along producer size rather than product tier. Large integrated exporters test routinely, buy on programme terms and represent a manageable customer count. Millions of smallholders across Asian aquaculture generate most of the world's production and almost none of the testing revenue, and reaching them at all requires cooperative or processor-funded arrangements. Neither group alone supports a business built for the other.

High-value pools concentrate around timing and access. Field-deployable ambient-stable assays, multiplex panels priced against pond value, and processor-funded programme contracts all command pricing that individual laboratory assays do not. Standard molecular reagents sold into producing region laboratories compete directly against domestic manufacturers whose cost structures international suppliers cannot match, and that pressure keeps intensifying across every major producing market.

Volume / Commodity-Adjacent Tier

Standard molecular reagents and culture media sold into producing region laboratories, competing directly against domestic Asian manufacturers whose enzyme and production costs international suppliers cannot approach. Quality differences have narrowed steadily over recent years.
Gross Margin: 26-38%

Premium / Certified Tier

Validated species-specific assay panels and accredited laboratory services embedded in veterinary health plans and regulatory reporting, protected by interpretive capability and by accreditation that takes years to obtain. Interpretive capability matters as much as the assay itself.
Gross Margin: 44-58%

Sustainability / Regulatory / Next-Generation Tier

Field-deployable ambient-stable isothermal assays and multiplex panels priced against pond value, commanding premium because same-day results at the pond edge change what a producer can actually do. Very few suppliers currently offer this at all.
Gross Margin: 60-74%
bacterial-diagnostics-in-aquaculture-market-portfolio-architecture-1787304843121

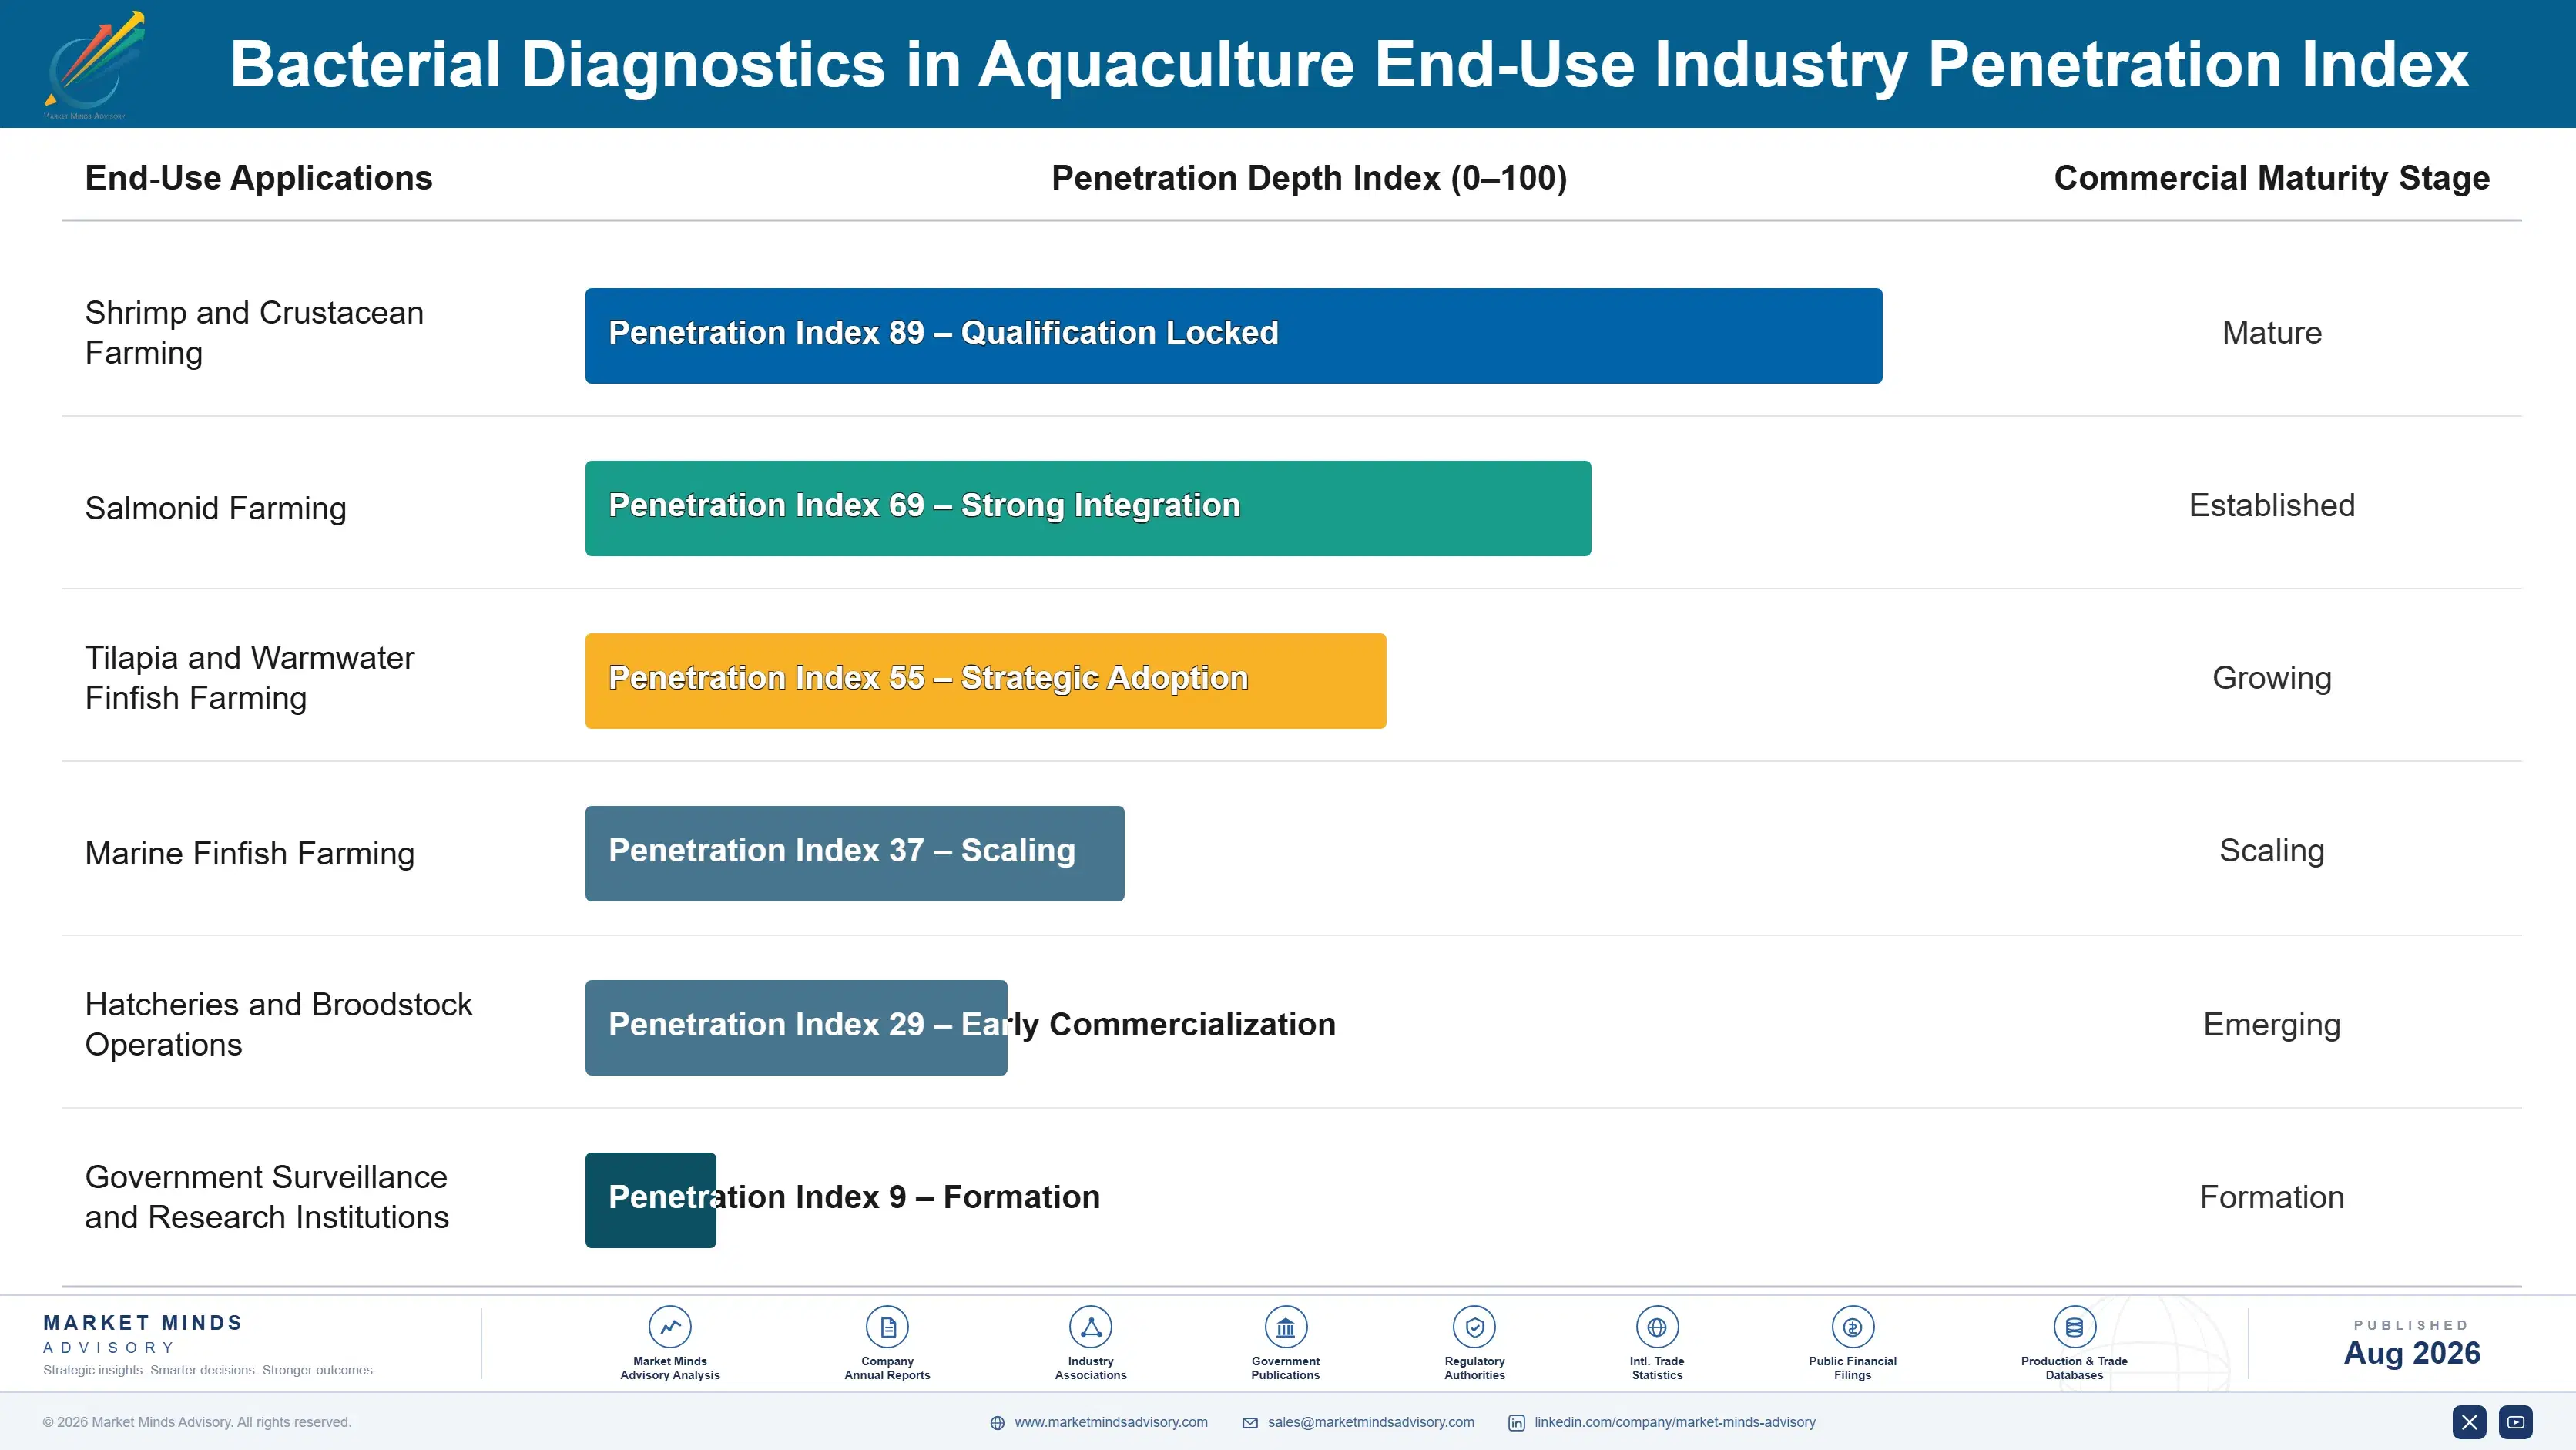
Outbreak Response Against Scheduled Screening

Two demand patterns operate here and they generate very different revenue. Outbreak testing is reactive, episodic and urgent, arriving when a producer is already losing stock and wants to know what is killing it, and it produces unpredictable volume concentrated in bad years. Scheduled screening is recurring and forecastable, tied to production cycles rather than to disease events, and it currently reaches only 23% of producers.
Adoption depth follows export exposure far more closely than disease burden. Producers selling into European and Japanese markets test because residue rejection would cost them the relationship, and their testing is documented, audited and routine. Producers serving domestic markets in the same countries, facing identical pathogens, frequently never test at all. Integrated salmon operations in Norway and Chile sit at the deepest end, with testing written into regulated health plans.

Buyer profiles have shifted in a way that matters commercially. Individual farm owners were historically the customer and remain the hardest to reach economically. Processors and exporters now fund testing across contracted supply bases because they carry the rejection risk, which consolidates purchasing enormously. Veterinary practices, surveillance programmes and certification bodies each represent further distinct buyers.
bacterial-diagnostics-in-aquaculture-market-end-use-penetration-index-1787304843614

Where Aquaculture Diagnostics Strategy Lands

These are among the four positions where our research anticipates prominent divergence between winners and laggards over the coming forecast period. Each is grounded in the demand model, the regulatory perimeter, and the announced capacity pipeline.
01 / TIMING OVER SENSITIVITY

A result after the decision documents rather than directs

Centralised laboratory testing returns a result in roughly 4 days while a bacterial outbreak can empty a shrimp pond in three, so the treatment decision is made before the diagnosis arrives in almost every case. Isothermal formats compound at 17.1% precisely because they trade a little analytical performance for an answer available the same day at the pond edge. Development programmes still benchmarking against laboratory reference sensitivity are optimising a specification that producers in the field cannot actually use at all.
02 / RESIDUE AUDIT CUSTOMER

The buyer is compliance, not fish health

Producers selling into European and Japanese markets test routinely because a residue rejection costs the consignment, the buyer relationship and frequently the certification behind both, while producers facing identical pathogens in domestic markets often never test at all. That pattern looks entirely irrational until the residue audit rather than the fish itself is recognised as the actual customer here. Ecuador compounds at 18.4% substantially on this pressure alone, as the largest shrimp exporter anywhere facing the very closest residue scrutiny.
03 / PAYER POSITION SHIFT

Sell to processors, because farms cannot fund this

Only 23% of producers test on a scheduled basis, and across fragmented Asian aquaculture a single assay at roughly USD 18 represents a meaningful proportion of margin on one small pond. Processors and exporters carry the rejection risk, are consolidated enough to fund testing across an entire contracted supply base, and reach farm volumes that direct selling has never assembled. Moving the payer up the supply chain matters considerably more in this category than any conceivable improvement to the assay itself.
04 / COLD CHAIN ELIMINATION

Refrigeration is a barrier, not a logistics detail

Roughly 68% of available assays still require refrigerated reagent transport and storage, and across tropical producing regions in Southeast Asia, Ecuador and West Africa that requirement genuinely determines whether a test can be performed at all. Ambient-stable lyophilised formulations cost formulation development effort rather than any new detection chemistry, and they open agricultural dealer distribution that refrigerated products simply cannot use. Suppliers treating cold chain as the customer's problem to solve are limiting their own commercial reach far more substantially than they generally recognise.

Engagement Snapshot From the Field

A live engagement with an industry participant carrying material or product regulatory and market exposure ahead of a defining policy shift, showing how our research translates into a defensible multi-year portfolio strategy.
MARKET MINDS ADVISORY · CLIENT ENGAGEMENT SUMMARY
Bacterial Diagnostics in Aquaculture Producer Strategic Portfolio Review and Transition Roadmap 2026·Investment Scenario on Bacterial Diagnostics in Aquaculture Exposure Evaluation 2025-26
CLIENT PROFILE
An aquaculture diagnostics company supplying validated molecular assays and operating two regional laboratories serving shrimp and finfish producers across Southeast Asia and Latin America. Annual revenue was approximately USD 32 million (client-reported, unverified by MMA), weighted heavily toward laboratory services sold directly to individual farms with limited penetration among smaller producers. Cold chain failures had been invalidating samples at an unquantified rate.
STRATEGIC CHALLENGE
Farm-level sales had plateaued because most producers were too small to fund routine testing, while Chinese assay manufacturers were undercutting reagent pricing among the large producers who did test. The board needed to determine whether to compete on reagent cost, invest in field-deployable formats, or restructure the commercial model around processors rather than farms entirely.
MMA APPROACH
MMA conducted 47 expert interviews spanning shrimp and finfish producers, processor quality directors, export certification auditors, aquaculture veterinarians, laboratory managers and importer procurement staff across six countries. A quantitative survey of 3,800 respondents established testing behaviour, willingness to pay against pond value and residue compliance practice. We then modelled revenue outcomes under farm-direct, processor-funded and field-format strategies against observed adoption and pricing data.
KEY FINDINGS
  1. Processors in five of six markets already bore the full commercial cost of residue rejection, and most had considered funding producer testing without any supplier having proposed it.
  2. Producers evaluated testing against expected pond loss rather than reagent cost, and consistently accepted higher pricing when suppliers framed it that way.
  3. Cold chain failure had invalidated a meaningful proportion of samples reaching the client's laboratories, a loss neither the client nor its customers had been quantifying.
  4. Domestic Asian assay quality had converged sufficiently that large producers used it routinely, and none surveyed intended to return to imported reagents.
CLIENT PROFILE
An aquaculture diagnostics company supplying validated molecular assays and operating two regional laboratories serving shrimp and finfish producers across Southeast Asia and Latin America. Annual revenue was approximately USD 32 million (client-reported, unverified by MMA), weighted heavily toward laboratory services sold directly to individual farms with limited penetration among smaller producers. Cold chain failures had been invalidating samples at an unquantified rate.
STRATEGIC CHALLENGE
Farm-level sales had plateaued because most producers were too small to fund routine testing, while Chinese assay manufacturers were undercutting reagent pricing among the large producers who did test. The board needed to determine whether to compete on reagent cost, invest in field-deployable formats, or restructure the commercial model around processors rather than farms entirely.
MMA APPROACH
MMA conducted 47 expert interviews spanning shrimp and finfish producers, processor quality directors, export certification auditors, aquaculture veterinarians, laboratory managers and importer procurement staff across six countries. A quantitative survey of 3,800 respondents established testing behaviour, willingness to pay against pond value and residue compliance practice. We then modelled revenue outcomes under farm-direct, processor-funded and field-format strategies against observed adoption and pricing data.
KEY FINDINGS
  1. Processors in five of six markets already bore the full commercial cost of residue rejection, and most had considered funding producer testing without any supplier having proposed it.
  2. Producers evaluated testing against expected pond loss rather than reagent cost, and consistently accepted higher pricing when suppliers framed it that way.
  3. Cold chain failure had invalidated a meaningful proportion of samples reaching the client's laboratories, a loss neither the client nor its customers had been quantifying.
  4. Domestic Asian assay quality had converged sufficiently that large producers used it routinely, and none surveyed intended to return to imported reagents.
RECOMMENDED STRATEGY
Phase 1: Phase one: restructure commercial effort toward processors and exporters, who carry residue risk and can fund testing across an entire contracted producer base. Phase 2: Phase two: develop ambient-stable field formats rather than competing on laboratory reagent cost, where domestic Asian manufacturers hold a permanent advantage. Phase 3: Phase three: reprice multiplex panels against expected pond loss rather than per target, matching how producers actually evaluate the purchase.
OUTCOME
The client restructured its commercial organisation around processor accounts, secured four supply-base programmes covering several thousand producers, and launched an ambient-stable field assay (client-reported, unverified by MMA). Tested sample volume roughly doubled within eighteen months, laboratory utilisation improved substantially, and reagent price competition ceased to determine the outcome of major accounts.

Frequently Asked Questions

Foundational context covering the market sizes, CAGR, scope, country, region and competition that inform every finding below. This section is provided to cover basics and most often pre-purchase conversations, answered from the MMA Primary Research Dataset.

What is the current size of the Bacterial Diagnostics in Aquaculture Market?

The global market was valued at USD 0.24 billion in 2025, spanning culture, PCR, isothermal amplification, immunoassay and sequencing approaches. Only 23% of producers currently test on a routine scheduled basis rather than during outbreaks.

How large will the Bacterial Diagnostics in Aquaculture Market be by 2036?

MMA forecasts the market at USD 0.79 billion by 2036, expanding 2.93 times from the 2026 base of USD 0.27 billion. That represents roughly USD 0.52 billion of incremental value across the forecast decade.

What is the CAGR for the Bacterial Diagnostics in Aquaculture Market 2026 to 2036?

The base case compound annual growth rate is 11.4%, with a bull case of 12.6% and a bear case of 10.2%. The bull case assumes multiplex pond-side testing reaches price parity with single laboratory assays.

Which segment is growing fastest?

Isothermal amplification assays grow at 17.1%, a full 1.50x the overall market rate. Single-temperature reactions run at the pond edge without a thermocycler and frequently without any cold chain.

Who are the major companies in the Bacterial Diagnostics in Aquaculture Market?

Thermo Fisher Scientific, PatoGen, IDEXX Laboratories, Zoetis and Genics together hold 41% of revenue. Fragmentation reflects different pathogens in different species across different producing geographies, with no universal panel available.

Which country is growing fastest?

Ecuador grows fastest at 18.4%, as the largest shrimp exporter facing the closest residue scrutiny and persistent vibriosis pressure. East Asia is the largest region at 34% of value on production volume.

Report Segmentation Architecture

The full report scope spans multiple orthogonal segmentation dimensions, with cross-tabulated demand data provided for each dimension pair. Coverage extends further to regional breakdowns, trend trajectories, and the competitive detail needed to support segment-level decision-making.

By Detection Technology

  • Bacterial Culture and Biochemical Identification
  • Real-Time PCR and Quantitative Molecular Assays
  • Isothermal Amplification Assays
  • Immunoassay and Lateral Flow Tests
  • Sequencing and Metagenomic Panels

By End-Use Industry

  • Shrimp and Crustacean Farming
  • Salmonid Farming
  • Tilapia and Warmwater Finfish Farming
  • Marine Finfish Farming
  • Hatcheries and Broodstock Operations
  • Government Surveillance and Research Institutions

By Commercial Dimension

  • Direct Farm Reagent and Kit Sales
  • Centralised Laboratory Service Contracts
  • Processor-Funded Supply Base Programmes
  • Veterinary Practice Distribution
  • Agricultural Dealer and Distributor Channel
  • Government Surveillance Tender Supply

By Region

  • East Asia
  • South Asia and Pacific
  • Latin America
  • Western Europe
  • North America
  • Middle East and Africa
  • Eastern Europe

Scope, Methodology, and Coverage

Every figure in this report is reproducible from documented input assumptions. The scope below maps the historical period, the forecast horizon, the segmentation dimensions, and the countries covered, alongside the underlying primary and qualitative methodology.
Historical Period
2020 to 2025
Forecast Period
2026 to 2036
Base Year
2025 (USD billions; MMA Primary Research Dataset, August 2026)
Market Definition
This market comprises diagnostic products and services used to detect and identify bacterial pathogens in farmed aquatic animals, measured at supplier revenue across direct farm reagent and kit sales, centralised laboratory service contracts, processor-funded supply base programmes, veterinary practice distribution, agricultural dealer channels and government surveillance tender supply. Coverage spans bacterial culture media and biochemical identification systems, real-time PCR and quantitative molecular assays, isothermal amplification assays including loop-mediated and recombinase polymerase formats, immunoassay and lateral flow tests, and sequencing or metagenomic panels applied to bacterial identification, together with associated instruments and consumables. Viral, parasitic and fungal diagnostics, water quality and environmental monitoring equipment, vaccines, antibiotics and other therapeutics, genetics, breeding and broodstock services, feed and nutrition products, and farm management or traceability software fall outside scope.
Quantitative Units
USD millions (current prices); tests performed by technology; average cost per sample; farms testing routinely; result turnaround time; laboratory sample throughput
Segmentation Dimensions
By Detection Technology; By End-Use Industry; By Commercial Dimension; By Region
Regions Covered
East Asia, South Asia and Pacific, Latin America, Western Europe, North America, Middle East and Africa, Eastern Europe
Countries Covered
China, Japan, South Korea, Taiwan, India, Vietnam, Indonesia, Thailand, Bangladesh, Philippines, Australia, Ecuador, Chile, Brazil, Mexico, Honduras, Peru, Norway, Scotland, Denmark, Spain, Greece, Faroe Islands, United States, Canada, Egypt, Saudi Arabia, Nigeria, Turkey, Poland, Czechia, and additional markets relevant to aquaculture health analysis
Key Companies Profiled
Thermo Fisher Scientific, PatoGen, IDEXX Laboratories, Zoetis, Genics, Qiagen, Bio-Rad Laboratories, Neogen, GeneReach Biotechnology, Aquatic Diagnostics, OptiGene, Takara Bio, Agilent Technologies, Merck KGaA, Promega, Pharmaq Analytiq, Fish Vet Group, Bioneer, Sansure Biotech, Hangzhou Bioer Technology
Quantitative Methodology
Primary survey, n=3,800 respondents, Q4 2025, six countries; demand-side model with trade association cross-validation
Qualitative Methodology
47 expert interviews, Q4 2025; applied to validate demand model assumptions, identify emerging dynamics, and assess competitive positioning
Report Format
PDF and XLSX data workbook (Word format preview document)
Publisher
Market Minds Advisory
Report Code
MMA-2026-AGR-297
Published
August 2026
Contact
sales@marketmindsadvisory.com | www.marketmindsadvisory.com

Purchase the full Bacterial Diagnostics in Aquaculture Market Report (2026 to 2036).

The full MMA report treats the gap between laboratory turnaround and outbreak speed as the fact that governs this entire category, quantifying why adoption tracks export exposure rather than disease burden. It sizes five detection technologies and seven regions to 2036, modelling tests performed, sample pricing, routine testing penetration, turnaround time and cold chain dependence separately. Competitive assessment covers twenty suppliers on one consistent revenue basis. Cost exposure is traced through enzyme, antibody and laboratory network inputs. Four commercial levers and a strategic verdict close the report, grounded in 47 expert interviews and a 3,800-respondent survey.
Five detection technologies sized separately through 2036
Testing adoption mapped against export residue exposure
Processor-funded programme volumes separated from direct farm sales
Twenty suppliers assessed on one consistent revenue basis
Cold chain dependence quantified by assay format and region
Anonymised client engagement with tested strategic recommendations

Built For The People Who Decide

From boardroom strategy to bench-side execution, this report is read cover-to-cover by leaders shaping the next decade of their industry, turning demand scenarios, market dynamics and valuation benchmarks into decisions.
CXOs/ Presidents/ VPs/ Managers
M&A and Corporate Development
Strategy Teams and R&D Heads
Procurement and Product Directors
Regulatory and Compliance Leaders
Investor Relations and Equity Analysts