Market Minds Advisory
Artificial Intelligence in Healthcare Market

Artificial Intelligence in Healthcare Market: A Thousand Cleared Algorithms and Almost No Payment Pathway

Regulators have authorised roughly a thousand clinical algorithms, and only a handful of them carry a payment code, so hospitals fund the rest from operating budgets against returns nobody has verified.

Lead Analyst

Alice Ballenger

Published

September 2026

Make Smarter Decisions with Customized Research Insights

Request a free sample report and evaluate market opportunities, growth trends, and competitive dynamics relevant to your business needs.

2025 MARKET VALUE$16.5BMarket Size 2025
2036 FORECAST VALUE$69.7BBase Case , 2026 to 2036
CAGR 2026 TO 203614.0 %Bull 15.4% / Bear 12.6%
INCREMENTAL OPPORTUNITY$50.9BNet 10- year value creation
EXPANSION MULTIPLE3.71x2036 value over 2026 base
Strategic Levers
M&A Pipeline
Regional Outlook
Country Rankings
Competitive Intelligence
Segmental Deep-dive
Call-Us : 91 93563 13602

Executive Snapshot and Market Trajectory

Roughly a thousand clinical algorithms hold regulatory authorisation and about 6% of them have a payment pathway. Everything else is bought from an operating budget against a return the buyer has to take on trust, which explains why so many deployments stop at pilot.
Clinical documentation and ambient AI compounds at 21.0%, a full 1.50x the market rate, because it returns roughly 62 minutes of clinician time a day and the buyer can verify that themselves. North America holds 46% of global value, an exceptional concentration reflecting United States administrative complexity and health information technology spending that no other system approaches. Systems paying by capitation never generate that automatable work.
Concentration is remarkably low at 24%, the most fragmented market in this report series. Microsoft and Epic reach clinicians through software already installed; hundreds of specialists reach them through procurement processes with no budget line. Distribution rather than model quality is deciding this market. Roughly 31% of pilots reach production, and the failures happen at the recurring budget stage rather than on performance. Placement is beating performance in very nearly every contest across this market.
Market Definition
This market covers artificial intelligence software and services deployed in healthcare delivery and administration, spanning medical imaging and diagnostic AI, clinical documentation and ambient capture, revenue cycle and administrative automation, clinical decision support and risk prediction, patient engagement and virtual care, and operational capacity management. Drug discovery and pharmaceutical research applications, genomic sequencing analysis pipelines, medical device hardware, general enterprise software without healthcare-specific function, and consumer wellness applications without clinical claims are excluded.
Base Year Value
$16.5B in 2025 (MMA Primary Research Dataset, August 2026)
Forecast Period
2026 to 2036, eleven discrete annual values
CAGR
14.0% base case. Bull 15.4%. Bear 12.6%.
Fastest Growth Segment
Clinical Documentation and Ambient AI: 21.0% CAGR
Fastest Growth Country
India: 17.4% CAGR
Fastest Growth Region
South Asia and Pacific: 16.2% CAGR
Largest Region
North America: 46% of 2025 global value
Market Leaders
Microsoft, Epic Systems, Siemens Healthineers, Google, and GE HealthCare. Source: MMA Primary Research Dataset, July 2026.
Primary Survey
n=3,800 procurement and R&D decision-makers, Q4 2025, six countries
Methodology
Demand-side build-up, cross-validated against public data, 47 expert interviews

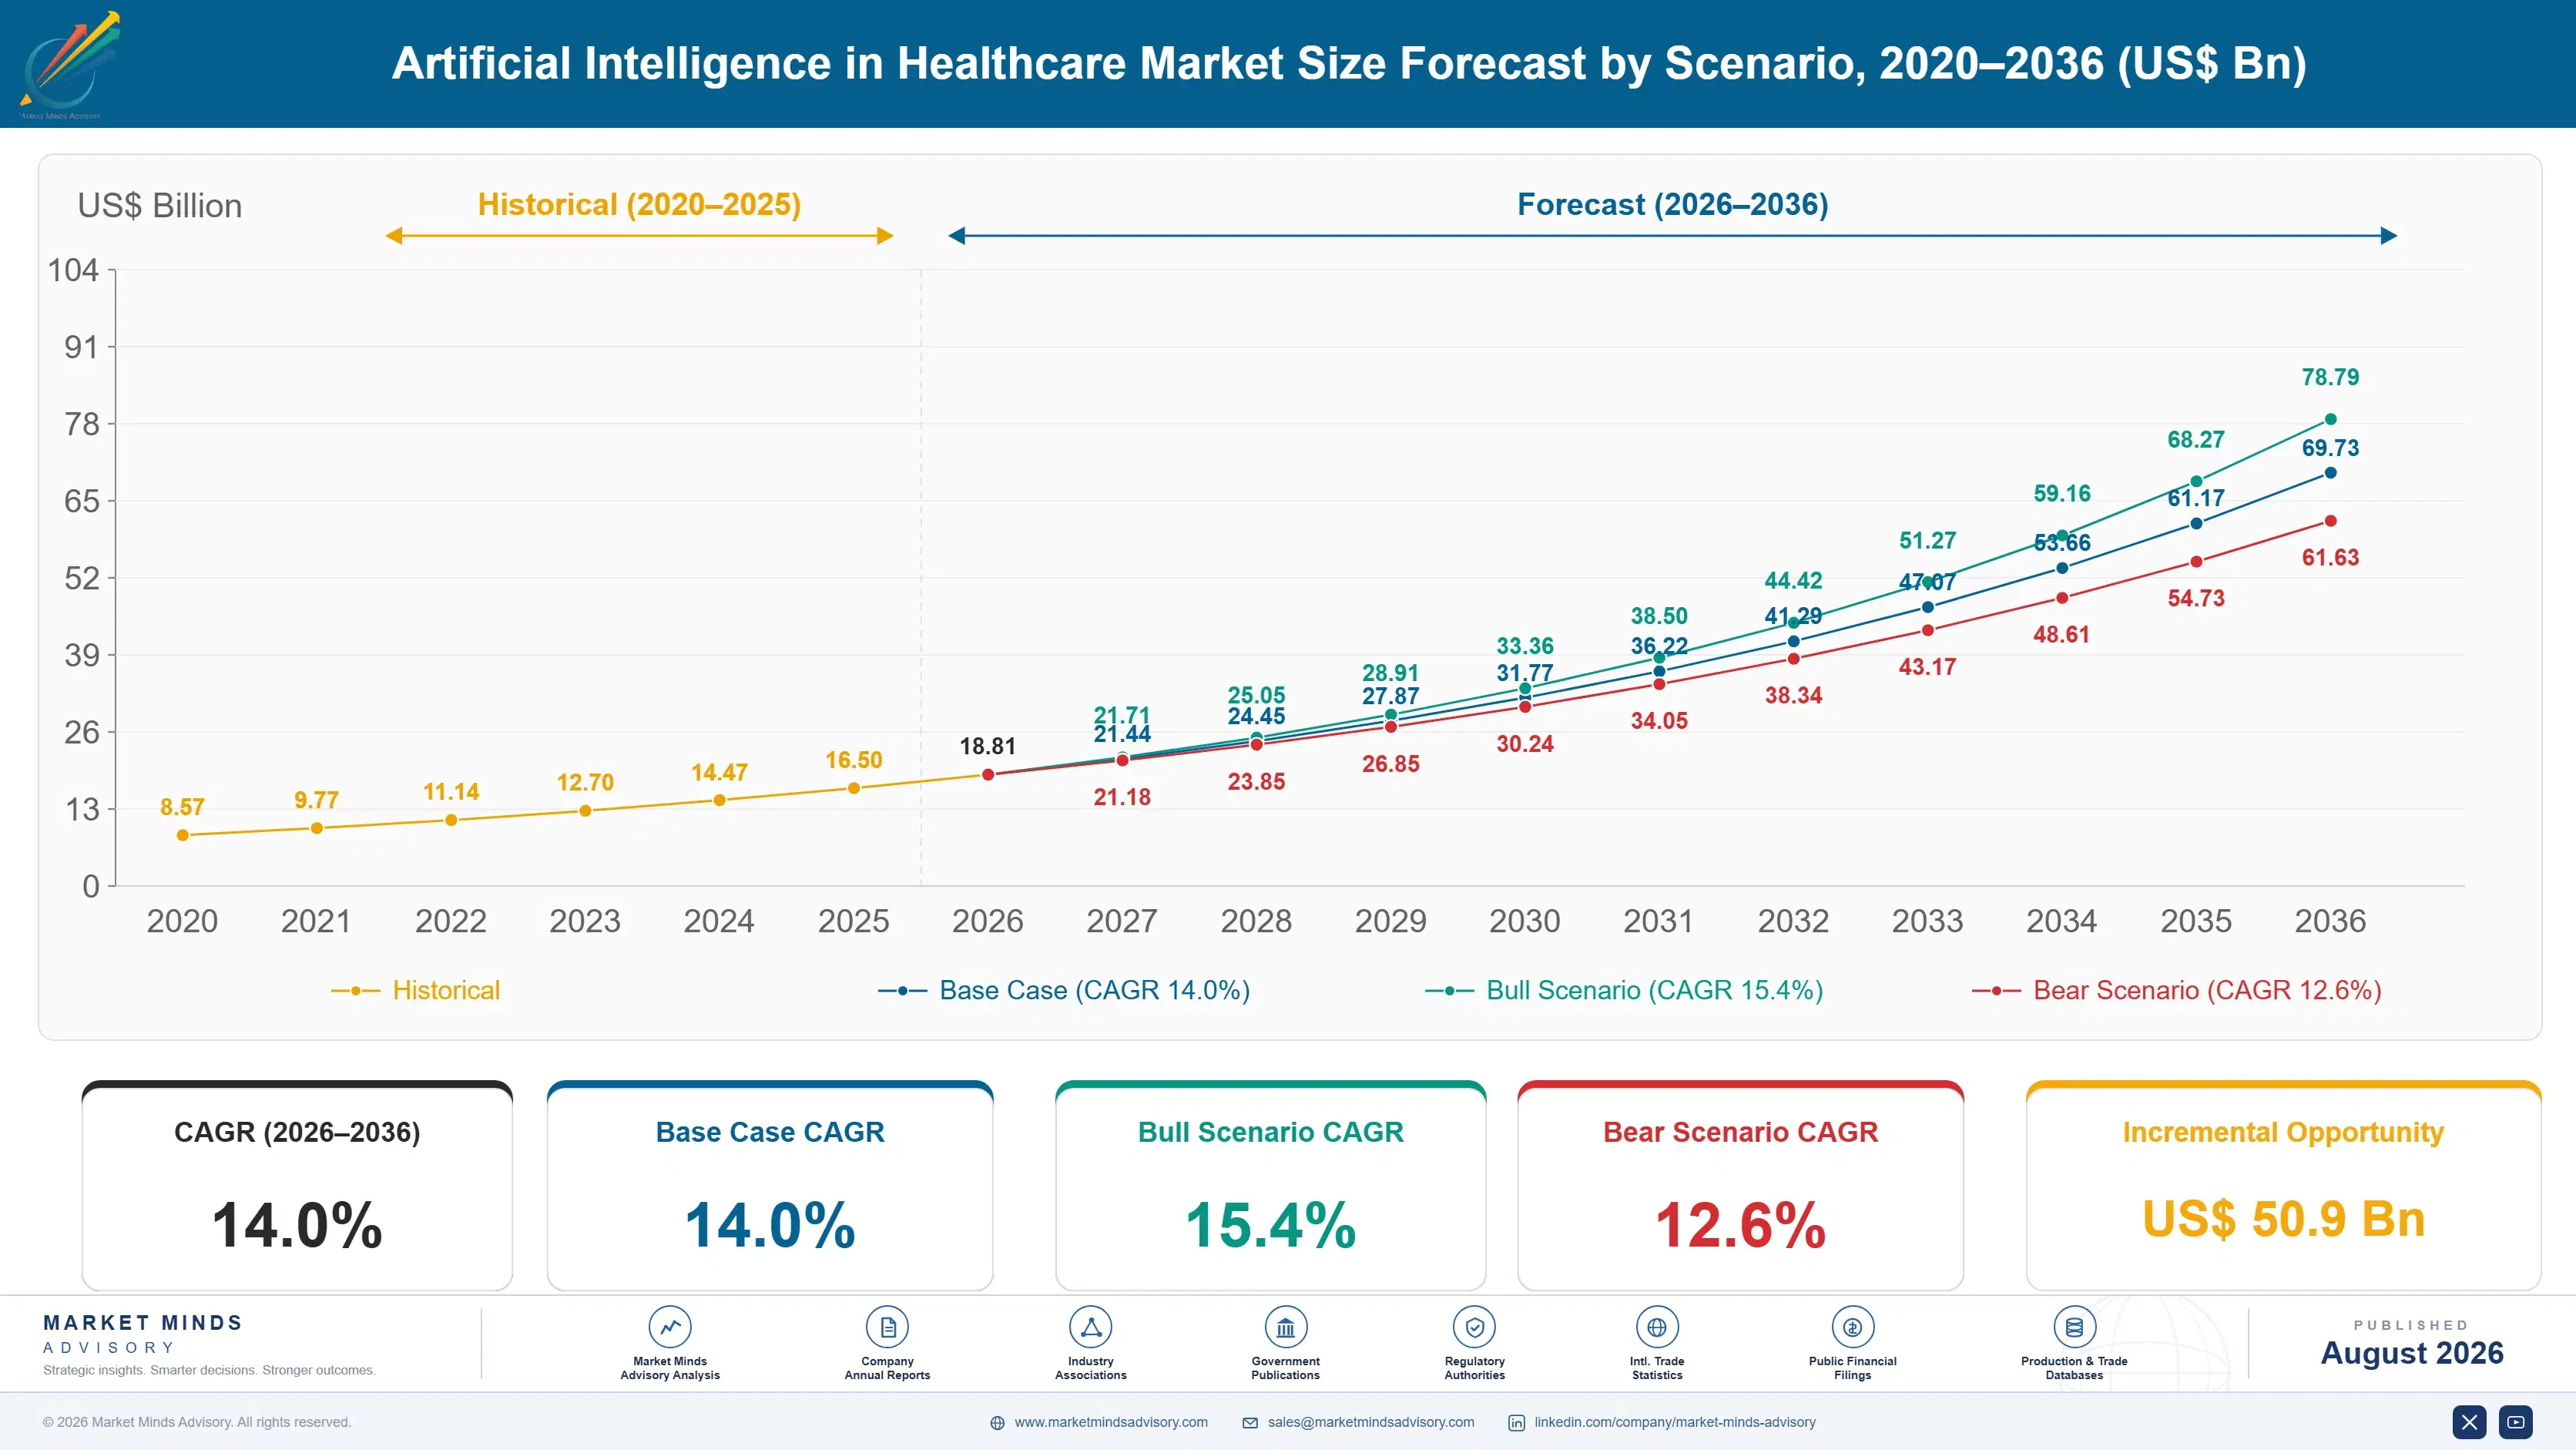
Artificial Intelligence in Healthcare Market Forecast Scenarios

artificial-intelligence-in-healthcare-market-size-forecast-scenario-1787305642749
Growth ran near 12.6% from 2020 to 2025, and it was considerably less even than the headline suggests. Imaging algorithms accumulated regulatory clearances at pace while enterprise deployment lagged badly, since a cleared product without a payment pathway competes against every other operating expense. What actually scaled was administrative automation, where the return appears directly in collected revenue.
Base case growth of 14.0% rests on three mechanisms. Ambient documentation is being adopted at genuine enterprise scale because clinician time saved is measurable and burnout is an urgent operational problem. Administrative and revenue cycle automation continues expanding on returns that finance functions can audit. And regulatory frameworks permitting model updates without new submissions reduce the maintenance burden that deterred earlier buyers. None of the three depends on a payment pathway appearing where none currently exists.
The bull case at 15.4% assumes payment pathways broaden beyond the handful of applications that currently hold them, which would move clinical AI from operating expense to reimbursed service. The bear case at 12.6% reflects the opposite: sustained absence of payment keeps clinical applications trapped at pilot scale while only administrative and documentation uses reach production.

Clinical Algorithms Without a Payment Code

The regulatory picture and the commercial picture in this market have almost nothing to do with each other. Around a thousand clinical algorithms hold authorisation, roughly 76% of them in medical imaging, and a clearance certificate is genuinely difficult to obtain. Approximately 6% of those applications have any dedicated payment attached. The rest are sold into an operating budget that also funds nursing agency cover and equipment maintenance.
TOP FIVE CONCENTRATION24%Extremely fragmented across platform vendors and clinical specialists
AUTHORISED ALGORITHM COUNT1,000Regulator-authorised clinical algorithms available across all medical specialties
REIMBURSED APPLICATION SHARE6%Authorised applications carrying a dedicated payment pathway attached
IMAGING SHARE OF CLEARANCES76%Share of authorised algorithms addressing medical imaging alone
DOCUMENTATION TIME RETURNED62 minutesDaily clinician time returned by ambient documentation tools
PILOT TO PRODUCTION RATE31%Health system pilots that reach enterprise-wide production deployment
That is why pilots outnumber deployments so heavily. A health system runs an evaluation, the algorithm performs as advertised, and then somebody has to find recurring money for it against competing claims with harder numbers. Roughly 31% of pilots reach enterprise production. The failure is commercial rather than technical, and vendors who interpret it as a performance problem tend to respond by improving models that were never the obstacle.
The applications that scaled did so by producing returns a buyer could verify without trusting anybody. Ambient documentation returns around 62 minutes of clinician time daily, which a chief medical officer can measure in a fortnight. Revenue cycle automation appears directly in collected cash. Both grow faster than diagnostic imaging AI despite carrying far less regulatory prestige and considerably simpler underlying models.
"This industry spent a decade optimising for regulatory clearance and it turns out clearance was never the constraint. Nobody in a hospital finance office has ever approved a purchase because something was cleared. They approve it because they can see the money, and for most clinical AI, nobody can."
Principal Analyst, Health System Technology and Clinical Informatics Practice ·

Market Trends

Ambient documentation scales where diagnostic algorithms stalled

Ambient capture tools that draft a clinical note from the consultation return roughly 62 minutes of clinician time a day, and any medical director can verify that inside a fortnight without trusting a vendor's evidence package. That single property explains why the segment compounds at 21.0% while imaging AI, which holds far more regulatory clearances and considerably more scientific credibility, grows at little more than half that rate. The buyer is purchasing clinician retention and appointment throughput, both of which appear in numbers a health system already tracks closely. Clinical evidence quality is not what separates them.
Market Impact: Administrative segment compounding
Distribution through the record beats distribution through procurement

An algorithm reaching clinicians inside the electronic health record they already use faces no separate purchase, no integration project and no additional login. One reaching them through a standalone procurement process faces all three plus a budget line that does not exist. Platform vendors have recognised this and built marketplaces and native capabilities accordingly. Specialist developers with genuinely better models keep losing to adequate models with better placement, and most have not yet restructured their commercial approach around that fact. Marketplace listings now matter more to a specialist than any accuracy advantage it can demonstrate.
Market Impact: Roughly 1,000 algorithms now mainta

Market Opportunities and Growth Drivers

Administrative automation returns money a finance function can audit

Revenue cycle applications that automate coding, claim scrubbing, denial management and prior authorisation produce returns visible directly in collected cash rather than in clinical outcomes requiring interpretation. That makes the purchase decision straightforward in a way clinical AI rarely is, and it explains growth of 17.6% in a category carrying almost no regulatory prestige. United States administrative complexity creates the largest pool of this work by a wide margin, which is a substantial part of why regional concentration in this market is so extreme. Buyers approve it without any clinical debate at all.
Market Impact: Only 6% carry payment pathways

Model update frameworks reduce the maintenance burden buyers feared

Regulatory frameworks permitting pre-authorised model changes without fresh submissions removed a genuine deterrent, since health systems had reasonably worried about deploying algorithms that would degrade as clinical practice shifted and could not be updated without months of regulatory work. Predetermined change control makes an algorithm a maintainable asset rather than a frozen one. Procurement teams interviewed described update pathways as a scored criterion now, where three years earlier the question had rarely been asked at all during evaluation. An algorithm frozen at authorisation degrades as practice shifts around it. Buyers had understood that risk perfectly well.
Market Impact: Concentration at only 24%

Market Restraints and Challenges

Almost nothing clinical carries a payment pathway

Roughly 6% of authorised clinical applications have any dedicated payment attached, so the remainder compete for operating budget against nursing cover, maintenance and supplies. The root cause is that payment systems reimburse procedures and encounters rather than software that improves them, and creating a code requires evidence of clinical and economic benefit that most developers cannot fund. Commercial impact is a pilot conversion rate near 31%. Participants respond by pursuing payment codes, contracting on shared savings, and targeting applications where returns appear in existing budget lines. None of those routes is quick.
Market Impact: Segment compounding at 21.0% yearly

Fragmentation leaves clinical specialists without any distribution

Concentration at 24% means hundreds of participants each hold a small position, and almost none has a route to clinicians that does not run through somebody else's software. The root cause is that healthcare workflow is owned by electronic record platforms, and an algorithm outside that workflow requires integration work a health system must fund and prioritise. Commercial impact is that adequate models with placement beat better models without it. Participants respond by pursuing platform marketplace listings, record vendor partnerships and acquisition by companies that already hold distribution. Several strong specialists have already taken the acquisition route.
Market Impact: Pilots converting at only 31%
4 additional market trends, 3 additional growth drivers, and 2 additional restraints and challenges are covered in the full report. Contact sales@marketmindsadvisory.com to access the complete intelligence.

Segment CAGR and Growth Architecture

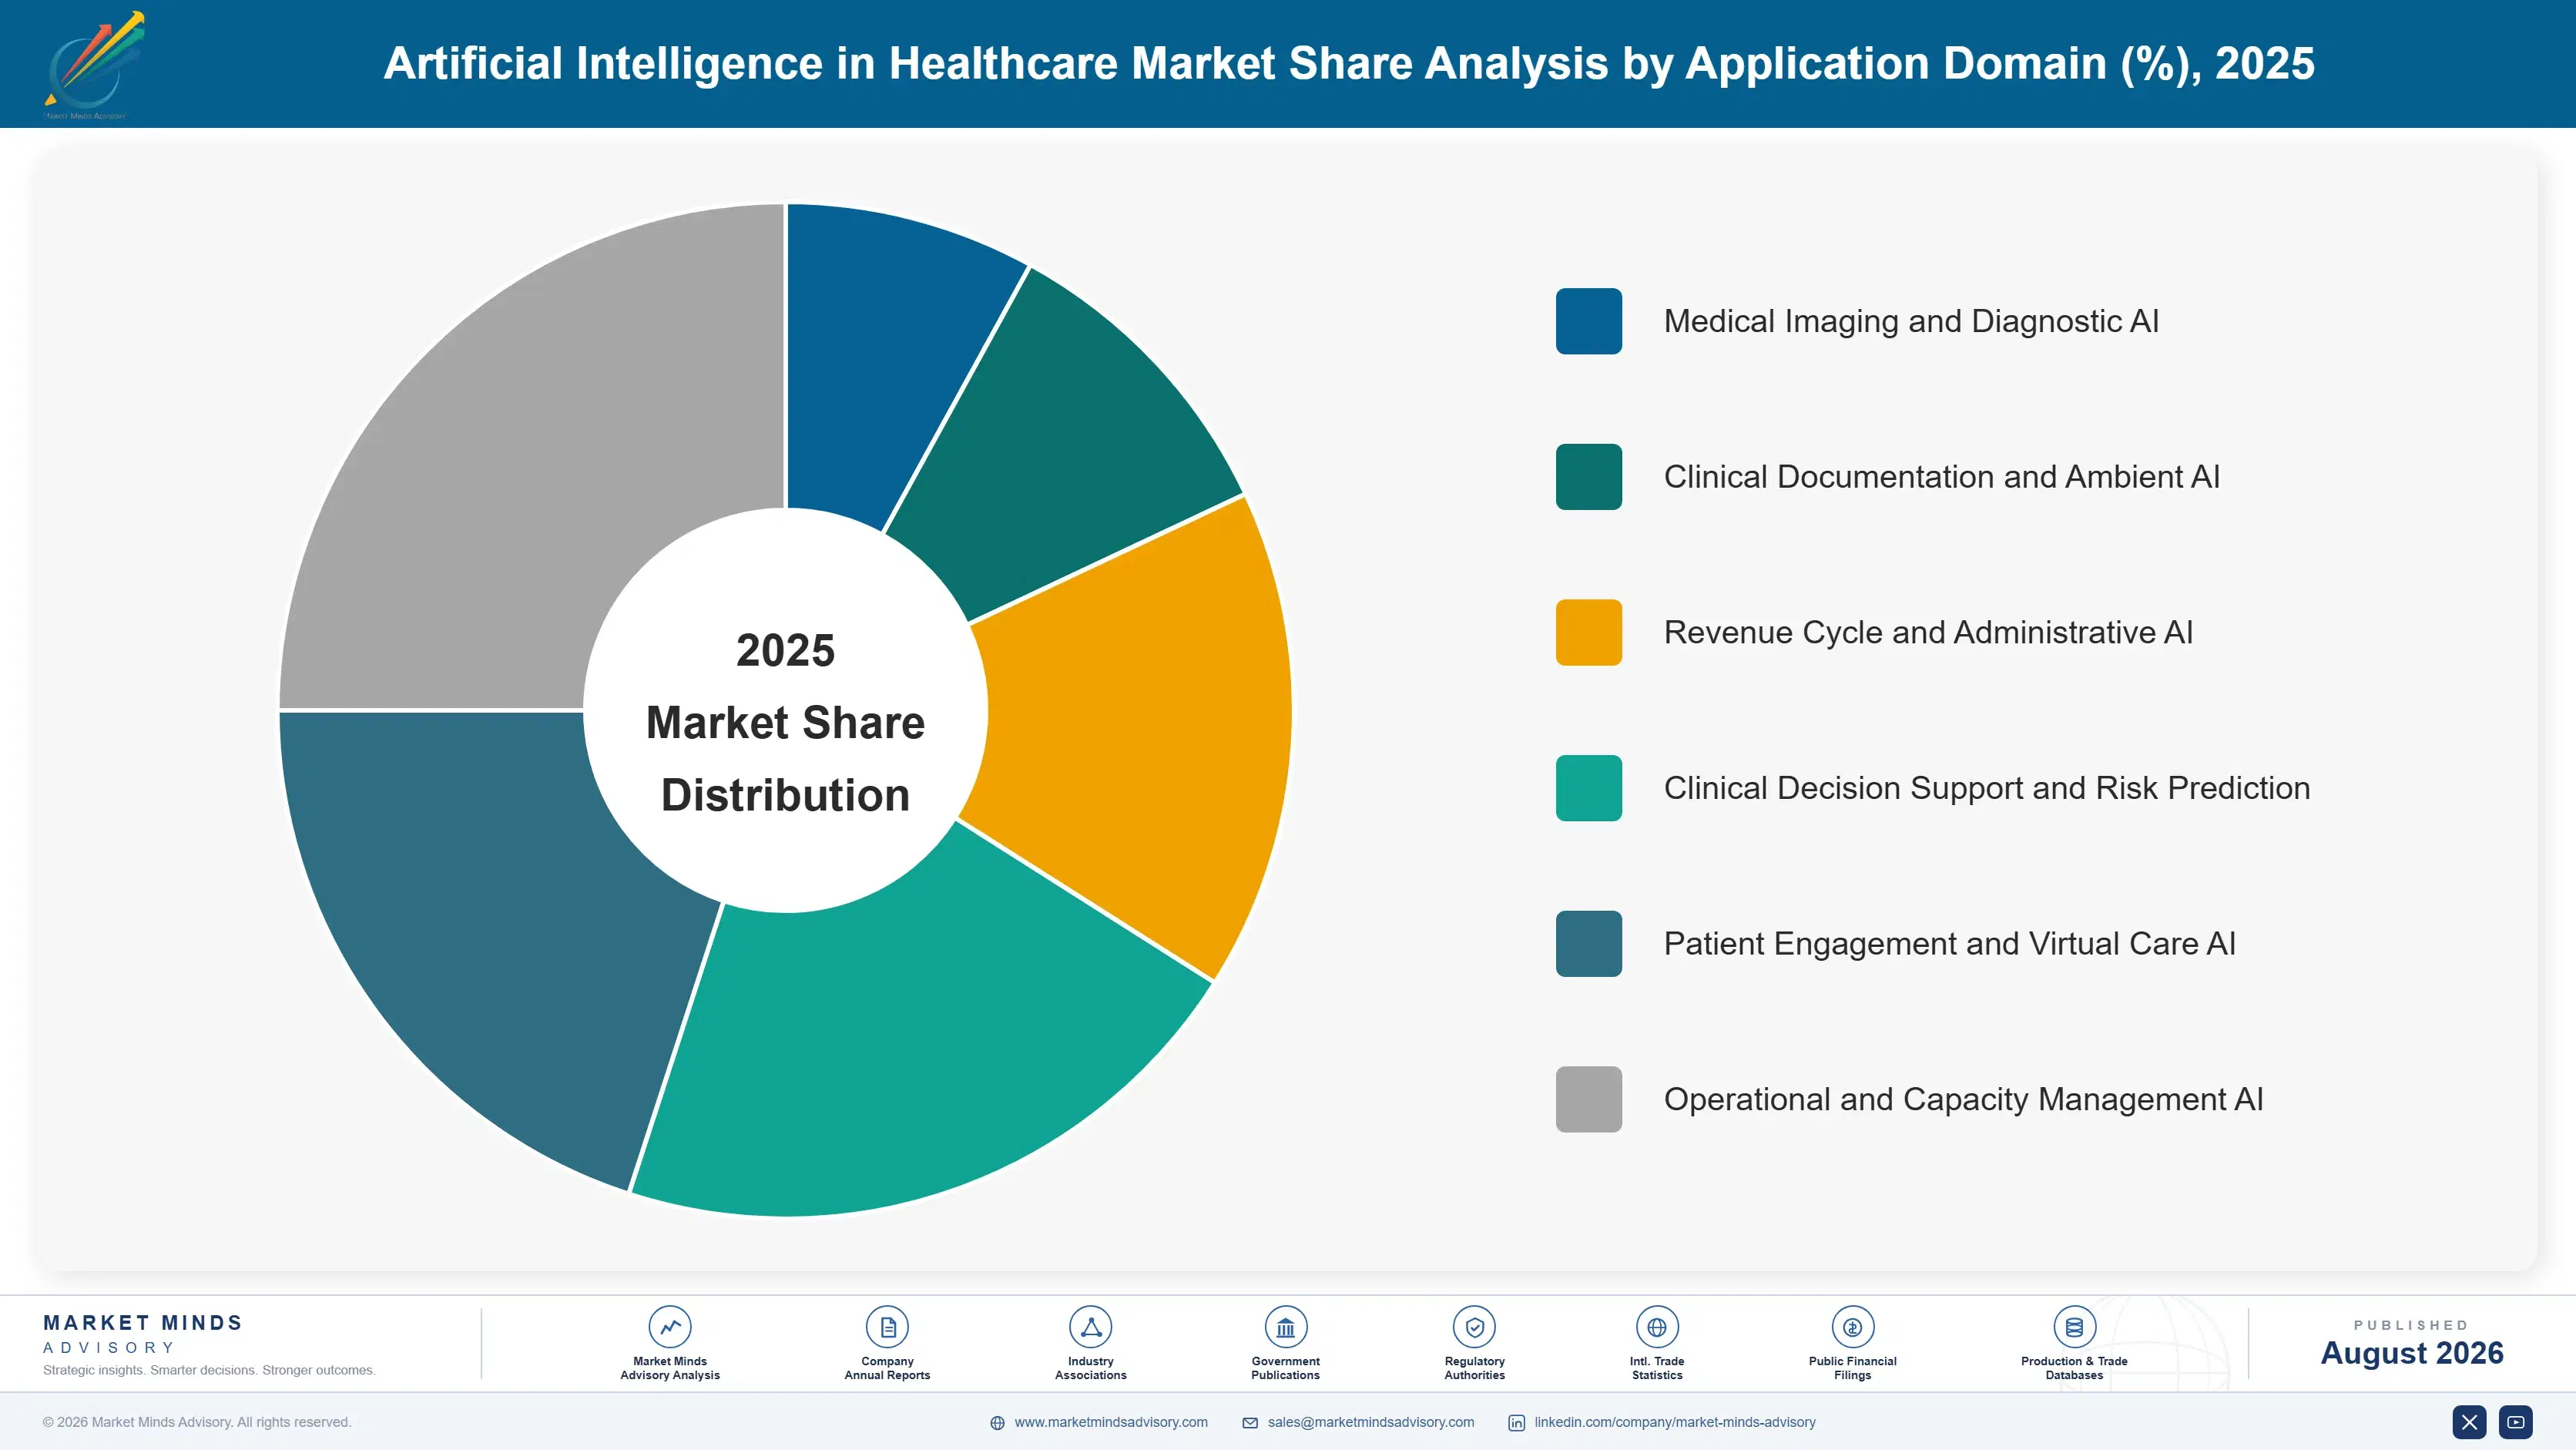
Six application domains divide this market, and the division separates them by something more useful than technology: whether the buyer can verify the return without trusting the vendor. Three domains produce numbers a health system already measures, and those three are growing at roughly twice the rate of the others. Verifiability rather than sophistication decides which applications actually scale.
artificial-intelligence-in-healthcare-market-market-share-analysis-1787305643287

Clinical Documentation and Ambient AI

Compounding at 21.0%, a full 1.50x the market rate, ambient capture drafts clinical notes from the consultation itself and returns roughly 62 minutes of clinician time each day. The purchase argument is clinician retention and appointment throughput, both of which a health system measures already and neither of which requires believing a vendor's clinical evidence. Distribution through electronic record platforms has accelerated adoption sharply, since the tool appears inside a workflow clinicians already use. Competition is intensifying between platform-native capability and specialist developers, and accuracy differences matter less than integration depth does. Contracts here prove extremely durable once live, because removing a tool clinicians rely on daily provokes resistance that no procurement saving justifies.
CAGR 21.0%

Revenue Cycle and Administrative AI

Growing at 17.6%, this domain automates coding, claim preparation, denial management and prior authorisation, producing returns that appear directly in collected cash rather than in clinical outcomes anyone must interpret. Finance functions can audit the benefit, which makes approval straightforward in a way clinical applications rarely achieve. United States administrative complexity creates by far the largest pool of this work, and that concentration explains much of the regional imbalance in this market. Regulatory prestige is minimal and commercial traction is excellent, which is close to the opposite of the diagnostic imaging position. Buyers also prefer fewer vendors covering more of the revenue cycle, which is driving consolidation among participants who each solved one part of it.
CAGR 17.6%
Full segment breakdown across 6 segments available in the complete report.

Regional Architecture and Country Demand Map

Regional distribution is the most concentrated in this report series, and it follows administrative complexity and health information technology spending rather than population, disease burden or clinical sophistication. Systems that pay per encounter generate work that automation can capture; systems that do not, generate very little.

North America

Forty-six per cent of global value, an exceptional concentration. Note: this far exceeds the 22 to 32% band because United States administrative complexity generates a volume of coding, claims and prior authorisation work that no other health system creates, and health information technology spending per provider runs several times international levels. Ambient documentation adoption is furthest advanced here, reaching enterprise scale across large health systems rather than remaining in pilot. The regulatory pathway is also the most developed, with the great majority of authorised clinical algorithms cleared here first. Payment pathways remain scarce even so. Approval authority has moved decisively toward finance and operations, and vendors still selling to clinical informatics are addressing people who recommend rather than decide.
Share: 46% | CAGR: 13.6% (2026 to 2036)

East Asia

Eighteen per cent of value, with China and Japan driving different parts of it. Note: this share falls below the 22 to 30% band because the administrative automation pool that dominates North American spending barely exists under these payment systems. China's imaging AI sector is large and domestically supplied, supported by hospital volumes that generate training data at a scale nobody else matches and by national policy encouraging deployment. Japan applies AI mainly to workforce shortage in radiology and pathology reading. South Korea has produced several imaging developers with international regulatory clearances and export positions. Regional pricing sits well below North American levels across every application domain covered. Payment pathways are absent throughout.
Share: 18% | CAGR: 15.2% (2026 to 2036)
Regional intelligence for 5 additional markets available in the complete report: Western Europe, South Asia and Pacific, Latin America, Middle East and Africa, Eastern Europe. Contact sales@marketmindsadvisory.com.
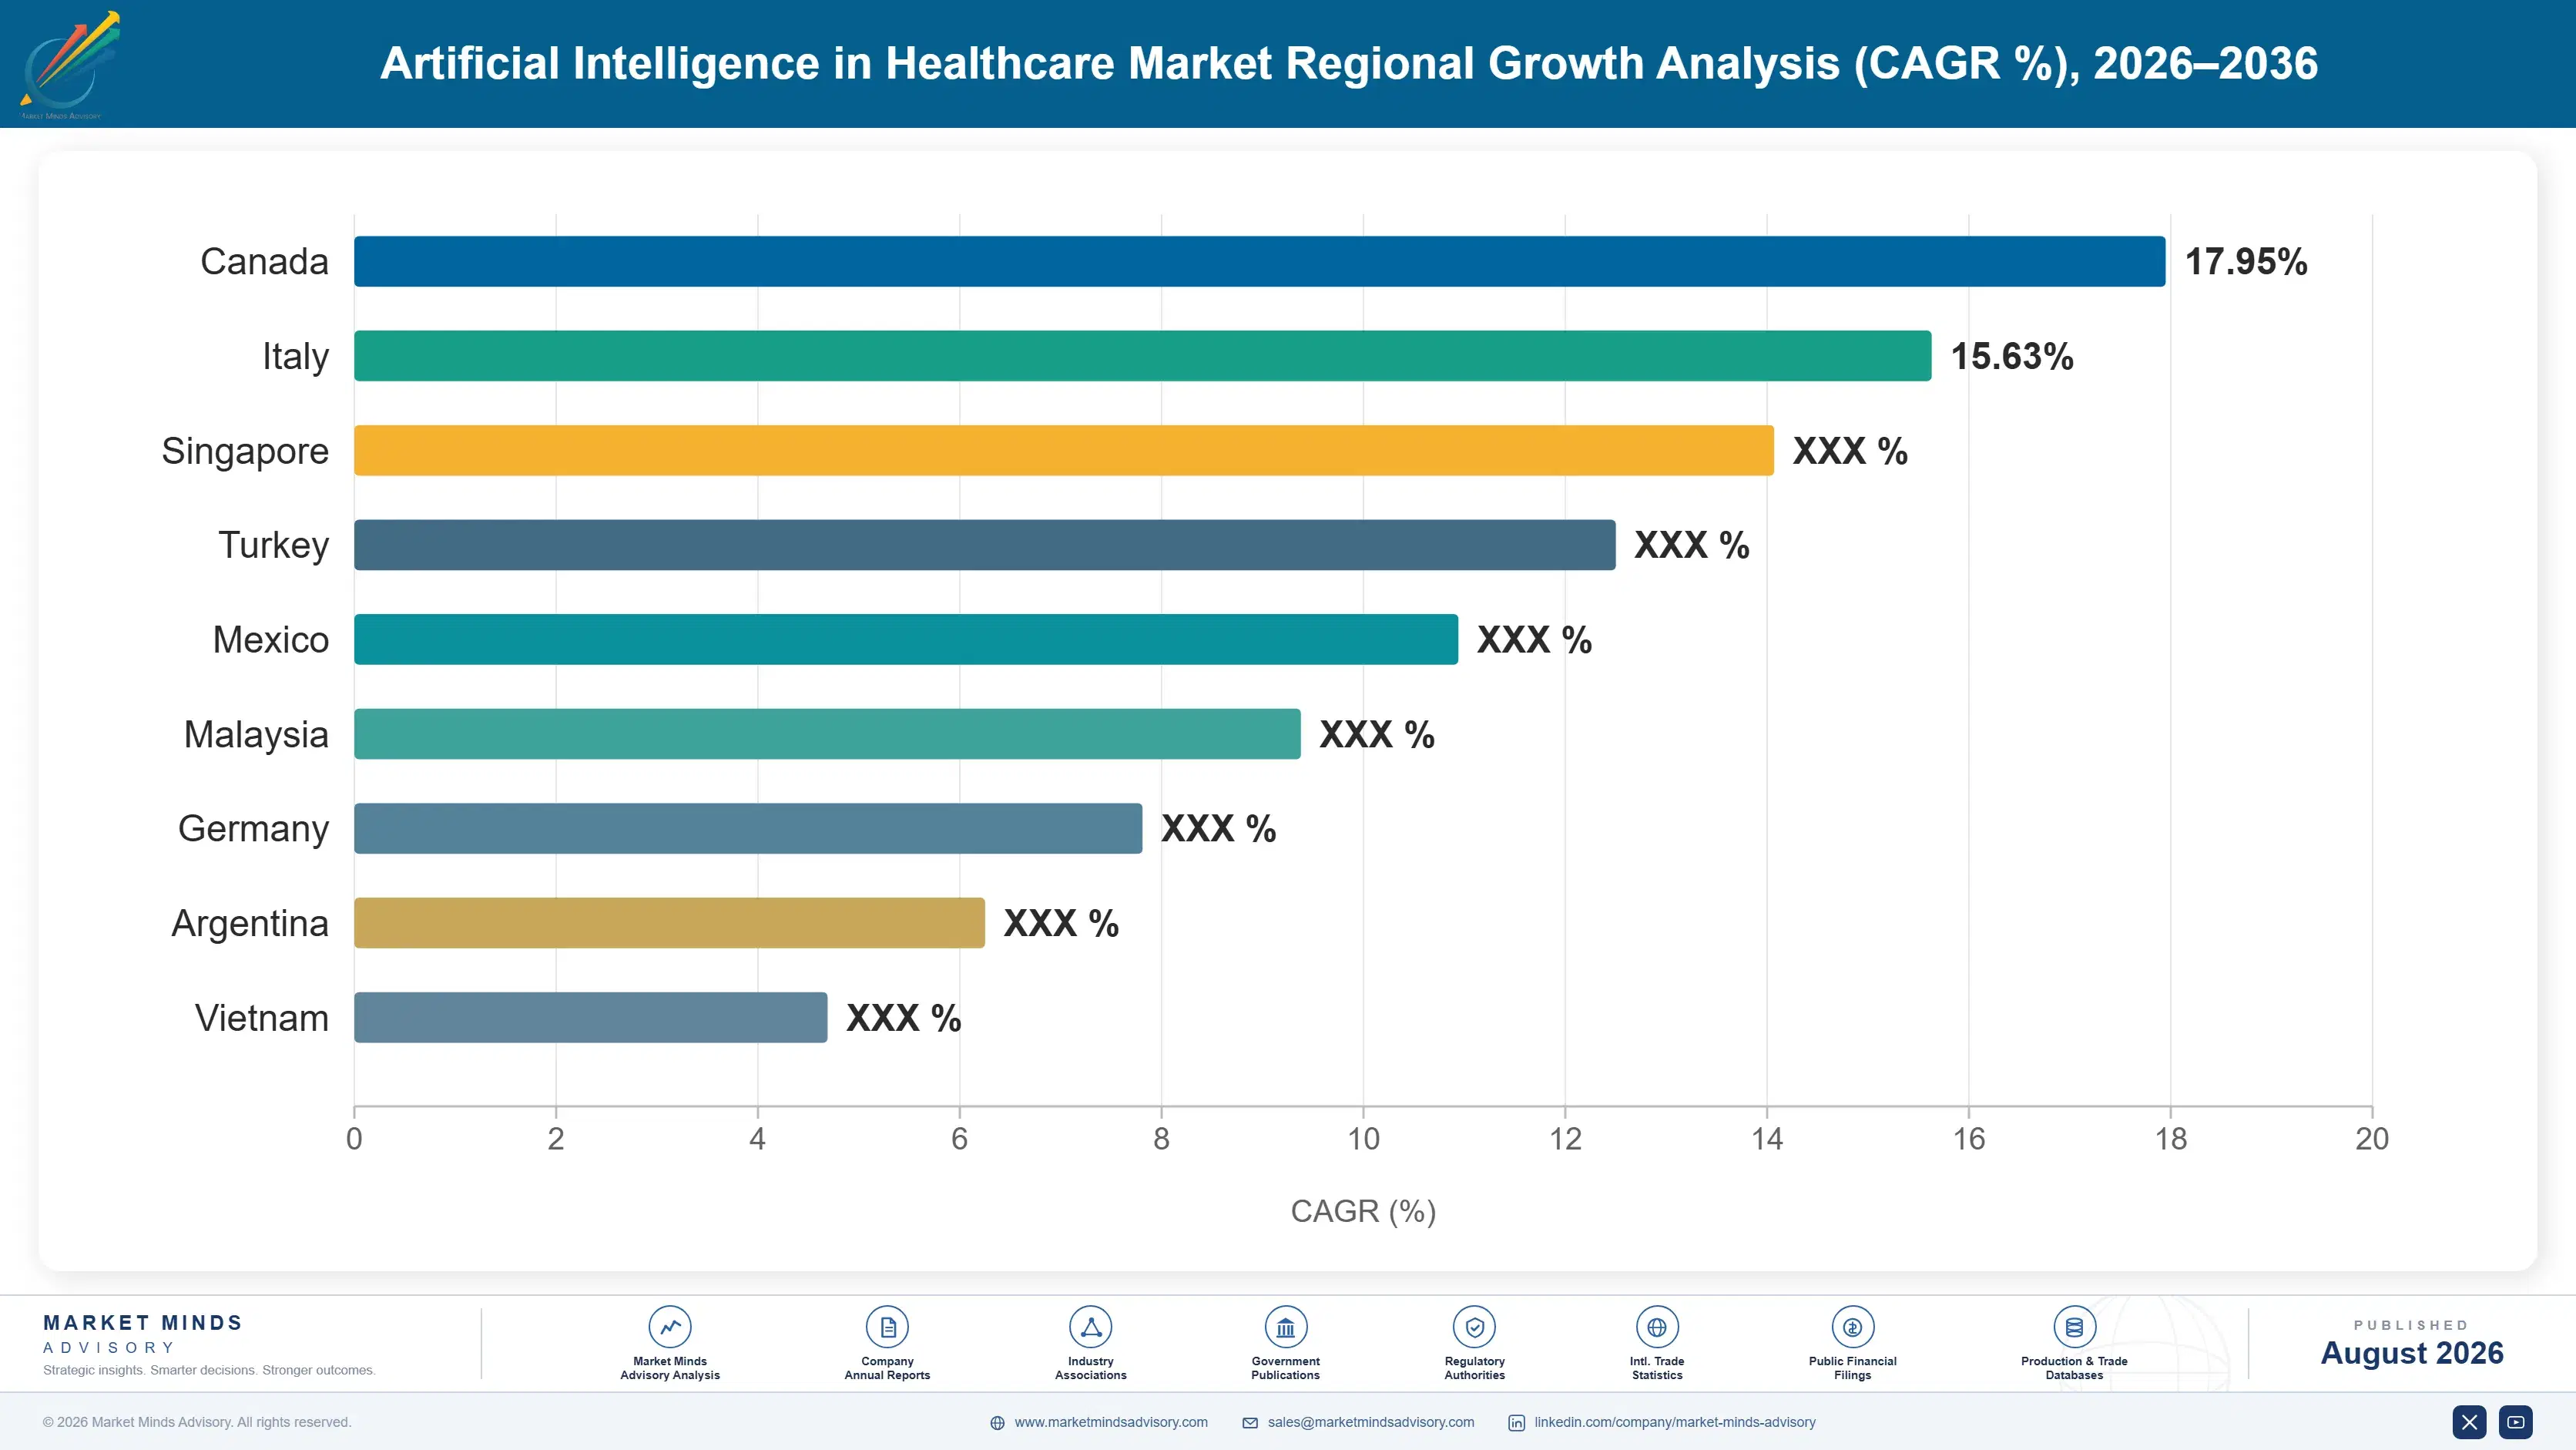
artificial-intelligence-in-healthcare-market-country-cagr-analysis-1787305643804

Where Healthcare AI Value Actually Converts

Model performance stopped being the constraint several years ago. What decides outcomes now is whether the buyer can verify the return without trusting anybody, whether the software reaches clinicians inside a workflow they already use, and whether any budget line exists to pay for it at all. All three of those are commercial questions rather than technical ones.

Sell returns the buyer can measure themselves

Ambient documentation reached enterprise scale because a medical director can measure 62 minutes of daily clinician time returned inside a fortnight, without reading a validation study. Diagnostic algorithms with far stronger evidence stall because the benefit requires interpretation and trust. Applications whose returns appear in metrics a health system already tracks convert from pilot at roughly three times the rate of those requiring a vendor's evidence package. That is a positioning decision rather than a product one, and most developers make it far too late. The evidence package is not what closes the deal.
Market Impact: Conversion roughly 3x higher on mea

Reach clinicians through software already installed

An algorithm inside the electronic record faces no separate procurement, no integration project and no additional credential. One outside it faces all three, and pilot conversion sits near 31% largely for that reason. Platform marketplace listings, record vendor partnerships and native integration are worth more than any accuracy advantage a specialist can demonstrate. Developers who treat distribution as a channel decision made after the product is built consistently lose to adequate models with better placement, and the pattern has held for several years now. Realised pricing falls under marketplace distribution, and expected revenue per pilot rises anyway.
Market Impact: Pilot conversion near 31% without a

Fund the payment pathway rather than waiting for one

Roughly 6% of authorised clinical applications carry dedicated payment, and the remainder compete against nursing cover for operating budget. Establishing a code requires clinical and economic evidence at a scale most developers never budget for, yet the participants that funded it moved from discretionary purchase to reimbursed service and changed their commercial position entirely. The work takes years and cannot be shortened. It is also the only route that removes the budget objection permanently rather than negotiating around it each time. Health system partners will share evidence cost where they share the benefit.
Market Impact: Only 6% currently hold any dedicate

Target workforce shortage rather than productivity gain

In markets with an absolute shortage of radiologists or pathologists, an algorithm addresses work that otherwise does not get done, which is a fundamentally stronger argument than making existing specialists faster. India compounds at 17.4% on exactly this basis, and the same logic applies across much of Southeast Asia, Eastern Europe and Africa. Developed market commercial effort competes against sophisticated buyers with heavy evaluation processes; shortage markets buy on capability. Pricing is lower and conversion is considerably faster. Evaluation is lighter, decisions are faster, and no economic modelling is required at all.
Market Impact: India compounding at 17.4% every si

Who Controls the Margin Pool

The top five hold 24% of the market measured on revenue from artificial intelligence software and services delivered to healthcare providers and payers, the basis used throughout this section. That is the lowest concentration in this report series and it reflects a market where hundreds of participants hold small clinical niches while a handful of platform vendors hold distribution. The gap between the two groups is widening steadily rather than narrowing.
Competitive activity runs along three lines. Platform vendors are building or acquiring native capability so that AI reaches clinicians inside software already installed. Specialist developers are pursuing marketplace listings and record vendor partnerships, having discovered that standalone procurement rarely converts. And administrative automation participants are consolidating, since revenue cycle buyers prefer fewer vendors handling more of the workflow.

Pressure is emerging from a direction specialists did not plan for. Distribution rather than model performance is deciding outcomes, and platform vendors control distribution. Rankings will shift toward participants who hold placement inside clinical workflow, and the most likely route for a strong specialist is acquisition rather than independent scaling. Several have already taken it, and more will.
artificial-intelligence-in-healthcare-market-company-positioning-matrix-1787305644328

Competitive Moat and Risk Dimensions

MICROSOFT

Moat: Ambient capture inside workflow

Ambient documentation reaches clinicians through electronic record integration rather than through separate procurement, which removes the budget line, the integration project and the additional login that defeat most competing applications. Cloud infrastructure underneath much of the sector adds a second layer of position, since a great many participants build on capacity the company supplies to them directly.
MICROSOFT

Risk: Depends on record partnerships

The distribution advantage runs through partnerships with electronic record vendors who are themselves building competing native capability, and those partners control the workflow placement that makes the product work. A partner deciding to prioritise its own capability could narrow that access considerably, and the company has limited leverage over a decision made inside somebody else's product roadmap.
EPIC SYSTEMS

Moat: Owns the clinical workflow

Artificial intelligence delivered inside the record clinicians already spend their day within faces none of the obstacles that defeat external applications, and no competitor can replicate that placement at any price. The marketplace position also lets the company decide which third-party capabilities reach its installed base, which is a form of distribution control that no specialist developer can negotiate around.
EPIC SYSTEMS

Risk: Breadth against focused specialists

Building capability across imaging, documentation, risk prediction and administration means competing on each front with participants doing only that one thing, frequently with better models and faster iteration. Platform development cadence is inherently slower, and clinicians who use a superior specialist tool notice the difference. Distribution advantage covers a considerable capability gap, but it does not cover an unlimited one.

Players Tracked

Prominent Players

Microsoft
Epic Systems
Siemens Healthineers
Google
GE HealthCare

Other Key Players

Oracle Health
Philips
IBM
Amazon Web Services
NVIDIA
Aidoc
Viz.ai
Abridge
Tempus AI
PathAI
Cleerly
HeartFlow
Optum
Waystar
Qventus

Recent Developments

SEPTEMBER 2020

First dedicated Medicare payment granted to a clinical algorithm

United States authorities granted a new technology add-on payment to software analysing imaging for large vessel occlusion stroke, the first time a clinical artificial intelligence application received dedicated Medicare payment. The decision established that a payment pathway was possible, though very few applications have since obtained one.
Signal: A payment pathway proved achievable for cl
AUGUST 2024

European artificial intelligence regulation enters into force

The European Union artificial intelligence regulation entered into force, classifying medical applications as high risk and imposing conformity assessment, transparency and human oversight obligations that phase in over subsequent years. The regulation is a legislative instrument rather than any commercial arrangement, and it applies alongside existing medical device requirements.
Signal: European compliance cost now sits on top o
DECEMBER 2024

Regulators finalise guidance on pre-authorised model updates

United States regulators published final guidance permitting manufacturers to specify predetermined change control plans, allowing authorised algorithms to be updated within an agreed scope without fresh submissions. The guidance addressed a genuine deployment deterrent, since health systems had worried about fielding models that would degrade and could not be maintained.
Signal: Algorithms have become maintainable assets

What Actually Costs Money Here

Compute and clinical talent dominate this cost base, and neither behaves like conventional software cost. Model training and inference compute absorbs roughly 27% of cost of revenue and operating expense combined, purchased from a very small number of cloud and accelerator suppliers. Clinical and regulatory staff who can design validation studies and prepare submissions carry around 21%, and that workforce is genuinely narrow.
Accelerator availability and pricing moved sharply against buyers through 2023 and 2024 as demand across every industry competed for the same supply, and healthcare participants are small customers of very large suppliers whose allocation follows volume. Company reporting across health technology documented compute cost growth outpacing revenue during that interval. Clinical validation study costs also rose as evidence expectations tightened, particularly for applications pursuing payment pathways.

Exposure varies most by application domain and by deployment model. Imaging participants carry heavy inference compute per study alongside regulatory validation costs, and both scale with volume rather than amortising across it. Administrative automation participants run far lighter models against structured data and carry almost no regulatory burden. Developers pursuing payment codes carry evidence generation costs measured in years, which small participants frequently cannot fund to completion.
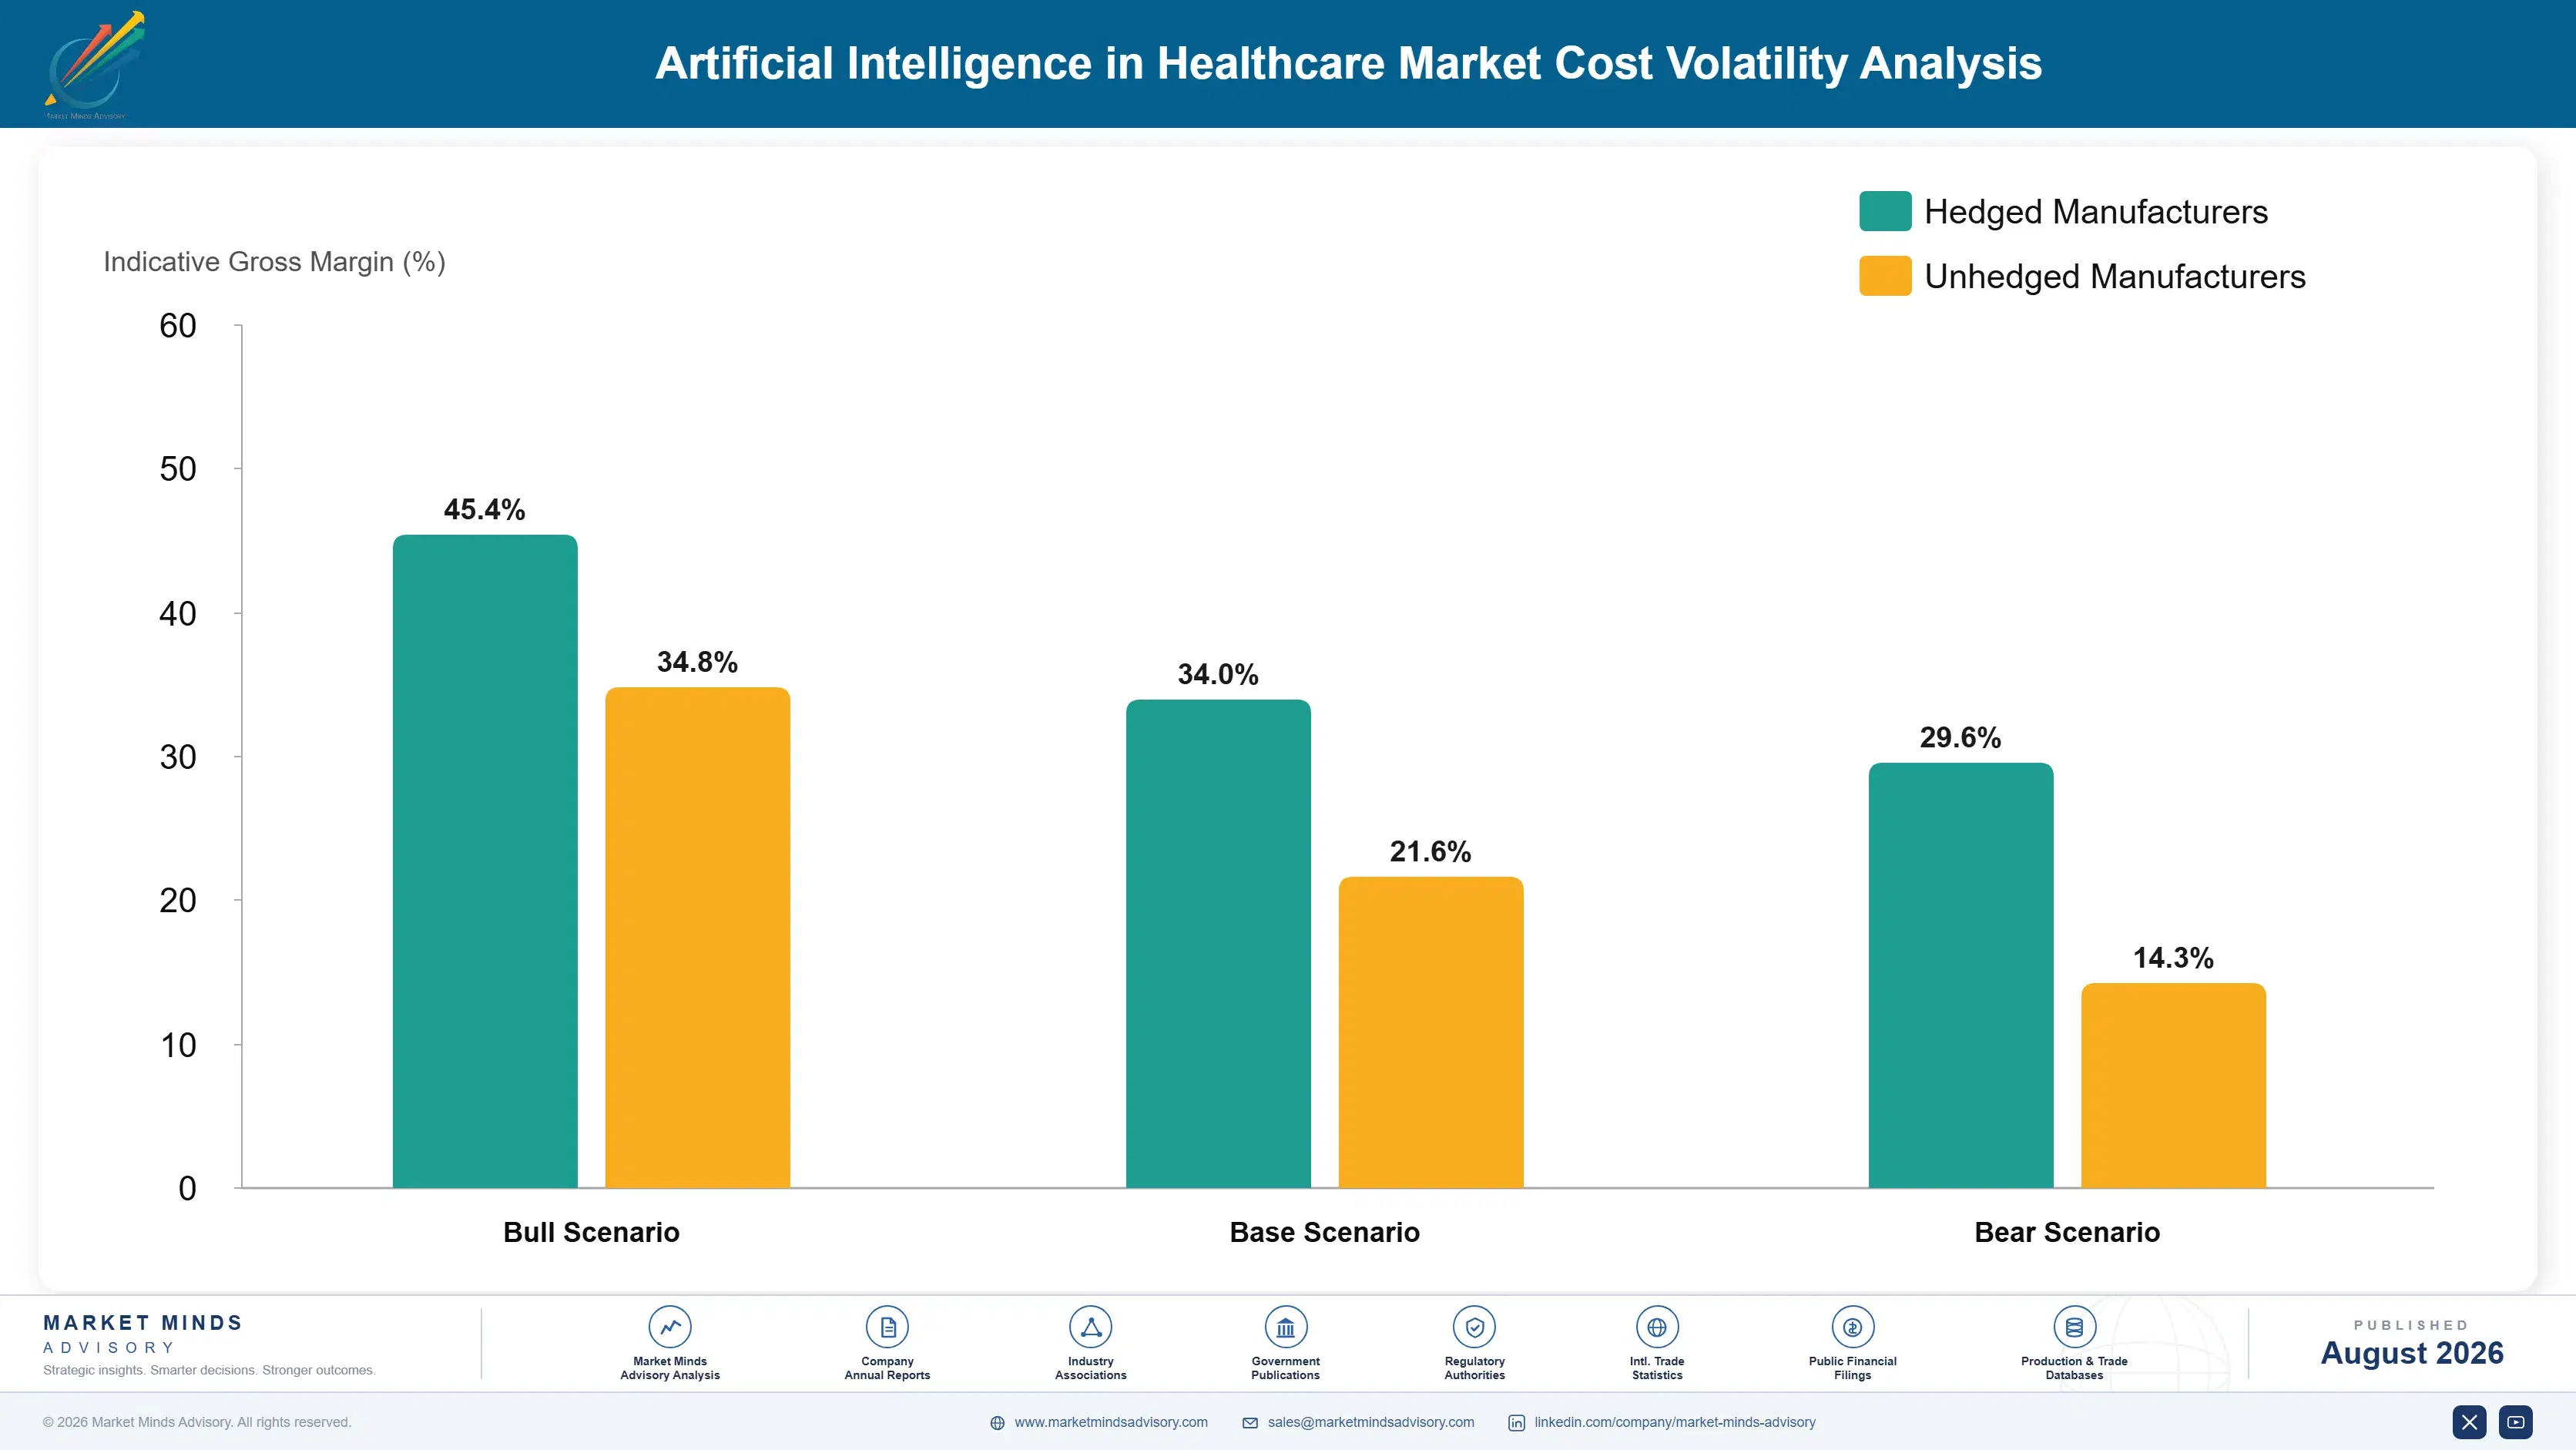
artificial-intelligence-in-healthcare-market-cost-volatility-analysis-1787305644523

Model distillation for inference cost reduction

Smaller models distilled from larger ones cut inference compute substantially while retaining performance adequate for most clinical tasks, which matters because inference scales directly with study volume rather than amortising. Regulatory implications require care, since a distilled model may require its own validation depending on how the authorisation was originally structured. Most participants underestimate that regulatory question.

Evidence generation through health system partnership

Payment pathway evidence costs years and money that most developers cannot fund alone, and health systems already collect much of the necessary data. Partnership arrangements share the cost against shared benefit if a code results, though they slow decision making and give the partner influence over study design that developers sometimes regret later. Decision cycles slow considerably in exchange.

Committed compute agreements against allocation risk

Healthcare volumes are small beside other artificial intelligence demand, so allocation during constraint follows larger customers every time. Multi-year committed capacity secures supply at the cost of inventory risk and architecture lock-in, and choosing the commitment horizon against accelerator generation cycles is where the real judgement lies. Getting that horizon wrong is expensive either way.

Portfolio Architecture for Margin Defence

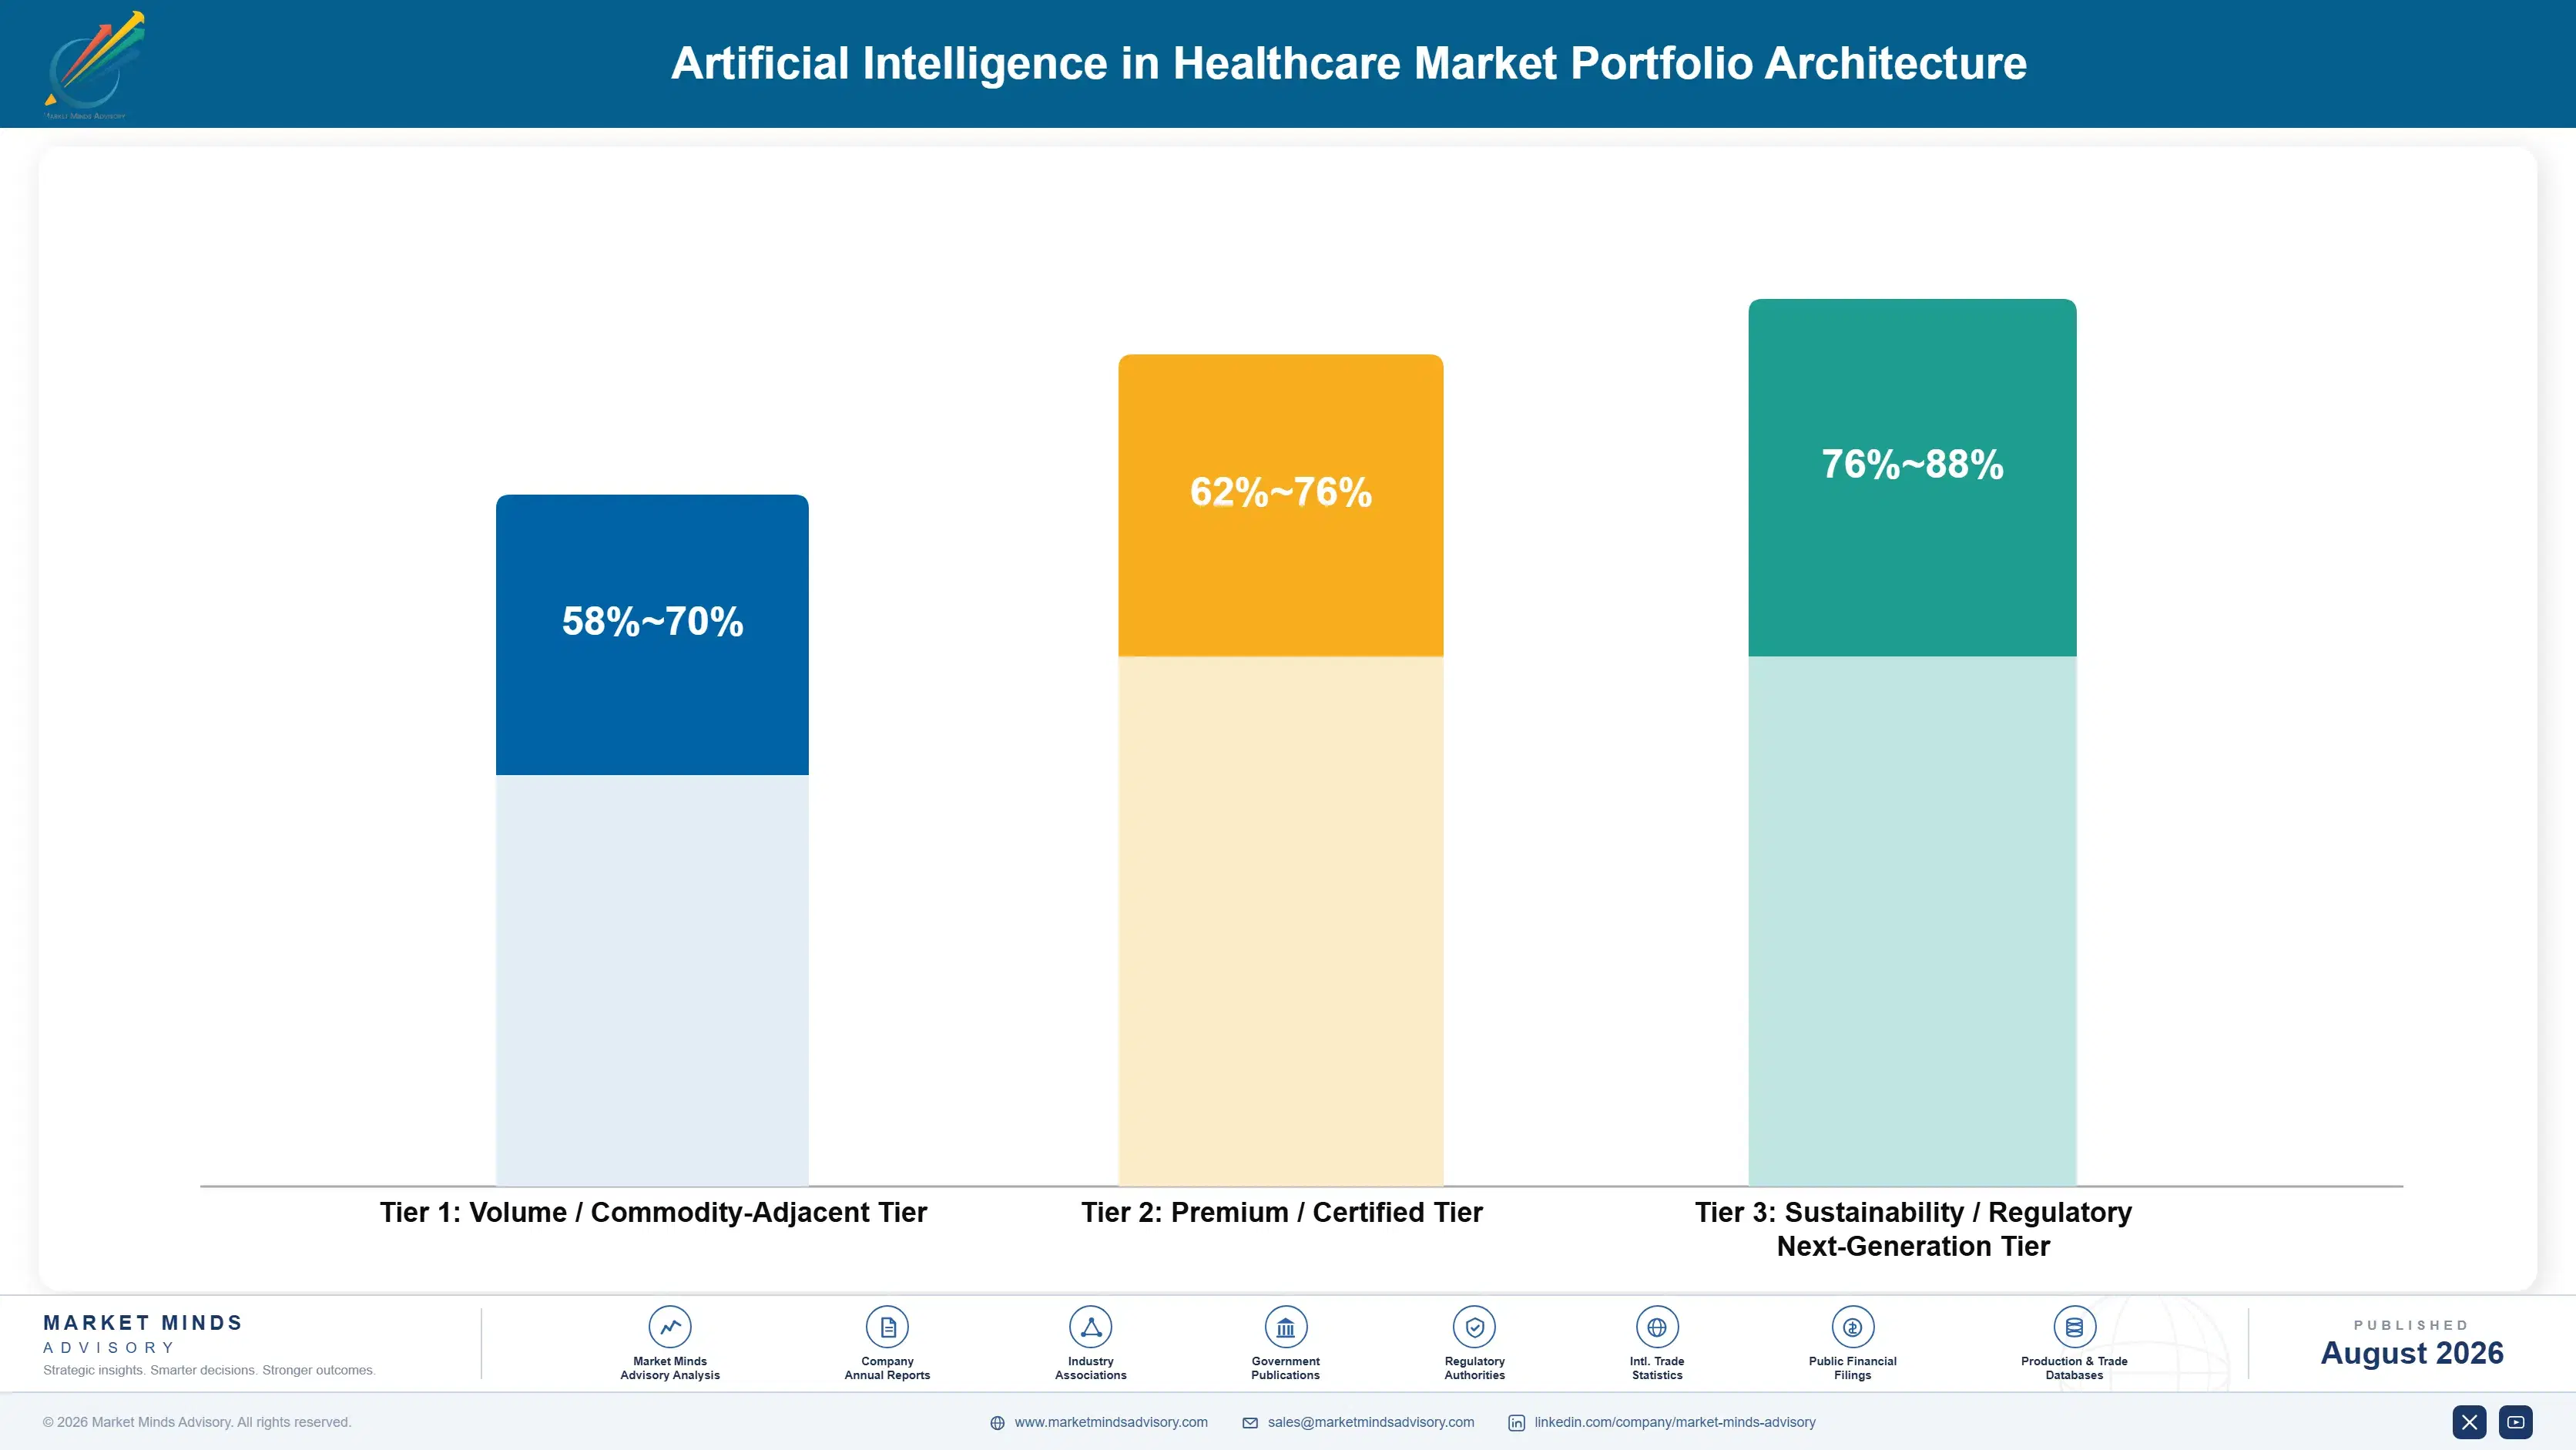
Margin architecture separates by whether the application carries regulatory and evidence obligations. Administrative automation runs light models against structured data with no clearance requirement, and gross margin clears well above eighty per cent once deployed. Regulated diagnostic applications carry validation, submission, post-market surveillance and inference compute that scales with study volume, holding margin twenty points lower despite commanding higher prices per use.
The tension is between prestige and traction. Diagnostic imaging carries the regulatory credibility, the clinical publications and the scientific standing, and it converts from pilot at the lowest rate in this market. Administrative and documentation applications carry almost no scientific prestige and scale readily because the buyer can verify the benefit. Several participants have spent heavily on the first while competitors built businesses on the second.

High-value pools concentrate where the buyer sees money without interpretation. Revenue cycle automation, ambient documentation and operational capacity management all sit there. Everything requiring a health system to accept a clinical benefit argument and then find recurring budget for it competes against every other operating expense, and it usually loses that competition regardless of how good the underlying model actually is.

Volume / Commodity-Adjacent Tier

Patient engagement, virtual triage and general operational tools sold into competitive procurement where capability is comparable across many participants and differentiation rests mainly on integration and price. Switching costs here are genuinely low.
Gross Margin: 58-70%

Premium / Certified Tier

Regulated diagnostic and clinical decision support applications carrying authorisation, validation evidence and post-market obligations, priced per study or per encounter and defended by regulatory position rather than by model architecture.
Gross Margin: 62-76%

Sustainability / Regulatory / Next-Generation Tier

Ambient documentation and revenue cycle automation delivered inside existing clinical workflow, defended by distribution placement and by returns the buyer measures directly rather than by any clearance or evidence position.
Gross Margin: 76-88%
artificial-intelligence-in-healthcare-market-portfolio-architecture-1787305645022

Who Approves and What Sticks

Revenue is subscription and per-use, which should make this an attractive annuity business, and for a minority of participants it is. The problem sits earlier: roughly 31% of pilots reach enterprise production, so most commercial effort produces evaluation activity rather than contracted revenue. Participants that convert reliably do so because the buyer could see the return without a vendor's help, not because the pilot demonstrated superior performance against a comparator.
Stickiness varies enormously by application. Ambient documentation embeds into daily clinical practice within weeks and removing it provokes genuine clinician resistance, which makes those contracts extremely durable. Revenue cycle automation embeds into finance workflow similarly. Diagnostic imaging algorithms sit at the other extreme: radiologists use them when convenient, and a system removed after a pilot is rarely missed by anybody who used it.

The approving function has moved and many participants have not followed. Early clinical AI was evaluated by clinical informatics and radiology leadership on performance grounds. Approval now sits with finance and operations weighing recurring cost against measurable benefit, and technical evaluation happens only after that hurdle is cleared. Commercial organisations still selling to clinical stakeholders are selling to people who can recommend but no longer decide.
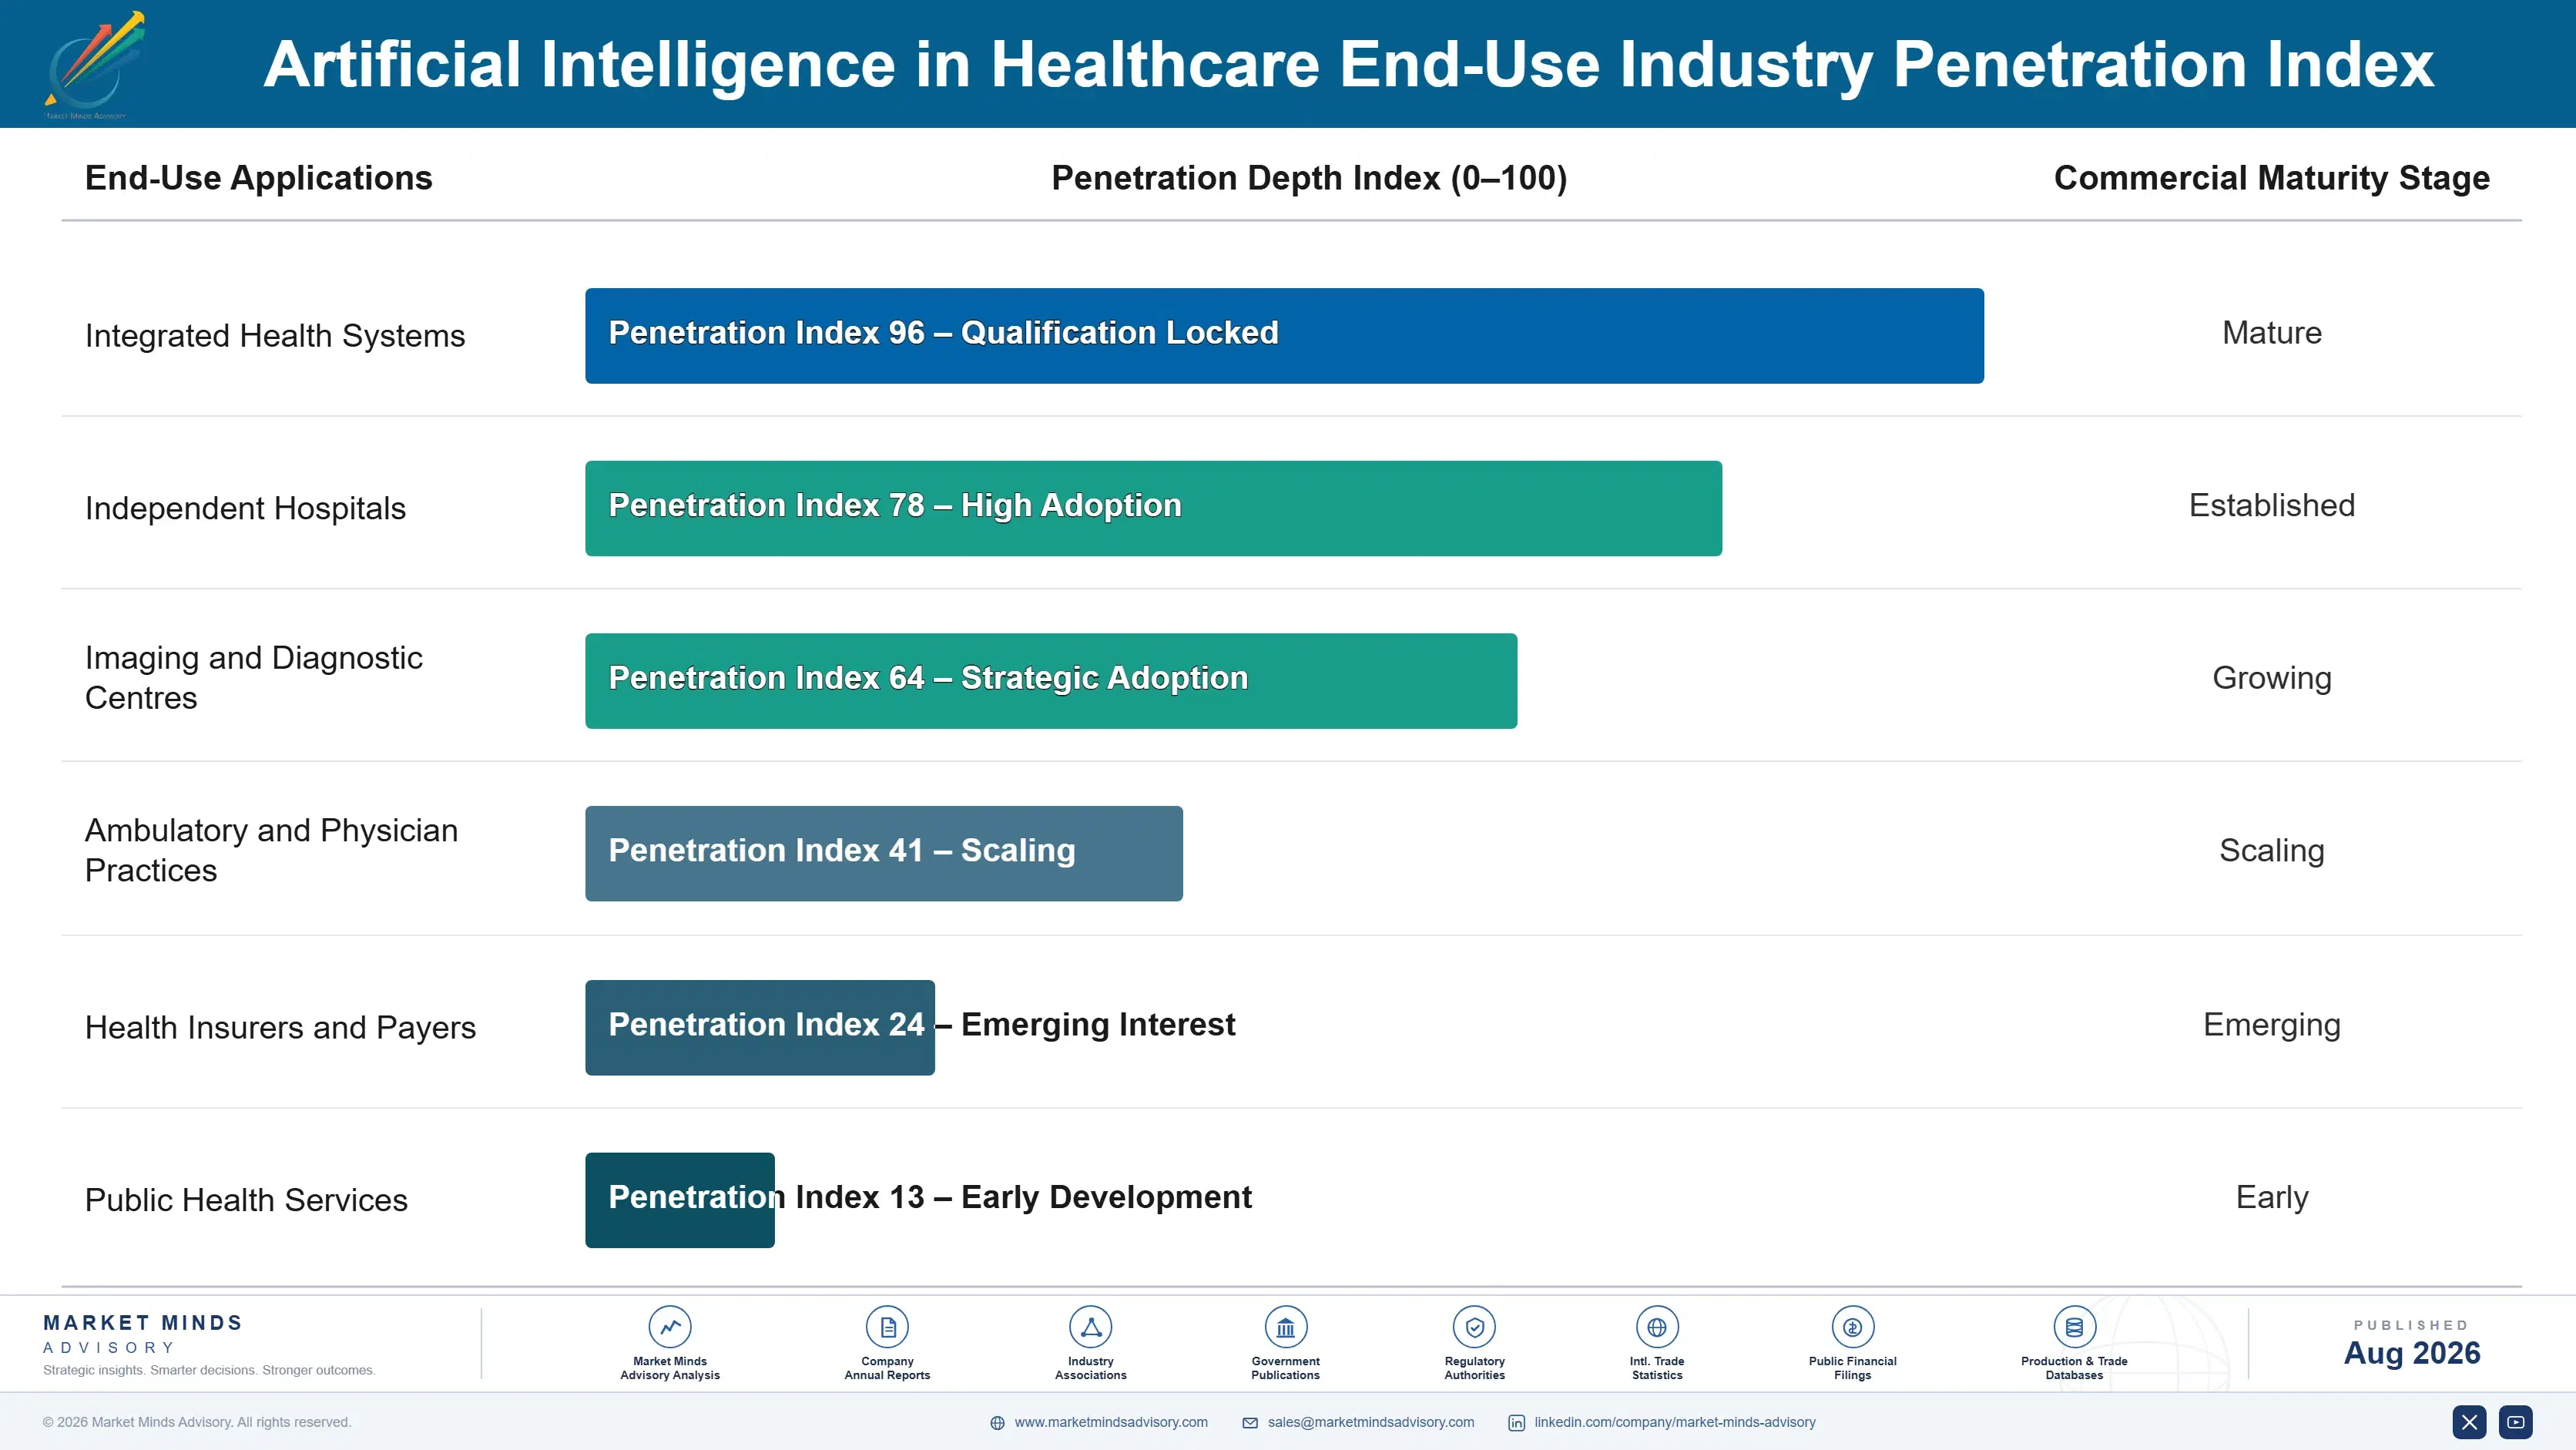
artificial-intelligence-in-healthcare-market-end-use-penetration-index-1787305645515

Where Value Actually Sits

These are among the four positions where our research anticipates prominent divergence between winners and laggards over the coming forecast period. Each is grounded in the demand model, the regulatory perimeter, and the announced capacity pipeline.
01 / VERIFIABLE RETURN SELLING

Sell what the buyer can measure without you

Ambient documentation scaled to enterprise deployment because a medical director can verify 62 minutes of daily clinician time returned within a fortnight and without reading any validation study at all. Diagnostic algorithms carrying far stronger scientific evidence stall instead, because the benefit requires interpretation and a considerable degree of trust in the vendor presenting it. Applications whose returns appear in metrics a health system already tracks routinely convert from pilot at roughly three times the rate of those that do not.
02 / WORKFLOW PLACEMENT PRIORITY

Distribution is beating model quality outright

An algorithm delivered inside the electronic health record faces no separate procurement process, no integration project and no additional clinician credential to remember each morning. One outside that workflow faces all three, which accounts for most of the reason pilot conversion sits near 31% across this entire market. Developers that treat distribution as a channel decision taken after the product is finished keep losing to entirely adequate models with better placement, and that pattern has now held for several years.
03 / PAYMENT PATHWAY INVESTMENT

Six per cent have codes; the rest negotiate forever

Roughly 6% of all authorised clinical applications carry any dedicated payment at all, so all the remainder compete for scarce operating budget against nursing agency cover and equipment maintenance every single year. Establishing a code demands clinical and economic evidence at a scale most developers never budget for at all, and the work takes years that simply cannot be compressed by spending more. It is also the only route that removes the budget objection permanently rather than renegotiating the same argument annually.
04 / SHORTAGE MARKET TARGETING

Absent specialists beat slow ones as an argument

Where a health system has an absolute shortage of radiologists or pathologists, an algorithm performs work that otherwise simply does not get done, which is a far stronger argument than making existing specialists incrementally faster at theirs. India compounds at 17.4% on precisely this basis, and comparable logic applies across Southeast Asia, Eastern Europe and most of Africa too. Pricing is lower and conversion considerably faster than in developed markets, where evaluation processes are heavy and every budget line is contested.

Engagement Snapshot From the Field

A live engagement with an industry participant carrying material or product regulatory and market exposure ahead of a defining policy shift, showing how our research translates into a defensible multi-year portfolio strategy.
MARKET MINDS ADVISORY · CLIENT ENGAGEMENT SUMMARY
Artificial Intelligence in Healthcare Producer Strategic Portfolio Review and Transition Roadmap 2026·Investment Scenario on Artificial Intelligence in Healthcare Exposure Evaluation 2025-26
CLIENT PROFILE
A clinical imaging artificial intelligence developer with annual revenue near $48 million (client-reported, unverified by MMA), holding several regulatory authorisations across neurology and cardiology triage applications. The company had run 60 health system pilots over three years and converted 14 of them, and leadership needed to understand whether the conversion problem was product, pricing, evidence or something else entirely before raising further capital.
STRATEGIC CHALLENGE
Every failed pilot had produced positive performance data and favourable clinician feedback, which made the failures genuinely puzzling to a technically strong team. The company needed to know where deployment decisions actually died, whether pursuing a payment code was viable at its scale, and whether platform partnership would compromise pricing more than standalone selling was already costing it.
MMA APPROACH
We reconstructed decision histories for 46 of the 60 pilots through interviews with clinical, informatics and finance stakeholders at each institution. Budget authority and approval sequence were mapped across institution types. We modelled a payment pathway programme against a platform partnership strategy, using conversion rate and realised price as the comparison variables.
KEY FINDINGS
  1. Forty-one of 46 pilots failed at the recurring budget stage rather than on performance, and in 33 of those the clinical stakeholders had actively supported adoption throughout.
  2. Finance approvers consistently asked which existing budget line the cost would come from, and no pilot that lacked an answer to that question converted at any institution.
  3. A payment pathway programme modelled at four years and roughly twice the company's annual research budget, which was not fundable without substantial additional capital.
  4. Platform marketplace distribution reduced realised price by 22% to 30% but raised modelled conversion from 23% to above 60%, improving expected revenue per pilot substantially.
CLIENT PROFILE
A clinical imaging artificial intelligence developer with annual revenue near $48 million (client-reported, unverified by MMA), holding several regulatory authorisations across neurology and cardiology triage applications. The company had run 60 health system pilots over three years and converted 14 of them, and leadership needed to understand whether the conversion problem was product, pricing, evidence or something else entirely before raising further capital.
STRATEGIC CHALLENGE
Every failed pilot had produced positive performance data and favourable clinician feedback, which made the failures genuinely puzzling to a technically strong team. The company needed to know where deployment decisions actually died, whether pursuing a payment code was viable at its scale, and whether platform partnership would compromise pricing more than standalone selling was already costing it.
MMA APPROACH
We reconstructed decision histories for 46 of the 60 pilots through interviews with clinical, informatics and finance stakeholders at each institution. Budget authority and approval sequence were mapped across institution types. We modelled a payment pathway programme against a platform partnership strategy, using conversion rate and realised price as the comparison variables.
KEY FINDINGS
  1. Forty-one of 46 pilots failed at the recurring budget stage rather than on performance, and in 33 of those the clinical stakeholders had actively supported adoption throughout.
  2. Finance approvers consistently asked which existing budget line the cost would come from, and no pilot that lacked an answer to that question converted at any institution.
  3. A payment pathway programme modelled at four years and roughly twice the company's annual research budget, which was not fundable without substantial additional capital.
  4. Platform marketplace distribution reduced realised price by 22% to 30% but raised modelled conversion from 23% to above 60%, improving expected revenue per pilot substantially.
RECOMMENDED STRATEGY
Phase 1: Phase one: pursue platform marketplace distribution and record vendor partnership, accepting lower realised pricing in exchange for materially higher conversion rates. Phase 2: Phase two: reposition the commercial argument around throughput and length-of-stay metrics that health systems already track, rather than around diagnostic accuracy. Phase 3: Phase three: pursue a payment pathway only in partnership with health systems willing to share evidence generation cost, not as an independently funded programme.
OUTCOME
Marketplace distribution launched within eight months and pilot conversion rose above 50% in the following year (client-reported, unverified by MMA). Realised pricing fell roughly as modelled, and total contracted revenue nonetheless grew. Two health systems agreed to co-fund evidence generation toward a payment submission. Leadership now treats distribution as the primary commercial variable.

Frequently Asked Questions

Foundational context covering the market sizes, CAGR, scope, country, region and competition that inform every finding below. This section is provided to cover basics and most often pre-purchase conversations, answered from the MMA Primary Research Dataset.

What is the current size of the Artificial Intelligence in Healthcare Market?

The global market is valued at $16.5 billion in 2025, rising to $18.81 billion in 2026. North America holds 46% of that value, reflecting administrative complexity and technology spending no other system matches.

How large will the Artificial Intelligence in Healthcare Market be by 2036?

MMA forecasts $69.73 billion by 2036, an increase of $50.92 billion over the 2026 base and an expansion multiple of 3.71x. Documentation and administrative applications carry most of that growth.

What is the CAGR for the Artificial Intelligence in Healthcare Market 2026 to 2036?

The base case compound annual growth rate is 14.0%, with a bull case at 15.4% and a bear case at 12.6%. Historical growth from 2020 to 2025 ran near 12.6% and was concentrated in administrative applications.

Which segment is growing fastest?

Clinical documentation and ambient AI compounds at 21.0%, a full 1.50x the market rate. It returns roughly 62 minutes of clinician time daily, which a buyer can verify without trusting any vendor evidence.

Who are the major companies in the Artificial Intelligence in Healthcare Market?

Microsoft, Epic Systems, Siemens Healthineers, Google and GE HealthCare together hold 24% of revenue from healthcare artificial intelligence software and services. That is the lowest concentration in this report series.

Which country is growing fastest?

India compounds at 17.4%, faster than any other country covered, because algorithms address an absolute shortage of radiologists and pathologists rather than improving existing specialist productivity. Private diagnostic chains drive most deployment.

Report Segmentation Architecture

The full report scope spans multiple orthogonal segmentation dimensions, with cross-tabulated demand data provided for each dimension pair. Coverage extends further to regional breakdowns, trend trajectories, and the competitive detail needed to support segment-level decision-making.

By Application Domain

  • Medical Imaging and Diagnostic AI
  • Clinical Documentation and Ambient AI
  • Revenue Cycle and Administrative AI
  • Clinical Decision Support and Risk Prediction
  • Patient Engagement and Virtual Care AI
  • Operational and Capacity Management AI

By End-Use Industry

  • Integrated Health Systems
  • Independent Hospitals
  • Imaging and Diagnostic Centres
  • Ambulatory and Physician Practices
  • Health Insurers and Payers
  • Public Health Services

By Commercial Dimension

  • Direct Enterprise Subscription
  • Electronic Record Marketplace Distribution
  • Imaging Vendor Bundled Supply
  • Per-Study and Per-Encounter Pricing
  • Shared Savings and Outcome Contracts
  • Reseller and Systems Integrator Channels

By Region

  • East Asia
  • North America
  • Western Europe
  • South Asia and Pacific
  • Latin America
  • Middle East and Africa
  • Eastern Europe

Scope, Methodology, and Coverage

Every figure in this report is reproducible from documented input assumptions. The scope below maps the historical period, the forecast horizon, the segmentation dimensions, and the countries covered, alongside the underlying primary and qualitative methodology.
Historical Period
2020 to 2025
Forecast Period
2026 to 2036
Base Year
2025 (USD billions; MMA Primary Research Dataset, August 2026)
Market Definition
This market comprises artificial intelligence software and services deployed in healthcare delivery and administration, measured at vendor revenue across direct enterprise subscription, electronic record marketplace distribution, imaging vendor bundled supply, per-study and per-encounter pricing, shared savings and outcome-based contracts, and reseller or systems integrator channels. Coverage spans medical imaging and diagnostic algorithms including triage, detection, quantification and workflow prioritisation, clinical documentation and ambient capture generating notes from clinical encounters, revenue cycle and administrative automation covering coding, claim preparation, denial management and prior authorisation, clinical decision support and risk prediction including deterioration and readmission models, patient engagement and virtual care applications carrying clinical function, and operational capacity management covering scheduling, bed flow and staffing optimisation. Drug discovery and pharmaceutical research applications, genomic sequencing analysis pipelines and bioinformatics, medical device hardware and the imaging equipment algorithms run on, general enterprise software without healthcare-specific function, consumer wellness applications carrying no clinical claim, and laboratory information or electronic record platforms themselves fall outside scope.
Quantitative Units
USD millions (current prices); authorised algorithms by specialty; enterprise deployments; pilot to production conversion rate; revenue per deployment; clinician time returned; reimbursed application share
Segmentation Dimensions
By Application Domain; By End-Use Industry; By Commercial Dimension; By Region
Regions Covered
East Asia, North America, Western Europe, South Asia and Pacific, Latin America, Middle East and Africa, Eastern Europe
Countries Covered
United States, Canada, China, Japan, South Korea, Taiwan, United Kingdom, Germany, France, Netherlands, Sweden, Denmark, Spain, Italy, Switzerland, India, Australia, Singapore, Thailand, Malaysia, Indonesia, Brazil, Mexico, Chile, Colombia, Argentina, Saudi Arabia, United Arab Emirates, Israel, South Africa, Poland, Czechia, Hungary, Romania, Turkey, and additional markets relevant to health technology analysis
Key Companies Profiled
Microsoft, Epic Systems, Siemens Healthineers, Google, GE HealthCare, Oracle Health, Philips, IBM, Amazon Web Services, NVIDIA, Aidoc, Viz.ai, Abridge, Tempus AI, PathAI, Cleerly, HeartFlow, Optum, Waystar, Qventus
Quantitative Methodology
Primary survey, n=3,800 respondents, Q4 2025, six countries; demand-side model with trade association cross-validation
Qualitative Methodology
47 expert interviews, Q4 2025; applied to validate demand model assumptions, identify emerging dynamics, and assess competitive positioning
Report Format
PDF and XLSX data workbook (Word format preview document)
Publisher
Market Minds Advisory
Report Code
MMA-2026-TEC-486
Published
August 2026
Contact
sales@marketmindsadvisory.com | www.marketmindsadvisory.com

Purchase the full Artificial Intelligence in Healthcare Market Report (2026 to 2036).

The full MMA report explains the gap between a thousand authorised algorithms and a handful of payment pathways, and what that gap does to commercial outcomes. It sizes six application domains and seven regions to 2036, modelling authorised algorithms by specialty, enterprise deployments, pilot conversion rates, revenue per deployment and reimbursed share separately. Competitive assessment covers twenty participants on one consistent revenue basis. Cost exposure is traced through compute, clinical validation and regulatory staffing. Four commercial levers and a strategic verdict close the report, grounded in 47 expert interviews and a 3,800-respondent survey.
Six application domains sized separately through 2036
Payment pathway status mapped across authorised clinical applications
Pilot to production conversion benchmarked by application domain
Twenty participants assessed on one consistent revenue basis
Distribution routes compared on realised price and conversion
Anonymised developer engagement with tested commercial recommendations

Built For The People Who Decide

From boardroom strategy to bench-side execution, this report is read cover-to-cover by leaders shaping the next decade of their industry, turning demand scenarios, market dynamics and valuation benchmarks into decisions.
CXOs/ Presidents/ VPs/ Managers
M&A and Corporate Development
Strategy Teams and R&D Heads
Procurement and Product Directors
Regulatory and Compliance Leaders
Investor Relations and Equity Analysts