
Market Minds Advisory
Stack and Nest Containers Market

Stack and Nest Containers Market Growth Outlook, 2026-2036

US agricultural harvest logistics scale and expanding automotive parts supply chain modernization are pulling stack and nest container demand toward validated space-efficient formats that standard crates cannot satisfy on empty-return volume grounds.

Lead Analyst

Bilal Shaikh

Published

November 2026

Make Smarter Decisions with Customized Research Insights

Request a free sample report and evaluate market opportunities, growth trends, and competitive dynamics relevant to your business needs.

2025 MARKET VALUE$2.2BMarket Size 2025
2036 FORECAST VALUE$4.3BBase Case , 2026 to 2036
CAGR 2026 TO 20366.2 %Bull 7.3% / Bear 5.1%
INCREMENTAL OPPORTUNITY$1.9BNet 10- year value creation
EXPANSION MULTIPLE1.82x2036 value over 2026 base
Strategic Levers
M&A Pipeline
Regional Outlook
Country Rankings
Competitive Intelligence
Segmental Deep-dive
Call-Us : 91 93563 13602

Stack and Nest Containers Demand Outlook

US agricultural harvest logistics scale and expanding automotive parts supply chain modernization form the single most important dynamic reshaping stack and nest container demand right now, pulling specification toward validated space-efficient formats faster than manufacturers had planned production capacity for across this cycle overall today.
Pharmaceutical and medical stack and nest containers are growing fastest as operators pursue validated logistics credentials, with automotive parts stack and nest containers following close behind as supply chain modernization expands across broader distribution formats worldwide this cycle. North America anchors the largest regional share given its agricultural and automotive logistics concentration, with East Asia following as the second-largest contributor. Rising logistics efficiency enforcement across several developing markets is reinforcing this shift even further.
Competitive character remains concentrated among a small group of established reusable logistics container specialists, with ORBIS Corporation and Schoeller Allibert holding the broadest combined capacity ahead of mid-tier challengers like Rehrig Pacific Company and Georg Utz Holding across most regions tracked today. Smaller regional manufacturers increasingly struggle to match the capital scale required to compete credibly, and that gap keeps widening each cycle as nesting specifications harden further across premium.
Market Definition
The stack and nest containers market covers reusable plastic bins designed to stack when full and nest when empty for agricultural harvest, automotive parts, retail distribution, industrial manufacturing, and pharmaceutical logistics applications, excluding wheeled roll cage containers and large-format storage tanks covered in separate MMA reports. This report sizes the global market for these stack and nest container formats. MMA expects the 4-Wheeled containers market to grow at a 5.9% CAGR over the 2026-2036 forecast period.
Base Year Value
$2.2B in 2025 (MMA Primary Research Dataset, October 2026)
Forecast Period
2026 to 2036, eleven discrete annual values
CAGR
6.2% base case. Bull 7.3%. Bear 5.1%.
Fastest Growth Segment
Pharmaceutical and Medical Stack and Nest Containers: 7.8% CAGR
Fastest Growth Country
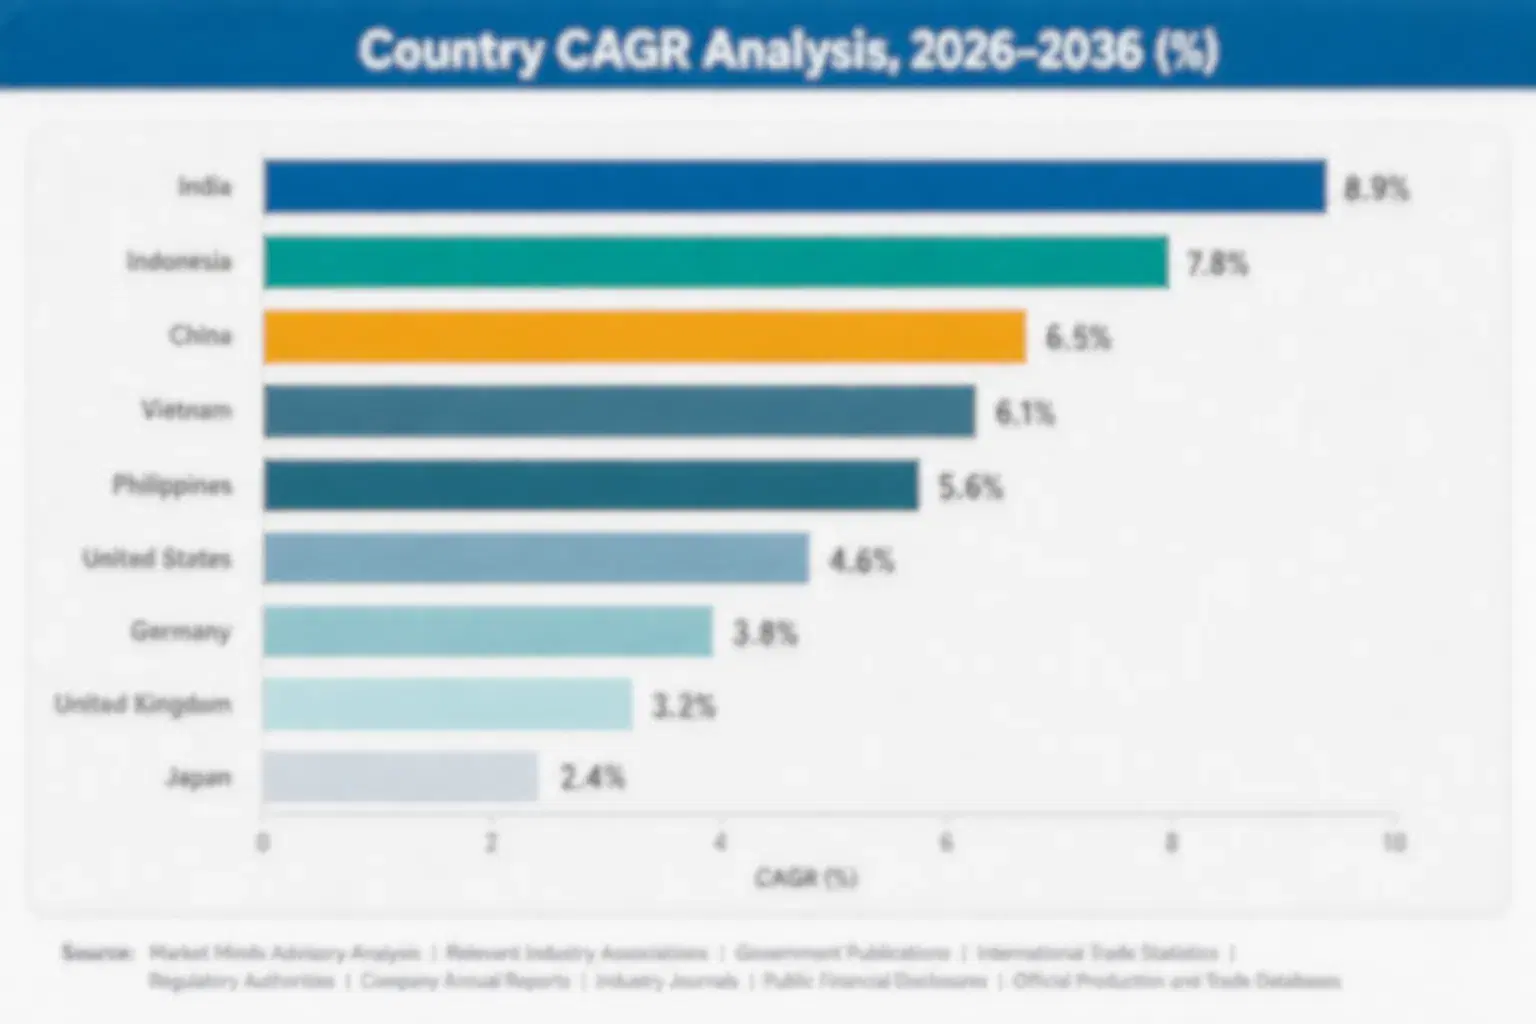
Philippines: 9.0% CAGR
Fastest Growth Region
South Asia and Pacific: 8.2% CAGR
Largest Region
North America: 28% of 2025 global value
Market Leaders
ORBIS Corporation, Schoeller Allibert, Rehrig Pacific Company, Georg Utz Holding, and Buckhorn lead by production capacity. Source: MMA Analysis based on company annual reports.
Primary Survey
n=3,800 procurement and R&D decision-makers, Q4 2025, six countries
Methodology
Demand-side build-up, cross-validated against public data, 47 expert interviews

Stack and Nest Containers Market Forecast to 2036

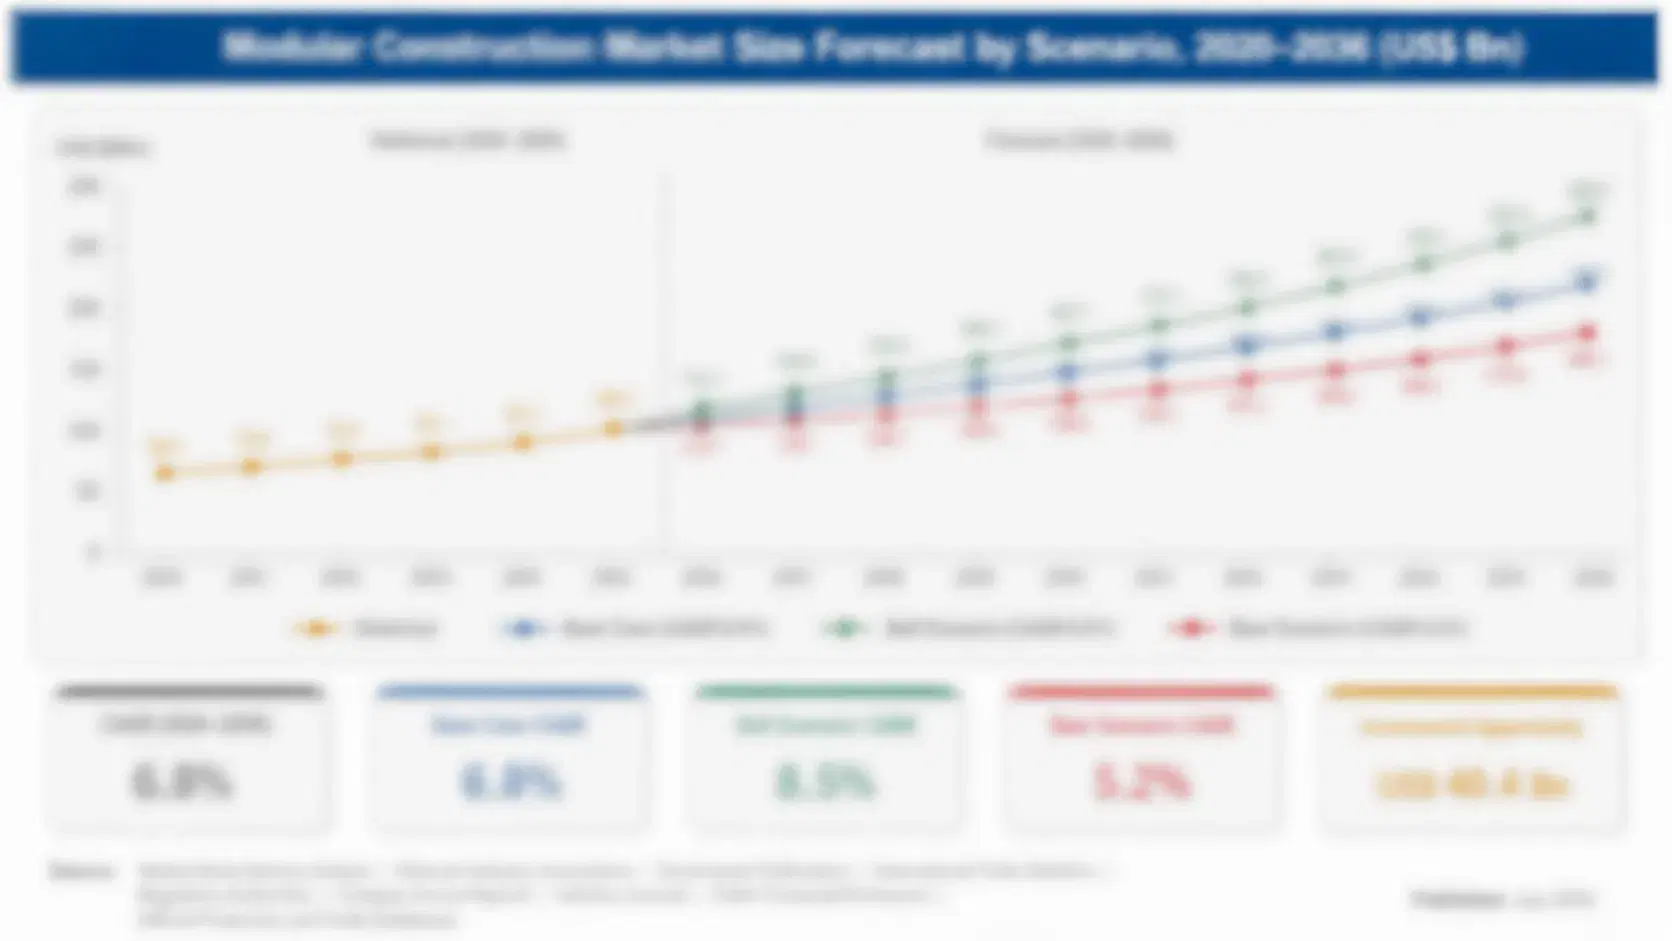
stack-and-nest-containers-market-size-forecast-scenario-1791567249322
Between 2020 and 2025 the market grew at an estimated 5.7% annually, a period shaped by steady agricultural harvest demand before automotive and pharmaceutical formats broadened meaningfully during the final two years, as operators sought validated logistics credentials across several distribution categories and growing retail channels worldwide during this period overall today. overall across the sector. today.
The base case assumes 6.2% compound growth through 2036, driven by three reinforcing mechanisms: first, US agricultural operators specifying validated space-efficient formats as empty-return volume reduction becomes a logistics standard across harvest categories; second, automotive manufacturers adopting stack and nest containers as supply chain modernization becomes a production requirement across growing categories worldwide; and third, East Asian retail distributors continuing to scale container demand across expanding fulfillment categories nationwide. today. overall.
The bull case rests on pharmaceutical adoption accelerating faster than expected as more operators scale validated logistics capacity across broader categories and geographic markets. The bear case centers on continued reliance on conventional fixed-wall crates among cost-sensitive mass-market industrial categories, even as overall nesting demand keeps building toward broader adoption across most categories tracked worldwide. overall today.

Empty-Return Efficiency Decides the Logistics Standard

Empty-return efficiency validation, once a secondary consideration behind basic container cost and fleet availability, has become a primary criterion operators use to evaluate competing stack and nest container manufacturers, since an automotive manufacturer launching a new supply chain program recovers a credible manufacturer's price premium through fewer empty-return trips and avoided warehouse space costs that inconsistent nesting ratios increasingly causes at scale across distribution networks. That gap widens with every logistics cycle.
MARKET CONCENTRATION (CR5)38%Top five reusable logistics specialists hold this combined share
AVERAGE SELLING PRICE$24What a single validated container unit typically costs
TOP PRODUCING COUNTRY SHARE22%United States leads global production output by volume today
CAPACITY UTILIZATION75%Stack and nest container production plants run near typical capacity
EMPTY-RETURN VOLUME REDUCTION65-80%Typical space savings versus comparable fixed-wall crate formats
RESIN COST SHARE45-53%Typical polypropylene resin share of total production cost
Commercially, the market increasingly rewards manufacturers who can validate consistent nesting ratio and structural durability across varied container configurations and stacking profiles, since an operator running several distribution programs avoids costly fleet replacement by standardizing container specification across a shared manufacturer relationship rather than qualifying separate formats per program. This standardization advantage is becoming a genuine competitive moat for established manufacturers facing growing entry from regional specialists.
Over the next decade, expect continued expansion toward pharmaceutical and automotive formats, East Asian retail distribution capacity deepening further, and growing demand for manufacturers capable of serving multiple end-use categories on shared production platforms rather than category-specific capital investment. Manufacturers slow to diversify their nesting portfolio risk losing share to more flexible competitors.
"An operator used to pick bins mainly on basic cost and fleet availability. Now a single nesting ratio failure during a warehouse space audit can trigger a full fleet recall, and that shift is reshaping which manufacturers win the next generation of automotive and pharmaceutical logistics contracts."
Director, Reusable Logistics Container and Space Efficiency Practice · MMA Stackable and Nestable Reusable Plastic Bins for Agricultural Practice · October 2026

Stack and Nest Containers Adoption Trends

Pharmaceutical Operators Rapidly Adopt Validated Logistics Formats

Pharmaceutical and medical logistics operators pursuing validated space efficiency and structural reliability are increasingly specifying validated stack and nest containers with documented nesting ratio and structural durability testing, rather than the conventional fixed-wall crate that dominated pharmaceutical logistics when validated molding costs were less competitive in prior years. This shift commands meaningfully higher unit cost than conventional fixed-wall format given the enhanced testing and certification requirements involved. Manufacturers report validated orders now outpacing fixed-wall orders across several major pharmaceutical operator accounts tracked this cycle, a clear reversal from just a few years earlier across comparable programs. The medical containers market is already worth USD 5.4 billion in 2025, and MMA expects a 7.6% CAGR from here to 2036.
Market Impact: Drives roughly 4% of demand
Automotive Manufacturers Expand Supply Chain Modernization

Automotive manufacturers scaling premium supply chain modernization programs across growing production categories are increasingly specifying validated stack and nest containers with documented structural durability and nesting testing, rather than the conventional container that dominated automotive logistics when space efficiency was less of a cost priority in prior years. This capability matters most for manufacturers serving expanding, cost-sensitive categories facing rising logistics efficiency expectations across several regions. Manufacturers are responding with dedicated nesting-validated production lines that let operators transition without a full fleet redesign for every new specification they introduce. overall.
Market Impact: Adds roughly 3% baseline volume

Where the Stack and Nest Containers Opportunity Lies

US Agricultural Logistics Scale Sharply Lifts Demand

The United States' deeply established agricultural harvest logistics scale, continuing to expand validated adoption across growing produce categories, is turning empty-return efficiency specification into a genuine purchasing requirement rather than an optional equipment upgrade for operators serving cost-sensitive categories with strict warehouse space expectations. This shift has made nesting ratio validation a competitive necessity rather than a differentiator for manufacturers serving multiple operator accounts simultaneously across several regions worldwide. MMA estimates this efficiency-driven segment will continue outpacing overall market growth by a meaningful margin through the remainder of the forecast period.
Market Impact: Cuts addressable volume by 3%

East Asian Retail Distribution Growth Lifts Baseline Demand

East Asia's expanding retail distribution and fulfillment base, continuing to standardize container specifications across domestic and export-focused categories, is lifting baseline demand independent of any single US agricultural trend, as manufacturers expand regional capacity to handle rising validated container volumes across diverse categories requiring consistent nesting reliability across several fulfillment centers and shift patterns nationwide. Manufacturers slow to standardize risk losing accounts to better-prepared competitors across the region, and that gap is widening each cycle as specifications harden further across both premium and mid-tier categories alike this forecast period. this cycle.
Market Impact: Adds 3-6 percent order delay risk

Stack and Nest Containers Market Restraints

Conventional Fixed-Wall Substitution Steadily Slows Growth

Operators serving mass-market industrial categories facing lower per-unit costs from conventional fixed-wall crates not requiring nesting tooling or ratio validation are increasingly delaying conversion for routine, price-sensitive distribution categories, creating a genuine growth ceiling for manufacturers facing the same substitution pressure as larger competitors but lacking comparable budgets to differentiate through nesting innovation. The root cause is conventional fixed-wall crates offering comparable basic containment function at lower unit cost in less space-sensitive applications. Manufacturers are mitigating the pressure by emphasizing premium and space-sensitive categories where validated demand remains durable. Early signs suggest this pattern could persist.
Market Impact: Adds 10% validated order share

Specialty Resin Feedstock Volatility Complicates Planning

Manufacturers sourcing specialty polypropylene resin for stack and nest container production across multiple end-use categories face a genuinely complex production planning challenge, since specialty resin availability and pricing vary meaningfully across petrochemical supplier regions and cycles, sometimes requiring real-time sourcing adjustment to maintain consistent delivery commitments across a production run. The root cause is that specialty resin markets remain more concentrated than commodity resin markets given their dependence on a small number of qualified suppliers. Manufacturers are mitigating the constraint by developing flexible multi-region sourcing agreements that adjust automatically as availability varies.
Market Impact: Adds 8% automotive order share
3 additional market trends, 4 additional growth drivers, and 2 additional restraints and challenges are covered in the full report. Contact sales@marketmindsadvisory.com to access the complete intelligence.

Stack and Nest Containers Segment Performance

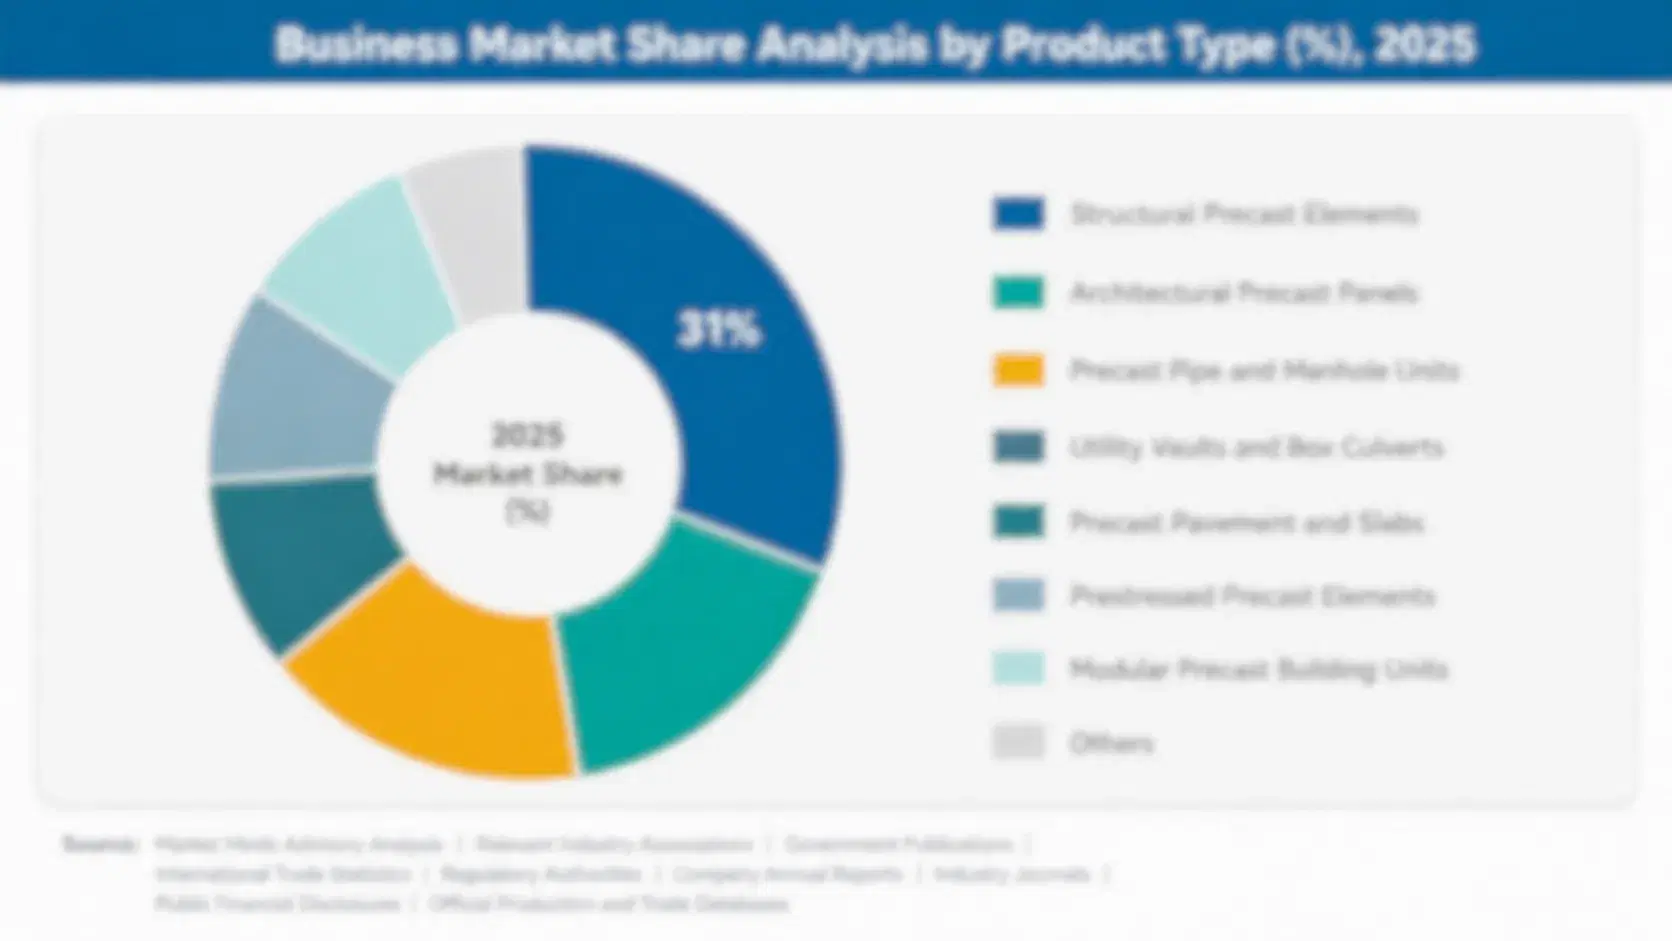
The market segments by end-use application rather than by production process configuration, since agricultural, automotive, retail, industrial, and pharmaceutical stack and nest containers each carry distinct nesting and durability requirements regardless of the underlying production mechanism used across fleets. Operators organize purchasing decisions along this framework today, and manufacturers increasingly structure their sales teams around it too.
stack-and-nest-containers-market-market-share-analysis-1791567249495

Pharmaceutical and Medical Stack and Nest Containers

Pharmaceutical and medical stack and nest containers carry documented nesting ratio and structural durability validation for premium logistics-sensitive applications, representing the fastest-growing and most innovation-intensive category given the rapid expansion of validated logistics commitments across operators worldwide. Pharmaceutical operators scaling validated distribution programs are the primary buyers, typically justifying the container premium through improved logistics reliability that recovers investment through retained operator contract renewal across growing distribution cycles. Growth here outpaces every other segment because validated logistics commitments continue broadening across new categories and geographic markets worldwide. Manufacturers investing early in dedicated nesting validation technology are capturing accounts before competitors respond with comparable validated capacity of their own design and scale across several regions.
CAGR 7.8%

Automotive Parts Stack and Nest Containers

Automotive parts stack and nest containers combine documented structural durability with nesting validation for supply chain modernization applications, delivering a space efficiency advantage that conventional fixed-wall crates cannot match for manufacturers serving expanding, cost-sensitive categories facing rising logistics competition across several regions. Automotive manufacturers scaling supply chain modernization programs are significant buyers, typically justifying the modest price premium through improved space efficiency that recovers container cost through retained manufacturer contract renewal cycles. Growth here reflects genuine logistics-driven demand spreading across categories, as manufacturers increasingly treat validated nesting formats as a baseline requirement rather than an optional upgrade. Manufacturers report this segment increasingly commands dedicated production lines as manufacturers standardize specifications across their broader fleets.
CAGR 7.0%
Full segment breakdown across 5 segments available in the complete report.

Stack and Nest Containers Regional Outlook

North America anchors the largest regional share given its substantial agricultural and automotive logistics concentration across major supply chain hubs, while South Asia and Pacific posts the fastest regional growth rate tracked anywhere. East Asia follows as the second-largest contributor. today. broadly. worldwide. overall. today.

North America

The United States agricultural and automotive manufacturing sector, among the largest in the world, drives substantial continuing demand for stack and nest containers across harvest, parts, and retail distribution categories simultaneously, with several major manufacturers operating dedicated plants near key agricultural and automotive hubs. Growing demand from automotive manufacturers scaling supply chain modernization commitments contributes meaningful additional demand as these categories expand logistics requirements across their production programs each year. Canada contributes a smaller but steady volume base tied to its own agricultural sector, while Mexico's growing contract manufacturing base increasingly serves North American automotive manufacturers through nearshored production arrangements expanding steadily. Operators across the region increasingly consolidate their manufacturer relationships to simplify multi-category sourcing, a shift that.
Share: 28% | CAGR: 7.0% (2026 to 2036)

Western Europe

Germany, France, and the Netherlands anchor Western European demand both as leading automotive manufacturing markets and as established agricultural logistics converting centers in their own right, giving the region meaningful depth on both the supply and demand side of this market simultaneously across several converting hubs. Germany's concentration of specialist automotive manufacturers is the single clearest demand mechanism, pushing nesting innovation faster than almost anywhere else in the world today. Belgium and Italy contribute meaningful additional demand tied to their own substantial agricultural sectors and expanding retail distribution manufacturing bases. Regional manufacturers also benefit from close proximity to major resin and testing facilities, shortening lead times for new product launches considerably.
Share: 21% | CAGR: 4.7% (2026 to 2036)
Regional intelligence for 5 additional markets available in the complete report: East Asia, South Asia and Pacific, Latin America, Middle East and Africa, Eastern Europe. Contact sales@marketmindsadvisory.com.
stack-and-nest-containers-market-country-cagr-analysis-1791567249673

Capturing Share as Space Efficiency Reshapes Demand

Conventional fixed-wall crate margin has compressed as basic crates become commoditized among mass-market warehouses, so the real commercial opportunity sits in validated conversion capture, pharmaceutical expansion, and flexible resin sourcing innovation across several categories tracked. Manufacturers treating conversion and nesting innovation as core strategy capture disproportionate new volume early in each cycle, well ahead of slower-moving rivals.

Capturing Early Validated Conversion Fleet Contracts

Manufacturers that win an operator's validated conversion decision early typically lock in a multi-year fleet relationship worth meaningfully more than a comparable fixed-wall contract, since the operator rarely revisits container specification again absent a major space efficiency failure decision affecting its broader distribution program. ORBIS Corporation and Schoeller Allibert have both built dedicated conversion sales teams specifically to identify operators expanding nesting commitments across several categories, and early movers report winning conversion accounts at close rates roughly 14% higher than their broader new-account win rate this cycle. Operators increasingly reward this early engagement with longer contract terms, further reinforcing.
Market Impact: Wins conversion accounts at a 14% higher rate

Expanding Dedicated Nesting Ratio Testing Programs

Manufacturers offering dedicated nesting ratio and structural durability testing programs alongside standard container supply contracts are winning operator accounts that value this faster fleet-validation path above a marginally lower upfront price from a competitor offering only basic container supply and no testing support. This expanded service commands a meaningful premium over standard contracts across several categories tracked, and operators report this capability improving their own warehouse-efficiency timelines by roughly 11% compared with operators using conventional fixed-wall crates across comparable distribution cycles. Operators citing this speed advantage increasingly renew these service contracts well ahead of their formal expiration dates.
Market Impact: Improves operator warehouse-efficiency timelines by roughly 11 percent

Developing Flexible Multi-Region Resin Sourcing Technology

Manufacturers developing flexible multi-region specialty polypropylene sourcing arrangements that accommodate varied feedstock availability across petrochemical supplier regions while maintaining consistent delivery commitments are capturing operators who want reliable supply without committing to single-region agreements regardless of actual conditions facing any one supplier region. This sourcing innovation commands a meaningful premium over conventional single-region agreements across several contract types, and operators report this capability cutting their own supply disruption risk by roughly 9% compared with conventional sourcing alternatives this cycle. Operators facing past disruption are especially receptive to this pitch, accelerating adoption across their broader supplier base.
Market Impact: Cuts supply disruption risk by roughly 9 percent

Offering Phased Conversion Pricing for Smaller Operators

Manufacturers offering phased conversion pricing programs specifically for smaller emerging agricultural and automotive operators facing the same space efficiency pressure as larger competitors but lacking comparable testing budgets are capturing accounts that would otherwise delay validated conversion or continue sourcing conventional fixed-wall crates across their distribution programs. This phased pricing approach converts smaller operator accounts at rates roughly 8% higher than requiring full upfront capital investment, since the phased structure lets a smaller operator access validated pricing closer to large-account rates over time. Several manufacturers report these phased accounts eventually upgrading to full-scale contracts within just two years.
Market Impact: Converts smaller operator accounts at an 8 percent higher rate

Stack and Nest Containers Value Chain and Margins

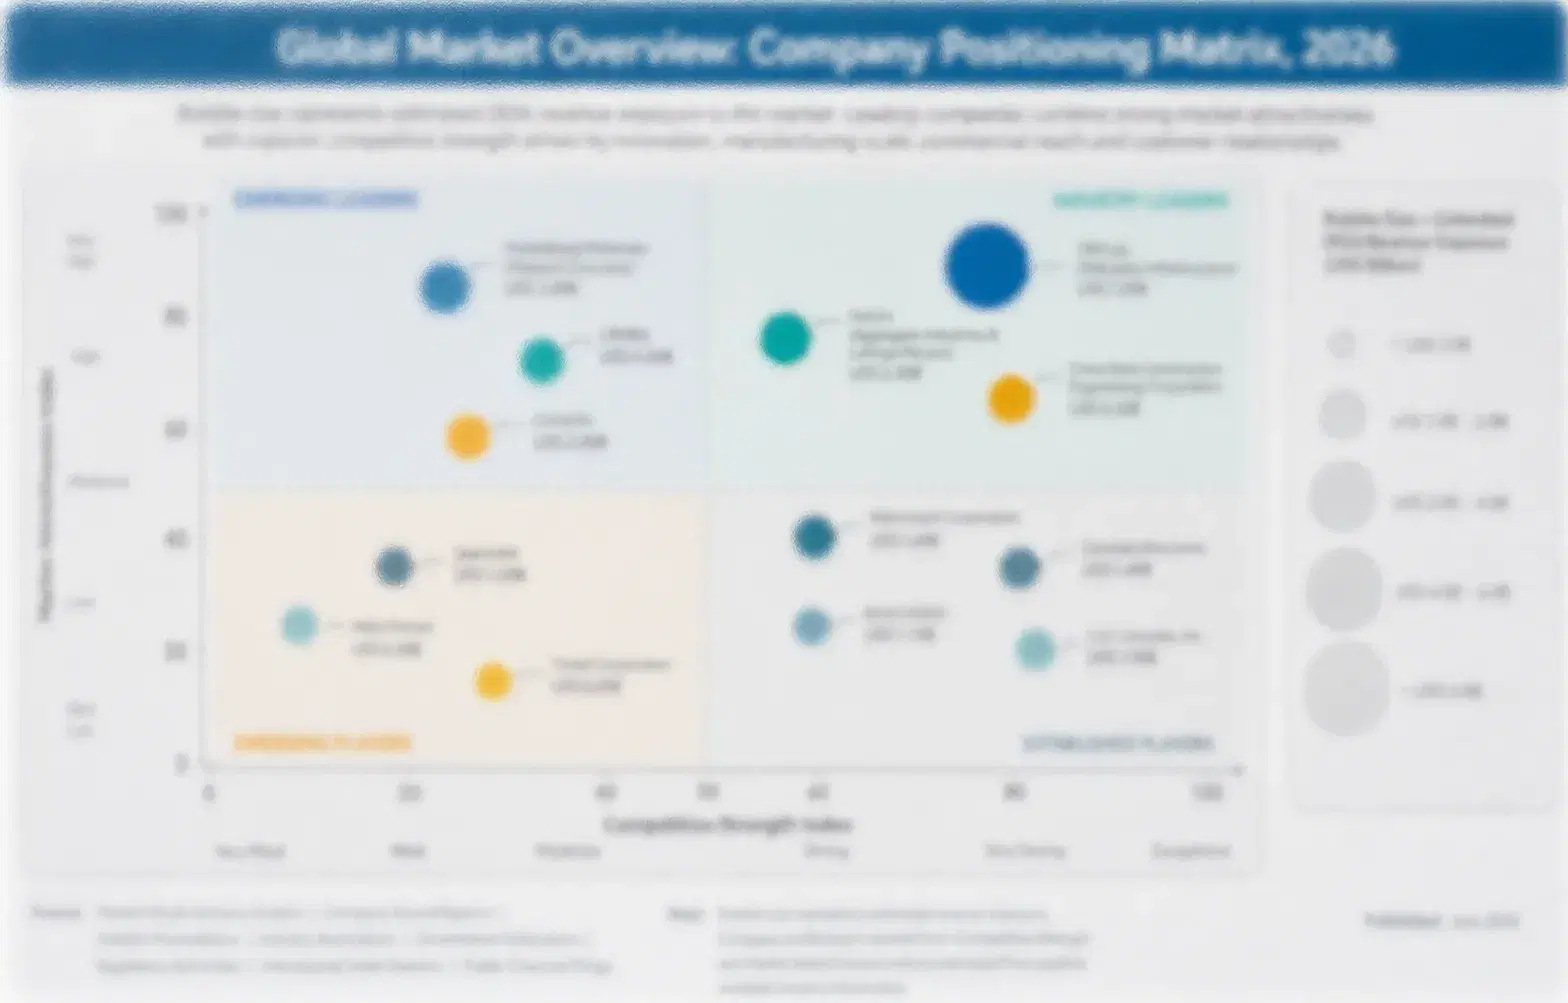
Market concentration sits at a moderate CR5 of 38%, reflecting a producer base spanning established reusable logistics container specialists and a large number of regional manufacturers, with ORBIS Corporation and Schoeller Allibert holding the broadest combined nesting validation range and distribution networks ahead of mid-tier challengers like Rehrig Pacific Company and Georg Utz Holding across most regions tracked today. That gap reflects decades of accumulated nesting engineering investment smaller producers cannot replicate quickly.
Current competitive activity centers on three fronts: validated conversion sales racing to capture operators expanding nesting specifications, structural durability testing service expansion responding to rising pharmaceutical demand, and flexible resin sourcing development responding to variable petrochemical conditions. Manufacturers increasingly compete on documented nesting reliability and supply consistency rather than per-unit price alone each cycle.

Emerging pressure comes from regional manufacturers offering lower-cost conventional fixed-wall crates without the decades of nesting engineering pedigree incumbents rely on for premium margin, appealing to mass-market warehouses across less demanding applications and emerging markets. Rankings could shift if a challenger develops comparable nesting reliability at lower unit cost before incumbents fully capture the validated conversion wave they are currently pursuing. Incumbents cannot assume today's ranking holds.
stack-and-nest-containers-market-company-positioning-matrix-1791567249851

Stack and Nest Containers Competitive Landscape

ORBIS CORPORATION

Moat: Deepest Nesting Validation Technology Depth

ORBIS Corporation's decades of nesting validation engineering across agricultural, automotive, and pharmaceutical formats give it a genuine credibility advantage with operators evaluating conversion decisions, a trust advantage newer entrants without comparable validation depth struggle to match quickly, built over years of reliable deployment experience worldwide.
ORBIS CORPORATION

Risk: Premium Pricing Exposure Risk

ORBIS Corporation's premium nesting pricing leaves it more exposed to accelerating price competition from lower-cost regional suppliers than competitors with a higher share of validated commodity-tier capacity already converted, a lasting mismatch that could compress margin further if mass-market demand accelerates faster than currently projected overall.
SCHOELLER ALLIBERT

Moat: Broad Multi-Category Fleet Range

Schoeller Allibert's combined agricultural, automotive, and retail category range lets it serve operators across varied applications from a single supplier relationship, a breadth that competitors offering only one category cannot easily match for operators running varied distribution programs across regions. This breadth increasingly wins multi-year fleet contracts from clients consolidating suppliers.
SCHOELLER ALLIBERT

Risk: Narrower Pharmaceutical Format Presence

Schoeller Allibert holds a smaller presence in the fast-growing pharmaceutical segment than competitors focused primarily on that category, leaving more of its revenue mix concentrated in slower-growing conventional applications. That concentration leaves it more exposed to any acceleration in pharmaceutical format adoption overall across its broader portfolio.

Players Tracked

Prominent Players

ORBIS Corporation
Schoeller Allibert
Rehrig Pacific Company
Georg Utz Holding
Buckhorn

Other Key Players

CABKA Group
Craemer Group
Polymer Logistics
IFCO Systems
Nefab Group
Loscam
Myers Industries, Inc.
Rotom Group
Monoflo International
Akro-Mils
Decade Products LLC
Brambles Limited
SSI Schäfer
Walther Faltsysteme GmbH
Bekuplast GmbH

Recent Developments

APRIL 2026

ORBIS Corporation Expands Nesting Capacity in United States

ORBIS Corporation completed a capacity expansion of validated stack and nest container production at one of its largest US plants, responding directly to accelerating automotive demand across major operator accounts this cycle, and the expansion added meaningful new validated capacity ahead of next year's production cycles.
Signal: Signals accelerating capacity reallocation toward automotive nesting demand across major incumbent manufacturer networks this cycle today.
JANUARY 2026

Schoeller Allibert Forms Philippine Distribution Joint Venture

Schoeller Allibert announced a joint venture with a Philippine logistics equipment distributor to localize production and distribution support for its validated stack and nest container formats across South Asian retail markets this cycle, a move expected to shorten lead times for regional operator customers significantly over the next several quarters.
Signal: Signals regional localization strategy expanding further into the Philippines and neighboring logistics growth markets broadly worldwide.
AUGUST 2025

Rehrig Pacific Company Secures Multi-Year Agricultural Supply Agreement

Rehrig Pacific Company signed a multi-year fleet supply agreement with a major North American agricultural cooperative to deliver validated stack and nest containers across its harvest network starting this year, reinforcing its growing premium account base and extending its reach across several additional distribution centers across the broader region this.
Signal: Signals supplier consolidation accelerating as operators increasingly prioritize validated multi-year agreements over spot sourcing arrangements broadly worldwide.

Polypropylene Resin Cost Exposure

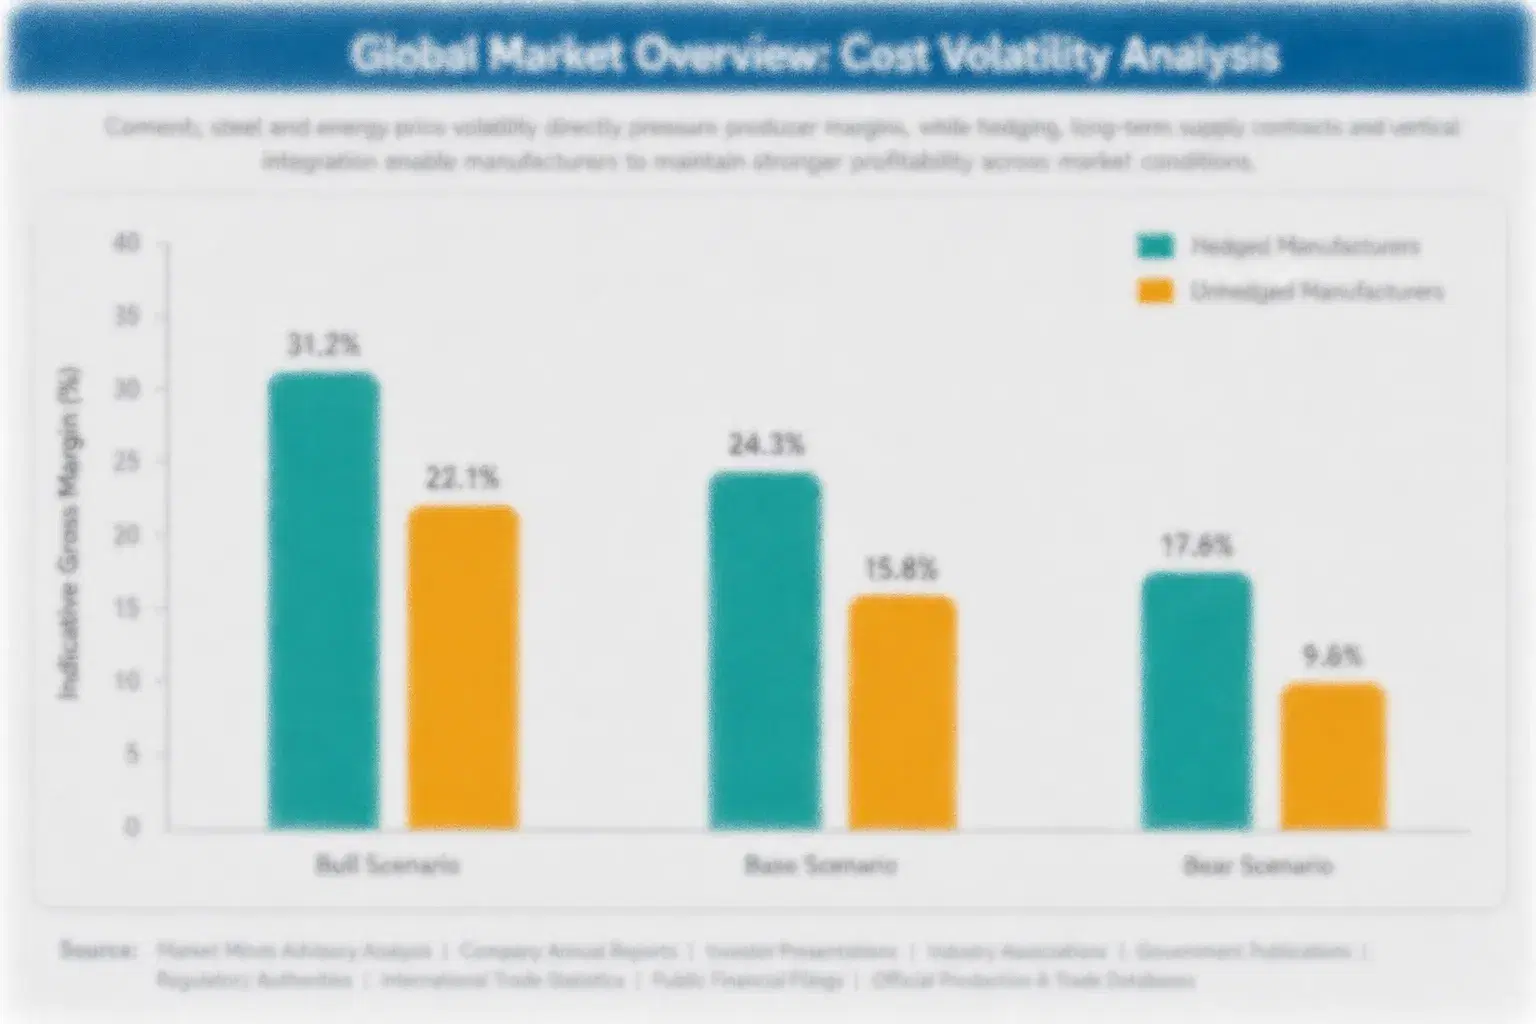
Specialty polypropylene resin accounts for roughly 45% to 53% of total material cost of goods sold, sourced from a concentrated group of petrochemical supplier networks located across North America, East Asia, and Western Europe, limiting manufacturer bargaining power on pricing across most contract negotiations and renewal cycles each year across the sector overall nationwide. overall. today.
The 2022 global petrochemical feedstock price spike, driven by energy cost inflation and supply disruption across major producing regions, pushed stack and nest container production costs up significantly, compressing manufacturer margin industrywide and forcing several producers to renegotiate fixed-price contracts mid-term during the disruption period, according to EIA commentary and company annual report disclosures documenting the episode's severity across reusable logistics container manufacturers broadly across regions worldwide. overall today.

Manufacturers concentrated in conventional fixed-wall applications carry less direct exposure to that specific petrochemical price cycle than diversified manufacturers sourcing across agricultural, automotive, and pharmaceutical categories simultaneously, since a diversified manufacturer can shift sourcing and production emphasis toward whichever category currently offers the more favorable margin position across its full product range and regional footprint more consistently overall. overall. today.
stack-and-nest-containers-market-cost-volatility-analysis-1791567250037

Index-Linked Contract Pricing Against Published Petrochemical Benchmarks

Larger producers increasingly structure supply contracts with pricing tied to published petrochemical feedstock price indices, passing cost changes through on a lagged quarterly basis rather than absorbing the full volatility themselves or attempting to renegotiate fixed-price agreements mid-term during a sudden disruption event affecting their broader supplier network. across their broader facilities. across their production schedule.

Multi-Region Resin Sourcing Diversification

Producers are diversifying specialty polypropylene sourcing across multiple regions and petrochemical networks, reducing dependence on any single supply chain and simplifying inventory management considerably across their broader production operations and global distribution networks served worldwide each year across several business units and regional facilities. and growing research partnerships. and expanding regional facilities. overall. today.

Portfolio Architecture for Margin Defence

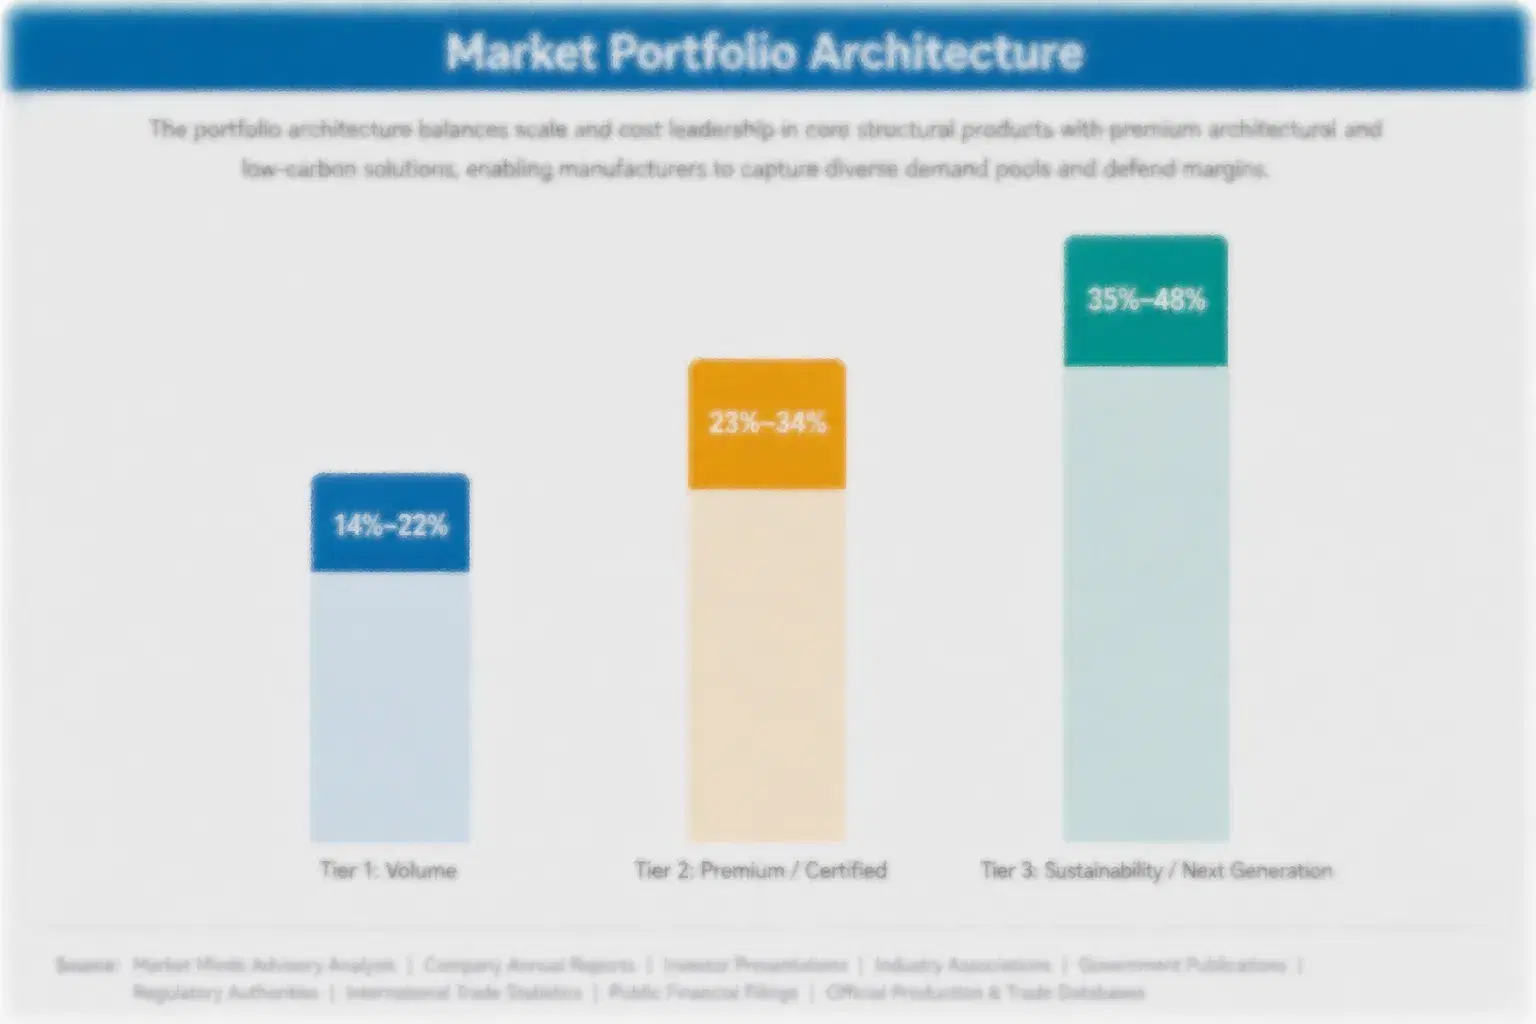
The market organizes into three tiers: a volume tier built on conventional fixed-wall crates sold on price, a premium tier built on validated standard retail and industrial formats that command a performance-driven price premium, and a next-generation tier built on pharmaceutical and automotive formats expanding beyond the largest early-adopter operator accounts. Gross margin in the next-generation tier runs meaningfully above the volume tier's level across comparable accounts today.
Volume tier competition remains intensely price-driven, with producers competing on reliability and upfront cost, leaving little room for margin expansion absent a shift in customer logistics priorities. Premium tier demand is growing meaningfully faster as empty-return efficiency and distribution requirements both push specification toward validated formats, creating real tension for producers deciding how quickly to shift production allocation. Few producers operate credibly across all three tiers simultaneously at scale today. today.

High-value margin pools concentrate specifically around pharmaceutical and automotive formats sold under bundled testing and sourcing service agreements to operators facing active logistics efficiency pressure, a pool that rewards producers with broad nesting technology and service capability and penalizes standard-format-only specialists regardless of fleet volume. today.

Volume / Commodity-Adjacent Tier

Conventional fixed-wall crates sold largely on price and basic reliability to warehouses not yet facing space or efficiency pressure. This tier remains sizable by fleet volume even as its revenue share declines steadily each year.
Gross Margin: 8-14%

Premium / Certified Tier

Validated standard retail and industrial formats commanding a performance-driven price premium, serving operators under active logistics efficiency pressure across growing categories and several geographic markets where nesting has become an explicit requirement.
Gross Margin: 16-24%

Sustainability / Regulatory / Next-Generation Tier

Pharmaceutical and automotive formats bundling nesting performance with logistics support for the largest premium operator accounts. Adoption concentrates among the largest operators facing the most acute logistics efficiency pressure today.
Gross Margin: 19-27%
stack-and-nest-containers-market-portfolio-architecture-1791567250229

High-value Sub-segments and Strategic Watch-out

Pharmaceutical Formats With Flexible Resin Sourcing

Combines the fastest unit growth with the strongest account retention in the category, as validated logistics mandates and flexible sourcing accelerate conversion across major premium operator accounts worldwide this cycle. Pricing power continues strengthening as demand widens across newly expanding premium categories and geographic markets each year.
Gross Margin: 17-25%

Nesting Ratio Testing Service Programs

Commands strong margin and growing account retention together as operators increasingly value the warehouse-efficiency advantage from dedicated testing across varied distribution categories served across several regions worldwide. Manufacturers report operators rarely revert to basic crates once a testing program proves effective at scale across their fleets.
Gross Margin: 14-22%

Legacy Fixed-Wall Crates

Represents meaningful fleet volume today but carries the thinnest margin in the category, facing continuous downward price pressure and gradual, multi-year volume loss across most warehouse accounts tracked. Margin expansion depends mainly on fleet scale rather than differentiation here across accounts and regions tracked closely.
Gross Margin: 6-11%

Single-Format Supplier Concentration

A genuine strategic watch-out as producers offering only conventional fixed-wall crates face mounting pressure from validated conversion accelerating across nearly every premium logistics category today and across several regions. Producers slow to diversify risk losing accounts to better-positioned rivals quickly within just a few cycles.

Nesting Relationships Anchor Long Operator Accounts

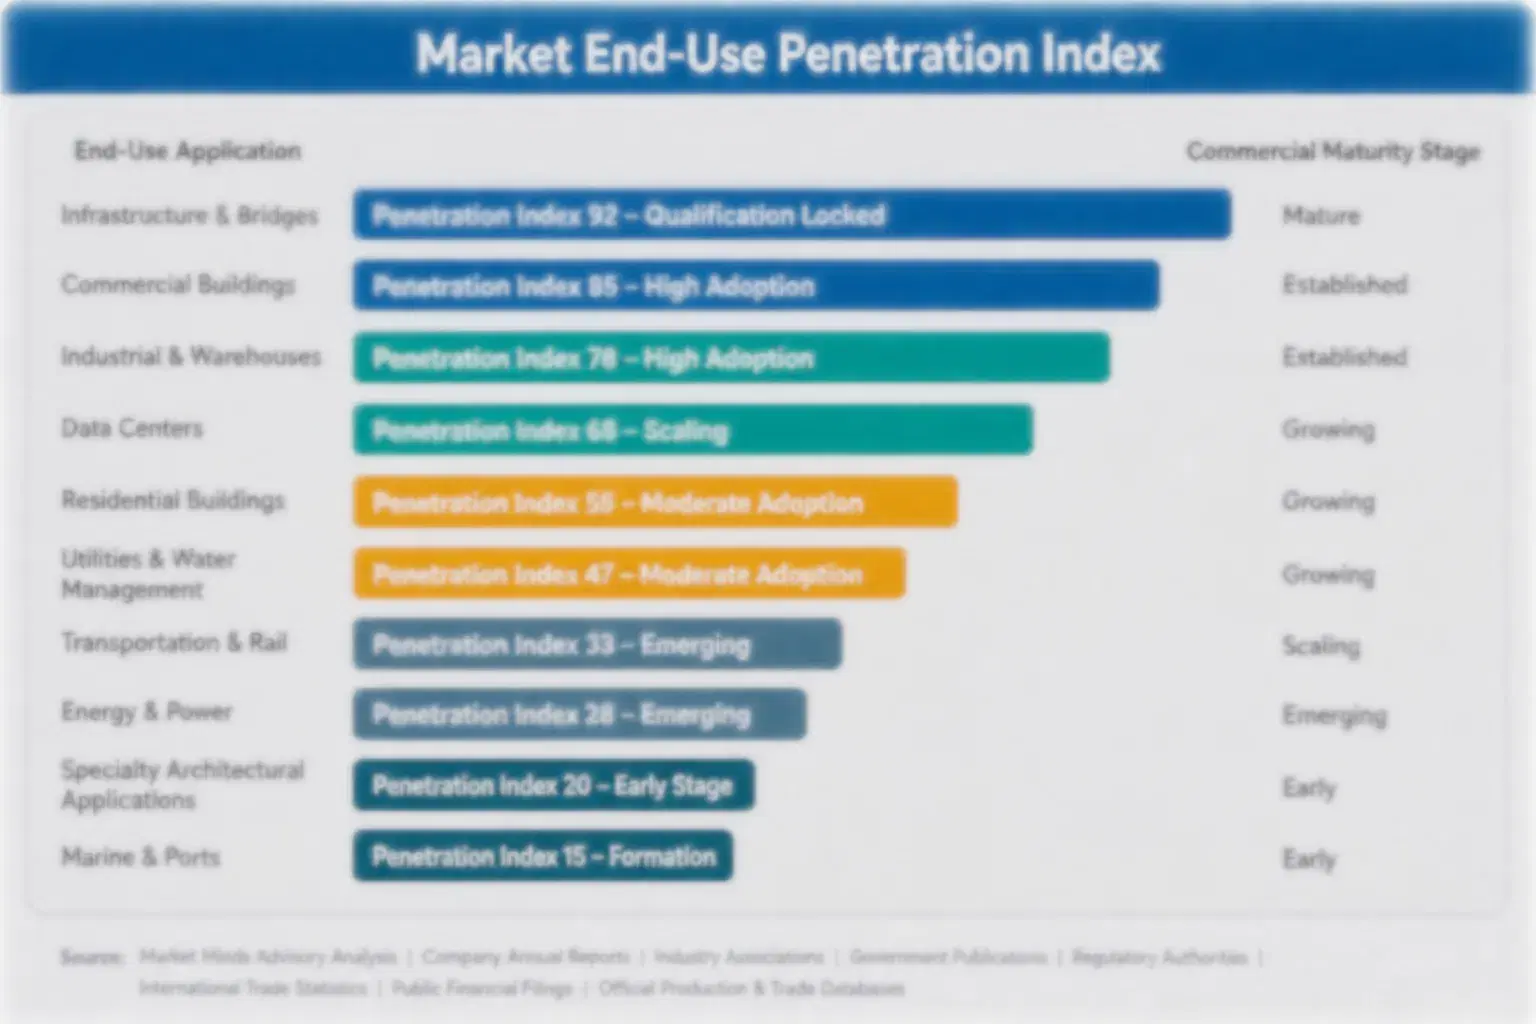
Once an operator adopts a validated stack and nest container specification, the resulting supplier relationship behaves like an annuity for many years afterward, since switching manufacturers requires requalifying nesting reliability and distribution compatibility against internal logistics standards, a costly process most operators avoid absent a serious fleet failure prompting reconsideration of their equipment supplier. Few operators revisit this decision casually once it is made, given the operational cost of requalification involved.
Adoption depth varies by end-use vertical: large multinational automotive and pharmaceutical operators facing acute logistics efficiency pressure adopt validated nesting formats comprehensively across their entire distribution fleet, mid-size regional operators adopt selectively for their highest-volume routes, and smaller independent warehouses remain price-driven and slower to convert absent direct customer pressure of their own driving the purchasing decision. Manufacturers that misjudge this variation risk mismatched fleet investment across their broader account portfolio.

Buyer profiles are shifting as container purchasing decisions move from pure procurement authority toward logistics and operations teams who weigh fleet failure exposure and documented nesting certification alongside raw container price, a change that rewards manufacturers able to speak credibly to both nesting engineering innovation and logistics efficiency economics in the same conversation.
stack-and-nest-containers-market-end-use-penetration-index-1791567250412

Where MMA Sees the Opportunity

These are among the four positions where our research anticipates prominent divergence between winners and laggards over the coming forecast period. Each is grounded in the demand model, the regulatory perimeter, and the announced capacity pipeline.
01 / VALIDATED CONVERSION CAPTURE

Back manufacturers capturing validated conversion early

Validated conversion is becoming the clearest growth opportunity in a market where documented nesting reliability determines which manufacturer wins an operator's long-term relationship across its full distribution fleet. Manufacturers with dedicated conversion sales teams are identifying and winning these accounts faster than rivals waiting for operators to initiate the conversation themselves. We expect this advantage to compound further as logistics efficiency demand broadens, with the largest remaining accounts going to manufacturers who invested earliest in validated nesting capability, a pattern suppliers report holding steady across most tracked accounts.
02 / AUTOMOTIVE FORMAT EXPANSION

Prioritize nesting ratio testing ahead of rivals

Nesting ratio testing programs are shifting from a niche offering into an explicit purchasing requirement as operators face expanding logistics categories they increasingly serve across both developed and emerging markets alike. ORBIS Corporation and Schoeller Allibert already treat this testing capability as a core differentiator in their commercial pitch to pharmaceutical operators. Manufacturers investing early in this service capability are capturing accounts before competitors can match the documented nesting advantage with comparable offerings, a pattern suppliers report holding steady across most tracked accounts.
03 / FLEXIBLE RESIN SOURCING

Expand flexible multi-region sourcing across accounts

Flexible multi-region specialty polypropylene sourcing arrangements are becoming an explicit purchasing requirement as manufacturers increasingly want reliable supply without committing to single-region agreements regardless of actual regional petrochemical conditions they face each production cycle. Manufacturers investing early in this sourcing innovation are capturing accounts before competitors can match the technical achievement with comparable arrangements of their own design and scale. Suppliers report this result holding steady across most tracked regions this cycle, and we expect this advantage to keep compounding further with each passing cycle.
04 / SMALLER OPERATOR PHASED CONVERSION

Expand phased conversion pricing to capture smaller operators

Phased conversion pricing programs targeting smaller emerging agricultural and automotive operators facing the same space efficiency pressure as larger competitors but lacking comparable testing budgets represent a reliable and growing opportunity as this pressure continues spreading across the broader operator base worldwide. Rehrig Pacific Company and Georg Utz Holding have both begun piloting these phased structures with selected regional accounts already. Manufacturers offering flexible phased pricing are converting these accounts faster than those requiring full upfront capital investment, a pattern suppliers report holding steady across most tracked accounts.

Engagement Snapshot From the Field

A live engagement with an industry participant carrying material or product regulatory and market exposure ahead of a defining policy shift, showing how our research translates into a defensible multi-year portfolio strategy.
MARKET MINDS ADVISORY · CLIENT ENGAGEMENT SUMMARY
Stack and Nest Containers Producer Strategic Portfolio Review and Transition Roadmap 2026·Investment Scenario on Stack and Nest Containers Exposure Evaluation 2025-26
CLIENT PROFILE
The client operates a regional automotive parts manufacturer group across two distribution programs in North America, sourcing conventional fixed-wall crates from several regional manufacturers of varying nesting validation depth (client-reported, unverified by MMA). The client faced mounting operational pressure to upgrade space efficiency ahead of an approaching warehouse expansion affecting several of its largest distribution programs.
STRATEGIC CHALLENGE
Leadership needed to decide whether standardizing on validated stack and nest containers across its full distribution fleet ahead of the expansion would strengthen its logistics efficiency position cost-effectively, or whether a phased, slower transition limited to its highest-priority programs remained the more prudent near-term path forward given current budget limits and timing constraints.
MMA APPROACH
MMA conducted a logistics efficiency audit across the client's fleet portfolio benchmarked against comparable automotive manufacturers already standardizing on validated formats, modeled projected fleet failure risk under current and projected distribution trajectories, and built a program-by-program conversion sequencing plan prioritizing the highest-priority programs first throughout the engagement overall. across every phase.
KEY FINDINGS
  1. The client's existing fixed-wall fleet faced a measurable space efficiency gap across one of its two distribution programs compared with competitors already using validated formats.
  2. Projected logistics efficiency improvement and operational positioning gains tied to the client's highest-priority program alone exceeded the projected annual fleet cost premium of full validated conversion.
  3. Supplier consolidation reduced the client's total sourcing complexity and improved negotiating position, cutting per-unit cost by roughly 6% despite the premium fleet specification.
  4. Sequencing conversion by warehouse expansion exposure rather than program size captured the largest early efficiency improvement well before the final program completed its own conversion process.
CLIENT PROFILE
The client operates a regional automotive parts manufacturer group across two distribution programs in North America, sourcing conventional fixed-wall crates from several regional manufacturers of varying nesting validation depth (client-reported, unverified by MMA). The client faced mounting operational pressure to upgrade space efficiency ahead of an approaching warehouse expansion affecting several of its largest distribution programs.
STRATEGIC CHALLENGE
Leadership needed to decide whether standardizing on validated stack and nest containers across its full distribution fleet ahead of the expansion would strengthen its logistics efficiency position cost-effectively, or whether a phased, slower transition limited to its highest-priority programs remained the more prudent near-term path forward given current budget limits and timing constraints.
MMA APPROACH
MMA conducted a logistics efficiency audit across the client's fleet portfolio benchmarked against comparable automotive manufacturers already standardizing on validated formats, modeled projected fleet failure risk under current and projected distribution trajectories, and built a program-by-program conversion sequencing plan prioritizing the highest-priority programs first throughout the engagement overall. across every phase.
KEY FINDINGS
  1. The client's existing fixed-wall fleet faced a measurable space efficiency gap across one of its two distribution programs compared with competitors already using validated formats.
  2. Projected logistics efficiency improvement and operational positioning gains tied to the client's highest-priority program alone exceeded the projected annual fleet cost premium of full validated conversion.
  3. Supplier consolidation reduced the client's total sourcing complexity and improved negotiating position, cutting per-unit cost by roughly 6% despite the premium fleet specification.
  4. Sequencing conversion by warehouse expansion exposure rather than program size captured the largest early efficiency improvement well before the final program completed its own conversion process.
RECOMMENDED STRATEGY
Phase 1: Phase 1 (Months 1 to 4): Convert the highest-exposure distribution program to validated stack and nest containers using the supplier consolidation structure identified during diligence. Phase 2: Phase 2 (Months 5 to 8): Convert the remaining program while renegotiating fleet supply into a single bundled multi-year agreement. Phase 3: Phase 3 (Months 9 to 12): Complete optimization and document efficiency outcomes for operations and leadership review ahead of the next expansion cycle.
OUTCOME
Within twelve months the client completed conversion across its full distribution fleet, strengthening its logistics efficiency position and reporting successful expansion outcomes across its largest programs within the first year of validated adoption (client-reported, unverified by MMA). Leadership credits the phased sequencing with avoiding disruption to ongoing distribution operations.

Frequently Asked Questions

Foundational context covering the market sizes, CAGR, scope, country, region and competition that inform every finding below. This section is provided to cover basics and most often pre-purchase conversations, answered from the MMA Primary Research Dataset.

What is the current size of the Stack and Nest Containers Market?

The market reached an estimated $2.2 billion globally in 2025, covering reusable plastic bins for agricultural, automotive, and pharmaceutical logistics applications across most major categories worldwide.

How large will the Stack and Nest Containers Market be by 2036?

MMA projects the market will reach approximately $4.26 billion by 2036, roughly 1.82 times its 2026 base of $2.34 billion as pharmaceutical and automotive demand both continue expanding steadily.

What is the CAGR for the Stack and Nest Containers Market 2026 to 2036?

The market is projected to grow at a 6.2% compound annual growth rate between 2026 and 2036, with a bull case of 7.3% and a bear case of 5.1%.

Which segment is growing fastest?

Pharmaceutical and medical stack and nest containers are growing fastest at a 7.8% CAGR, roughly 1.26 times the overall market rate, as validated logistics commitments expand across operators worldwide.

Who are the major companies in the Stack and Nest Containers Market?

ORBIS Corporation, Schoeller Allibert, Rehrig Pacific Company, Georg Utz Holding, and Buckhorn lead the market, together holding an estimated 38% combined production share across major categories.

Which country is growing fastest?

The Philippines is growing fastest at an estimated 9.0% CAGR as its agricultural and automotive manufacturing investment expand rapidly across both domestic and export-focused categories this cycle.

How the Stack and Nest Containers Market Is Segmented

The full report scope spans multiple orthogonal segmentation dimensions, with cross-tabulated demand data provided for each dimension pair. Coverage extends further to regional breakdowns, trend trajectories, and the competitive detail needed to support segment-level decision-making.

By End-Use Application

  • Agricultural Harvest Stack and Nest Bins
  • Automotive Parts Stack and Nest Containers
  • Retail Distribution Stack and Nest Totes
  • Industrial Manufacturing Stack and Nest Bins
  • Pharmaceutical and Medical Stack and Nest Containers

By End-Use Industry

  • Agricultural Harvest and Produce Handling
  • Automotive Parts Manufacturing and Distribution
  • Retail and E-Commerce Fulfillment
  • Pharmaceutical and Medical Logistics

By Commercial Dimension

  • Direct Operator Fleet Contracts
  • Pooling Logistics Service Agreements
  • Contract Manufacturing Agreements
  • Index-Linked Pricing Contracts

By Region

  • North America
  • Western Europe
  • East Asia
  • South Asia and Pacific
  • Latin America
  • Middle East and Africa
  • Eastern Europe

Scope, Methodology, and Coverage

Every figure in this report is reproducible from documented input assumptions. The scope below maps the historical period, the forecast horizon, the segmentation dimensions, and the countries covered, alongside the underlying primary and qualitative methodology.
Historical Period
2020 to 2025
Forecast Period
2026 to 2036
Base Year
2025 (USD billions; MMA Primary Research Dataset, October 2026)
Market Definition
This report covers reusable plastic bins designed to stack when full and nest when empty for agricultural harvest, automotive parts, retail distribution, industrial manufacturing, and pharmaceutical logistics applications, excluding wheeled roll cage containers and large-format storage tanks covered in separate MMA reports. This report sizes the global market for these stack and nest container formats.
Quantitative Units
USD billions (current prices); fleet volume in millions of units; typical empty-return volume reduction versus comparable fixed-wall crate formats
Segmentation Dimensions
By End-Use Application; By End-Use Industry; By Commercial Dimension; By Region
Regions Covered
North America, Western Europe, East Asia, South Asia and Pacific, Latin America, Middle East and Africa, Eastern Europe
Countries Covered
USA, Canada, Mexico, Germany, France, Netherlands, Belgium, Italy, China, Japan, South Korea, Philippines, India, Vietnam, Australia, Brazil, Argentina, Colombia, Saudi Arabia, UAE, South Africa, Poland, Romania, Czech Republic, and additional markets relevant to this sector
Key Companies Profiled
ORBIS Corporation, Schoeller Allibert, Rehrig Pacific Company, Georg Utz Holding, Buckhorn, CABKA Group, Craemer Group, Polymer Logistics, IFCO Systems, Nefab Group, Loscam, Myers Industries, Rotom Group, Monoflo International, Akro-Mils, Decade Products, Brambles, SSI Schäfer, Walther Faltsysteme, Bekuplast
Quantitative Methodology
Primary survey, n=3,800 respondents, Q4 2025, six countries; demand-side model with trade association cross-validation
Qualitative Methodology
47 expert interviews, Q4 2025; applied to validate demand model assumptions, identify emerging dynamics, and assess competitive positioning
Report Format
PDF and XLSX data workbook (Word format preview document)
Publisher
Market Minds Advisory
Report Code
MMA-2026-CON-306
Published
October 2026
Contact
sales@marketmindsadvisory.com | www.marketmindsadvisory.com

Purchase the full Stack and Nest Containers Market Report (2026 to 2036).

This report delivers a complete market model for the stack and nest containers market, including segment-level and regional forecasts through 2036 alongside the five-year historical base across agricultural, automotive, and pharmaceutical categories. It profiles twenty reusable logistics container suppliers, benchmarking competitive positioning on nesting validation depth, fleet capability, and shipment volume. The report quantifies the efficiency-driven conversion opportunity by region and models bundled testing and sourcing service contract economics against standard fixed-wall sales. A dedicated chapter models nesting lock-in dynamics by operator account type, with quantified retention estimates by account tier.
Segment and regional forecasts through 2036
Twenty-supplier competitive benchmarking on nesting validation depth
Efficiency-driven conversion opportunity sizing by region
Bundled testing and sourcing service contract economics modeling
Specialty polypropylene resin cost exposure and mitigation chapter
Downloadable data workbook with full regional detail

Built For The People Who Decide

From boardroom strategy to bench-side execution, this report is read cover-to-cover by leaders shaping the next decade of their industry, turning demand scenarios, market dynamics and valuation benchmarks into decisions.
CXOs/ Presidents/ VPs/ Managers
M&A and Corporate Development
Strategy Teams and R&D Heads
Procurement and Product Directors
Regulatory and Compliance Leaders
Investor Relations and Equity Analysts