Market Minds Advisory
4-Wheeled Containers Market

4-Wheeled Containers Market: Modular Compatibility as the New Procurement Standard

Four-wheeled containers now move waste, retail stock, and warehouse inventory through one shared logistics chain, and operators increasingly specify foldable and insulated designs that cut empty-return space and protect temperature-sensitive freight.

Lead Analyst

Bilal Shaikh

Published

September 2026

Make Smarter Decisions with Customized Research Insights

Request a free sample report and evaluate market opportunities, growth trends, and competitive dynamics relevant to your business needs.

2025 MARKET VALUE$3.1BMarket Size 2025
2036 FORECAST VALUE$5.8BBase Case , 2026 to 2036
CAGR 2026 TO 20365.9 %Bull 7.1% / Bear 4.7%
INCREMENTAL OPPORTUNITY$2.5BNet 10- year value creation
EXPANSION MULTIPLE1.76x2036 value over 2026 base
Strategic Levers
M&A Pipeline
Regional Outlook
Country Rankings
Competitive Intelligence
Segmental Deep-dive
Call-Us : 91 93563 13602

Executive Snapshot and Market Trajectory

Facilities managers are done buying one cart type per use case. Waste haulers, retailers, and warehouse operators now specify four-wheeled containers built to nest, fold, or swap modules across multiple applications, converting what was once a single-purpose purchase into a flexible logistics asset that serves multiple departments across a facility.
Foldable and insulated designs are pulling the market forward fastest, as warehouse operators and cold-chain distributors favor space-saving and temperature-protective containers over standard rigid formats. East Asia now holds the largest share of global demand, driven by China's e-commerce fulfillment buildout and expanding municipal waste collection fleets, while South Asia grows fastest as India's organized retail and logistics sector adopts standardized wheeled containers to replace ad hoc handling equipment entirely.
Consolidation is proceeding through regional acquisitions rather than mega-mergers, as larger manufacturers buy local converters to shorten delivery radius on an inherently bulky, low-value-density product. Competitive pressure is intensifying, since Asian manufacturers undercut European incumbents on price for standard rigid containers while large retail and logistics customers demand modular, interchangeable designs, forcing smaller manufacturers to prove compatibility across fleets rather than compete on unit cost.
Market Definition
The four-wheeled containers market covers mobile, four-caster material handling containers used for waste collection, retail stock distribution, warehouse logistics, and temperature-controlled transport within and between facilities. It includes rigid injection-molded, steel, mesh roll cage, insulated, foldable, and anti-static container formats sold as finished units. Two-wheeled bins, fixed dumpsters, and non-mobile storage racks are excluded.
Base Year Value
$3.1B in 2025 (MMA Primary Research Dataset, August 2026)
Forecast Period
2026 to 2036, eleven discrete annual values
CAGR
5.9% base case. Bull 7.1%. Bear 4.7%.
Fastest Growth Segment
Foldable/Collapsible 4-Wheeled Containers: 8.5% CAGR
Fastest Growth Country
China: 9.8% CAGR
Fastest Growth Region
South Asia and Pacific: 7.9% CAGR
Largest Region
East Asia: 26% of 2025 global value
Market Leaders
SSI SCHAFER Group, Sulo GmbH, Otto Environmental Systems, CRAEMER GmbH, Rehrig Pacific Company. Source: MMA Analysis based on company annual reports.
Primary Survey
n=3,800 procurement and R&D decision-makers, Q4 2025, six countries
Methodology
Demand-side build-up, cross-validated against public data, 47 expert interviews

4-Wheeled Containers Market Forecast Scenarios

4-wheeled-containers-market-size-forecast-scenario-1787300309954
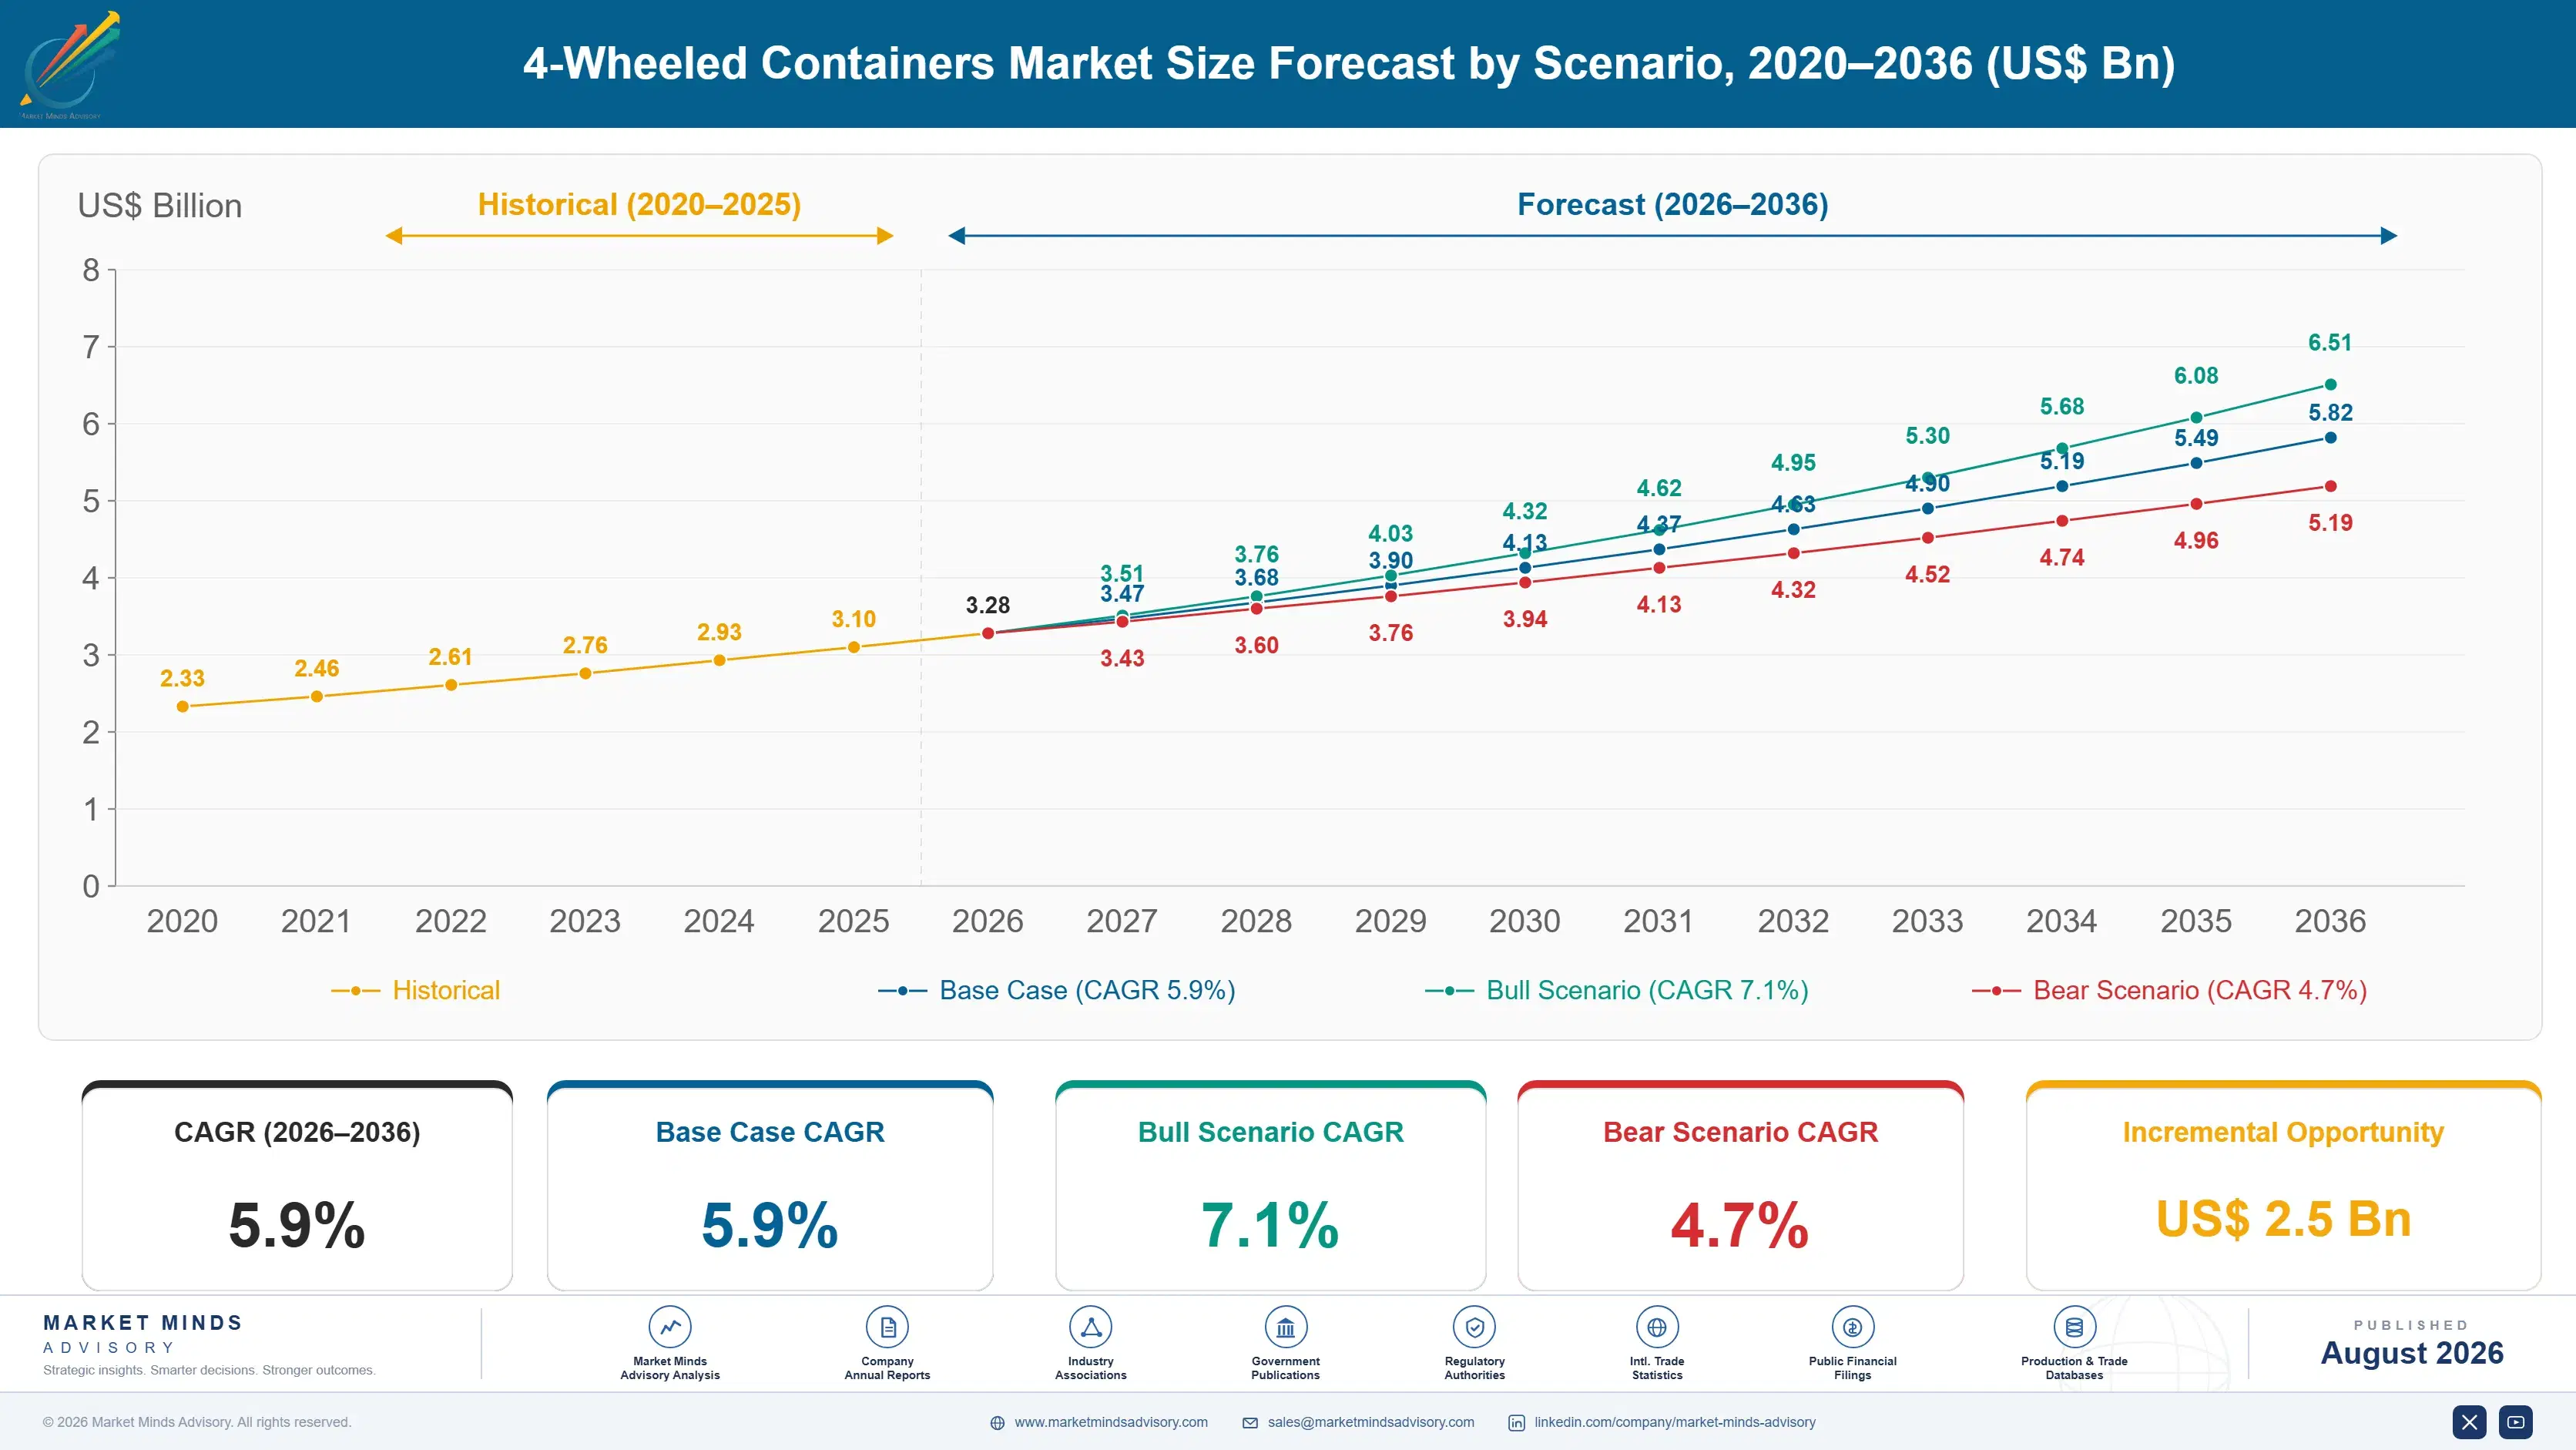
Between 2020 and 2025 the market grew at roughly 5.1% a year, a period shaped by pandemic-driven e-commerce fulfillment expansion followed by steady replacement demand as municipal waste contracts renewed on standard cycles. Warehouse automation investment accelerated adoption of standardized, stackable container formats compatible with automated guided vehicles, a requirement that barely existed in mainstream procurement specifications five years earlier.
The base case carries the market to 5.8 billion dollars by 2036 on three mechanisms. First, municipal waste collection programs across Asia and Latin America are standardizing on wheeled containers as informal collection gives way to organized municipal contracts. Second, e-commerce fulfillment and retail distribution centers are replacing mixed cart fleets with modular, interchangeable container systems that reduce handling labor. Third, cold-chain and pharmaceutical logistics are pulling demand toward insulated containers as temperature-controlled distribution expands beyond traditional food categories.
The bull case reaches roughly 7.1% annual growth if municipal waste modernization programs in developing markets accelerate faster than currently planned and warehouse automation adoption broadens further. The bear case falls near 4.7% if municipal budget constraints and slower retail capital spending push operators to extend the service life of existing container fleets rather than replace them on schedule.

Where Modularity Becomes the Procurement Standard

Four-wheeled containers used to be a facilities afterthought; now they are a specified logistics asset that shows up in warehouse automation plans and municipal procurement contracts alike. Every caster, hinge, and modular attachment point exists to keep a container moving through a specific handling system, whether that is an automated guided vehicle path or a weekly curbside collection route. That system compatibility, not container cost alone, increasingly decides which manufacturer wins the
MARKET CONCENTRATION (CR5)22%Top five manufacturers hold under one quarter of volume
AVERAGE SELLING PRICEUSD 145 per unitBlended price across HDPE, steel, and mesh formats
TOP PRODUCING COUNTRY SHAREChina, 23% of global outputLargest single national source of container manufacturing volume
FLEET REPLACEMENT RATE9% of installed base annuallyShare of containers replaced each year across major fleets
TRADE INTENSITY27% cross-borderJust over a quarter of unit volume crosses a border
SERVICE LIFE8 to 12 years averageTypical operating years before full container replacement occurs
Commercially the market behaves like an industrial equipment business wearing a simple product label. Unit cost is modest, but the engineering behind caster load rating, stacking geometry, and automation compatibility creates real differentiation between manufacturers competing for large fleet contracts. Municipal and retail buyers rarely switch container specifications mid-contract, since a fleet built around one manufacturer's stacking and coupling geometry is expensive to replace piecemeal with an incompatible alternative from a rival.
The next decade turns on three forces: municipal waste collection modernizing across developing markets, warehouse automation demanding standardized container geometry, and cold-chain logistics pulling volume toward insulated formats. Manufacturers positioned across all three forces will set the pace industry-wide, and those exposed to only one will fall behind.
"Buyers used to ask what a container costs. Now they ask whether it fits the automation system three procurement cycles from now, because ripping out an incompatible fleet costs far more than the containers ever did."
Director, Industrial Material Handling Practice · MMA Construction and Industria

Market Trends

Warehouse Automation Standardizes Container Fleet Geometry

Automated guided vehicles and robotic picking systems require containers built to precise, standardized dimensions and caster specifications, since even small deviations in footprint or wheel placement can disrupt an automated handling system tuned to a specific container geometry. Warehouse operators investing in automation are increasingly specifying container fleets as part of the same capital project as the automation system itself, rather than treating containers as a separate, later procurement decision. That bundling gives manufacturers with proven automation-compatible designs a real advantage over competitors offering only generic containers, since a mismatched container can force a costly automation system reconfiguration after installation.
Market Impact: Cuts handling labor cost 18%
Municipal Waste Contracts Standardize on Wheeled Bins

Municipalities across Asia and Latin America are formalizing waste collection through organized contracts rather than informal collection, and every formal contract specifies standardized wheeled containers sized to match mechanized collection truck lifting systems rather than the mixed, ad hoc bins informal collection tolerated. That formalization converts what was once discretionary household purchasing into large, multi-year municipal procurement contracts awarded through competitive tender. Manufacturers with proven track records supplying large municipal fleets are winning repeat contracts directly from cities scaling up their collection programs, since municipalities strongly prefer a known, compatible supplier over resubmitting specifications to open bid every contract cycle.
Market Impact: Adds demand across 400+ cold-chain routes

Market Opportunities and Growth Drivers

E-Commerce Fulfillment Replaces Mixed Cart Fleets

E-commerce fulfillment centers move inventory through far more handling cycles per day than traditional retail backrooms, and a mixed fleet of incompatible carts and containers slows throughput every time a worker switches handling technique between container types. Standardized, modular four-wheeled containers that nest, stack, and couple consistently let fulfillment operators move inventory through picking, packing, and shipping stages without that friction, directly reducing labor cost per unit handled. Major e-commerce logistics operators have specified modular standardization as a company-wide requirement, converting a facility-by-facility procurement decision into a centralized specification applied across the network.
Market Impact: Raises switching cost 3 to 4x

Cold-Chain Logistics Expands Insulated Container Demand

Temperature-controlled distribution is expanding well beyond traditional frozen and fresh food categories into pharmaceuticals, specialty chemicals, and increasingly meal-kit and grocery e-commerce delivery, and every one of those distribution chains needs insulated four-wheeled containers to maintain product temperature during transit and short-term storage. That expansion creates genuinely new addressable demand rather than share shifted from standard rigid containers, since insulated formats serve a distinct protection function standard containers cannot provide. Manufacturers with proven insulated designs are winning specification across pharmaceutical distribution networks, where temperature excursion documentation requirements make container performance a compliance concern rather than a convenience feature.
Market Impact: Cuts margin 4 to 7 points

Market Restraints and Challenges

Fleet Incompatibility Raises Switching Costs Sharply

Once a warehouse or municipal fleet standardizes on one manufacturer's stacking, coupling, and caster geometry, switching to a competitor's containers mid-fleet creates real operational friction, since incompatible containers cannot nest, stack, or couple with the existing fleet without costly workarounds. The root cause is that manufacturers have historically designed proprietary geometry specifically to create that lock-in, rather than converging on shared industry standards the way pallet dimensions eventually did. That lock-in raises switching costs high enough that buyers stay with an underperforming supplier rather than mix in a competitor's container. Some large buyers now mitigate the risk by writing open-geometry compatibility requirements into new procurement specifications.
Market Impact: Requires compatibility in 60% of specs

Resin and Steel Cost Volatility Pressures Margins

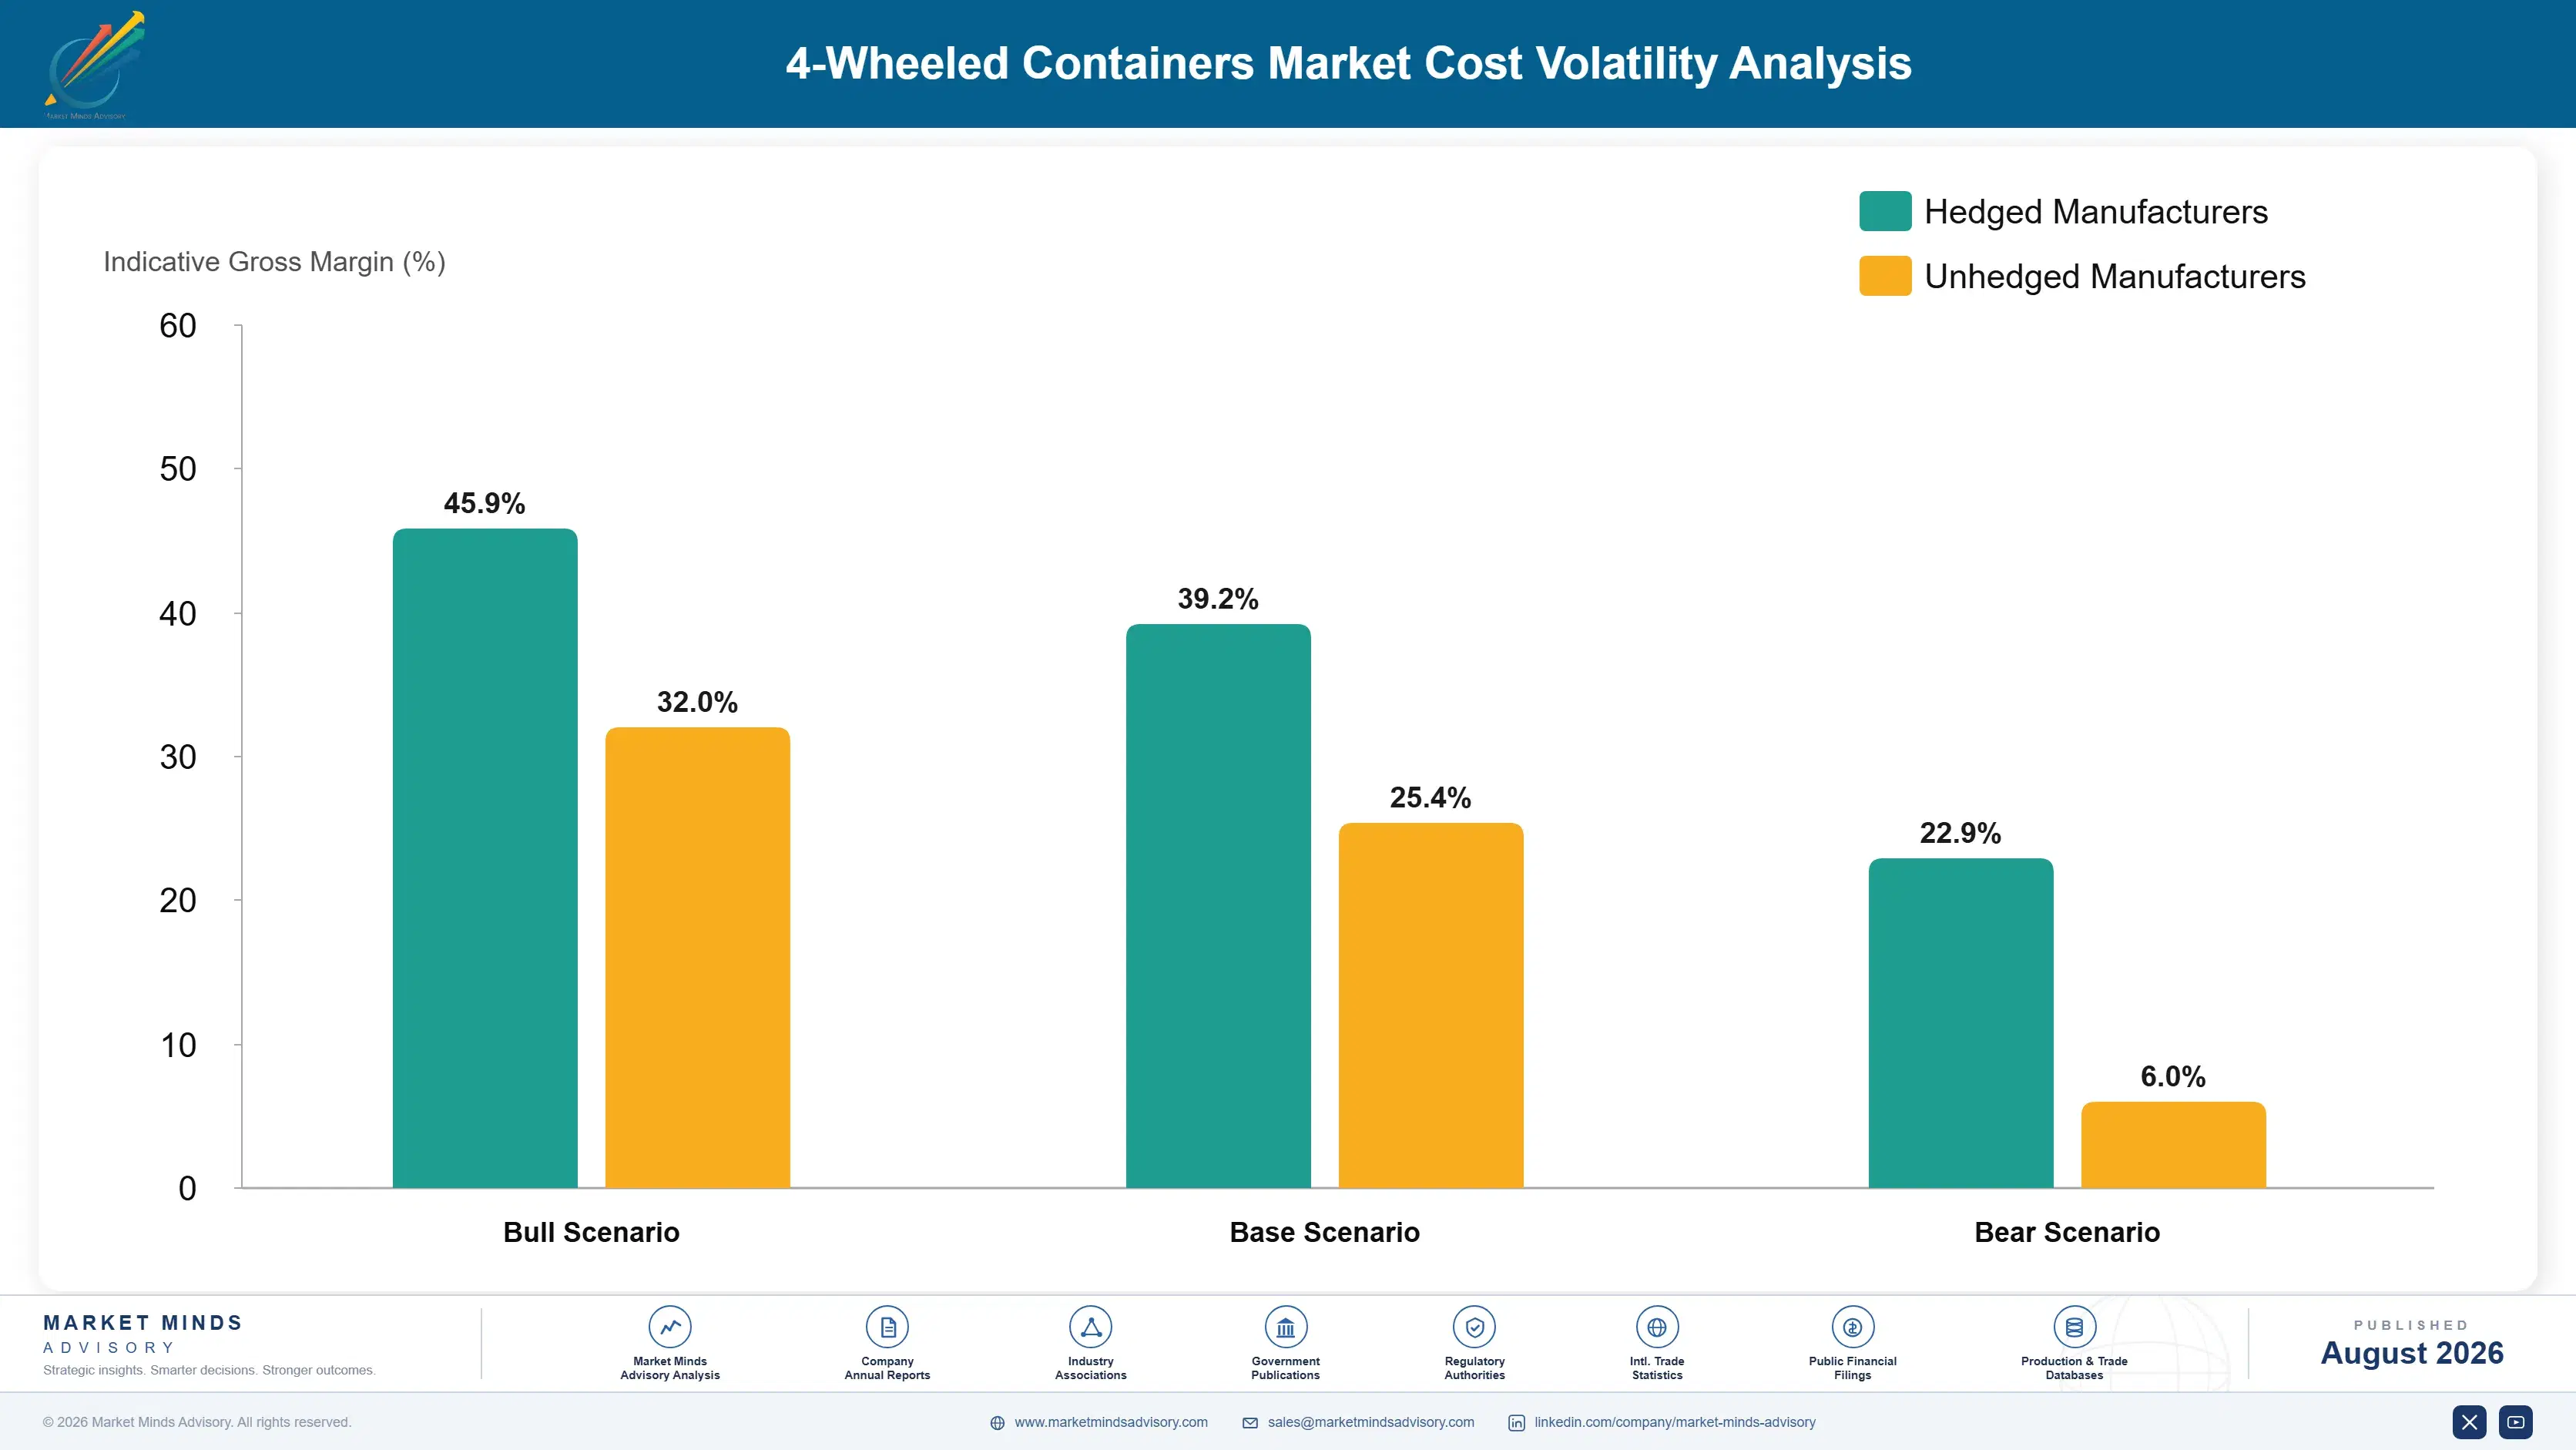
HDPE resin and structural steel costs both swing meaningfully with broader petrochemical and metals commodity cycles, and manufacturers on multi-year fixed-price municipal and retail contracts absorb that volatility directly without the ability to pass cost increases through mid-contract. The root cause is that municipal procurement favors long, fixed-price contracts specifically to protect budget predictability, which shifts commodity price risk entirely onto the manufacturer for the full term. That structure squeezes margins hardest during price spikes, precisely when manufacturers can least afford it. Some manufacturers now negotiate indexed pricing clauses into new municipal contracts to share that volatility risk going forward.
Market Impact: Wins contracts across 300+ new cities
3 additional market trends, 3 additional growth drivers, and 4 additional restraints and challenges are covered in the full report. Contact sales@marketmindsadvisory.com to access the complete intelligence.

Segment CAGR and Growth Architecture

Segmentation follows container material and construction type, a single materials-science logic that groups four-wheeled containers by the structural material and design approach used rather than by end application. Each construction type carries its own cost structure, load rating, and durability profile, so commercial position tracks the material choice rather than the facility that eventually deploys it.
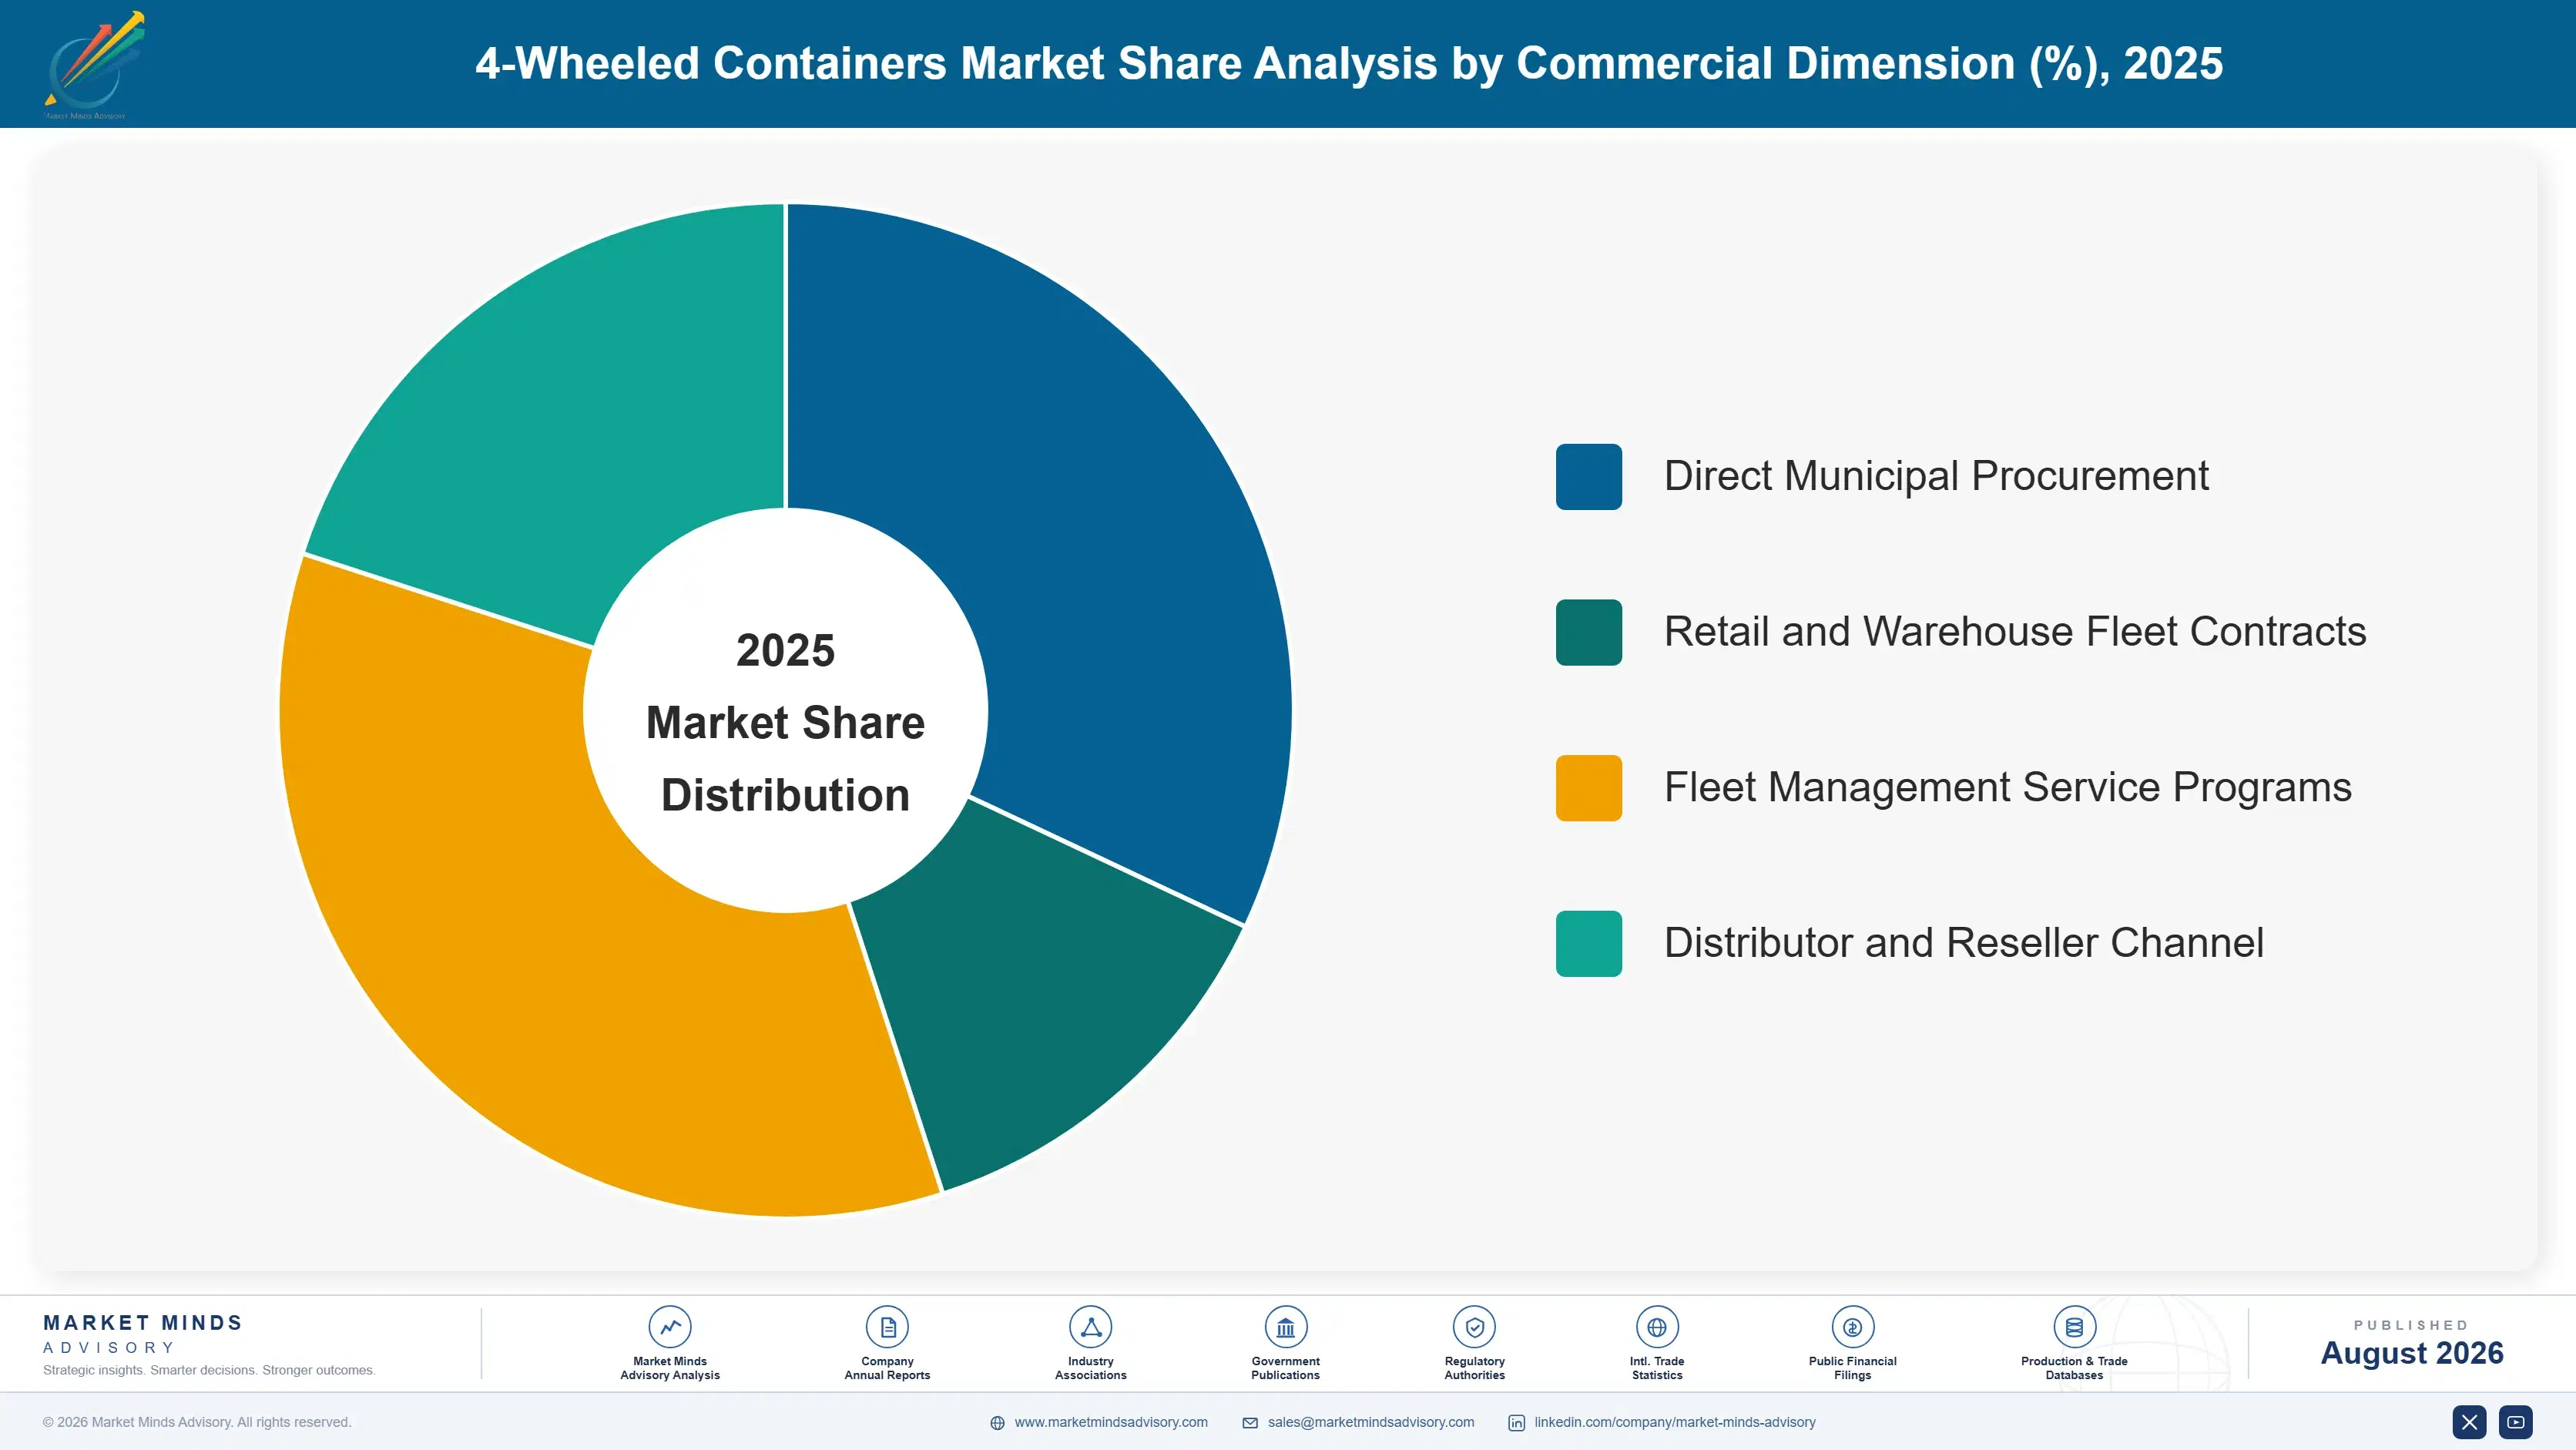
4-wheeled-containers-market-market-share-analysis-1787300310523

Foldable/Collapsible 4-Wheeled Containers

Foldable and collapsible four-wheeled containers grow fastest at 8.5%, about 1.44 times the overall market rate, as warehouse and retail operators managing constrained storage space favor containers that collapse to a fraction of their loaded footprint for empty-return transport and off-season storage. Standard rigid containers occupy the same footprint whether loaded or empty, wasting valuable trailer and storage space on the return leg that foldable designs largely eliminate. Retailers with dense urban store networks and limited backroom storage have driven much of the early adoption, since space efficiency matters more in constrained urban locations than in large suburban centers. Manufacturers with proven folding durability are winning specification directly from rigid-container incumbents on total logistics cost rather than unit price.
CAGR 8.5%

Insulated/Thermal 4-Wheeled Containers

Insulated and thermal four-wheeled containers grow second-fastest at 7.5%, driven directly by cold-chain distribution expanding beyond traditional frozen food into pharmaceuticals, specialty chemicals, and grocery e-commerce delivery that require temperature-controlled transport and short-term storage. Insulated construction adds meaningful cost and weight over standard rigid containers, but that premium is increasingly justified by temperature excursion documentation requirements that pharmaceutical and specialty food distribution now demand as routine rather than as an occasional customer request. The segment commands the highest price per unit of any container format, reflecting both insulation material cost and the specialized sealing and monitoring integration bundled into premium designs. Growth concentrates in pharmaceutical distribution and grocery e-commerce delivery, where temperature failure carries genuine financial and regulatory consequences.
CAGR 7.5%
Full segment breakdown across 6 segments available in the complete report.

Regional Architecture and Country Demand Map

Demand concentrates where e-commerce fulfillment scale and municipal waste modernization intersect with manufacturing capacity, which increasingly means East Asia rather than the historically dominant North American base. China's fulfillment buildout and expanding municipal collection fleets are pulling deployment east even as North America retains the deepest automation-driven per-facility spend.

North America

North America holds 24% of global value, still commanding the deepest automation-driven per-facility spend anywhere given the scale of its e-commerce fulfillment network buildout. Rehrig Pacific and SSI SCHAFER both run core manufacturing and technical support from domestic operations, giving American warehouse and municipal buyers direct access to custom container design and rapid fleet replenishment. Growth of 6.4% tracks steady replacement of aging municipal waste fleets alongside continuing fulfillment center expansion, rather than any single dominant demand driver. Municipal waste collection penetration is already near saturation across most major American cities, so growth here comes primarily from warehouse automation-driven replacement and insulated cold-chain container adoption rather than new addressable municipal volume.
Share: 24% | CAGR: 6.4% (2026 to 2036)

Western Europe

Western Europe accounts for 22% of value, a mature base shaped by some of the world's earliest organized municipal waste collection systems and dense, automation-forward warehouse logistics networks. Sulo and CRAEMER, both German manufacturers, hold deep engineering expertise in wheeled waste container design built up over decades supplying municipal collection contracts across the continent. Warehouse automation adoption runs ahead of most other regions here, giving European manufacturers early experience designing automation-compatible container geometry that increasingly translates into export wins elsewhere. Growth of 4.4% trails the global rate directly because the region's municipal and retail infrastructure is largely mature, with growth concentrated in automation-driven replacement rather than new municipal fleet formation.
Share: 22% | CAGR: 4.4% (2026 to 2036)
Regional intelligence for 5 additional markets available in the complete report: East Asia, South Asia and Pacific, Latin America, Middle East and Africa, Eastern Europe. Contact sales@marketmindsadvisory.com.
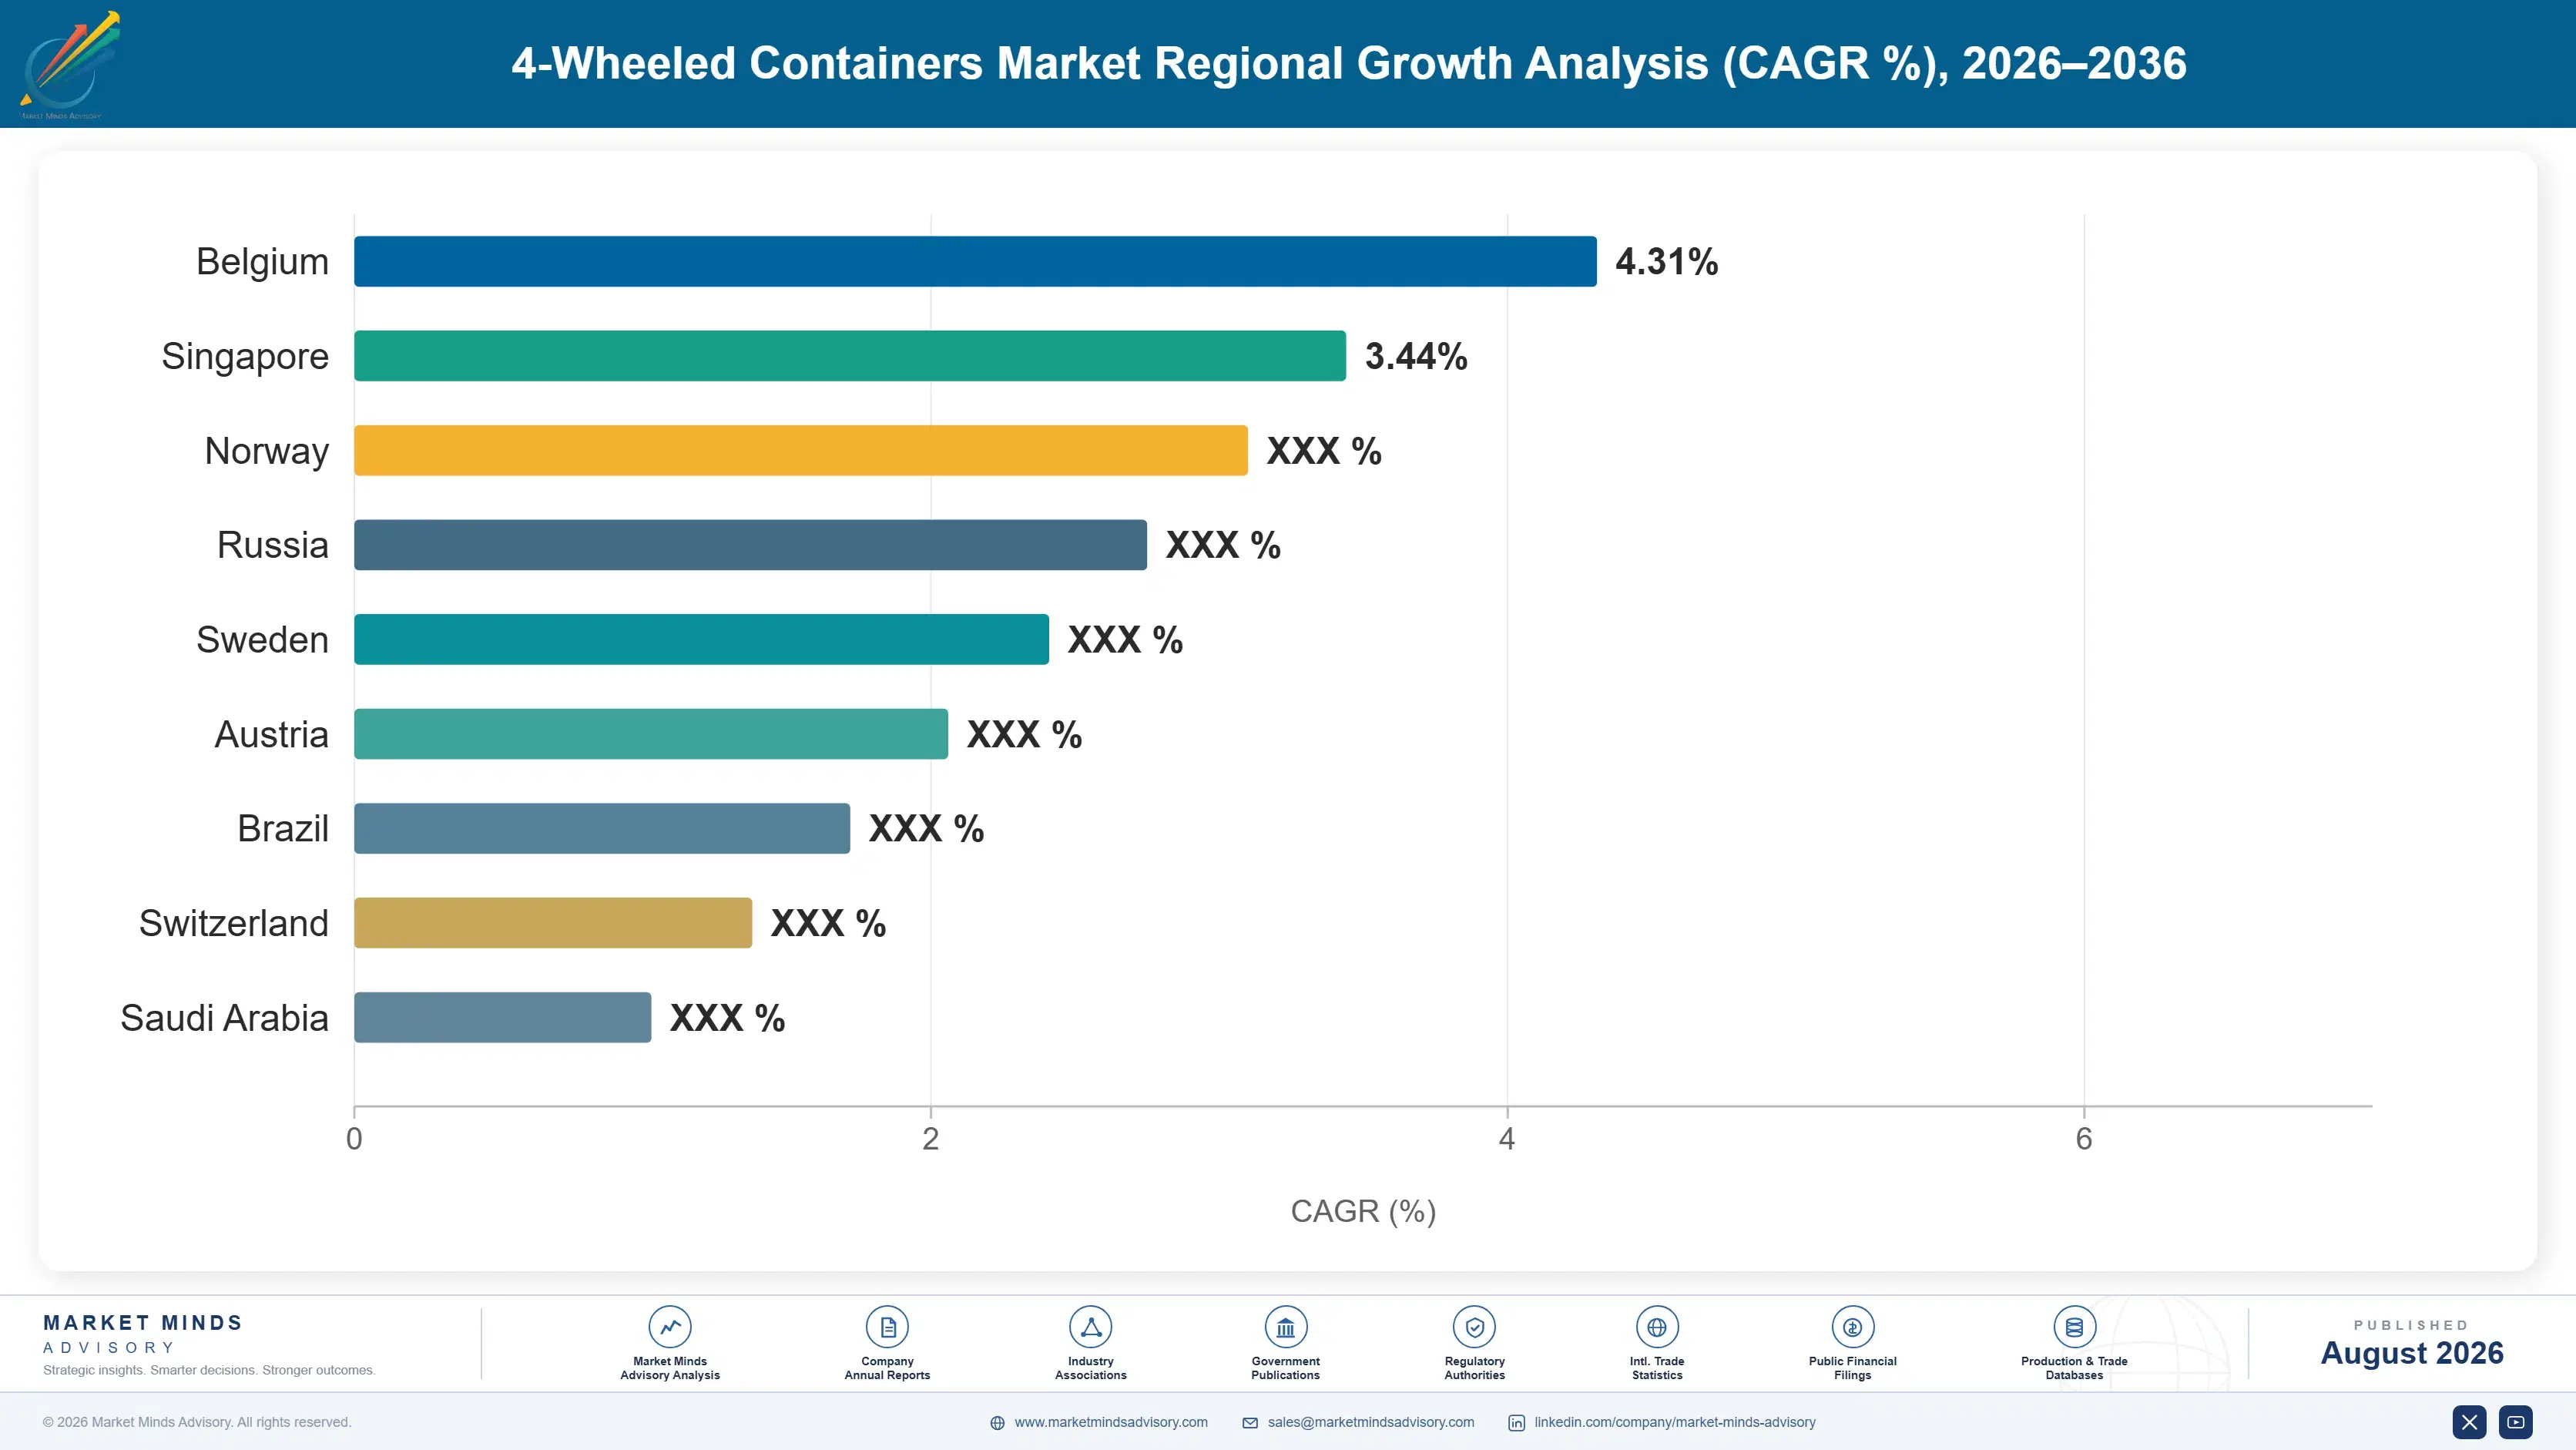
4-wheeled-containers-market-country-cagr-analysis-1787300311034

How Manufacturers Can Defend Fleet Margin

Selling a container as a one-time commodity purchase leaves the highest-margin part of this market on the table. The four moves below shift revenue toward positions that command a premium over standard rigid formats: automation-compatibility certification, modular interchangeability programs, fleet management services, and insulated designs that capture cold-chain distribution growth across every customer account.

Certify Automation Compatibility For Warehouse Buyers

Manufacturers that invest in formal automation-compatibility certification, testing container geometry against major automated guided vehicle and robotic picking platforms, capture a documented price premium of roughly 10% to 16% from warehouse operators who need guaranteed compatibility before committing to a multi-year automation investment. That certification cost runs into real engineering and testing money upfront, but it converts a generic container sale into a qualified component of the customer's automation system, a relationship competitors offering only uncertified containers cannot match on price. SSI SCHAFER and Rehrig Pacific have both built certification programs to capture this premium.
Market Impact: Captures a 10% to 16% automation certification premium

Build Modular Interchangeability Across Product Lines

Designing container lines with shared stacking, coupling, and caster geometry across the full product range, rather than treating each container type as a standalone design, lets manufacturers sell a customer their first container and then expand the relationship across every subsequent container type needed without an incompatible fleet transition later. That interchangeability typically captures 20% to 30% more total account value over a five-year relationship than selling only a single container type, since the customer has no reason to add a second, incompatible supplier once the first fleet is established. Several manufacturers have restructured their product architecture around this principle.
Market Impact: Captures 20% to 30% more total account value

Offer Fleet Management And Maintenance Services

Bundling ongoing fleet maintenance, caster replacement, and lifecycle tracking as a paid service, rather than selling containers as a one-time transaction, captures recurring revenue from municipal and retail customers who need predictable container uptime without building internal maintenance capability. Manufacturers offering this service typically charge 12% to 18% of original fleet value annually, since the customer would otherwise build and staff an internal maintenance function at a materially higher cost than the fee represents. The approach also deepens the customer relationship, since a manufacturer managing a customer's fleet directly sees replacement needs before the customer's own team does.
Market Impact: Charges 12% to 18% of fleet value annually

Expand Into Insulated Cold-Chain Container Lines

Manufacturers that add insulated and thermal container lines to their standard rigid product range capture the highest per-unit margins in the category, since cold-chain and pharmaceutical distribution customers pay a substantial premium for documented temperature performance rather than treating insulation as an optional feature, often 25% to 35% above a standard rigid equivalent unit. That expansion requires real investment in insulation sourcing and thermal testing capability, but it opens a faster-growing customer segment adjacent to a manufacturer's existing standard container relationships rather than requiring an entirely new customer base. Several standard-container manufacturers have added insulated lines to capture cold-chain growth without ceding that segment to specialists.
Market Impact: Captures a 25% to 35% higher unit margin

Who Controls the Margin Pool

Concentration sits at a low CR5 of 22%, reflecting a market fragmented across regional manufacturers serving local municipal and retail relationships rather than global scale. The gap between the top five and the next tier is real but moderate: leaders combine automation-certified engineering with broad product lines, while challengers typically compete only on standard rigid formats. All participants here are assessed on one basis: disclosed container segment revenue.
Competition today runs across three dimensions. First, automation-compatibility depth, since a manufacturer certified against major automated handling platforms wins warehouse specification decisions competitors cannot match. Second, modular interchangeability, as large fleet buyers increasingly favor manufacturers offering compatible container lines across their entire product range. Third, fleet service capability, since manufacturers who bundle maintenance capture recurring revenue competitors selling only hardware cannot access.

Pressure is building from Asian manufacturers who have closed much of the engineering gap on standard rigid formats while undercutting Western incumbents sharply on price. Insulated-container specialists are pushing into standard territory from the premium side, competing directly against established manufacturers on cold-chain contracts. Rankings will shift toward manufacturers who pair automation certification with genuine modular interchangeability, since neither alone is enough.
4-wheeled-containers-market-company-positioning-matrix-1787300311548

Competitive Moat and Risk Dimensions

SSI SCHAFER GROUP

Moat: Deep Warehouse Automation Integration

SSI SCHAFER's core business spans warehouse automation systems alongside container manufacturing, giving it unmatched insight into designing containers that integrate cleanly with its own and competitors' automated handling equipment. That combined expertise makes it the default specification for warehouse operators investing in automation who want container and system compatibility guaranteed by a single accountable supplier.
SSI SCHAFER GROUP

Risk: Complexity Managing Dual Business Lines

Operating both automation systems and container manufacturing creates internal complexity and occasionally conflicting incentives, since customers using competitor automation systems may question whether SSI SCHAFER's containers are genuinely optimized for their platform or subtly favor its own automation business instead. Competitors positioned as neutral, automation-agnostic container specialists can win business specifically on that independence.
SULO GMBH

Moat: Established Municipal Waste Contract Base

Sulo has supplied municipal waste collection contracts across Europe for decades, building an installed base and contract renewal relationship that gives it a genuine incumbency advantage when cities rebid collection container contracts. That accumulated municipal relationship and proven collection-truck compatibility make it the default bid recipient for large European municipal renewal contracts.
SULO GMBH

Risk: Exposure To European Municipal Budgets

Sulo's revenue concentration in European municipal waste contracts leaves it directly exposed to municipal budget cycles and public procurement timelines that move more slowly and unpredictably than private retail or warehouse capital spending. As municipal budgets tighten in several European markets, Sulo's core revenue base faces more direct pressure than diversified competitors serving multiple customer segments.

Key Players

SSI SCHAFER Group
Sulo GmbH
Otto Environmental Systems
CRAEMER GmbH
Rehrig Pacific Company

Others

Toter LLC
Cascade Engineering Inc.
Rotonics Manufacturing Inc.
Norseman Plastics Ltd.
Wanzl GmbH & Co. KGaA
IPL Inc.
Nordic Plastic Group
PWS Distribution Ltd.
Bonar Plastics Inc.
Zarges GmbH
Georg Utz Holding AG
Buckhorn Inc.
Loscam Limited
Contraload B.V.
Rotom Group

Recent Developments

FEBRUARY 2025

SSI SCHAFER Opens Automation-Compatible Container Testing Lab

SSI SCHAFER opened a dedicated testing laboratory to certify container compatibility against major automated guided vehicle and robotic picking platforms from multiple vendors. The organic investment, not a joint venture or acquisition, followed two years of rising warehouse operator demand for documented automation-compatibility certification ahead of large-scale automation investment decisions.
Signal: Signals that manufacturers are building formal certification infrastructure rather than relying on informal automation compatibility claims.
OCTOBER 2024

Sulo Acquires Regional Insulated Container Specialist

Sulo completed the acquisition of a regional insulated container manufacturer for an undisclosed sum, adding thermal and cold-chain container capability to its existing municipal waste container business. The deal gives Sulo direct insulated container capability it previously lacked, positioning it to bid on cold-chain distribution contracts.
Signal: Signals that municipal container manufacturers are diversifying into cold-chain capability through acquisition rather than organic development.
JUNE 2025

Rehrig Pacific and a Chinese Fulfillment Operator Form Container Supply Partnership

Rehrig Pacific and a major Chinese e-commerce fulfillment operator formed a partnership to supply standardized modular containers across the operator's expanding distribution center network in China. The partnership targets deployment across dozens of fulfillment facilities within three years, combining Rehrig's container design with its partner's fulfillment network scale.
Signal: Signals that Western manufacturers increasingly need a local partner to navigate Chinese fulfillment center procurement rules.

Resin and Steel Cost Exposure

HDPE resin and structural steel together make up roughly 45% to 55% of cost of goods sold across four-wheeled containers, since the container body and frame represent the bulk of the manufactured product with modest cost for casters and hardware. Resin costs trace to petrochemical feedstock pricing, while steel costs track broader global metals cycles independently of plastics.
The 2021 to 2022 resin and steel price spike illustrated the exposure directly. EIA and industry data recorded polyethylene and steel prices reaching multi-year highs through 2021 as petrochemical feedstock costs and metals demand both surged alongside broader supply disruption. SSI SCHAFER's 2022 Annual Report disclosed raw material cost inflation across its logistics systems segment, attributing margin pressure to resin and steel costs that took several quarters to fully pass through to customer pricing.

Smaller regional manufacturers without long-term material supply agreements absorbed the price spike hardest, since their purchase volumes were too small to secure the multi-year fixed pricing that larger manufacturers like SSI SCHAFER and Sulo negotiate directly with resin and steel producers. That gap compounds: large manufacturers pre-purchase material months ahead using balance sheet capacity smaller competitors do not have, leaving regional specialists exposed every commodity cycle.
4-wheeled-containers-market-cost-volatility-analysis-1787300311746

Secure Multi-Year Resin and Steel Agreements

Negotiating multi-year fixed or indexed pricing agreements directly with resin and steel producers, rather than buying on the spot market, secures allocation priority during shortage cycles and smooths input cost volatility. The approach requires committing to volume forecasts years in advance, a real forecasting risk, but it has protected larger manufacturers' margins through two separate commodity price spikes since 2020.

Diversify Between Resin and Steel Construction

Offering both HDPE resin and steel construction options across a product line, rather than committing entirely to one material, reduces exposure to any single commodity market's price cycle. Requalification takes real engineering and load-testing time, so manufacturers are prioritizing it for their highest-volume product lines first before extending diversified material options across their full catalog over time.

Pass Through Cost Via Indexed Municipal Pricing

Structuring municipal and retail supply agreements with pricing indexed to published resin and steel cost benchmarks, rather than fixed multi-year pricing, shifts some volatility risk back to customers who have more flexibility to absorb short-term cost swings. Large customers have increasingly accepted indexed terms in exchange for guaranteed allocation during tight commodity markets, a trade manufacturers use to protect margin.

Portfolio Architecture for Margin Defence

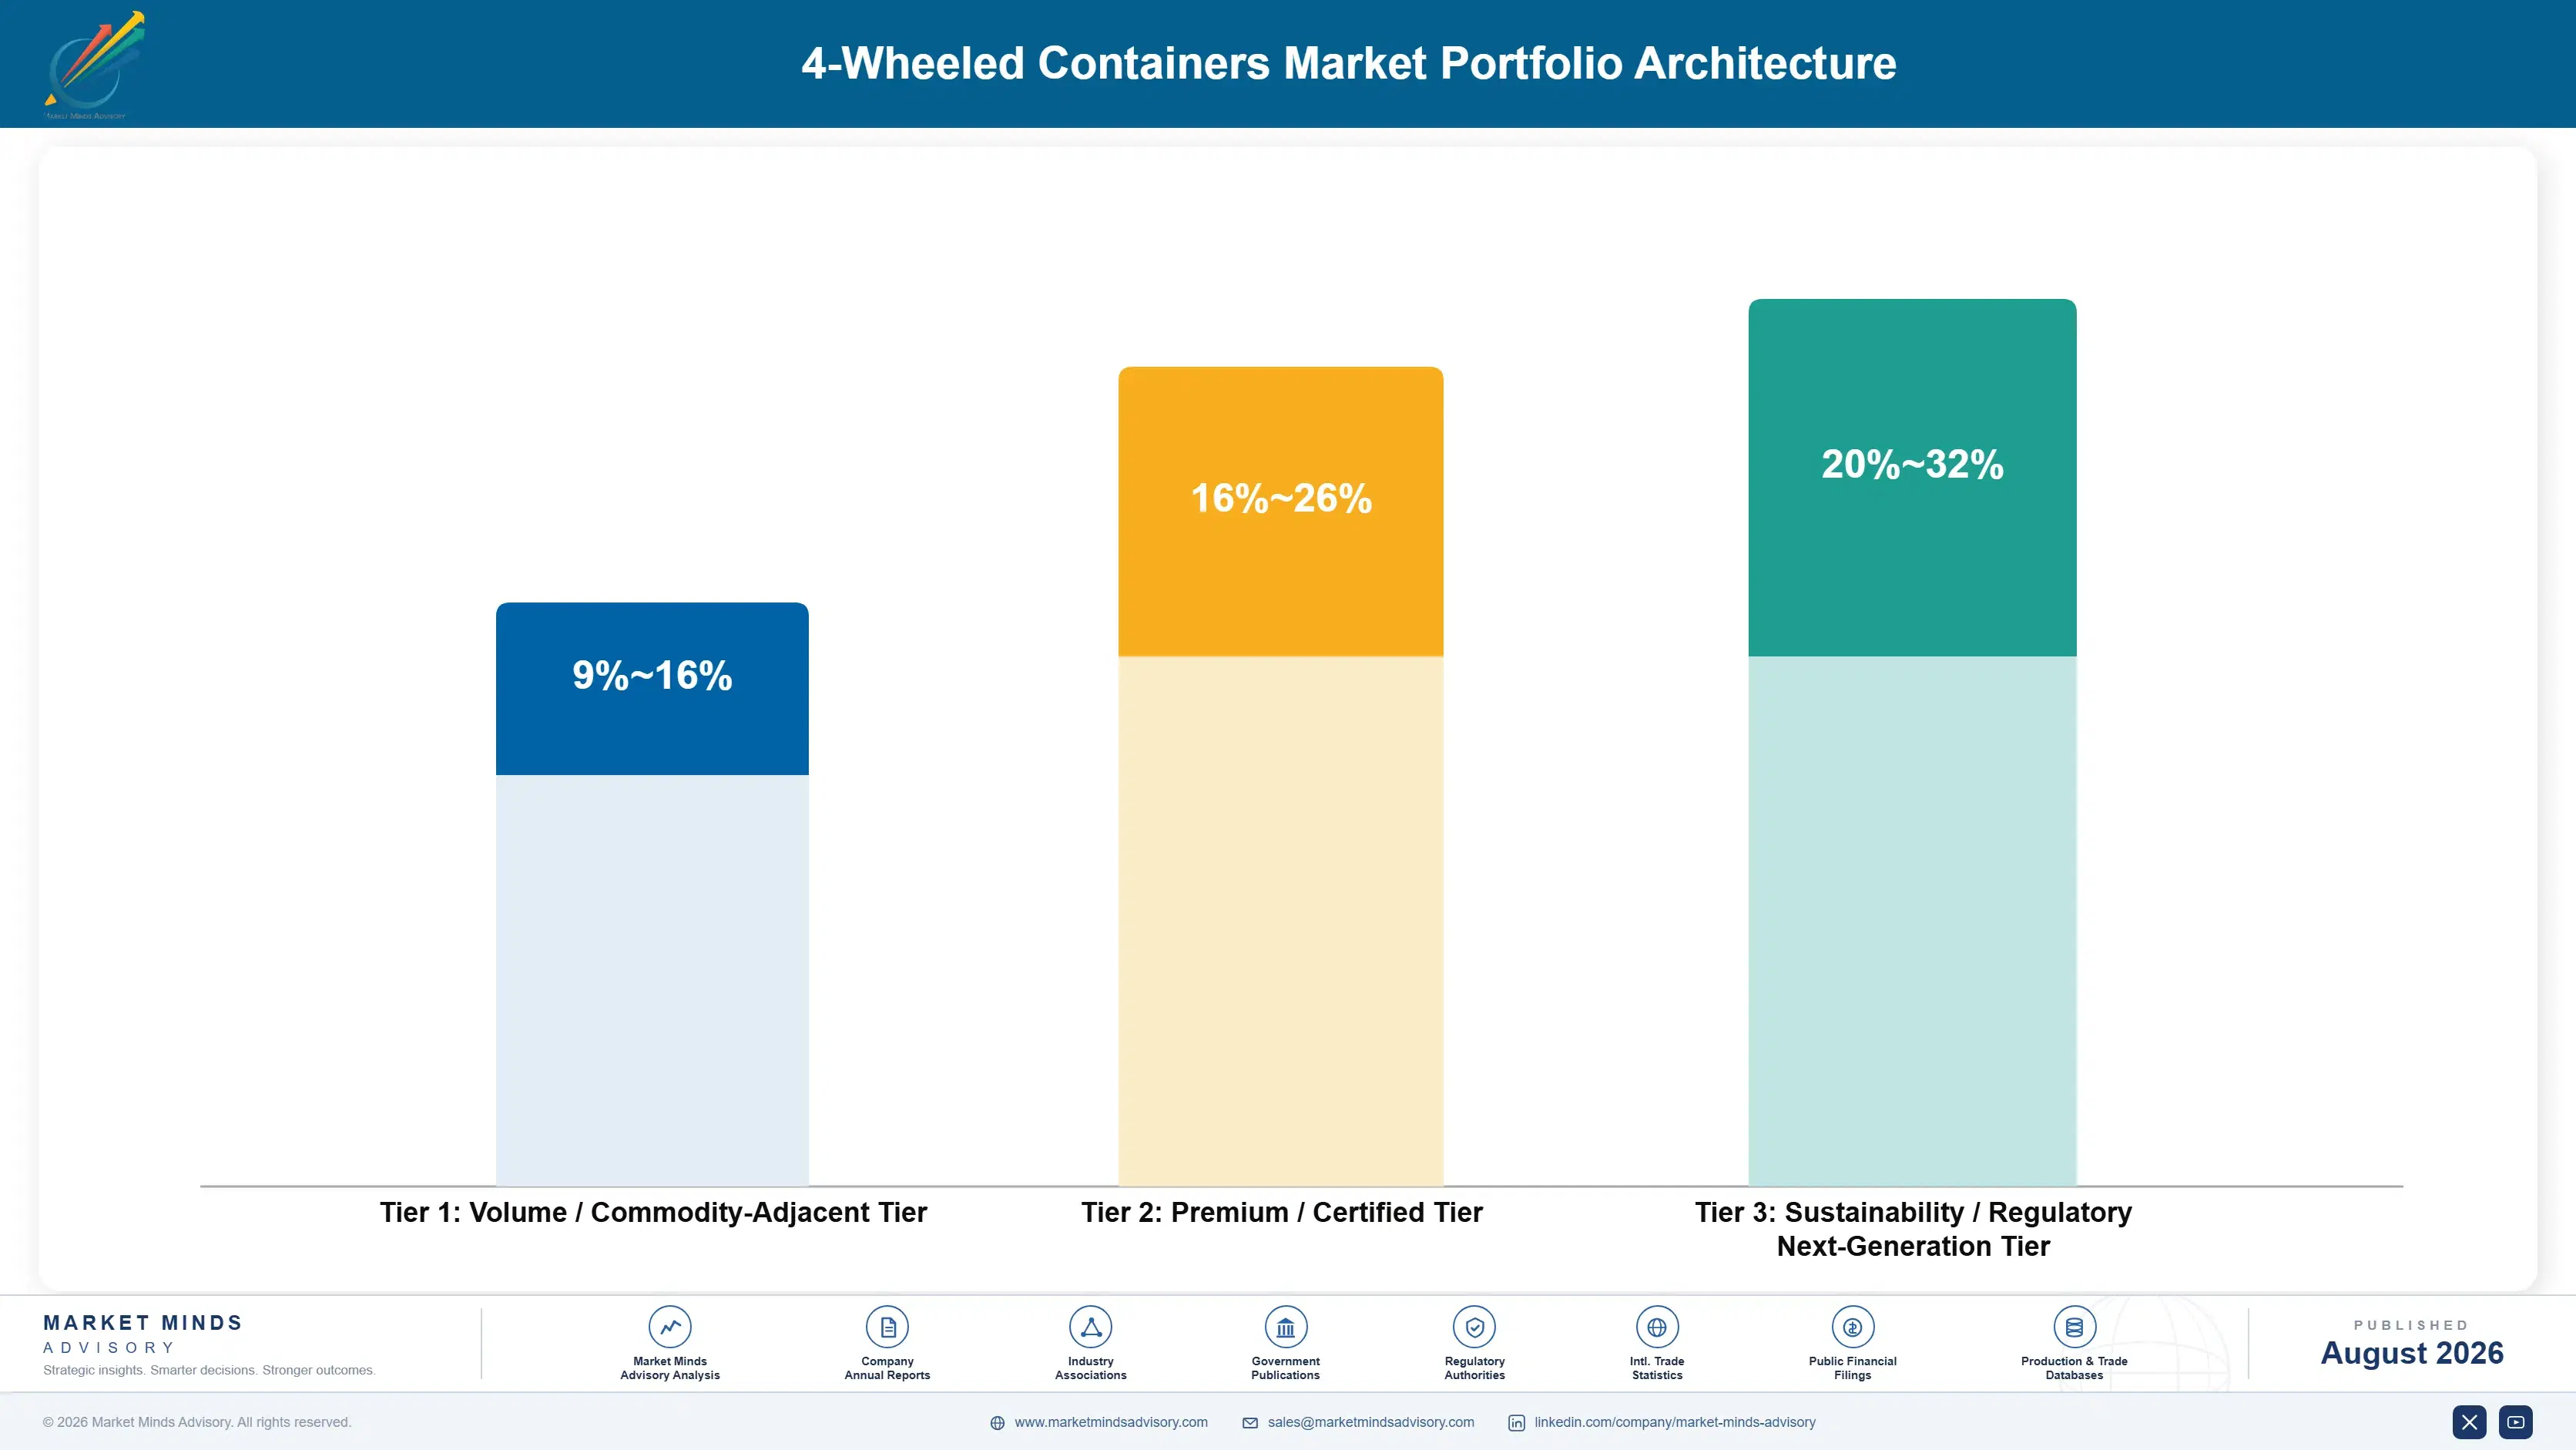
The portfolio splits into three tiers with wide margin separation tied to automation compatibility and material sophistication rather than raw material cost alone. Commodity rigid containers sold on price and delivery reliability carry thin margins. Certified automation-compatible and insulated container systems for large fleet accounts carry the strongest margins. A third tier of next-generation modular and fleet-management-integrated systems is still scaling toward proven, repeatable commercia
The tension between commodity volume and premium specification shapes how manufacturers allocate capital: commodity containers fund the plant utilization and cash flow that keep production lines running, while premium automation-certified and insulated programs fund the engineering and testing investment that create genuine competitive protection. Manufacturers that lean too far toward commodity volume risk losing the certification depth that differentiates them; those that lean too far toward premium risk under-utilized commodity capacity.

High-value pools concentrate specifically in automation-certified containers for large warehouse fleets and in insulated systems for cold-chain distribution, where technical barriers and switching costs both run highest. Commodity rigid containers used in general municipal and retail service generate volume but thin, price-competitive margins, since multiple manufacturers can supply functionally similar containers.

Volume / Commodity-Adjacent Tier

Standard rigid HDPE and steel containers sold against several regional manufacturers competing primarily on price, delivery reliability, and basic caster specification across large municipal and retail fleet orders placed routinely.
Gross Margin: 9-16%

Premium / Certified Tier

Automation-certified and insulated container systems for large warehouse and cold-chain accounts carrying documented compatibility data and fleet-service contracts that buyers increasingly require before awarding any new fleet orders.
Gross Margin: 16-26%

Sustainability / Regulatory / Next-Generation Tier

Modular and fleet-management-integrated systems still scaling toward proven, repeatable commercial economics across a broad and varied customer base of very different sizes, needs, and budgets.
Gross Margin: 20-32%
4-wheeled-containers-market-portfolio-architecture-1787300312239

High-value Sub-segments and Strategic Watch-out

Foldable/Collapsible 4-Wheeled Containers

The fastest-growing and highest-margin segment, converting warehouse and retail space constraints into a genuine commercial requirement that operators increasingly cannot avoid, commanding premium pricing over rigid alternatives while carrying real logistics-cost value buyers pay for directly and consistently across the entire fleet.
Gross Margin: 18-28%

Insulated/Thermal 4-Wheeled Containers

High value with steadier growth than foldable, directly serving cold-chain and pharmaceutical distribution requirements that are converting from optional feature into a binding compliance requirement across regulated supply chains worldwide and growing.
Gross Margin: 20-32%

HDPE Injection-Molded 4-Wheeled Containers

The volume core of the market, supplying commodity municipal and retail containers against several regional manufacturers competing primarily on price, delivery reliability, and basic specification across routine annual fleet orders.
Gross Margin: 10-18%

Steel 4-Wheeled Containers

The strategic watch-out, a mature heavy-duty niche facing substitution pressure from lighter HDPE and composite alternatives that increasingly match its load rating at meaningfully lower delivered manufactured unit cost.
Gross Margin: 9-16%

Why Fleet Standardization Locks In Suppliers

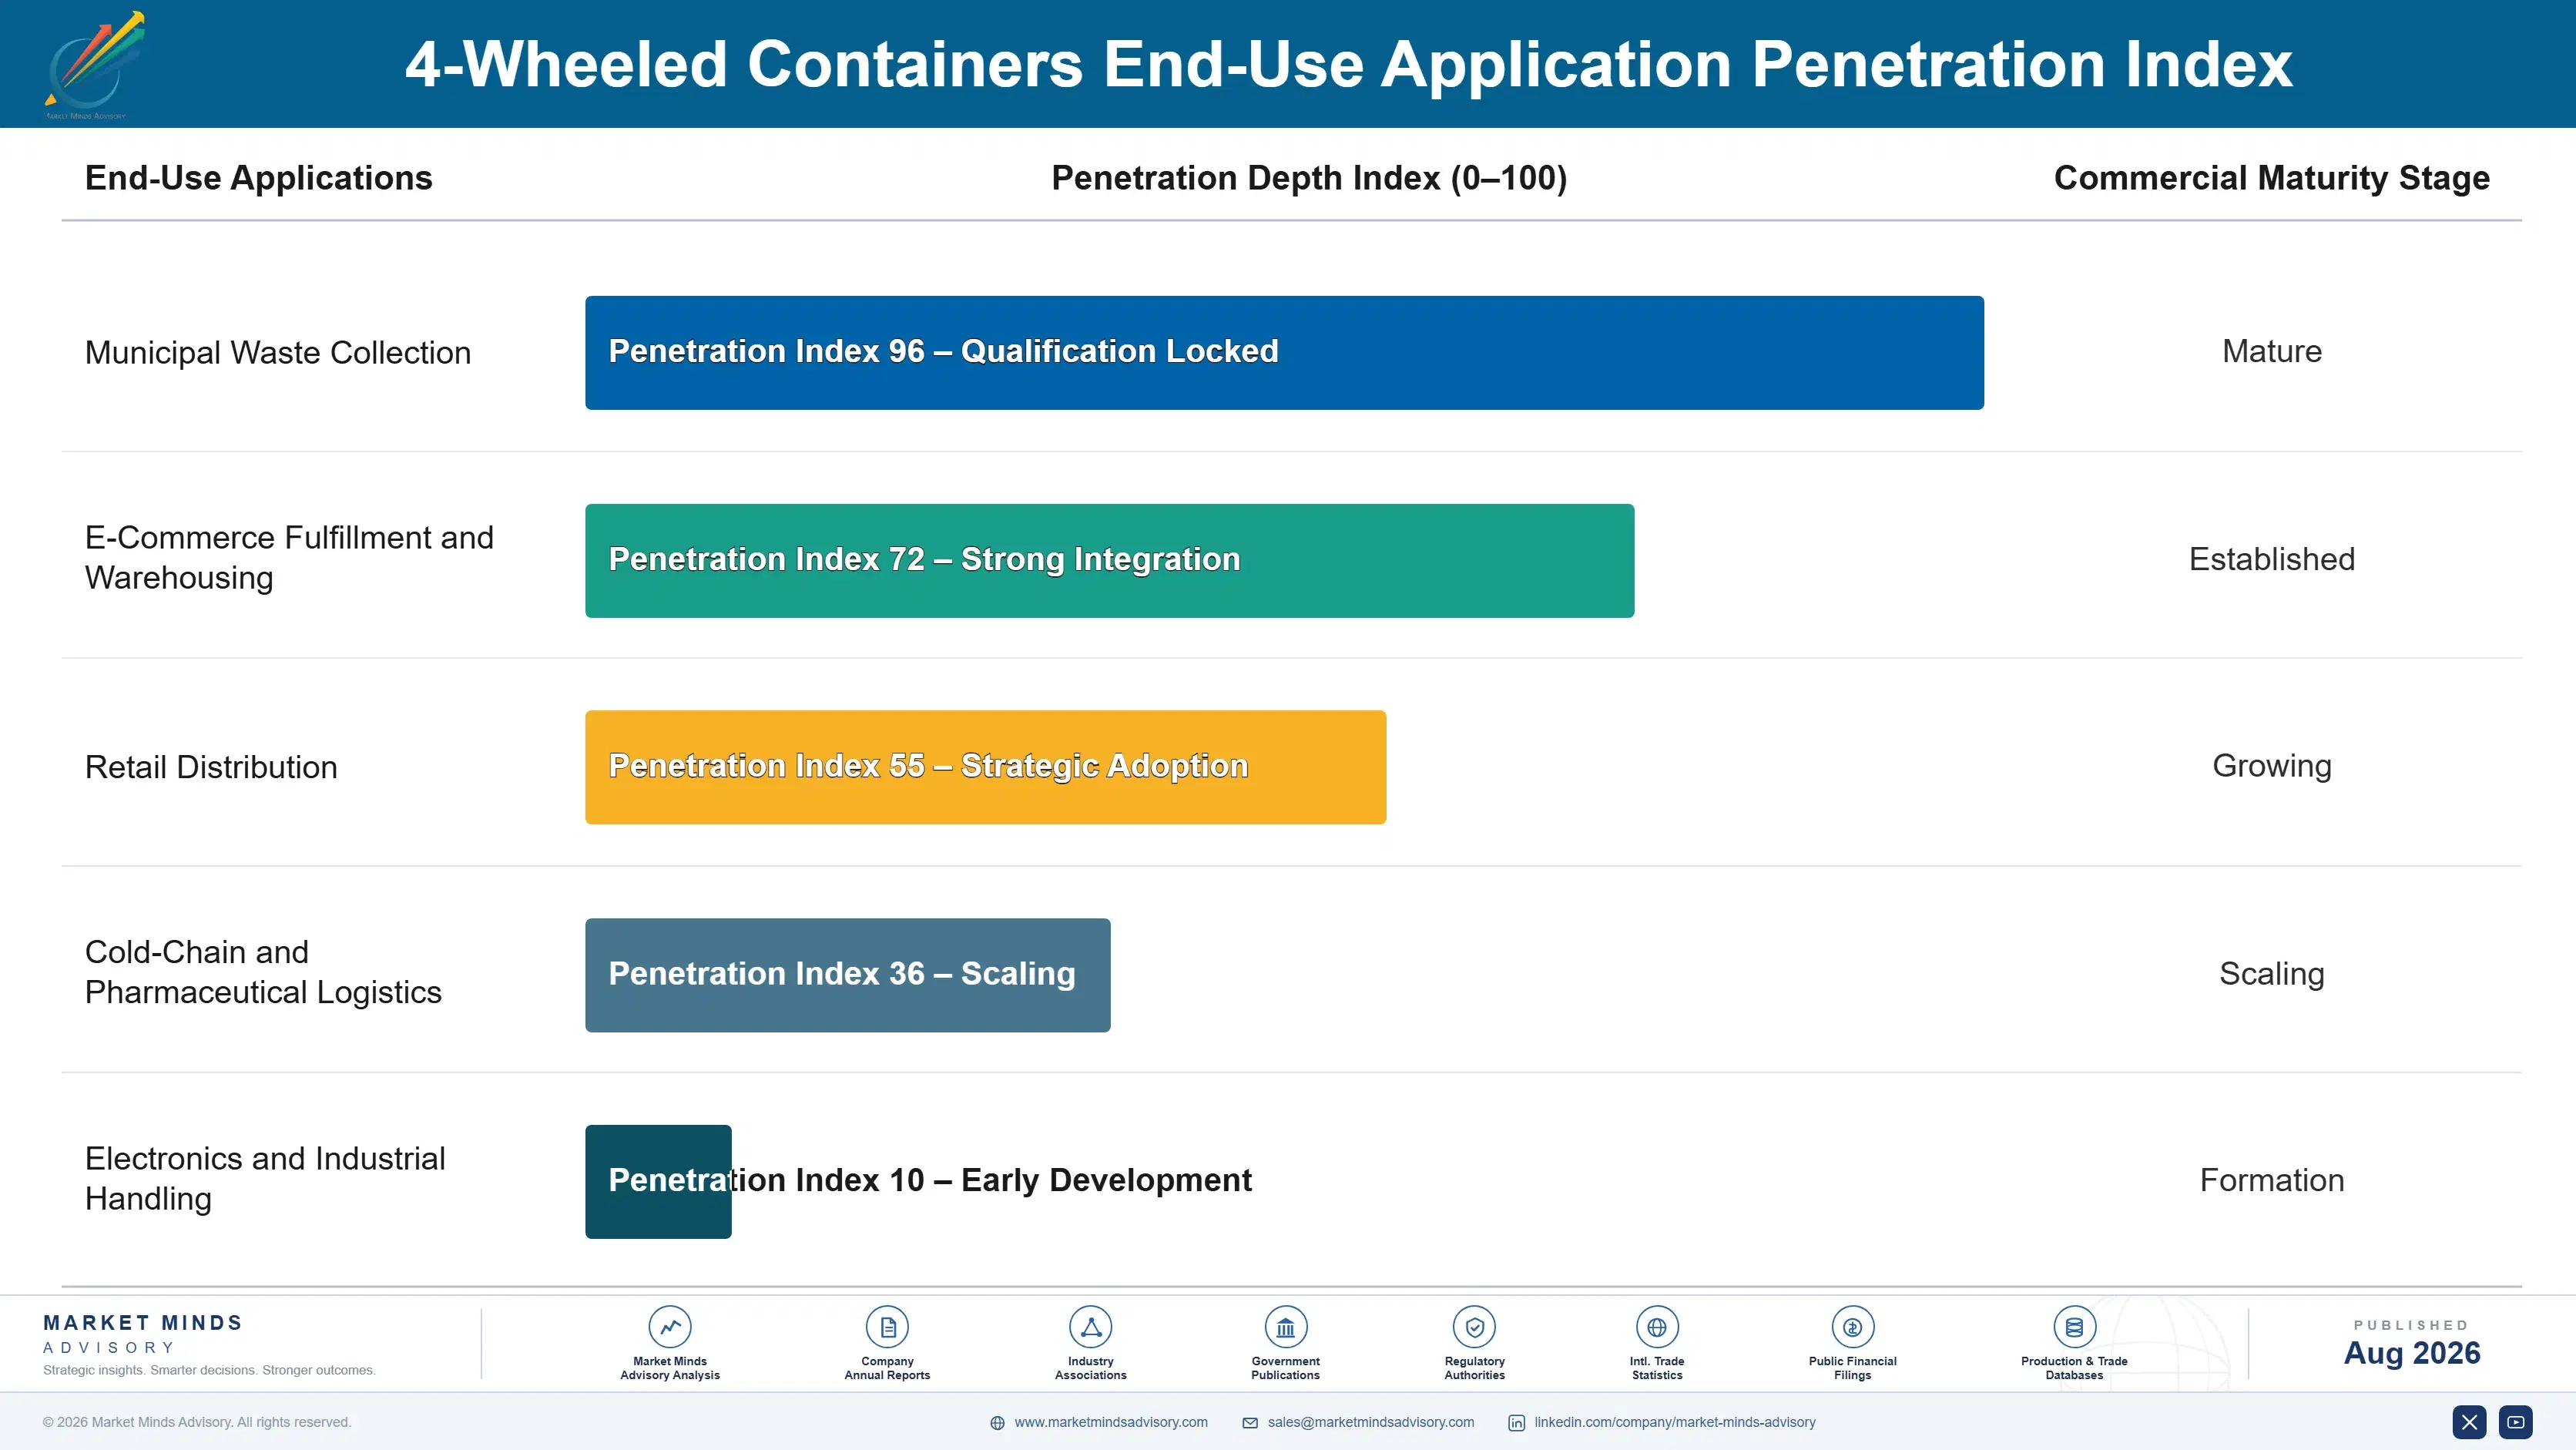
Demand here behaves like an annuity once a manufacturer wins the original fleet standardization decision, because a buyer rarely reopens a compatible container geometry choice mid-fleet given the cost of replacing an incompatible installed base. A manufacturer that wins the original fleet decision typically supplies that customer for eight to twelve years, the working life of the container fleet, converting an initial specification win into a recurring, largely captive replacement relationship.
Adoption depth varies sharply by customer type. Large municipal and warehouse automation customers requalify suppliers rarely, given the fleet compatibility cost involved, which makes their manufacturer relationships the stickiest in the market. Smaller retail and commercial customers, by contrast, treat containers more like a commodity purchase and switch manufacturers more readily based on price, giving them real negotiating leverage large fleet customers typically do not exercise as aggressively.

Buyer profiles are shifting generationally too. A newer cohort of logistics and facilities leaders, trained under mounting automation and space-efficiency pressure, now weighs a manufacturer's compatibility certification and modular range as heavily as unit price, a shift that favors manufacturers with genuine automation and modular expertise over commodity manufacturers competing purely on cost.
4-wheeled-containers-market-end-use-penetration-index-1787300312726

What Buyers Will Pay For Next

These are among the four positions where our research anticipates prominent divergence between winners and laggards over the coming forecast period. Each is grounded in the demand model, the regulatory perimeter, and the announced capacity pipeline.
01 / AUTOMATION COMPATIBILITY PREMIUM

Certified compatibility will separate winners from commodity manufacturers

Manufacturers with formal automation-compatibility certification will keep winning warehouse specification decisions regardless of unit price, because operators increasingly treat certified compatibility as a gating requirement before committing to a multi-year automation investment rather than a negotiable preference. Manufacturers without that certification depth will increasingly compete only on commoditized price against structures facing genuine incompatibility risk with modern automation systems. Expect continued investment in certification infrastructure as commodity manufacturers race to close the compatibility gap before automation adoption locks in incumbent suppliers permanently.
02 / ASIAN FULFILLMENT SCALE

East Asia's share keeps growing as China scales fulfillment

East Asia already holds the largest regional share at 26% and grows near the top of its band as China's e-commerce fulfillment buildout and municipal waste modernization pull deployment east at real, sustained scale year after year. Domestic Chinese manufacturers are closing the engineering gap with Western incumbents faster than most industry observers expected just a few years ago. Multinationals that fail to build direct China manufacturing relationships risk losing the single largest volume opportunity in the entire global market.
03 / MODULAR INTERCHANGEABILITY CAPTURE

Shared geometry across product lines will command real account premium

Manufacturers who design shared stacking and coupling geometry across their entire product range will capture account expansion that single-product competitors simply cannot match once a customer standardizes on one manufacturer's fleet across every facility it operates. The approach commands genuine margin precisely because it removes the incompatible-fleet risk buyers would otherwise weigh before adding a second container type from a different supplier. Expect modular interchangeability to become a standard product architecture principle across the top manufacturer tier within the forecast window.
04 / COLD-CHAIN EXPANSION PRESSURE

Insulated container lines will keep capturing premium margin growth

Cold-chain and pharmaceutical distribution will keep pulling volume toward insulated container formats as temperature-controlled logistics expands well beyond traditional frozen food into pharmaceuticals and grocery e-commerce delivery categories across every major market. That expansion will keep widening the addressable market for manufacturers who have already built insulated design and testing capability ahead of standard-container competitors. Expect manufacturers without insulated capability to lose ground steadily to competitors who have already built the thermal engineering expertise required to compete on this basis.

Engagement Snapshot From the Field

A live engagement with an industry participant carrying material or product regulatory and market exposure ahead of a defining policy shift, showing how our research translates into a defensible multi-year portfolio strategy.
MARKET MINDS ADVISORY · CLIENT ENGAGEMENT SUMMARY
4-Wheeled Containers Producer Strategic Portfolio Review and Transition Roadmap 2026·Investment Scenario on 4-Wheeled Containers Exposure Evaluation 2025-26
CLIENT PROFILE
A regional e-commerce fulfillment operator running several distribution centers across the American Midwest approached MMA while evaluating a shift from mixed container fleets to a single standardized modular system ahead of a planned automation investment. The client reported annual fulfillment volume valued near USD 260 million, with container incompatibility across facilities cited as a recurring source of handling delay (client-reported, unverified by MMA).
STRATEGIC CHALLENGE
Management knew fleet standardization was necessary before automation investment but faced real uncertainty over whether to standardize on the incumbent supplier's geometry or switch to a competitor offering better automation compatibility. The operations team wanted to switch suppliers immediately; the finance team worried about the cost of replacing the existing fleet; and the automation project lead needed certainty before finalizing the automation vendor selection.
MMA APPROACH
MMA benchmarked automation-compatibility certification across three container manufacturers against the client's planned automation platform, modeled the cost of a phased fleet transition against a full replacement, and quantified the handling delay cost the client was already absorbing under its current mixed-fleet system. We also assessed whether the incumbent supplier could achieve compatibility through a design update rather than requiring a full switch.
KEY FINDINGS
  1. Container incompatibility across facilities cost the client an estimated USD 1.4 million in handling delay and rework over the prior twelve months (client-reported, unverified by MMA).
  2. The incumbent supplier could not achieve automation compatibility without a full product redesign, effectively equivalent in cost and timeline to switching suppliers entirely.
  3. A phased transition converting the two highest-volume distribution centers first would validate compatibility before committing to a full, costly fleet-wide supplier switch.
  4. Only one of three manufacturers evaluated offered documented compatibility certification against the client's specific planned automation platform and required installation timeline.
CLIENT PROFILE
A regional e-commerce fulfillment operator running several distribution centers across the American Midwest approached MMA while evaluating a shift from mixed container fleets to a single standardized modular system ahead of a planned automation investment. The client reported annual fulfillment volume valued near USD 260 million, with container incompatibility across facilities cited as a recurring source of handling delay (client-reported, unverified by MMA).
STRATEGIC CHALLENGE
Management knew fleet standardization was necessary before automation investment but faced real uncertainty over whether to standardize on the incumbent supplier's geometry or switch to a competitor offering better automation compatibility. The operations team wanted to switch suppliers immediately; the finance team worried about the cost of replacing the existing fleet; and the automation project lead needed certainty before finalizing the automation vendor selection.
MMA APPROACH
MMA benchmarked automation-compatibility certification across three container manufacturers against the client's planned automation platform, modeled the cost of a phased fleet transition against a full replacement, and quantified the handling delay cost the client was already absorbing under its current mixed-fleet system. We also assessed whether the incumbent supplier could achieve compatibility through a design update rather than requiring a full switch.
KEY FINDINGS
  1. Container incompatibility across facilities cost the client an estimated USD 1.4 million in handling delay and rework over the prior twelve months (client-reported, unverified by MMA).
  2. The incumbent supplier could not achieve automation compatibility without a full product redesign, effectively equivalent in cost and timeline to switching suppliers entirely.
  3. A phased transition converting the two highest-volume distribution centers first would validate compatibility before committing to a full, costly fleet-wide supplier switch.
  4. Only one of three manufacturers evaluated offered documented compatibility certification against the client's specific planned automation platform and required installation timeline.
RECOMMENDED STRATEGY
Phase 1: Phase 1 (0 to 4 months): Convert the two highest-volume distribution centers to the certified compatible container system ahead of automation installation. Phase 2: Phase 2 (4 to 10 months): Validate handling performance and full automation compatibility before extending conversion to any remaining facilities. Phase 3: Phase 3 (10 to 18 months): Complete fleet-wide conversion across all remaining distribution centers once compatibility is confirmed at scale.
OUTCOME
The client converted its two highest-volume centers within four months and confirmed full automation compatibility before completing its planned automation installation on schedule. Fleet-wide conversion followed over the subsequent year, and the client has reported eliminating the handling delay cost entirely, worth roughly USD 1.4 million in annual savings (client-reported, unverified by MMA).

Frequently Asked Questions

Foundational context covering the market sizes, CAGR, scope, country, region and competition that inform every finding below. This section is provided to cover basics and most often pre-purchase conversations, answered from the MMA Primary Research Dataset.

What is the current size of the 4-Wheeled Containers Market?

The market stood at USD 3.1 billion in 2025, spanning HDPE, steel, mesh, insulated, and foldable container formats. Foldable and collapsible containers are the fastest-growing segment within that base.

How large will the 4-Wheeled Containers Market be by 2036?

The market is projected to reach USD 5.8 billion by 2036 under the base case scenario. That represents roughly 1.76 times the 2026 value of USD 3.3 billion.

What is the CAGR for the 4-Wheeled Containers Market 2026 to 2036?

The base case CAGR is 5.9% annually through 2036. The bull case reaches 7.1% on faster municipal modernization, while the bear case falls to 4.7%.

Which segment is growing fastest?

Foldable and collapsible containers grow fastest at 8.5% annually, well ahead of standard rigid formats. That is roughly 1.44 times the overall market growth rate.

Who are the major companies in the 4-Wheeled Containers Market?

SSI SCHAFER Group, Sulo GmbH, Otto Environmental Systems, CRAEMER GmbH, and Rehrig Pacific Company lead the market on disclosed segment revenue across every major region.

Which country is growing fastest?

China grows fastest among all countries at 9.8% annually, ahead of India and other major Asian logistics economies. Growth is driven by e-commerce fulfillment and municipal waste modernization.

Report Segmentation Architecture

The full report scope spans multiple orthogonal segmentation dimensions, with cross-tabulated demand data provided for each dimension pair. Coverage extends further to regional breakdowns, trend trajectories, and the competitive detail needed to support segment-level decision-making.

By Container Material and Construction Type

  • HDPE Injection-Molded 4-Wheeled Containers
  • Steel 4-Wheeled Containers
  • Roll Cages and Mesh 4-Wheeled Containers
  • Insulated/Thermal 4-Wheeled Containers
  • Foldable/Collapsible 4-Wheeled Containers
  • Anti-Static/ESD 4-Wheeled Containers

By End-Use Application

  • Municipal Waste Collection
  • E-Commerce Fulfillment and Warehousing
  • Retail Distribution
  • Cold-Chain and Pharmaceutical Logistics
  • Electronics and Industrial Handling

By Commercial Dimension

  • Direct Municipal Procurement
  • Retail and Warehouse Fleet Contracts
  • Fleet Management Service Programs
  • Distributor and Reseller Channel

By Region

  • North America
  • Western Europe
  • East Asia
  • South Asia and Pacific
  • Latin America
  • Middle East and Africa
  • Eastern Europe

Scope, Methodology, and Coverage

Every figure in this report is reproducible from documented input assumptions. The scope below maps the historical period, the forecast horizon, the segmentation dimensions, and the countries covered, alongside the underlying primary and qualitative methodology.
Historical Period
2020 to 2025
Forecast Period
2026 to 2036
Base Year
2025 (USD billions; MMA Primary Research Dataset, August 2026)
Market Definition
The four-wheeled containers market covers mobile, four-caster material handling containers used for waste collection, retail stock distribution, warehouse logistics, and temperature-controlled transport within and between facilities. It includes rigid injection-molded, steel, mesh roll cage, insulated, foldable, and anti-static container formats sold as finished units. Two-wheeled bins, fixed dumpsters, and non-mobile storage racks are excluded.
Quantitative Units
USD billions (current prices); million container units shipped where applicable
Segmentation Dimensions
By Container Material and Construction Type; By End-Use Application; By Commercial Dimension; By Region
Regions Covered
North America, Western Europe, East Asia, South Asia and Pacific, Latin America, Middle East and Africa, Eastern Europe
Countries Covered
USA, China, Germany, France, UK, Japan, South Korea, India, Australia, Canada, Brazil, Mexico, Indonesia, Vietnam, Thailand, Malaysia, UAE, Saudi Arabia, South Africa, Nigeria, Turkey, Poland, Netherlands, Italy, Spain, Sweden, Switzerland, Argentina, Colombia, Singapore, and additional markets relevant to this sector
Key Companies Profiled
SSI SCHAFER Group, Sulo GmbH, Otto Environmental Systems, CRAEMER GmbH, Rehrig Pacific Company, Toter LLC, Cascade Engineering Inc., Rotonics Manufacturing Inc., Norseman Plastics Ltd., Wanzl GmbH & Co. KGaA, IPL Inc., Nordic Plastic Group, PWS Distribution Ltd., Bonar Plastics Inc., Zarges GmbH, Georg Utz Holding AG, Buckhorn Inc., Loscam Limited, Contraload B.V., Rotom Group
Quantitative Methodology
Primary survey, n=3,800 respondents, Q4 2025, six countries; demand-side model with trade association cross-validation
Qualitative Methodology
47 expert interviews, Q4 2025; applied to validate demand model assumptions, identify emerging dynamics, and assess competitive positioning
Report Format
PDF and XLSX data workbook (Word format preview document)
Publisher
Market Minds Advisory
Report Code
MMA-2026-CON-128
Published
August 2026
Contact
sales@marketmindsadvisory.com | www.marketmindsadvisory.com

Purchase the full 4-Wheeled Containers Market Report (2026 to 2036).

The full MMA 4-Wheeled Containers report sizes the market across six material and construction types, five end-use applications, four commercial models, and seven regions through 2036. It profiles 20 manufacturers on a consistent basis of disclosed container segment revenue, scoring each on automation-compatibility depth, modular interchangeability, and regional manufacturing footprint. Scenario models quantify how warehouse automation adoption, municipal waste modernization, and resin and steel price volatility move both demand and realizable pricing. The report also includes delivered-cost modeling by construction type, an automation-compatibility certification comparison across major platforms, and a fleet-management service feasibility framework built for logistics strategy, procurement, and facilities teams.
Six-format segmentation with cross-tabulated regional demand data
Twenty-company competitive benchmarking on consistent revenue basis
Automation-compatibility certification comparison across major handling platforms
Resin and steel cost exposure modeling by construction type
Scenario forecasts through 2036 under bull and bear cases
Case study on warehouse fleet standardization strategy

Built For The People Who Decide

From boardroom strategy to bench-side execution, this report is read cover-to-cover by leaders shaping the next decade of their industry, turning demand scenarios, market dynamics and valuation benchmarks into decisions.
CXOs/ Presidents/ VPs/ Managers
M&A and Corporate Development
Strategy Teams and R&D Heads
Procurement and Product Directors
Regulatory and Compliance Leaders
Investor Relations and Equity Analysts