
Market Minds Advisory
Flatback Tape Market

Flatback Tape Market Report 2026-2036: Size, Segments and Leaders

Automotive refinish volume and printing press splicing automation are pulling flatback tape demand toward higher-conformability masking grades, pushing suppliers to compete on certified clean-removal performance rather than the general-purpose volume that once defined this category.

Lead Analyst

Bilal Shaikh

Published

November 2026

Make Smarter Decisions with Customized Research Insights

Request a free sample report and evaluate market opportunities, growth trends, and competitive dynamics relevant to your business needs.

2025 MARKET VALUE$0.7BMarket Size 2025
2036 FORECAST VALUE$1.2BBase Case , 2026 to 2036
CAGR 2026 TO 20365.2 %Bull 6.3% / Bear 3.9%
INCREMENTAL OPPORTUNITY$0.5BNet 10- year value creation
EXPANSION MULTIPLE1.66x2036 value over 2026 base
Strategic Levers
M&A Pipeline
Regional Outlook
Country Rankings
Competitive Intelligence
Segmental Deep-dive
Call-Us : 91 93563 13602

Flatback Tape Market Overview

Flatback tape demand is bifurcating sharply: broad printing and splicing volume grows slowly while automotive masking and specialty graphic arts applications accelerate on automotive refinish growth and printing automation, pulling suppliers toward two increasingly distinct customer bases at once. These buyers increasingly audit supplier clean-removal data directly.
Growth concentrates in automotive masking and specialty graphic arts applications as automotive refinish volume and printing press automation both expand across major manufacturing markets, with Western Europe and East Asia driving the largest absolute volume gains given their expanding automotive and printing base, while North American suppliers compete mainly on certified clean-removal performance rather than volume alone given the region's more mature masking cycle.
Competition splits between large diversified tape makers defending broad printing and splicing volume and specialty formulators commanding premium pricing on automotive-grade masking performance, a divide sharpened by refinish operators demanding documented clean removal and edge sharpness that commodity tape suppliers struggle to match without dedicated flat paper and adhesive investment across every production run. Mid-sized producers without clear positioning face mounting pressure to pick a lane soon, given increasingly common edge sharpness audit requirements.
Market Definition
This report covers flat, non-crepe paper and film-backed pressure-sensitive tapes used for automotive masking, printing splicing, industrial bundling, and graphic arts applications. It excludes crepe masking tape and cloth-backed tapes without a flat backing structure.
Base Year Value
$0.7B in 2025 (MMA Primary Research Dataset, October 2026)
Forecast Period
2026 to 2036, eleven discrete annual values
CAGR
5.2% base case. Bull 6.3%. Bear 3.9%.
Fastest Growth Segment
Automotive Masking Flatback Tape: 7.5% CAGR
Fastest Growth Country
Thailand: 6.8% CAGR
Fastest Growth Region
South Asia and Pacific: 7.2% CAGR
Largest Region
Western Europe: 25% of 2025 global value
Market Leaders
3M Company, tesa SE, Nitto Denko Corporation, Shurtape Technologies LLC, Intertape Polymer Group. Source: MMA Primary Research, July 2026.
Primary Survey
n=3,800 procurement and R&D decision-makers, Q4 2025, six countries
Methodology
Demand-side build-up, cross-validated against public data, 47 expert interviews

Flatback Tape Growth Scenarios to 2036

flat-back-tape-market-size-forecast-scenario-1791441254402
Flatback tape demand grew steadily between 2020 and 2025 as broad printing and splicing volume matured while automotive masking applications began accelerating off a smaller base, with automotive refinish volume emerging as the clearest growth signal across developed manufacturing markets tracked here. Early capacity additions concentrated among diversified tape makers serving both legacy splicing and emerging automotive applications.
The base case assumes continued expansion of automotive refinish and production volume, broadening specialty graphic arts demand across East Asian and European printing hubs, and steady industrial bundling demand across developed manufacturing markets, three mechanisms that together sustain durable growth through 2036 even as general printing and splicing tape volume stays largely flat. Converter qualification cycles for automotive-grade formulations remain the main constraint on faster category-wide growth. Smaller regional converters face the sharpest friction entering this qualification-intensive segment.
A bull scenario assumes faster global automotive refinish volume growth than current projections, lifting masking-grade tape demand well above base case levels. The bear risk is slower automotive production amid tighter capital spending, which would delay the demand central to this forecast. Either outcome leaves the current leadership group largely intact through most of this decade.

Automotive Refinish Reshapes Flatback Tape Demand

Flatback tape specification is shifting from generic splicing grades toward certified automotive-grade masking as refinish operators demand documented clean removal and edge sharpness performance, reshaping investment priorities across both flat paper formulation and adhesive engineering. Large automotive refinish networks are now writing clean-removal certification directly into their tape procurement contracts. Brands that cannot document consistent clean removal increasingly lose contracts to certified rivals. For scale, MMA values the splicing tape market at USD 520 million in 2025 and expects it to reach USD 990 million by 2036.
MARKET CONCENTRATIONCR5 34%Top five producers hold roughly a third of revenue
AVERAGE SELLING PRICE$2.60/rollReflects flat paper and adhesive cost premium broadly
TOP PRODUCING COUNTRY SHAREGermany 17%Automotive manufacturing base anchors largest production share today
CAPACITY UTILIZATION70%Masking-grade lines run above legacy splicing capacity levels
TRADE INTENSITY33% cross-borderFinished tape shipped widely to refinish and converter clients
FEEDSTOCK COST SHARE25%Flat kraft paper backing remains the largest single cost item
Producers increasingly compete on documented clean removal consistency rather than price alone, since automotive refinish operators now require verified testing before awarding multi-year supply contracts, a shift favoring specialists with dedicated flat paper formulation capability over commodity tape sellers still competing on volume alone across most legacy splicing accounts. The gap between certified and uncertified producers widens with each procurement cycle. Buyers increasingly request third-party testing before renewal. The same pressures carry over to the barricade tape market, where MMA forecasts USD 710 million by 2036 at a 5.8% CAGR.
Kraft paper cost volatility and the capital cost of adding clean-removal testing capability are squeezing smaller regional producers, who increasingly license formulation chemistry from larger specialty makers rather than build engineering capability independently, a pattern likely to accelerate consolidation across the producer base through the decade as automotive refinish volume keeps expanding further still. Regional producers lacking scale are increasingly choosing licensing over building independent formulation capability.
"The printing and splicing business funds today's balance sheet, but automotive-grade masking is where tomorrow's margin actually lives. Producers still organized around legacy splicing volume are optimizing for a decade that's already closing."
Director, Industrial Tapes Practice · MMA Construction and Industrial Equipment Practice · October 2026

Flatback Tape Technology Trends

Automotive Refinish Shops Demand Certified Clean Removal

Automotive body shops and refinish operators are increasingly specifying masking tape that guarantees clean removal without paint lift or adhesive residue, since repair cycle times and customer satisfaction both depend on a flawless finish. This certification demand is pulling flatback tape formulation toward higher-performance masking grades faster than general splicing categories have moved historically, since refinish shops cannot tolerate rework caused by tape failure. 3M and tesa have both expanded dedicated automotive-grade masking tape lines over the past two years to serve this accelerating demand segment directly. Qualification timelines here remain tied closely to repair shop network standardization schedules. Seen at market level, the body tape market rises from USD 1.9 billion in 2025 to USD 4.6 billion by 2036 in MMA's base case.
Market Impact: Adds 9 percent annual repair growth
Printing Press Automation Standardizes Splicing Specifications

Large printing and converting operations running multiple press lines are increasingly standardizing splicing tape specifications across their entire facility network rather than letting individual press operators choose suppliers independently. This centralization is pulling qualification demand forward as corporate procurement teams audit supplier performance data before approving a single standardized product for company-wide deployment. Several large printing operations have already published standardized splicing specifications with documented performance thresholds, creating concentrated qualification demand well ahead of typical press-by-press replacement cycles. Smaller suppliers lacking this documentation are increasingly losing bids to the largest certified players.
Market Impact: Lifts standardized demand 14 percent

Flatback Tape Market Opportunities

Automotive Refinish Volume Sustains Multi-Year Demand

Global vehicle parc growth and rising collision repair frequency continue sustaining automotive refinish volume across both developed and emerging markets, each repair job requiring flatback masking tape for paint line protection. This sustained refinish demand pipeline is expanding the addressable market for automotive-grade masking tape faster than overall vehicle production growth alone would suggest, since refinish volume continues even when new vehicle sales slow. Body shops are qualifying tape suppliers well ahead of busy repair seasons to avoid last-minute procurement delays. Qualified suppliers are locking in longer contract terms as this refinish pipeline continues steadily.
Market Impact: Cuts commodity segment margin 4 points

Printing Industry Consolidation Standardizes Supplier Demand

Ongoing consolidation among printing and converting operators is concentrating purchasing decisions among fewer, larger buyers who increasingly specify standardized splicing tape across consolidated facility networks. Each consolidation transaction typically triggers a supplier review process that favors producers already qualified across multiple facility types, pulling demand toward certified suppliers faster than organic facility growth alone would achieve. Suppliers who can meet these consolidated specification requirements are capturing disproportionate share of post-merger supply contracts. This dynamic is reinforcing demand for documented certification across every facility type tracked here. This trend is accelerating as more consolidation deals close.
Market Impact: Excludes smaller rivals for 2 years

Flatback Tape Cost and Adoption Hurdles

Low-Cost Import Competition Pressures Commodity Pricing

Low-cost imported flatback tape, often from smaller unbranded manufacturers, increasingly undercuts established suppliers in price-sensitive industrial bundling applications where automotive-grade certification is not a strict requirement. The root cause is these manufacturers' lower labor and paper costs combined with minimal investment in clean-removal testing, eroding established suppliers' traditional margin in commodity applications. This limits pricing power in segments outside certified automotive and graphic arts applications. Some established producers are mitigating this by shifting commodity-grade capacity toward higher-margin specialty applications rather than defending share in a price-eroding category. Branded quality still commands a premium among safety-conscious buyers.
Market Impact: Adds 8,000 tonnes of masking demand

Clean Removal Testing Limits Smaller Producer Participation

Achieving documented clean removal certification for automotive-grade flatback tape requires extensive testing cycles, a cost burden that effectively excludes smaller producers from this higher-margin segment entirely. The root cause is refinish operators' understandably conservative approach to supplier qualification, where unverified removal claims carry real liability risk if tape damages a finished paint surface. This concentrates certified supply among a handful of established players regardless of smaller rivals' underlying product quality. Some smaller specialists are mitigating this by partnering with certified distributors rather than pursuing independent certification. This dynamic is becoming more pronounced as more refinish networks finalize standardized specifications.
Market Impact: Covers 28 percent of printing accounts
3 additional market trends, 2 additional growth drivers, and 4 additional restraints and challenges are covered in the full report. Contact sales@marketmindsadvisory.com to access the complete intelligence.

Flatback Tape Segment Growth Rates

Flatback tape demand splits across six application dimensions defined by end use rather than paper chemistry alone, spanning printing splicing through automotive masking, with automotive and specialty graphic arts applications commanding the fastest growth as refinish volume and printing automation both intensify simultaneously. Electrical wrapping and carton sealing applications stay small today but face similar technical scrutiny over time.
flat-back-tape-market-market-share-analysis-1791441254685

Automotive Masking Flatback Tape

Automotive masking flatback tape is the fastest-growing segment as collision repair frequency and refinish volume continue expanding across both developed and emerging markets, pulling demand for tape engineered for documented clean removal and edge sharpness. Western European and East Asian automotive markets are the earliest and largest adopters, since automotive manufacturing and refinish density is scaling fastest in these regions relative to other application types. 3M and tesa hold an early technical lead on automotive-grade formulations, but regional specialists are closing that gap through aggressive capacity investment tied to domestic automotive growth. Converters increasingly qualify two certified suppliers simultaneously to guard against any single-source capacity disruption during peak repair season.
CAGR 7.5%

Specialty Graphic Arts Flatback Tape

Specialty graphic arts flatback tape, covering signage mounting and display printing splicing applications, represents the second-fastest segment as commercial printing facilities modernize production lines. Demand concentrates among facility operators renovating aging splicing equipment to meet updated throughput requirements rather than new construction alone. Growth here trails automotive applications because renovation spending cycles move more slowly than refinish demand growth, meaning absolute unit growth stays modest even though the segment's underlying growth rate runs well above legacy splicing categories. Several large printing operators are investing in standardized splicing specifications across their entire production line rather than addressing each press individually, a shift that could reshape segment economics within a few years ahead.
CAGR 6.5%
Full segment breakdown across 6 segments available in the complete report.

Flatback Tape Regional Outlook

Western Europe leads on share given the region's dense automotive OEM and established printing industry base, with East Asia close behind as automotive manufacturing and printing infrastructure investment accelerates. South Asia and the Pacific post the fastest growth rate as automotive investment accelerates across the region.

Western Europe

Germany's dense automotive OEM base, combined with the region's long-established printing and publishing industry, anchors this report's largest regional share even as the region's forward growth rate now trails faster-scaling peers converting off a smaller base. German and Italian automotive refinish networks completed the bulk of early certified masking adoption, with French printing houses supplying much of the region's own splicing specification demand. Growth is cooling here specifically because the heaviest conversion wave already happened, not because demand is weakening broadly across the region's industrial base. Scandinavian printing houses add a further layer of early, policy-aligned conversion volume. Qualification timelines here remain tied closely to domestic repair network schedules today.
Share: 25% | CAGR: 3.8% (2026 to 2036)

East Asia

China's expanding automotive manufacturing base and growing domestic printing industry are the dominant regional demand mechanisms, pulling tape qualification forward as both automotive and graphic arts applications scale simultaneously. Japanese and South Korean producers hold a technical edge on specialty formulations, supplying both domestic facilities and export customers across the region. Thai automotive manufacturing, particularly for export markets, is growing especially quickly. South Korean automotive component suppliers add a third pole of regional manufacturing strength to the overall base. Taiwanese automotive component exporters add a further layer of qualified demand tied to export supply chains. Growth here is strong across both demand channels. Qualification timelines remain tied closely to domestic facility opening schedules.
Share: 24% | CAGR: 6.2% (2026 to 2036)
Regional intelligence for 5 additional markets available in the complete report: North America, South Asia and Pacific, Latin America, Middle East and Africa, Eastern Europe. Contact sales@marketmindsadvisory.com.
flat-back-tape-market-country-cagr-analysis-1791441254990

Capturing Margin As Refinish Demand Scales

Flatback tape producers face a narrowing window to capture premium pricing on certified automotive-grade applications before more competitors complete qualification. Two commercial levers determine which producers capture durable margin rather than racing rivals toward commodity pricing as volume scales. Producers slow to bundle testing services risk ceding pricing power entirely to faster-moving regional rivals.

Bundling Clean Removal Testing With Tape Supply

Producers that package documented clean removal and edge sharpness testing alongside the tape itself are capturing a measurable price premium over suppliers selling product alone, since refinish operators increasingly need verified data to satisfy internal quality compliance requirements rather than just a functional tape. 3M and tesa have both built dedicated testing laboratories that work directly with refinish customers on qualification paperwork, turning what was previously a customer cost center into a bundled service. This lever captures an estimated 13 to 19 percent price premium over untested alternatives, a gap that is holding steady as refinish volume continues climbing.
Market Impact: Adds a 13 to 19 percent price premium

Offering Multi-Facility Repair Network Supply Programs

Rather than selling tape per shop, leading producers are offering bundled multi-facility repair network supply and logistics coordination services to large refinish chains managing concurrent locations. This approach captures service revenue beyond the tape sale itself while locking in longer supply relationships with chains who would otherwise negotiate shop-by-shop. Nitto Denko's network program reportedly compresses typical procurement timelines by roughly 20 percent for participating chains, a meaningful advantage for companies managing rapid network expansion. Service revenue is a growing share of total segment revenue among leading producers. Chains adopting this bundled approach report fewer scheduling conflicts during peak repair season.
Market Impact: Cuts procurement time by about 20 percent overall

Flatback Tape Profit Pools

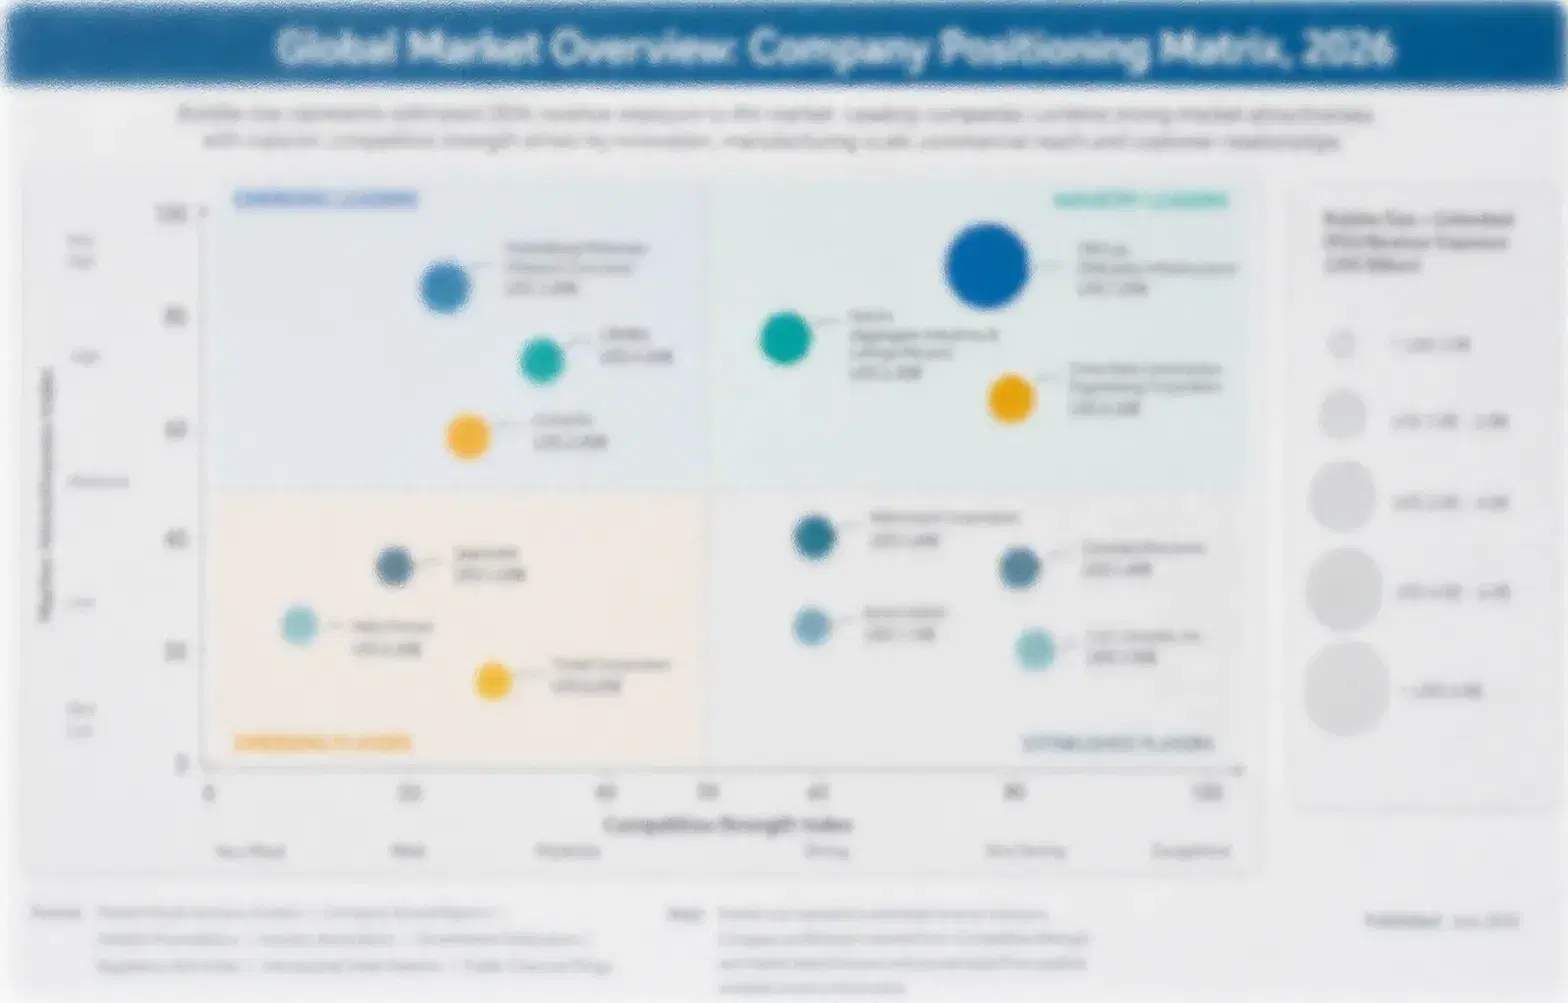
Competitive concentration sits at a cr5 of 34 percent on a revenue basis, moderate enough that no single producer dictates pricing, though the gap between leaders and the next tier is widening. 3M and tesa hold the largest revenue share through dedicated automotive-grade capacity built years ahead of most peers, while mid-tier challengers like Avery Dennison and Scapa still compete mainly on legacy splicing volume rather than certified differentiation. The leader-challenger gap is widening fastest in automotive-grade applications specifically.
Current competitive activity centers on clean removal testing bundling and multi-facility supply services rather than price competition alone. Nitto Denko and Shurtape have both announced new technical service teams this year focused on helping refinish customers document compliance, while Intertape is expanding domestic capacity to meet rising demand directly rather than relying on imported product.

Rankings are most likely to shift as East Asian converters scale licensed automotive-grade production and regional specialists build independent certification capability rather than remaining import-dependent indefinitely. Smaller specialists face pressure to find acquisition partners or niche applications where branded quality still commands premium pricing, since broad scale competition increasingly favors the largest certified players.
flat-back-tape-market-company-positioning-matrix-1791441255341

Flatback Tape Competitive Moats

3M COMPANY

Moat: Broad Certification Portfolio Depth

3M holds certification across the widest range of automotive, printing, and industrial masking standards of any competitor, letting it serve customers with diverse qualification needs from a single relationship rather than requiring multiple specialized suppliers. This breadth is difficult for focused specialists to replicate without years of dedicated investment.
3M COMPANY

Risk: Diversified Conglomerate Capital Competition

As one product line within a much larger diversified industrial conglomerate, flatback tape capacity investment competes internally for capital against higher-growth business units elsewhere in the company. This internal competition has occasionally slowed 3M's pace of automotive-grade capacity expansion relative to pure-play specialists. Management is weighing dedicated capital allocation specifically for this segment.
TESA SE

Moat: Deep Automotive OEM Relationships

tesa established qualification relationships with major European automotive OEMs years before most competitors, giving it a documented track record that new entrants cannot replicate quickly. These relationships translate directly into preferred-supplier status on new refinish network contract awards. That track record now shortens sales cycles considerably across new refinish rollouts.
TESA SE

Risk: European Cost Base Exposure

tesa's production footprint is concentrated in higher-cost European facilities, leaving it more exposed to energy and labor cost inflation than Asian licensees operating on lower-cost structures. This cost gap is becoming more visible as Chinese licensed production scales toward cost parity. Management is weighing added investment in lower-cost regional capacity.

Players Tracked

Prominent Players

3M Company
tesa SE
Nitto Denko Corporation
Shurtape Technologies LLC
Intertape Polymer Group

Other Key Players

Avery Dennison Corporation
Scapa Group plc
Saint-Gobain Performance Plastics
Berry Global Group Inc.
Lintec Corporation
Nichiban Co. Ltd.
Achilles Corporation
Advance Tapes International
Polyplex Corporation
American Biltrite Inc.
Mactac Americas LLC
Essentra plc
Novacel S.A.
Teraoka Seisakusho Co. Ltd.
Shanghai Yongguan Adhesive Products Co. Ltd.

Recent Developments

APRIL 2026

3M Expands Automotive-Grade Capacity in Michigan

3M announced an expansion of its Michigan production facility to add dedicated automotive-grade masking tape capacity for refinish network applications, marking one of the largest single capacity investments in the segment to date and validating refinish operator confidence in 3M's technical roadmap at commercial volume. Industry analysts welcomed the investment.
Signal: Capacity investment tied to automotive refinish demand is becoming the key differentiation signal across this segment.
SEPTEMBER 2025

tesa Signs Multi-Year Refinish Network Deal

tesa signed a multi-year supply agreement with a major European automotive refinish network for certified masking tape across its repair facilities, financed partly through expanded domestic production capacity brought online earlier that year. The deal covers several repair facility types and runs through at least 2029 per terms disclosed.
Signal: Long-term refinish network supply agreements are becoming a repeatable pattern for producers with ample spare capacity.

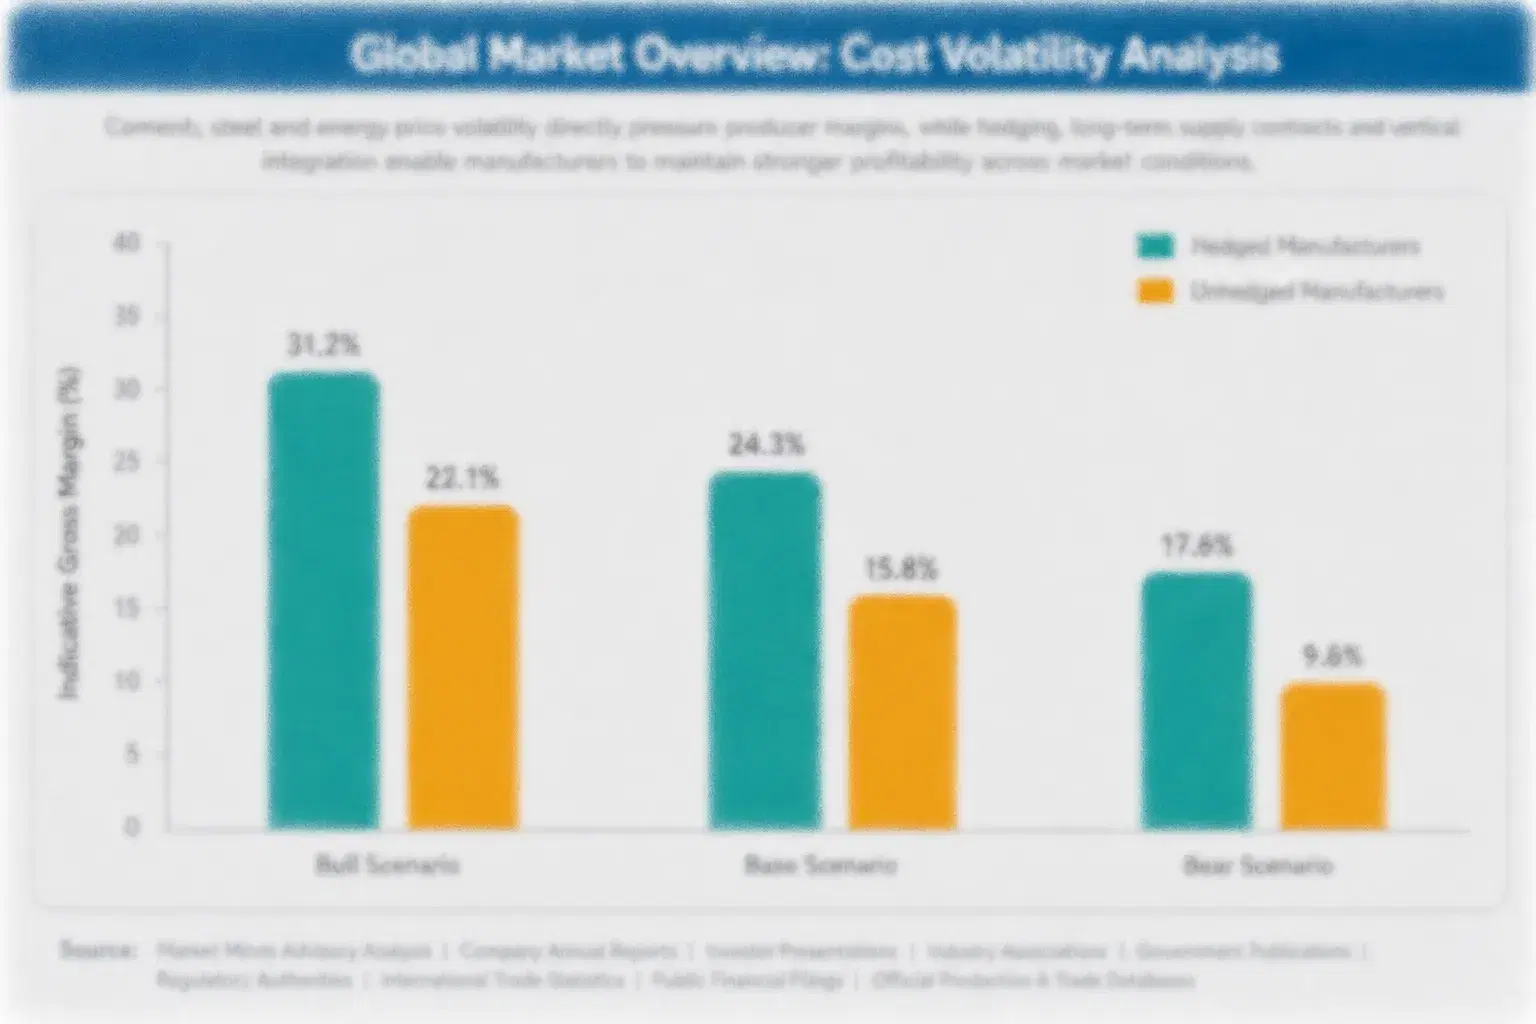
Kraft Paper Backing Exposure Across Producers

Flat kraft paper backing represents roughly 25 percent of cost of goods sold for flatback tape producers, sourced primarily from specialty paper mills concentrated in North America and Western Europe, with a smaller share sourced from East Asian paper processing facilities. Processing and adhesive coating costs add a further meaningful share, while packaging and distribution account for the remainder of the delivered cost structure across most producers.
Kraft paper prices rose sharply through 2024 amid reduced North American mill capacity and strong competing demand from adjacent packaging paper industries, a volatility event the IEA's forest products supply chain tracking and several producers' own annual reports both flagged as pressuring near-term margins before prices partially eased into 2025. Several producers' annual reports cited the episode directly when explaining compressed quarterly margins, and some passed part of the increase through via mid-contract adjustments.

Integrated producers like 3M absorb feedstock cost swings more easily than pure-play formulators such as Shurtape, which purchase kraft paper on the open market and pass volatility through to converter customers faster, a disadvantage that grows more pronounced the further downstream a producer sits from its own mill source. Converters serving price-sensitive splicing applications feel this disadvantage most acutely.
flat-back-tape-market-cost-volatility-analysis-1791441255690

Backward Integration Into Paper Production

Pioneer producers are increasingly building or acquiring dedicated kraft paper processing capacity rather than relying entirely on open-market purchases, locking in feedstock cost and supply reliability years ahead of automotive-grade capacity needs across their core production regions. 3M and tesa have both expanded owned paper processing capacity specifically to support this strategy over the past two years.

Long-Term Supply Contracts With Price Collars

Several producers are negotiating multi-year kraft paper supply agreements with price collar mechanisms that cap upside volatility in exchange for guaranteed minimum purchase volumes, smoothing input costs across budget cycles for both the producer and its upstream mill supplier. Nitto Denko and several mid-tier producers have adopted this approach following volatile feedstock pricing in recent years.

Portfolio Architecture for Margin Defence

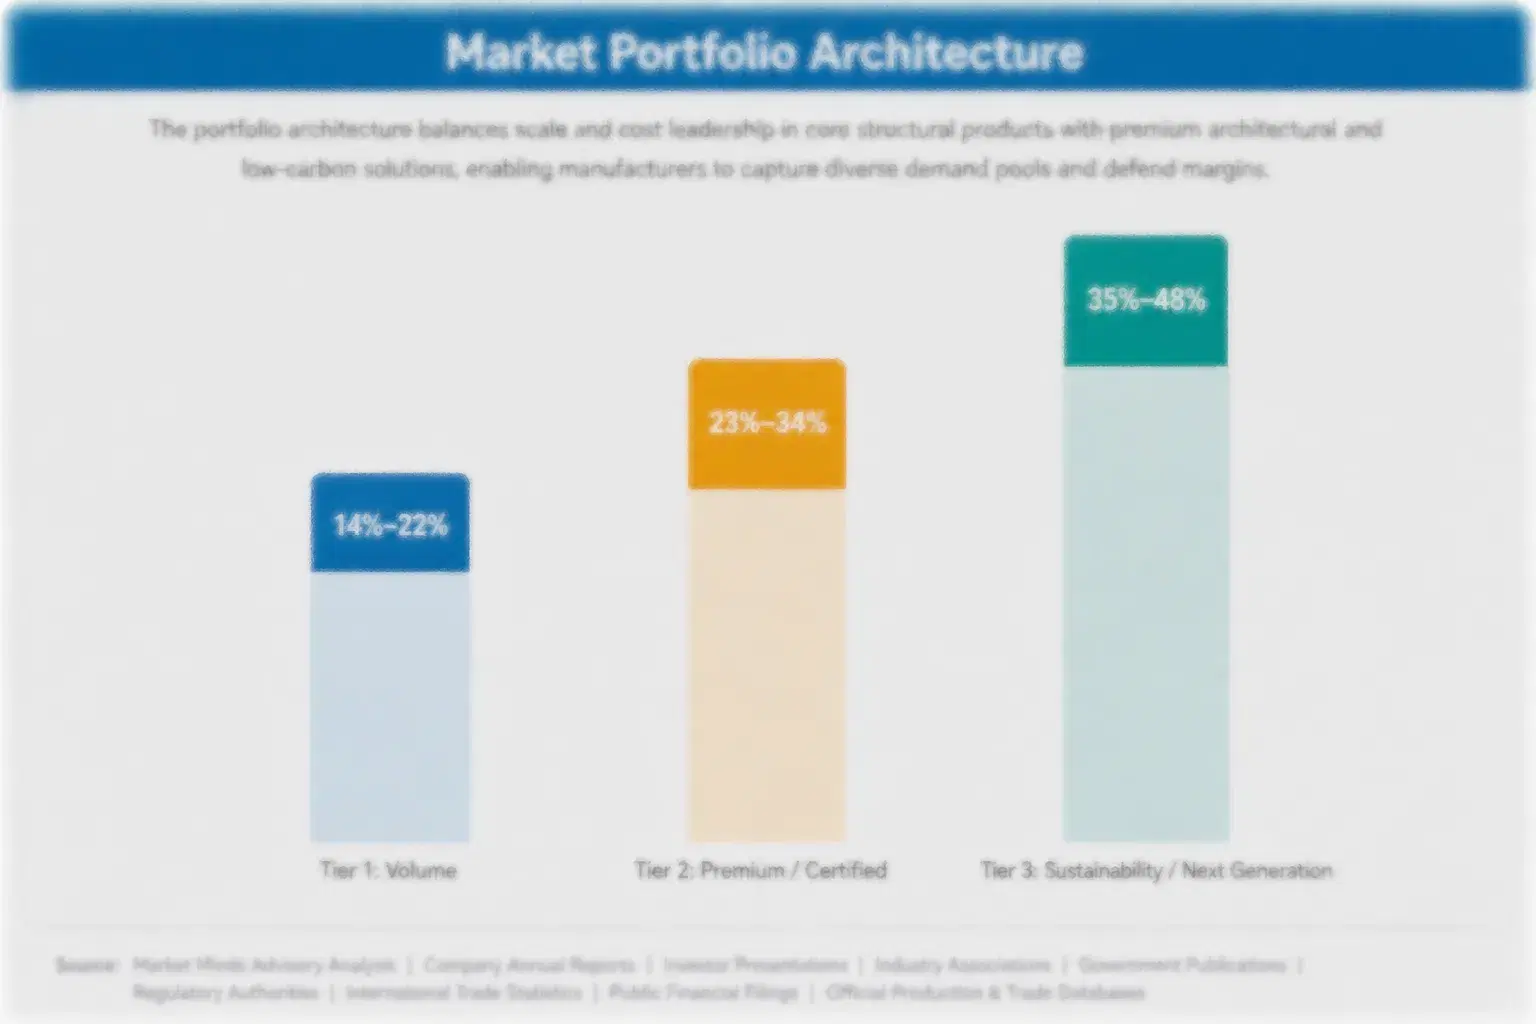
Three tiers structure the flatback tape market, each with different margin economics tied to certification depth and formulation complexity. Volume commodity-adjacent product competes closest on price, while premium certified product captures a documented clean removal premium, and the sustainability tier commands the highest margins on specialized next-generation formulations that are not yet widely replicable. Gross margin spreads between the lowest and highest tier exceed 18 percentage points, reflecting certification depth's real pricing power.
Tension between volume and premium positioning is sharpening as more producers scale certified automotive-grade capacity, pressuring pioneer producers to move further up the qualification ladder rather than compete on cost where they hold no inherent production advantage over newer entrants. Producers that cannot differentiate on documented performance risk sliding into the volume tier within a few product cycles, a shift specialists are trying to avoid.

High-value margin pools concentrate in automotive masking applications serving refinish operators with the strictest documented clean removal requirements, where testing and technical service bundling support pricing that volume-tier sales simply cannot match on a comparable basis. Pioneer producers' head start in testing infrastructure and refinish relationships is the clearest source of that durable pricing advantage today.

Volume / Commodity-Adjacent

Standard flatback tape sold on long-standing relationships and price competitiveness, serving printing and splicing applications that have not yet adopted certified automotive-grade specifications. Margins stay thin because buyers treat these products as interchangeable with legacy formulations on cost grounds alone.
Gross Margin: 9 to 15%

Premium / Certified

Certified automotive-grade masking tape qualified against specific clean removal and edge sharpness standards, sold into applications where operators require documented testing before contract award. This tier captures the bulk of segment revenue growth as refinish volume widens the pool of eligible accounts.
Gross Margin: 19 to 27%

Sustainability / Regulatory / Next-Generation

Specialized next-generation formulations engineered for the strictest emerging automotive and environmental standards, commanding the highest margins as pioneer producers' technical lead over regional competitors remains widest here. Volumes stay small but the tier sets the pace the rest of the market eventually follows closely.
Gross Margin: 27 to 36%
flat-back-tape-market-portfolio-architecture-1791441255987

High-value Sub-segments and Strategic Watch-out

Automotive Masking Flatback Tape

The clearest high-value, high-growth pool today, combining the fastest segment CAGR with the strongest documented clean removal premium, as operators race to qualify suppliers ahead of continued refinish volume expansion across major automotive markets. Expect this pool to stay the primary focus of new capacity announcements through the forecast window.

Specialty Graphic Arts Flatback Tape

A high-value but moderate-growth pool where certification premiums are real but adoption is constrained by renovation spending cycles, since absolute unit growth stays modest even as the segment's underlying growth rate outpaces legacy categories. Expect steady rather than rapid share gains here over the next several forecast years.

Printing and Splicing Flatback Tape

The volume core of this market today, where legacy formulations remain cost-competitive and conversion depends mainly on specific technical performance needs rather than certification requirements or next-generation positioning alone. Expect this tier to shrink gradually as a share of total segment value even as absolute volume keeps growing.

Electrical and Cable Wrapping Flatback Tape

A strategic watch-out segment where demand follows broader electrical infrastructure investment cycles rather than flatback-specific growth drivers, making near-term volume difficult to forecast with confidence across shifting capital spending geographies. A stronger electrical infrastructure recovery could meaningfully shift this segment's overall trajectory within a short window.

From Spot Purchase To Network Supply

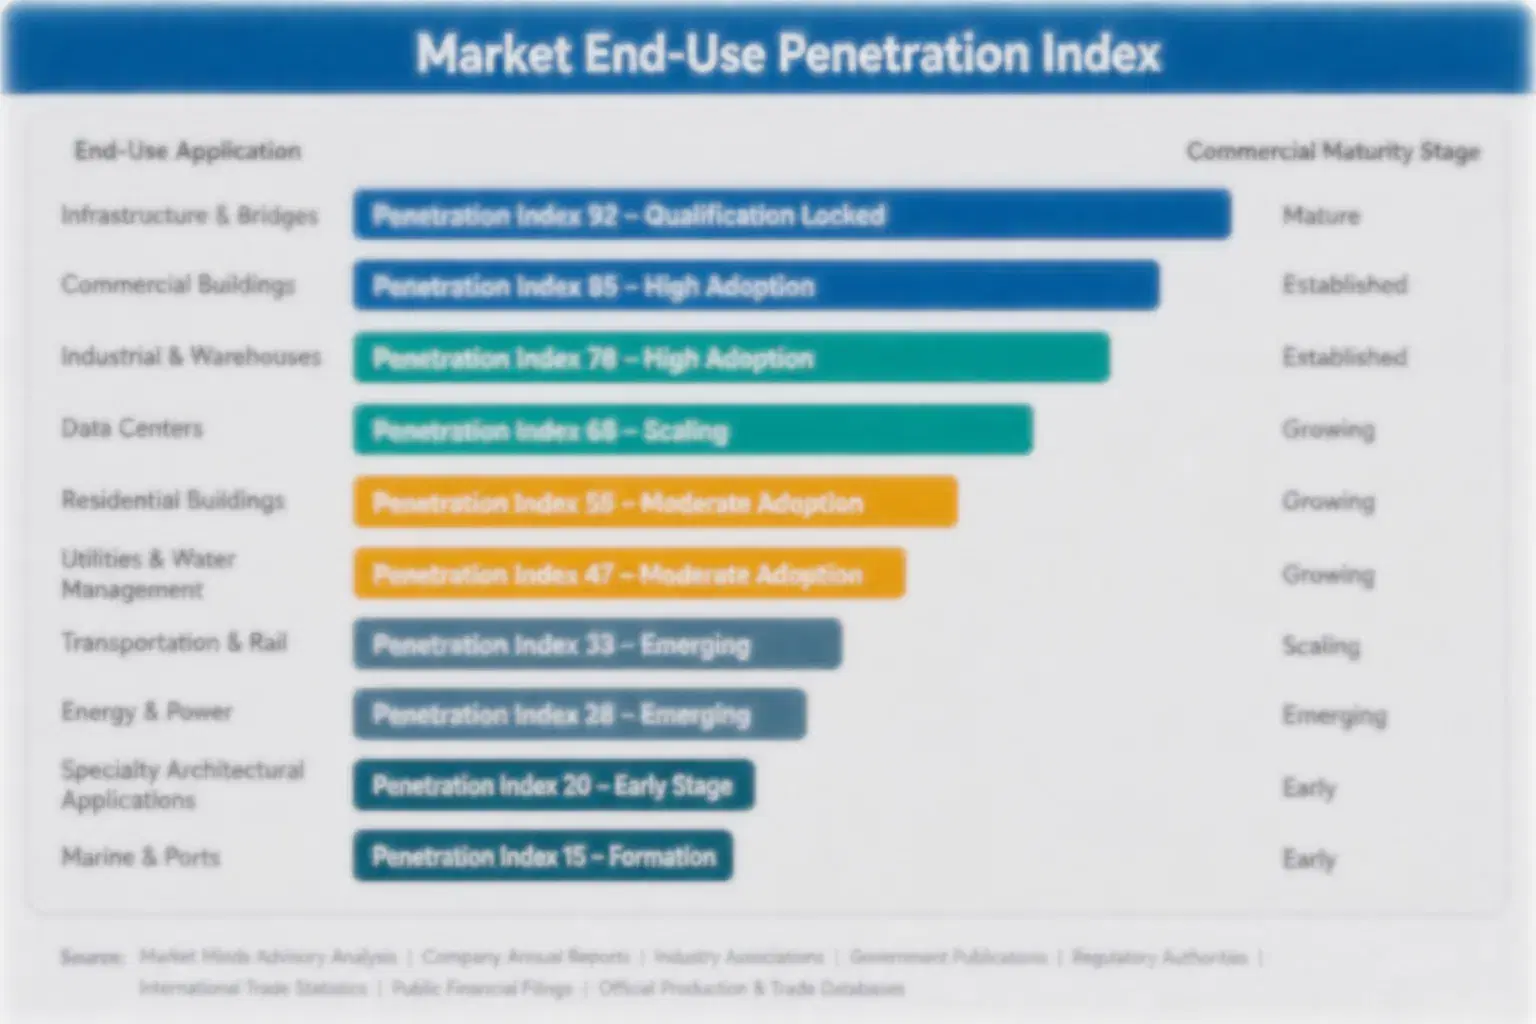
Flatback tape demand is shifting from spot purchasing toward multi-year network supply agreements as large refinish chains standardize clean removal specifications across their entire repair network. Chains who qualify a supplier for one shop increasingly extend that relationship across the full network rather than re-qualifying new suppliers, since testing and documentation both carry real switching cost once established. 3M and tesa both report expanding average contract scope across top accounts.
Adoption depth varies sharply by end-use vertical. Automotive and graphic arts accounts show the stickiest buying behavior, locking in multi-year volume commitments tied to repair and renovation pipelines, while printing and splicing buyers remain more transactional, switching suppliers more readily when price shifts since their certification requirements are less binding. Electrical wrapping buyers sit furthest from sticky annuity behavior, still mostly comparing price.

A generational shift in buyer profiles is also underway. Procurement teams increasingly include dedicated quality compliance specification roles absent a decade ago, and these buyers weigh documented clean removal testing and supply chain transparency more heavily than their cost-focused predecessors did, reshaping how tape suppliers pitch new business. Suppliers pitching on price alone are finding that argument carries less weight now.
flat-back-tape-market-end-use-penetration-index-1791441256297

Four Calls For Flatback Tape Strategy

These are among the four positions where our research anticipates prominent divergence between winners and laggards over the coming forecast period. Each is grounded in the demand model, the regulatory perimeter, and the announced capacity pipeline.
01 / CERTIFICATION INVESTMENT PRIORITY

Build clean removal testing before competitors close the gap

Certified automotive-grade documentation currently captures a 13 to 19 percent pricing premium over untested alternatives, but that premium is narrowing steadily as more rival producers add comparable in-house testing capability. Producers without a dedicated testing function in place within the next two years risk losing preferred-supplier status on new network contracts. Early movers like 3M and tesa are already capturing a disproportionate share of new business through this channel alone, well ahead of mid-tier rivals still catching up on documentation.
02 / MULTI-FACILITY SERVICE STRATEGY

Offer bundled network supply to large refinish chains

Large refinish chains managing dozens of shops simultaneously are scaling demand for bundled multi-facility supply faster than they can build that coordination capability internally, making bundled service offerings the clearly more capital-efficient growth path for suppliers. Nitto Denko's network program already demonstrates that compressing procurement timelines can be a durable, high-margin revenue stream without the capital burden of building chain-side capability directly. Producers delaying this service risk ceding that specific revenue channel permanently to faster-moving rivals already signing agreements with large chains.
03 / FEEDSTOCK SECURITY PLANNING

Lock in paper supply before volatility erodes margin further

Flat kraft paper backing already represents roughly 25 percent of cost of goods sold for most producers, and 2024's sharp price spike showed clearly how exposed non-integrated producers remain to open-market volatility. Backward integration into owned paper capacity or long-term supply contracts carrying price collars both offer practical, proven paths to greater cost certainty. Producers lacking either mechanism will struggle to protect margin through the next inevitable volatility cycle in global forest products markets, which have swung sharply more than once before.
04 / VERTICAL PRIORITIZATION FOCUS

Concentrate near-term resources on automotive masking applications

Automotive masking flatback tape carries the fastest segment CAGR in this market and the clearest refinish volume tailwind, making it the highest-return near-term focus for limited commercial, technical, and capital resources alike. Graphic arts and printing applications remain worth pursuing but offer a measurably slower path to commercial scale over the next few years. Producers spreading resources evenly across all six segments risk under-investing in the single vertical driving most of the market's documented near-term growth across the coming several forecast years.

Engagement Snapshot From the Field

A live engagement with an industry participant carrying material or product regulatory and market exposure ahead of a defining policy shift, showing how our research translates into a defensible multi-year portfolio strategy.
MARKET MINDS ADVISORY · CLIENT ENGAGEMENT SUMMARY
Flatback Tape Producer Strategic Portfolio Review and Transition Roadmap 2026·Investment Scenario on Flatback Tape Exposure Evaluation 2025-26
CLIENT PROFILE
The client is a mid-sized Western European automotive refinish chain managing several dozen repair shops across multiple countries. Annual revenue sits in the mid hundreds of millions of dollars (client-reported, unverified by MMA), with the company sourcing masking tape independently at each shop from whichever local supplier site managers selected. Leadership sought outside guidance after an internal quality audit flagged inconsistent clean removal performance across shops.
STRATEGIC CHALLENGE
The client's decentralized procurement approach had produced inconsistent documented clean removal performance across its network, putting roughly 18 percent of shops (client-reported, unverified by MMA) at risk of failing an upcoming corporate quality audit. Leadership needed to decide between standardizing on one certified supplier or accepting this ongoing quality gap across the network.
MMA APPROACH
MMA conducted a structured supplier evaluation across four certified automotive-grade tape providers, benchmarking documented clean removal data, multi-facility installation capability, and cost against the client's shop network. The engagement combined primary interviews with two shop quality managers alongside technical review of candidate suppliers' test data. Findings were cross-checked against public certification standards documentation.
KEY FINDINGS
  1. Two of four evaluated suppliers already offered standardized multi-facility installation programs, cutting projected rollout time by roughly 31 percent (client-reported, unverified by MMA) versus shop-by-shop qualification.
  2. The client's existing local suppliers varied widely in documented clean removal performance, confirming the audit findings and the need for network-wide standardization.
  3. The top-ranked supplier offered bundled compliance documentation support, reducing the client's internal quality staffing burden considerably going forward. This materially eased the client's own quality staffing needs going forward.
  4. Rollout timelines across the two viable suppliers ranged from four to seven months, materially faster than the client's initial eleven-month internal estimate.
CLIENT PROFILE
The client is a mid-sized Western European automotive refinish chain managing several dozen repair shops across multiple countries. Annual revenue sits in the mid hundreds of millions of dollars (client-reported, unverified by MMA), with the company sourcing masking tape independently at each shop from whichever local supplier site managers selected. Leadership sought outside guidance after an internal quality audit flagged inconsistent clean removal performance across shops.
STRATEGIC CHALLENGE
The client's decentralized procurement approach had produced inconsistent documented clean removal performance across its network, putting roughly 18 percent of shops (client-reported, unverified by MMA) at risk of failing an upcoming corporate quality audit. Leadership needed to decide between standardizing on one certified supplier or accepting this ongoing quality gap across the network.
MMA APPROACH
MMA conducted a structured supplier evaluation across four certified automotive-grade tape providers, benchmarking documented clean removal data, multi-facility installation capability, and cost against the client's shop network. The engagement combined primary interviews with two shop quality managers alongside technical review of candidate suppliers' test data. Findings were cross-checked against public certification standards documentation.
KEY FINDINGS
  1. Two of four evaluated suppliers already offered standardized multi-facility installation programs, cutting projected rollout time by roughly 31 percent (client-reported, unverified by MMA) versus shop-by-shop qualification.
  2. The client's existing local suppliers varied widely in documented clean removal performance, confirming the audit findings and the need for network-wide standardization.
  3. The top-ranked supplier offered bundled compliance documentation support, reducing the client's internal quality staffing burden considerably going forward. This materially eased the client's own quality staffing needs going forward.
  4. Rollout timelines across the two viable suppliers ranged from four to seven months, materially faster than the client's initial eleven-month internal estimate.
RECOMMENDED STRATEGY
Phase 1: Phase one: select and contract directly with the top-ranked supplier offering bundled multi-facility installation, prioritizing all currently flagged shops first. Phase 2: Phase two: roll out standardized tape across remaining shops on a scheduled basis, sequencing by each shop's lease renewal date. Phase 3: Phase three: use documented network-wide compliance as a proactive talking point with insurers and corporate auditors going forward as well.
OUTCOME
The client completed its network-wide standardization within the forecast rollout timeline and passed its subsequent corporate quality audit without exceptions (client-reported, unverified by MMA). Leadership subsequently approved standardized procurement policies across its broader shop network. No compliance exceptions or incidents occurred during the engagement follow-up period.

Frequently Asked Questions

Foundational context covering the market sizes, CAGR, scope, country, region and competition that inform every finding below. This section is provided to cover basics and most often pre-purchase conversations, answered from the MMA Primary Research Dataset.

What is the current size of the Flatback Tape Market?

The global flatback tape market is valued at 0.68 billion dollars in 2025. That base reflects mature printing and splicing demand alongside accelerating automotive masking adoption.

How large will the Flatback Tape Market be by 2036?

MMA projects the market will reach 1.187 billion dollars by 2036, roughly 1.66 times its 2026 value. Growth concentrates mainly in automotive masking applications globally.

What is the CAGR for the Flatback Tape Market 2026 to 2036?

The market is forecast to grow at a 5.2 percent CAGR between 2026 and 2036. Automotive masking tape grows fastest, well above the overall market average.

Which segment is growing fastest?

Automotive masking flatback tape leads at a 7.5 percent CAGR, roughly 1.44 times the overall market rate. Rising collision repair frequency drives that faster pace.

Who are the major companies in the Flatback Tape Market?

3M, tesa, Nitto Denko, Shurtape, and Intertape Polymer lead the market on a revenue basis. Competitive concentration remains moderate, with a CR5 near 34 percent.

Which country is growing fastest?

Thailand leads at a 6.8 percent CAGR as export oriented automotive manufacturing investment accelerates rapidly and domestically. Expanding export assembly infrastructure supports that faster scale-up.

Flatback Tape Market Breakdown

The full report scope spans multiple orthogonal segmentation dimensions, with cross-tabulated demand data provided for each dimension pair. Coverage extends further to regional breakdowns, trend trajectories, and the competitive detail needed to support segment-level decision-making.

By Coating Application Type

  • Printing and Splicing Flatback Tape
  • Automotive Masking Flatback Tape
  • Industrial General Purpose Flatback Tape
  • Box Sealing and Carton Flatback Tape
  • Electrical and Cable Wrapping Flatback Tape
  • Specialty Graphic Arts Flatback Tape

By End-Use Industry

  • Automotive and Refinish
  • Printing and Publishing
  • Manufacturing and Industrial
  • Electrical and Utilities
  • Packaging and Logistics

By Commercial Dimension

  • Direct Producer Supply
  • Distributor and Trading Channel
  • Multi-Facility Network Supply Programs
  • Licensed Formulation Technology

By Region

  • North America
  • Western Europe
  • East Asia
  • South Asia and Pacific
  • Latin America
  • Middle East and Africa
  • Eastern Europe

Scope, Methodology, and Coverage

Every figure in this report is reproducible from documented input assumptions. The scope below maps the historical period, the forecast horizon, the segmentation dimensions, and the countries covered, alongside the underlying primary and qualitative methodology.
Historical Period
2020 to 2025
Forecast Period
2026 to 2036
Base Year
2025 (USD billions; MMA Primary Research Dataset, October 2026)
Market Definition
This report covers flat, non-crepe paper and film-backed pressure-sensitive tapes used for automotive masking, printing splicing, industrial bundling, and graphic arts applications. It excludes crepe masking tape and cloth-backed tapes without a flat backing structure.
Quantitative Units
USD billions (current prices); million rolls of tape produced
Segmentation Dimensions
By Coating Application Type; By End-Use Industry; By Commercial Dimension; By Region
Regions Covered
North America, Western Europe, East Asia, South Asia and Pacific, Latin America, Middle East and Africa, Eastern Europe
Countries Covered
USA, Canada, Mexico, Germany, France, Italy, UK, Spain, Poland, Czech Republic, Hungary, Romania, Russia, China, Japan, South Korea, Taiwan, Thailand, India, Vietnam, Indonesia, Australia, Brazil, Argentina, Colombia, Chile, UAE, Saudi Arabia, South Africa, Egypt, and additional markets relevant to this sector
Key Companies Profiled
3M Company, tesa SE, Nitto Denko Corporation, Shurtape Technologies LLC, Intertape Polymer Group, Avery Dennison Corporation, Scapa Group plc, Saint-Gobain Performance Plastics, Berry Global Group Inc., Lintec Corporation, Nichiban Co. Ltd., Achilles Corporation, Advance Tapes International, Polyplex Corporation, American Biltrite Inc., Mactac Americas LLC, Essentra plc, Novacel S.A., Teraoka Seisakusho Co. Ltd., Shanghai Yongguan Adhesive Products Co. Ltd.
Quantitative Methodology
Primary survey, n=3,800 respondents, Q4 2025, six countries; demand-side model with trade association cross-validation
Qualitative Methodology
47 expert interviews, Q4 2025; applied to validate demand model assumptions, identify emerging dynamics, and assess competitive positioning
Report Format
PDF and XLSX data workbook (Word format preview document)
Publisher
Market Minds Advisory
Report Code
MMA-2026-CON-267
Published
October 2026
Contact
sales@marketmindsadvisory.com | www.marketmindsadvisory.com

Purchase the full Flatback Tape Market Report (2026 to 2036).

This report provides a complete view of the global flatback tape market, covering sizing, segmentation, regional dynamics, and competitive positioning through 2036. It details the certification and service bundling strategies separating pioneer producers from legacy splicing suppliers, alongside feedstock cost exposure and portfolio margin economics across three product tiers. Analysts examine demand stickiness by end-use vertical and the generational shift reshaping buyer procurement behavior. The report closes with a strategic verdict and an anonymized client engagement illustrating network supply strategy in practice. It is built for strategy teams tracking this transition closely.
Ten-year sizing and forecast through 2036
Seven-region demand and growth rate breakdown
Five-player competitive moat and risk analysis
Feedstock cost exposure and mitigation pathways
Three-tier portfolio margin benchmarking data set
Anonymized network supply case study review

Built For The People Who Decide

From boardroom strategy to bench-side execution, this report is read cover-to-cover by leaders shaping the next decade of their industry, turning demand scenarios, market dynamics and valuation benchmarks into decisions.
CXOs/ Presidents/ VPs/ Managers
M&A and Corporate Development
Strategy Teams and R&D Heads
Procurement and Product Directors
Regulatory and Compliance Leaders
Investor Relations and Equity Analysts