Market Minds Advisory
Electronic Cleaning Solvents Market

Electronic Cleaning Solvents Market: The Fluorochemical Withdrawal, Qualification Lock-In, and Repeated Forced Transitions

This industry has been forced through three chemistry transitions in thirty years, and the withdrawal of a dominant fluorochemical supplier has now started a fourth before the last one finished.

Lead Analyst

Bilal Shaikh

Published

September 2026

Make Smarter Decisions with Customized Research Insights

Request a free sample report and evaluate market opportunities, growth trends, and competitive dynamics relevant to your business needs.

2025 MARKET VALUE$2.0BMarket Size 2025
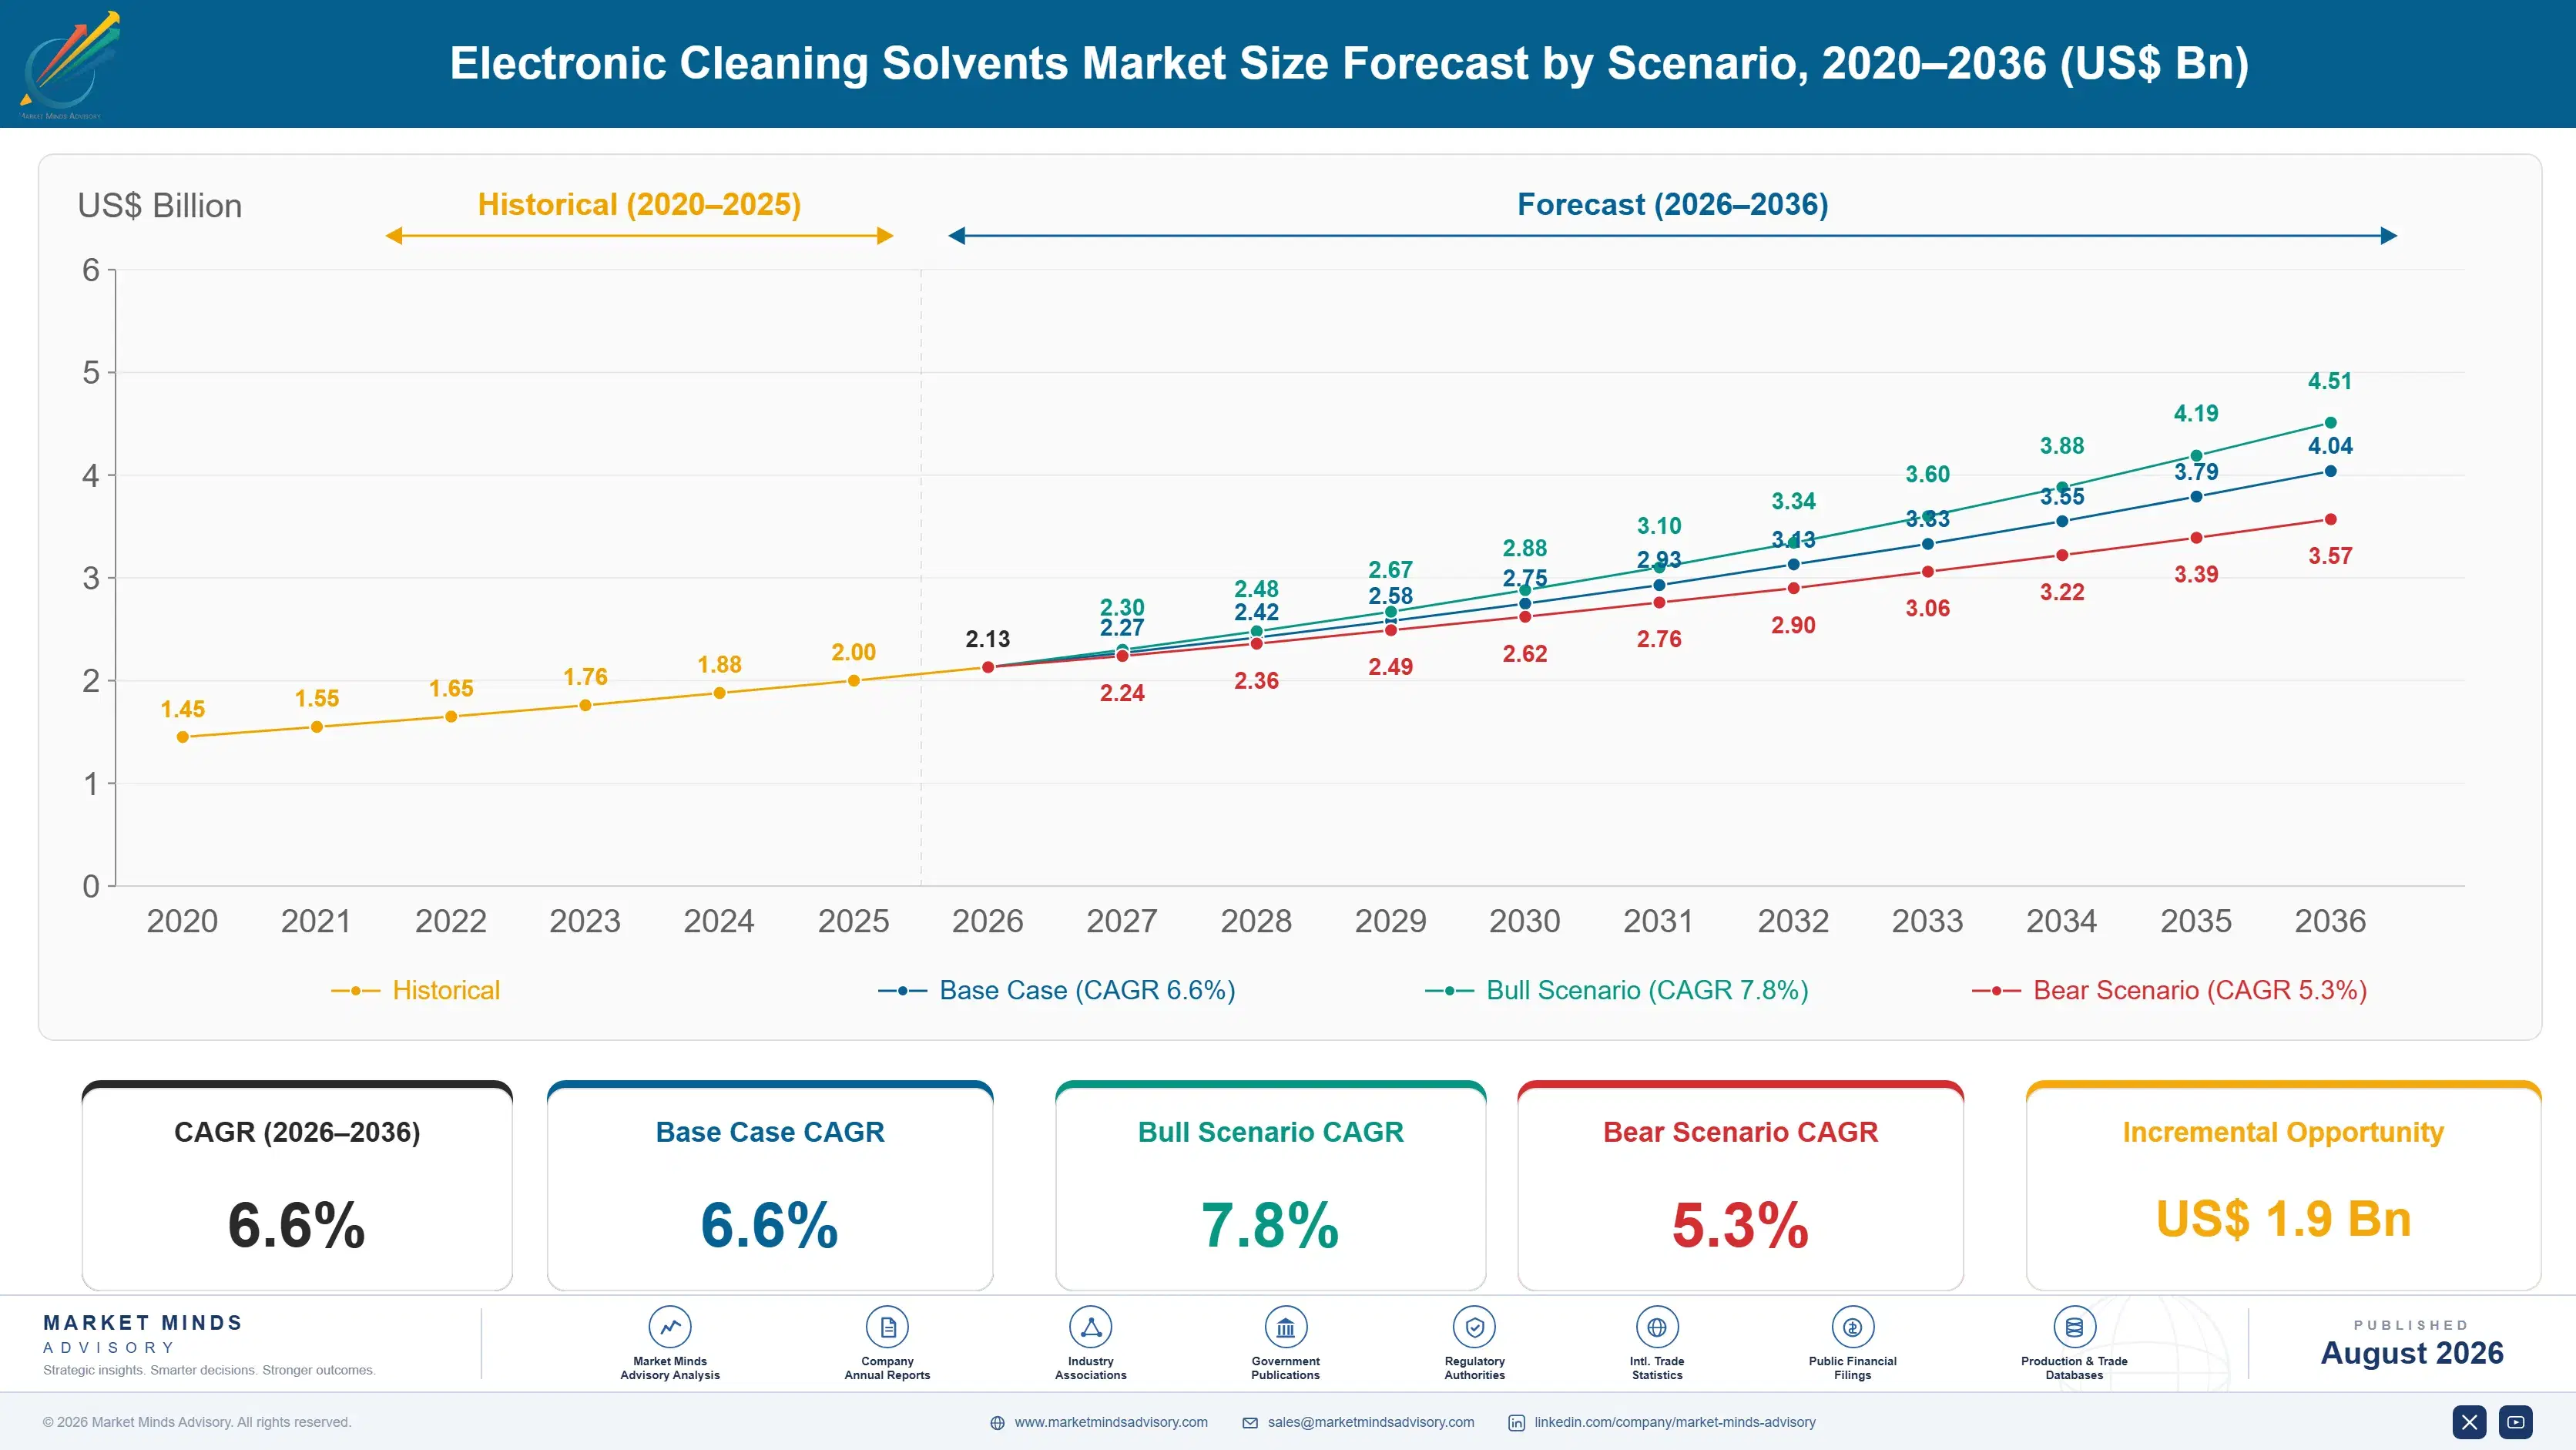
2036 FORECAST VALUE$4.0BBase Case , 2026 to 2036
CAGR 2026 TO 20366.6 %Bull 7.8% / Bear 5.3%
INCREMENTAL OPPORTUNITY$1.9BNet 10- year value creation
EXPANSION MULTIPLE1.89x2036 value over 2026 base
Strategic Levers
M&A Pipeline
Regional Outlook
Country Rankings
Competitive Intelligence
Segmental Deep-dive
Call-Us : 91 93563 13602

Executive Snapshot and Market Trajectory

Qualifying a new cleaning fluid into an electronics production line takes fourteen months, because cleanliness determines whether a circuit assembly survives its warranty. That timeline is what makes a forced chemistry transition genuinely painful rather than merely inconvenient for everyone involved. Nobody requalifies twice by choice.
Commercial power sits with suppliers holding qualified positions on production lines rather than with anyone able to blend a solvent. Hydrofluoroolefin chemistries grow fastest at 14.8%, roughly 2.24 times the market, as formulators move away from fluorinated compounds facing restriction. East Asia holds 30% of total global value, carried by circuit assembly and semiconductor manufacturing concentrated across the region. Advanced packaging is raising cleanliness demands at the point where cleaning is hardest.
Concentration is high at roughly 51% for the top five, and fluorochemical manufacturing capability explains most of it. A dominant supplier withdrawing from fluorinated production has forced requalification across thousands of lines simultaneously. Vapour degreasing recovers 64% of fluid, which matters at forty-two dollars a litre. Suppliers arriving with drop-in replacements took positions that normally need a decade to win. Support rather than product performance decided it.
Market Definition
The market comprises precision cleaning solvents for electronics manufacturing and maintenance, covering hydrofluoroether solvents, hydrofluoroolefin solvents, brominated and chlorinated solvents, modified alcohol and hydrocarbon blends, and aqueous and semi-aqueous systems. Value is measured at supplier level across circuit assembly, semiconductor, optical, and maintenance applications. Industrial metal degreasing outside electronics, photoresist strippers and developers, chemical mechanical planarisation slurries, cleaning equipment, and consumer electronics care products fall outside scope.
Base Year Value
$2.0B in 2025 (MMA Primary Research Dataset, August 2026)
Forecast Period
2026 to 2036, eleven discrete annual values
CAGR
6.6% base case. Bull 7.8%. Bear 5.3%.
Fastest Growth Segment
Hydrofluoroolefin Solvents: 14.8% CAGR
Fastest Growth Country
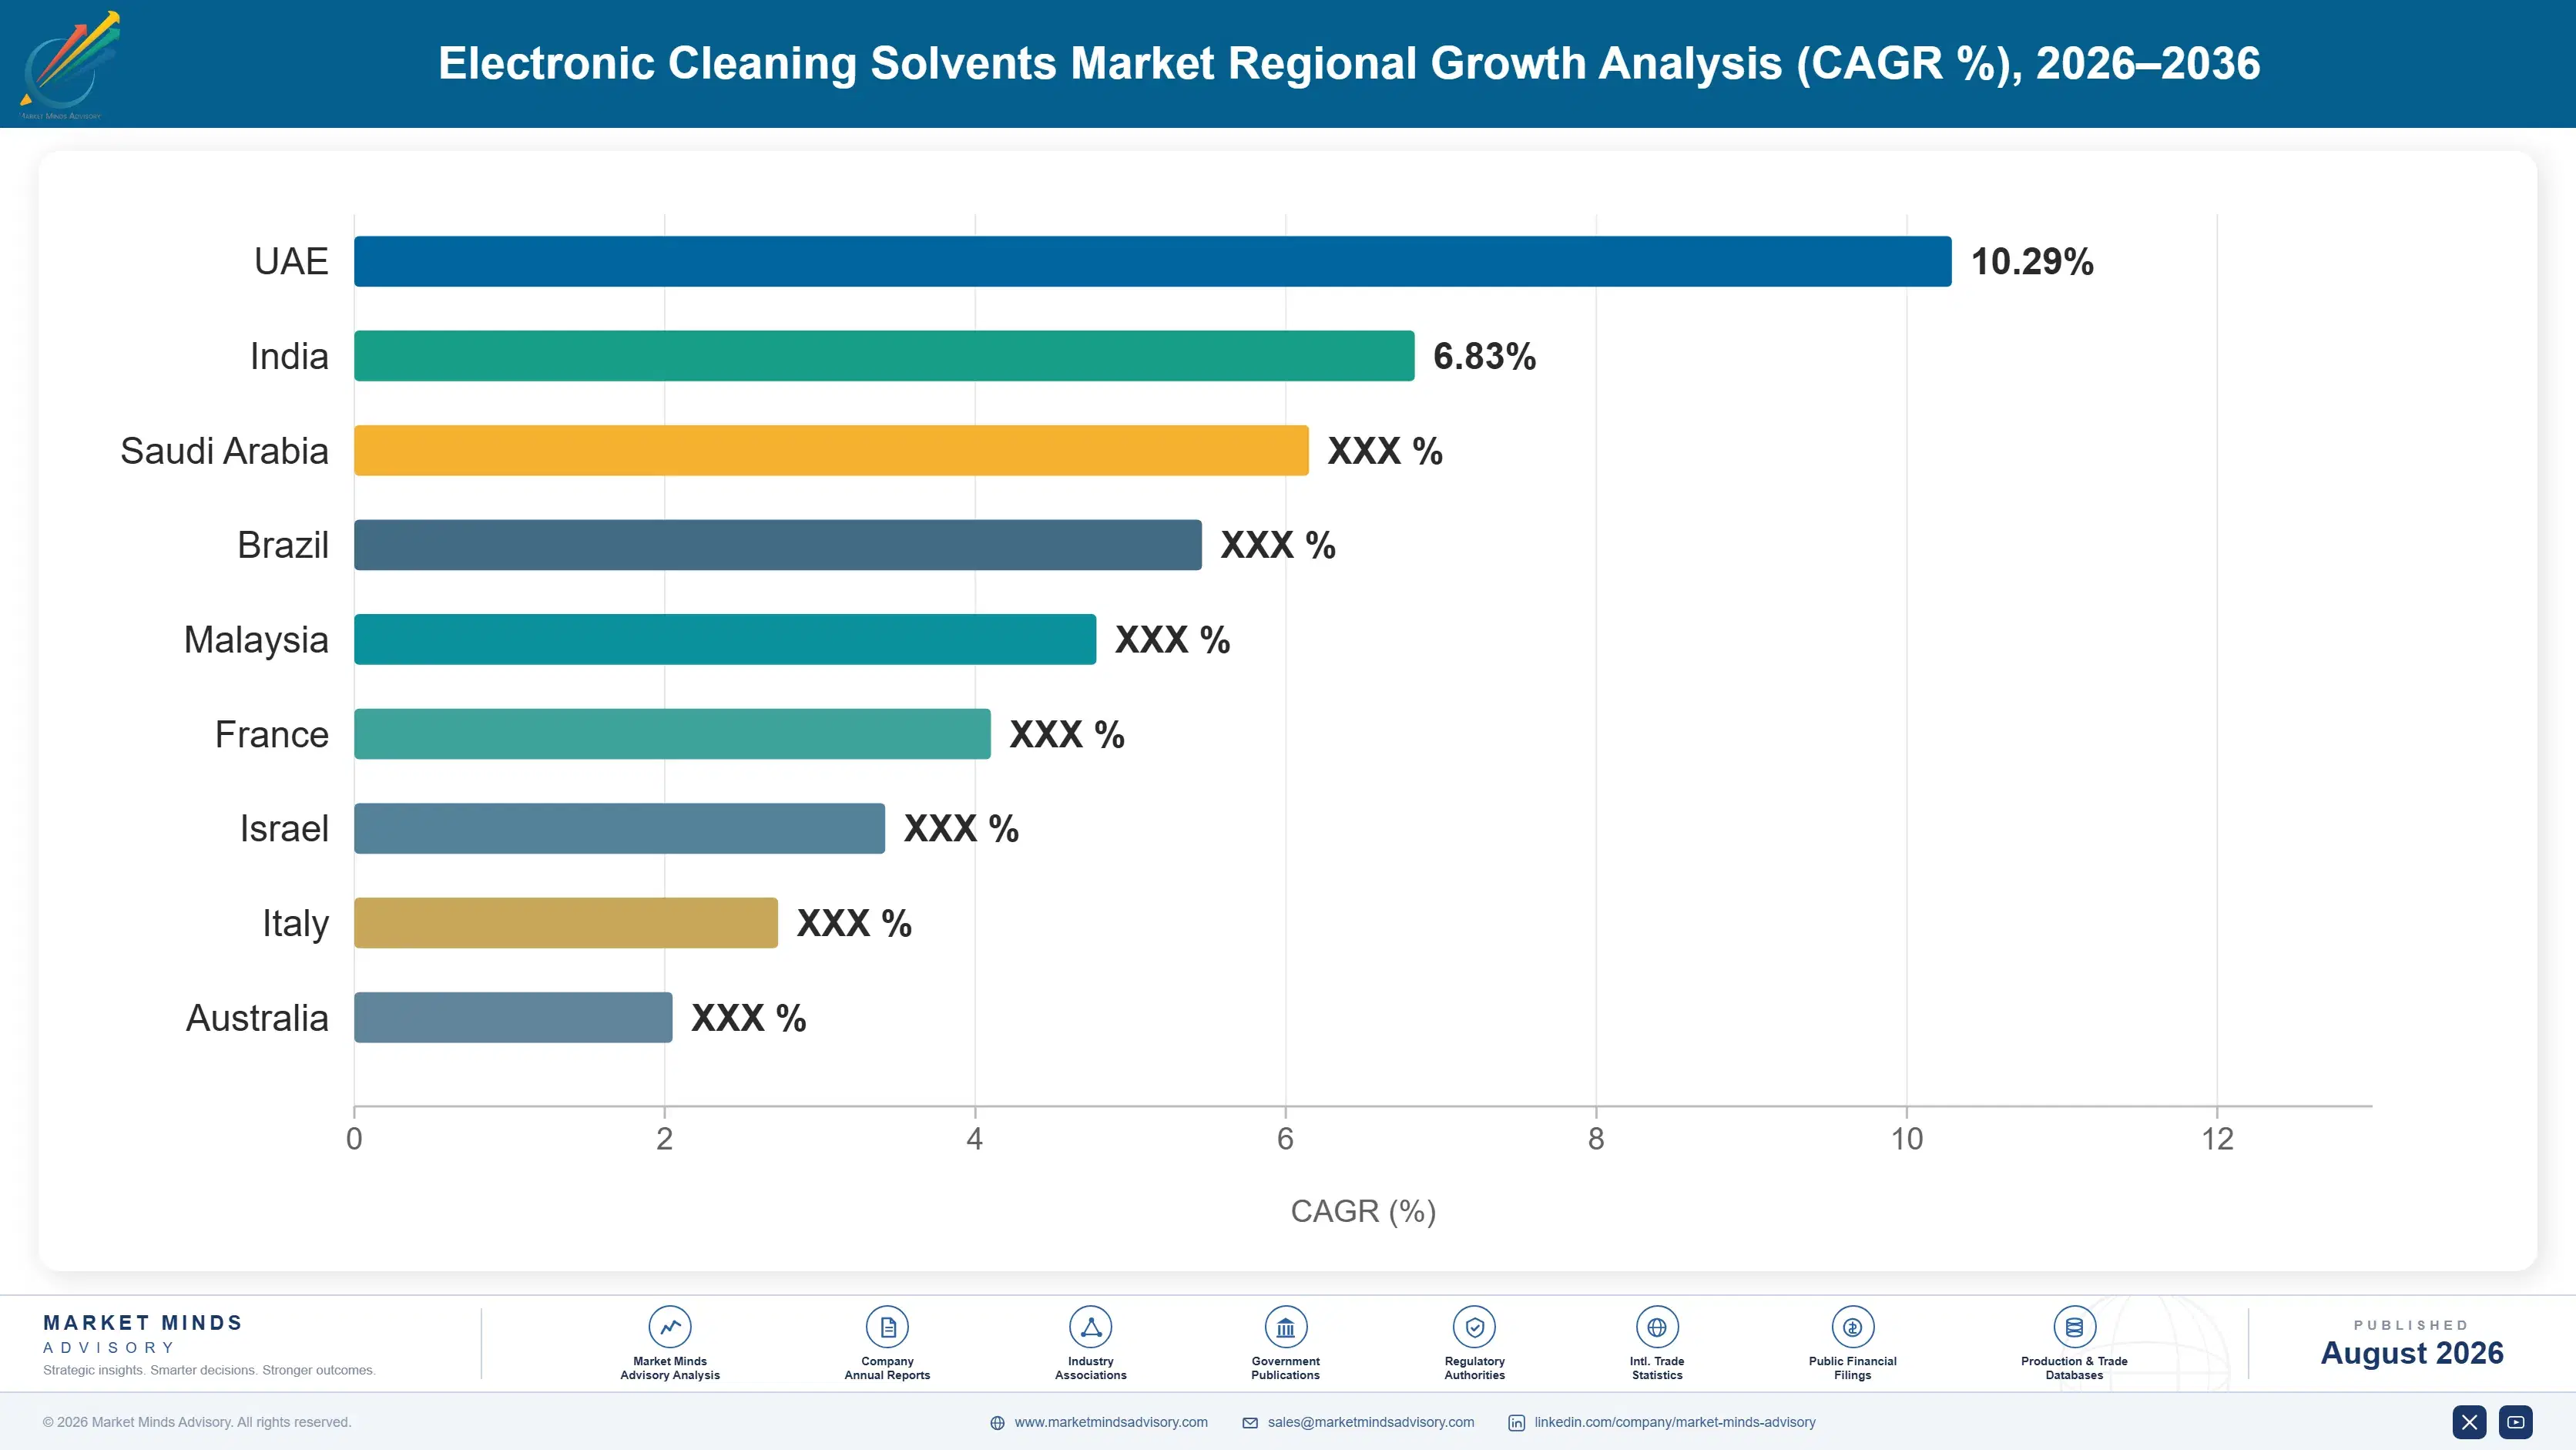
India: 9.8% CAGR
Fastest Growth Region
South Asia and Pacific: 8.7% CAGR
Largest Region
East Asia: 30% of 2025 global value
Market Leaders
3M, Chemours, Honeywell, AGC Chemicals, and Zestron lead on precision electronics cleaning solvent supply. Source: company annual reports and MMA Analysis, July 2026.
Primary Survey
n=3,800 procurement and R&D decision-makers, Q4 2025, six countries
Methodology
Demand-side build-up, cross-validated against public data, 47 expert interviews

Electronic Cleaning Solvents Market Forecast Scenarios

electronic-cleaning-solvents-market-size-forecast-scenario-1787549396349
Between 2020 and 2025 regulation drove almost everything. Brominated and chlorinated solvents continued their long withdrawal under toxicity restrictions, hydrofluoroether chemistries took the resulting volume, and then fluorochemical restriction proposals put those under question too. Electronics production volumes moved with the semiconductor cycle throughout. The 5.4% historical growth reflects a market repeatedly reformulating rather than one growing on any underlying demand expansion.
The 6.6% base case rests on three mechanisms. Component miniaturisation reduces standoff heights beneath packages to the point where flux residues cannot be reached by aqueous cleaning, which sustains solvent demand in applications that had been migrating away. Fluorochemical restriction is pushing formulators toward hydrofluoroolefin and modified hydrocarbon chemistries that price differently. And electronics assembly volumes keep growing across South and Southeast Asia as production localises. Regulation rather than customer preference governs all three of them.
The 7.8% bull case assumes miniaturisation continues favouring solvent cleaning and hydrofluoroolefin capacity scales without supply disruption. The 5.3% bear case reflects broad fluorochemical restriction capturing replacement chemistries too, aqueous systems taking share as equipment improves, and electronics production weakness through a semiconductor downcycle. Regulatory scope decides far more than any technical development here. Nothing else matters much.

Three Forced Transitions and Counting

Three things set the commercial shape of this market. Qualification comes first, because approving a cleaner into an electronics line requires ionic contamination testing, surface insulation resistance work, and reliability validation that takes fourteen months and locks the supplier in afterwards. Regulatory status comes second, since this industry keeps being forced to abandon chemistries. Recovery economics come third and matter enormously at these prices.
TOP-FIVE CONCENTRATION51%Share of global precision cleaning solvent supply held by leaders
AVERAGE SELLING PRICEUSD 42 per litreBlended pricing across fluorinated and aqueous cleaning chemistries
ELECTRONICS ASSEMBLY SHARE58%Portion of volume consumed in circuit assembly and defluxing
FLUOROCHEMICAL COST SHARE47%Fluorinated feedstock input within total product formulation cost
SOLVENT RECOVERY RATE64%Portion of vapour degreasing fluid recovered and reused onsite
QUALIFICATION CYCLE LENGTH14 monthsTypical time to approve a new cleaner into production
The transition history explains the caution. Chlorinated solvents went first on ozone and toxicity grounds, brominated replacements followed under their own toxicity findings, and hydrofluoroethers took the volume as the supposedly permanent answer. Restriction proposals covering fluorinated compounds broadly, combined with a dominant supplier withdrawing from fluorochemical production entirely, have now put that answer in question too. Engineering teams no longer treat any answer as permanent.
Miniaturisation cuts against the expected migration to aqueous cleaning. Component standoff heights beneath modern packages have fallen to a point where water simply cannot flow underneath and out again reliably, while a low surface tension solvent can. That physical reality has held solvent demand in applications where cost and environmental pressure would otherwise have moved them years ago. Miniaturisation continues, so the constraint tightens rather than easing.
"Every fifteen years this industry is told its main chemistry is unacceptable and given a few years to find another. The engineers have stopped believing any answer is permanent, which is why the smart formulators now sell a transition plan rather than a product. Qualification takes fourteen months and nobody wants to do it twice."
Practice Director, Electronic Chemicals and Precision Cleaning · MMA Chemicals and Materials Practice · August 2026

Market Trends

Fluorochemical Withdrawal Forces Requalification Across Thousands of Lines

A dominant supplier exiting fluorinated chemical production removed the leading hydrofluoroether family from the market on a published timetable, which forced electronics manufacturers to qualify replacements simultaneously rather than gradually. Qualification takes fourteen months per line and demands ionic contamination, surface insulation resistance, and reliability testing that engineering teams must schedule around production. The scramble has been considerable. Suppliers with drop-in replacement chemistries and qualification support capability have taken positions that would normally have required a decade of patient selling to win from an incumbent. The window closes as lines complete requalification.
Market Impact: Assembly takes 58% of volume
Component Miniaturisation Reverses the Migration to Aqueous

Standoff heights beneath modern packages have fallen far enough that water cannot flow under a component and back out reliably, leaving flux residue trapped where it will eventually cause failure. Low surface tension solvents penetrate those gaps and evaporate cleanly, which aqueous systems cannot match regardless of pressure, temperature, or agitation applied. That physical constraint has held solvent demand in assemblies where cost and environmental pressure had been steadily pushing manufacturers toward water. Miniaturisation continues, which means the constraint tightens rather than easing over the forecast period. Advanced packaging accelerates that constraint further.
Market Impact: Recovery reaches 64% of fluid

Market Opportunities and Growth Drivers

Electronics Assembly Localisation Expands Regional Solvent Demand

Circuit assembly capacity has been distributed away from single-country concentration toward India, Vietnam, Thailand, Mexico, and Eastern Europe as manufacturers diversify supply chains, and each new facility qualifies and consumes cleaning chemistry. Assembly takes 58% of volume and follows production location directly, since solvent is consumed where boards are built. New facilities also qualify chemistry from scratch rather than inheriting incumbent positions, which makes them the most contestable demand in this market. Suppliers with technical service reach into those locations capture positions that will hold for the facility's operating life.
Market Impact: Three transitions in 30 years

Recovery Systems Improve the Economics of Premium Chemistry

Vapour degreasing equipment recovers 64% of fluid on average and considerably more on well-maintained systems, which transforms the cost comparison between a forty-two dollar per litre solvent and a cheaper alternative that is not recovered. Manufacturers running closed systems consume far less than open cleaning would require, and the equipment investment pays back on chemistry cost alone in demanding applications. Suppliers who sell recovery equipment and maintenance alongside chemistry make the premium argument concrete rather than theoretical, and they also lock the account through the installed equipment. Installed equipment then holds the account firmly.
Market Impact: Aqueous costs 70% less

Market Restraints and Challenges

Repeated Regulatory Transitions Have Exhausted Customer Patience

Electronics manufacturers have been forced through chlorinated, brominated, and now fluorinated chemistry withdrawals in three decades, each requiring fourteen months of qualification work they did not choose. The root cause is that effective solvents tend to be volatile halogenated compounds, and volatility plus halogenation is precisely what regulators keep finding unacceptable. Engineering teams now discount permanence claims entirely. Suppliers mitigate by offering transition roadmaps, qualification support, and chemistry families designed to accommodate future substitution, which acknowledges the problem rather than pretending it has been solved. Honesty about impermanence now sells better.
Market Impact: Requalification takes 14 months each

Aqueous Alternatives Win Wherever Geometry Permits Them

Water-based cleaning costs far less per unit, carries no solvent regulatory exposure, and performs perfectly well on assemblies where component standoff allows flow underneath. The root cause of continued solvent use is geometry rather than chemistry preference. As cleaning equipment improves in agitation, spray pressure, and drying capability, the boundary where aqueous stops working keeps moving. Solvent suppliers mitigate by concentrating on genuinely difficult geometries, offering hybrid semi-aqueous systems, and selling recovery economics rather than competing on cost per litre where they cannot win. Geometry is the only defence that holds.
Market Impact: Standoffs fall below 50 microns
4 additional market trends, 3 additional growth drivers, and 2 additional restraints and challenges are covered in the full report. Contact sales@marketmindsadvisory.com to access the complete intelligence.

Segment CAGR and Growth Architecture

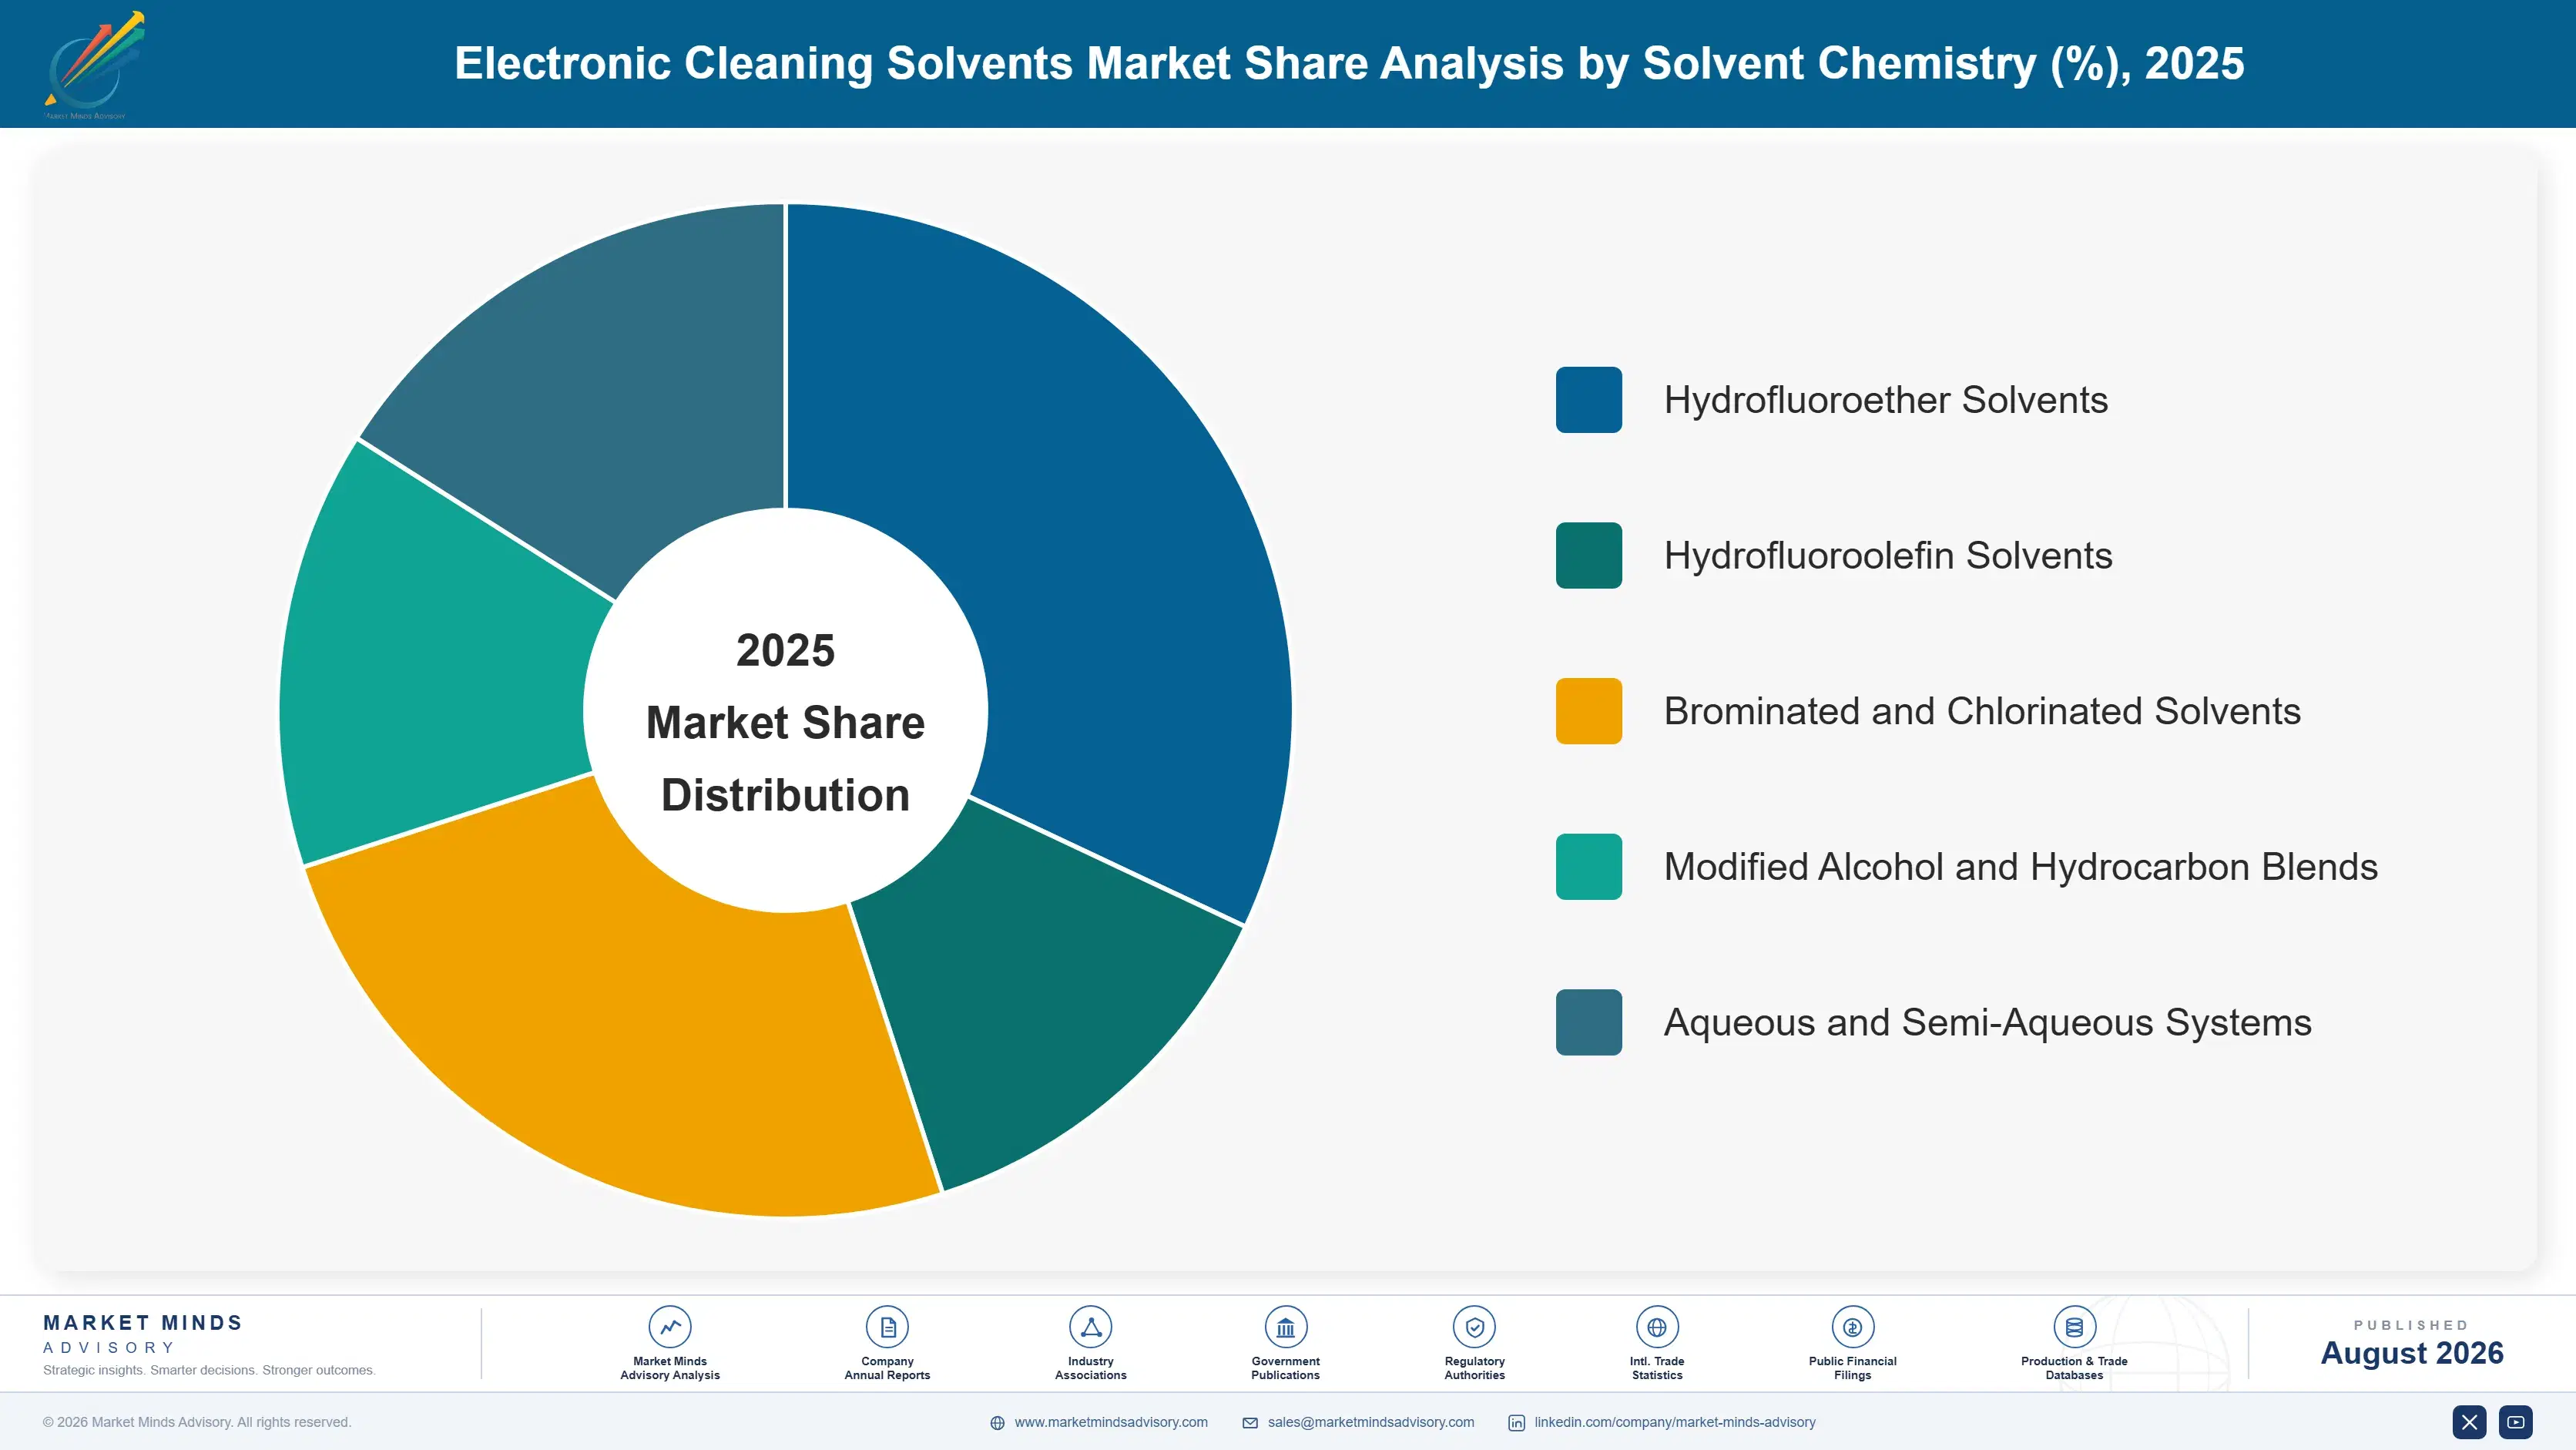
Segmentation follows solvent chemistry, because chemistry determines regulatory exposure, cleaning performance on difficult geometries, recovery behaviour in vapour equipment, and cost per litre. Five chemistry families cover commercial supply, and movement between them is driven almost entirely by regulation rather than by any performance preference expressed by the manufacturers using them. Cost per litre varies fourfold across them.
electronic-cleaning-solvents-market-market-share-analysis-1787549396923

Hydrofluoroolefin Solvents

The fastest-growing chemistry at 14.8%, roughly 2.24 times the market, and growing because of what it is not rather than what it does. Hydrofluoroolefin fluids offer low global warming potential, short atmospheric lifetime, and cleaning performance approaching the hydrofluoroether chemistries facing withdrawal, which makes them the natural drop-in candidate for lines needing rapid requalification. Cost per litre sits above the chemistries they replace and capacity remains limited relative to the demand a simultaneous transition creates. Whether broader fluorinated compound restriction eventually captures them too is the open question that every formulator and every customer is currently trying to assess. Capacity expansion is proceeding but lags a transition happening everywhere at once.
CAGR 14.8%

Aqueous and Semi-Aqueous Systems

Second fastest at 8.6%, and growing wherever assembly geometry permits water to reach the residue and leave again. Cost per unit cleaned sits far below solvent systems, regulatory exposure is minimal, and equipment capability in agitation, spray pressure, and drying keeps improving the boundary where aqueous becomes viable. The constraints are cycle time, drying energy, water treatment obligations, and the physical limit imposed by component standoff heights. Semi-aqueous systems using a solvent cleaning step followed by water rinse occupy the middle ground and suit manufacturers wanting to reduce solvent volume without abandoning it entirely. Equipment capability keeps moving the boundary where aqueous stops working, which slowly expands the addressable pool without ever removing the geometric limit entirely.
CAGR 8.6%
Full segment breakdown across 5 segments available in the complete report.

Regional Architecture and Country Demand Map

Regional shares follow electronics assembly and semiconductor manufacturing location, since solvent is consumed where boards and devices are built. Regulatory treatment of solvent chemistries then varies enough between regions to shift which products can be used in each. Assembly localisation is redistributing demand faster than in most chemical markets.

North America

Defence, aerospace, and medical electronics manufacturing concentrate here and specify cleaning to standards far above consumer assembly, which makes this a high-value market relative to its board volume. Those sectors also qualify slowly and change reluctantly, extending supplier positions once won. Semiconductor fabrication investment under federal incentive programmes is adding precision cleaning demand at facilities being built now. Environmental Protection Agency action on brominated solvents removed chemistries from the market ahead of most other regions. 3M, Chemours, and Honeywell all manufacture regionally. Growth of 7.0% blends high-specification manufacturing with new semiconductor capacity rather than any expansion in consumer electronics assembly. High-reliability sectors qualify slowly and hold longest. Semiconductor construction adds new demand steadily.
Share: 24% | CAGR: 7.0% (2026 to 2036)

Western Europe

Regulation is more demanding here than anywhere, and the proposed universal restriction on fluorinated compounds originated in this region and would capture most current premium cleaning chemistry if adopted as drafted. That uncertainty has slowed qualification decisions considerably, with manufacturers reluctant to commit fourteen months to a chemistry that may be restricted before the qualification completes. Automotive and industrial electronics manufacturing supplies most demand, with consumer assembly having largely departed decades ago. Zestron and regional formulators hold strong positions in aqueous chemistry particularly. Growth of 5.0% is the slowest in the report and reflects regulatory paralysis as much as any decline in manufacturing. Restriction uncertainty has slowed qualification decisions markedly. Aqueous chemistry holds a stronger position here.
Share: 19% | CAGR: 5.0% (2026 to 2036)
Regional intelligence for 5 additional markets available in the complete report: East Asia, South Asia and Pacific, Latin America, Middle East and Africa, Eastern Europe. Contact sales@marketmindsadvisory.com.
electronic-cleaning-solvents-market-country-cagr-analysis-1787549397437

Four Moves That Change the Economics

Advantage here comes from qualification support, transition credibility, and recovery equipment rather than from formulation, which competent chemists replicate. Four moves are worth capital and management attention across the forecast period, and the first exploits a disruption that will not recur for another decade or more. The remaining three build positions that survive whatever the next restriction brings.

Support requalification aggressively during the transition

A dominant supplier withdrawing from fluorinated production forced thousands of production lines to requalify simultaneously, and qualification takes fourteen months of ionic contamination and reliability testing that engineering teams must fit around production. Suppliers providing test protocols, on-site support, and validation data compress that timeline materially and win positions that would normally take a decade of patient selling to take from an incumbent. Technical service investment during a transition window converts at 4 to 6 times the rate of ordinary competitive selling. The window closes once lines are requalified. Nothing like it will recur for another decade.
Market Impact: Converts at 4 to 6 times ordinary rates

Sell recovery equipment alongside premium chemistry

Vapour degreasing systems recover 64% of fluid on average and considerably more when properly maintained, which is what makes a forty-two dollar per litre solvent competitive against a cheaper fluid used once and discarded. Suppliers providing equipment, maintenance, and recovery optimisation make that argument concrete rather than theoretical and lock the account through installed hardware. Chemistry margin on recovery-equipped accounts runs 10 to 18 percentage points above open cleaning supply. The investment is equipment partnership and field service capability rather than any chemical manufacturing. Installed hardware locks the chemistry account firmly.
Market Impact: Adds 10 to 18 points of chemistry margin

Target newly commissioned assembly facilities first

New electronics plants across India, Vietnam, Thailand, and Mexico qualify cleaning chemistry from scratch rather than inheriting an incumbent, which makes them the only demand in this market genuinely contestable without displacing anybody. Assembly takes 58% of volume and follows production location directly, and a position won at commissioning holds for the facility's operating life. Technical service reach into those locations decides the outcome rather than price. Suppliers organised around established customers consistently miss these facilities until a competitor has already qualified. A position won at commissioning holds for the plant's life.
Market Impact: Assembly holds 58% of the total market volume

Sell a transition roadmap rather than a permanent answer

Electronics manufacturers have been forced through three chemistry withdrawals in thirty years and have stopped believing any supplier's permanence claim, which makes the claim actively counterproductive. Offering a chemistry family with defined substitution pathways, and committing to fund requalification if restriction arrives, addresses the fear that actually governs the decision. Suppliers positioning this way report qualification decisions moving 3 to 5 months faster than competitors promising permanence. It costs a contractual commitment rather than any product development effort. The commitment costs nothing unless restriction actually arrives. Customers value it more than performance claims.
Market Impact: Accelerates qualification decisions by 3 to 5 months

Who Controls the Margin Pool

Concentration is high at roughly 51% for the top five, and fluorochemical manufacturing capability rather than formulation skill explains most of it. 3M held the leading hydrofluoroether position until announcing withdrawal from fluorinated production, which is the largest competitive disruption this market has seen. Chemours, Honeywell, and AGC hold fluorochemical capability and are absorbing displaced demand, while Zestron competes from a strong aqueous and technical service position.
Competitive activity runs on three fronts. Qualification support is the first and matters most during the current transition, since compressing a fourteen-month process is worth more to a customer than any price concession. Regulatory positioning is the second, and customers now evaluate what happens if a chemistry is restricted. Recovery equipment capability is the third, and it converts premium pricing from a problem into an argument.

Pressure is building from two directions. Aqueous chemistry specialists take work wherever assembly geometry permits water to reach the residue. And the unresolved fluorinated compound restriction leaves every fluorinated supplier exposed to a decision none of them controls. Neither pressure can be answered by formulation work alone, which is what makes this an unusually uncomfortable period for suppliers whose capability sits entirely in chemistry.
electronic-cleaning-solvents-market-company-positioning-matrix-1787549397960

Competitive Moat and Risk Dimensions

CHEMOURS

Moat: Fluorochemical manufacturing and capacity

Integrated fluorochemical production capability lets Chemours supply hydrofluoroolefin chemistries at volumes that formulators buying intermediates cannot match, and the withdrawal of a major competitor has made that capacity considerably more valuable than it appeared two years ago. Customers requalifying urgently prioritise suppliers who can guarantee availability across a multi-year commitment.
CHEMOURS

Risk: Broad fluorinated restriction exposure

A proposed universal restriction on fluorinated compounds would capture replacement chemistries alongside the ones being withdrawn, which puts the entire portfolio under a regulatory decision the company cannot influence directly. Customers understand that exposure and increasingly ask what happens next, which weakens the argument for qualifying yet another fluorinated fluid.
ZESTRON

Moat: Aqueous chemistry and technical depth

Deep aqueous and semi-aqueous formulation capability combined with applications laboratories and cleanliness testing services positions Zestron as the natural partner for manufacturers wanting to escape solvent regulatory exposure entirely. That technical service depth also wins qualifications where a chemistry comparison alone would not decide the outcome.
ZESTRON

Risk: Geometry limits on aqueous cleaning

Component standoff heights continue falling below the point where water can flow beneath a package and out again reliably, which caps aqueous applicability regardless of equipment improvement or formulation skill. Advanced packaging trends push more assemblies past that boundary each year, handing exactly the highest-value work to solvent suppliers instead.

Players Tracked

Prominent Players

3M
Chemours
Honeywell
AGC Chemicals
Zestron

Other Key Players

Kyzen
MicroCare
Techspray
Inventec Performance Chemicals
Vigon International
Chemtronics
Solvay
Arkema
Daikin Industries
Shin-Etsu Chemical
Enviro Tech International
Poly Systems USA
Kaneko Chemical
JNC Corporation
Petroferm

Recent Developments

FEBRUARY 2025

Fluorochemical withdrawal timetable forces mass requalification

The published exit timetable from fluorinated chemical production by a dominant supplier reached the point where electronics manufacturers had to complete replacement qualification or face supply interruption. Engineering teams across thousands of assembly lines scheduled ionic contamination and reliability testing simultaneously rather than gradually as would normally happen.
Signal: A simultaneous transition creates competitive openings that ordinarily take a decade of patient selling to create
JUNE 2025

Supplier offers requalification cost guarantee

A cleaning chemistry supplier committed contractually to fund customer requalification if its product family faced regulatory restriction during a defined period. The offer addressed the transition fatigue that had made engineering teams reluctant to commit to any new chemistry after three forced withdrawals in thirty years.
Signal: Guaranteeing against the next transition is becoming a far more persuasive argument than claiming any permanence
SEPTEMBER 2025

Advanced packaging cleanliness requirements tighten further

Package standoff heights on new advanced packaging designs fell below levels where aqueous cleaning can reliably remove flux residue, pushing assemblies toward solvent processes. Manufacturers who had been migrating away from solvent for cost and regulatory reasons found the geometry made that migration impossible. Cost arguments became irrelevant.
Signal: Miniaturisation is now quietly reversing the expected migration to aqueous, which very few forecasts anticipated properly

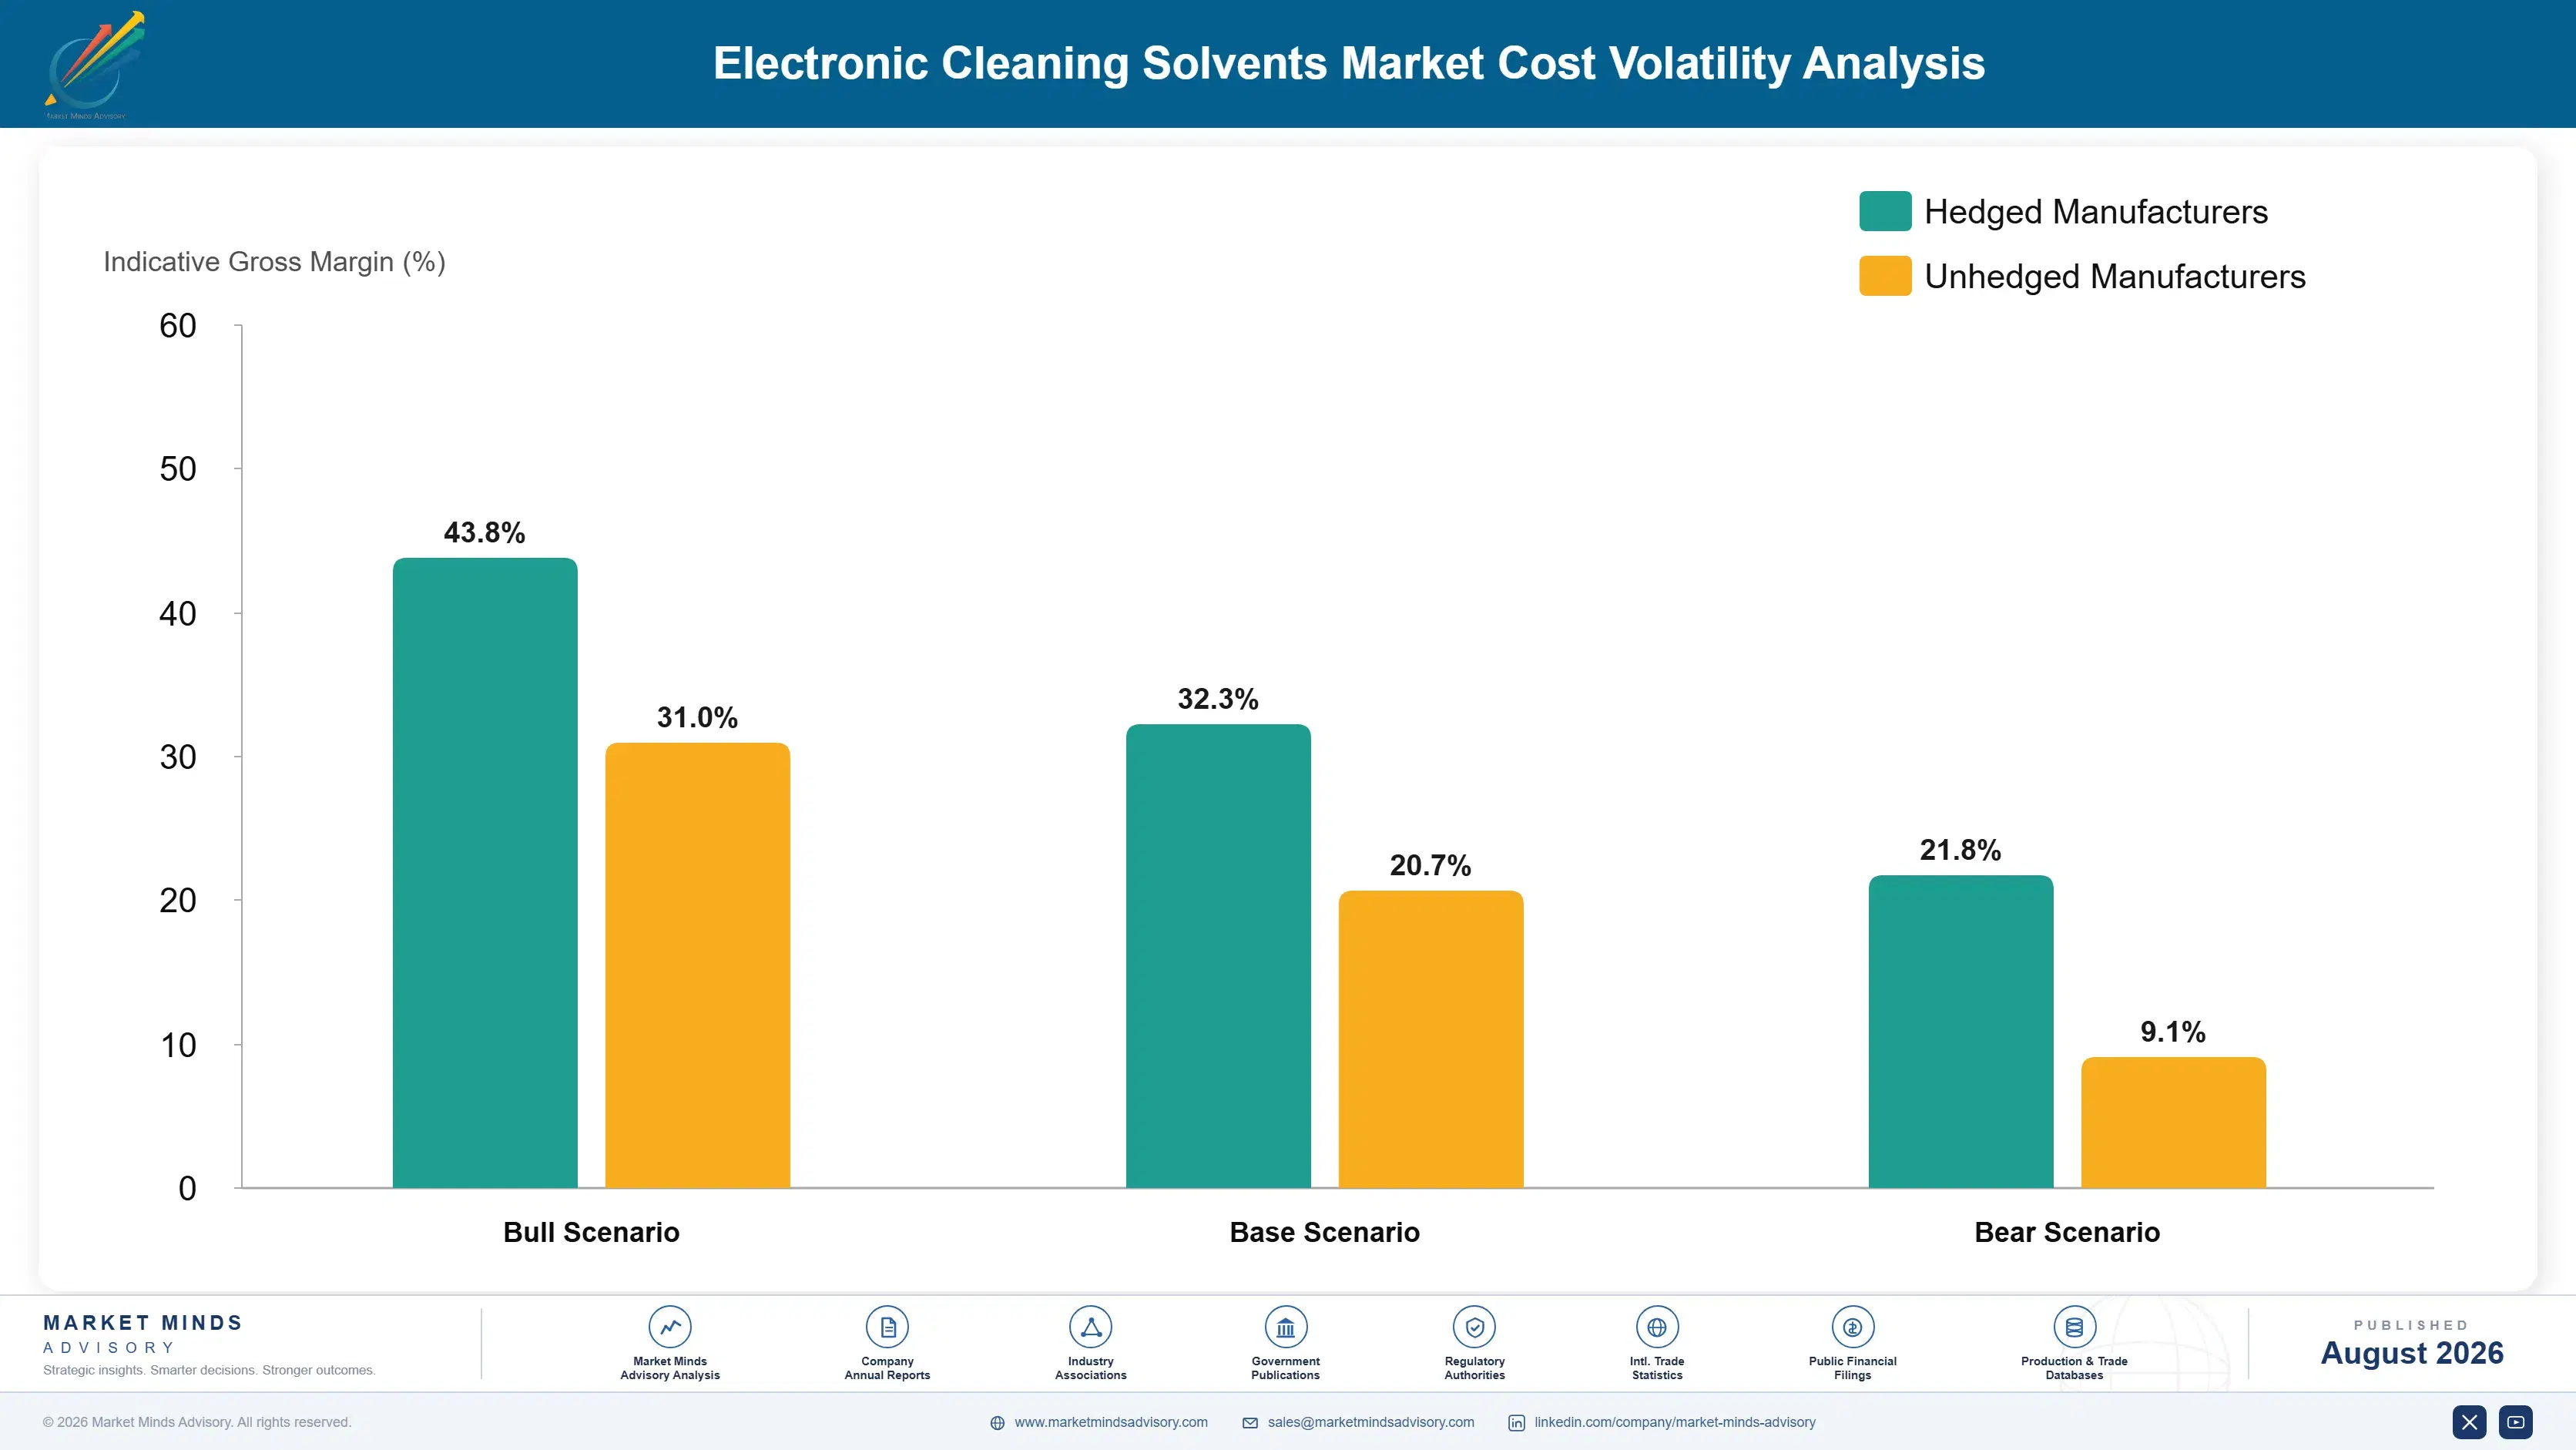
What Sets the Cost Base

Fluorinated feedstock dominates at roughly 47% of formulation cost for premium chemistries, sourced from a narrow producer base with limited alternatives available anywhere. Co-solvents, stabilisers, and surfactants contribute 16%, small in cost terms and disproportionately important to cleaning performance. Packaging under controlled conditions and hazardous goods transport take 11%. Regulatory registration, testing, and technical service absorb the balance across typical supply operations.
Fluorochemical intermediates tightened considerably through 2024 and 2025 as a major producer wound down capacity while replacement demand rose simultaneously, which is an unusually difficult combination. Chemours and Honeywell both referenced fluorochemical demand and capacity conditions across their reporting for those years. Aqueous chemistry inputs moved with general surfactant and chelant markets instead and behaved far more predictably. Hazardous goods freight costs also rose, affecting solvent chemistries disproportionately relative to aqueous alternatives.

Exposure divides on fluorochemical integration rather than on scale. Suppliers producing their own fluorinated intermediates carry feedstock exposure while formulators buying them carry supplier margin and allocation risk together. Aqueous-weighted portfolios avoid that entirely and face a quite different structure dominated by surfactant chemistry and water treatment obligations at the customer rather than at the supplier.
electronic-cleaning-solvents-market-cost-volatility-analysis-1787549398155

Contract fluorochemical intermediates on multi-year terms

The producer base for fluorinated intermediates is narrow and became narrower with a major withdrawal, which makes allocation rather than price the real exposure during a transition. Multi-year supply agreements with volume commitment secure availability when formulators buying spot cannot obtain material at all. Committed volume through soft periods is trivial against failing a customer mid-qualification.

Develop aqueous capability alongside solvent portfolios

Assembly geometry determines whether aqueous cleaning works, and a supplier holding only one chemistry family loses whichever accounts fall on the wrong side of that line. Developing both lets a supplier recommend honestly and keep the customer either way. Applications laboratory capability rather than manufacturing investment is what this requires, and it also builds the technical credibility that wins qualifications.

Optimise formulations for higher recovery in vapour systems

Recovery already reaches 64% of fluid and better-designed formulations with tighter boiling ranges and lower drag-out recover more. Every point of recovery improvement reduces the customer's effective cost per cleaned assembly without any price concession from the supplier. It requires formulation work and equipment understanding together, and it makes the premium chemistry argument considerably easier to win.

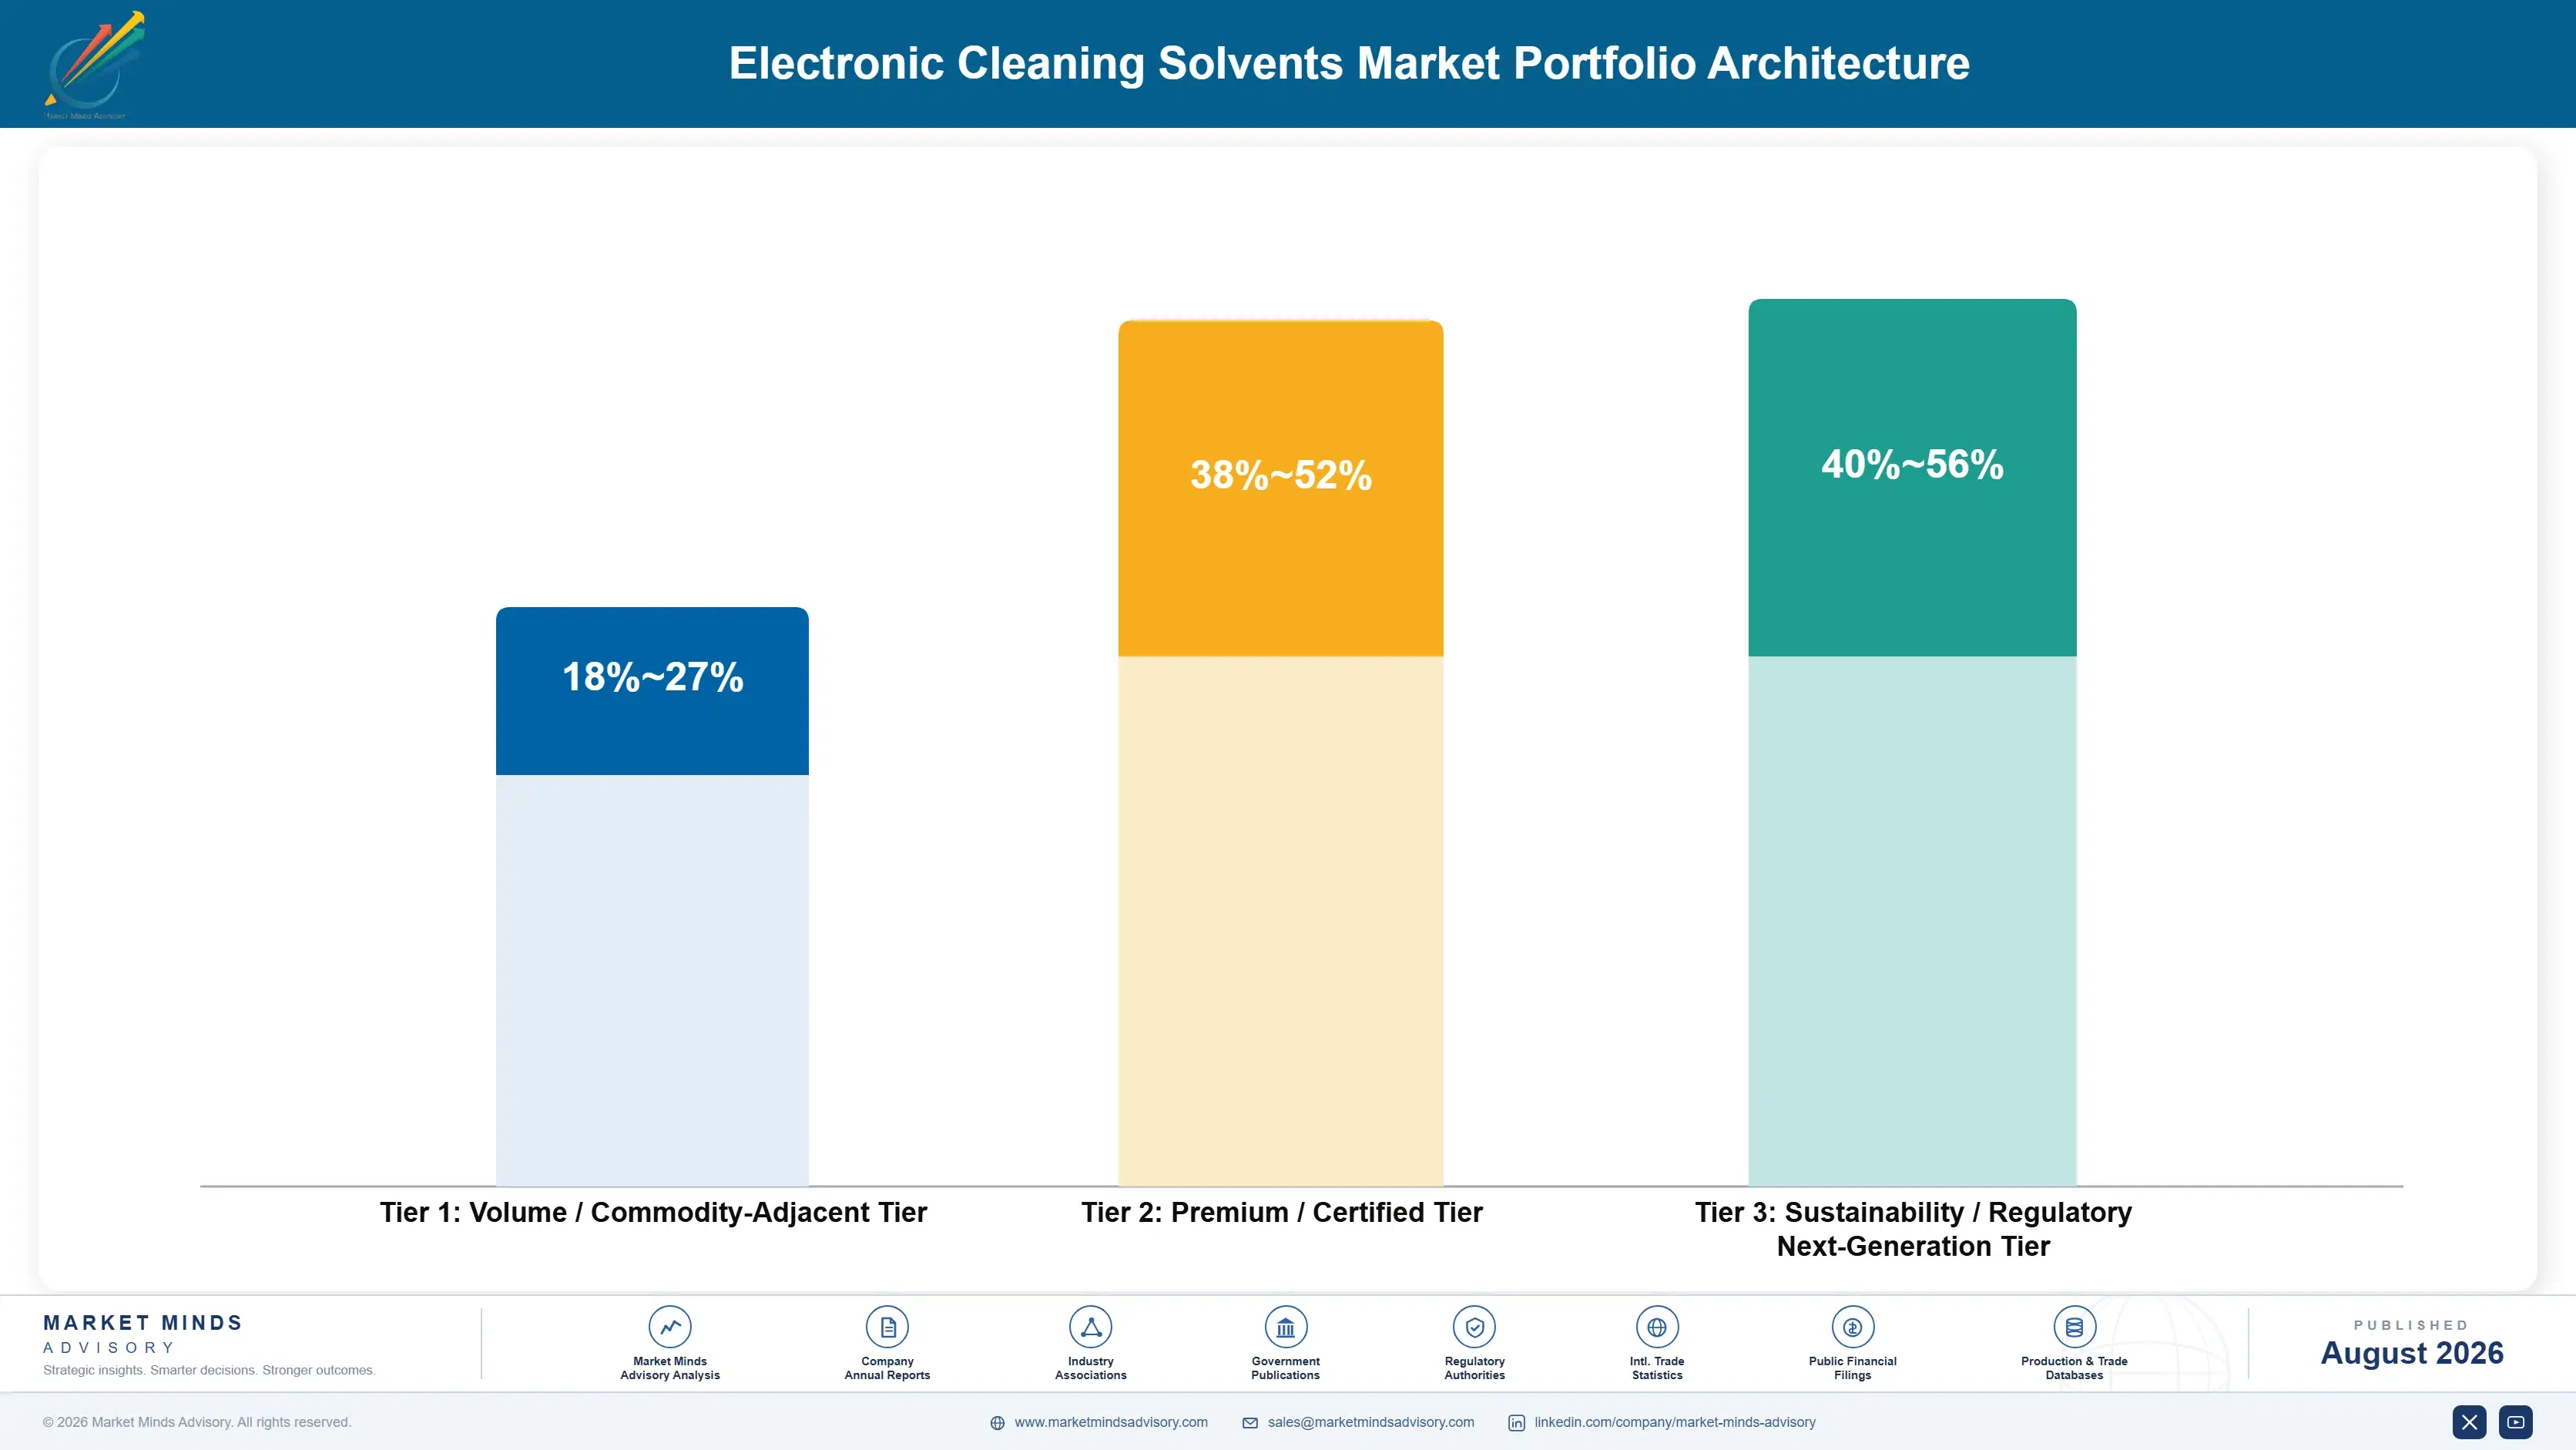
Portfolio Architecture for Margin Defence

Margin follows qualification position and application difficulty rather than volume. Maintenance and general cleaning products sold through distribution earn modest returns, because specifications are undemanding and buyers compare price directly across catalogue alternatives. Qualified production line chemistry earns several times that, since displacing it requires fourteen months of testing that no customer undertakes to save money on a consumable. That gap widened further during the current transition.
The volume and premium tension sits in technical service capacity rather than in plant loading. Applications engineers and laboratory capability are the scarce resource, and supporting a low-value maintenance account consumes the same specialist who could be qualifying a production line. Suppliers who allocate that resource by account value rather than by request order consistently outperform those who answer whoever calls first.

High-value pools concentrate in three places: qualified production line chemistry at high-reliability manufacturers, difficult geometry applications where aqueous cannot work, and recovery-equipped accounts where premium pricing is justified by consumption. Each is defended by qualification, physics, or installed equipment rather than by price. Price competition arrives in each only when a customer is forced to reopen a qualification, which happens on regulatory rather than commercial timetables.

Volume / Commodity-Adjacent Tier

Maintenance cleaners, contact cleaners, and general purpose products sold through electronics distribution. Competes on catalogue price against many alternatives. The range reflects large differences in packaging cost and channel structure.
Gross Margin: 18%-27%

Premium / Certified Tier

Qualified production line chemistry supported by validation data, cleanliness testing, and applications engineering. Displacing it means fourteen months of requalification, which customers avoid unless forced by supply or regulation. Reliability sectors hold longest of all.
Gross Margin: 38%-52%

Sustainability / Regulatory / Next-Generation Tier

Low global warming potential hydrofluoroolefin fluids, aqueous conversions, and recovery-optimised formulations addressing regulatory exposure directly. Restriction pressure drives adoption. The range is wide because transition pricing has not settled anywhere.
Gross Margin: 40%-56%
electronic-cleaning-solvents-market-portfolio-architecture-1787549398656

High-value Sub-segments and Strategic Watch-out

Qualified Production Line Chemistry

Fourteen months of ionic contamination and reliability testing protects every position won, and customers displace incumbents only when supply or regulation forces the issue. High-reliability manufacturers qualify slowest and stay longest. Defend these positions above everything else. Requalification only happens when something forces it. Defend hard.
Gross Margin: 40%-54%

Difficult Geometry Applications

Standoff heights below the point where water can flow beneath a package hand the work to low surface tension solvents permanently. Advanced packaging pushes more assemblies past that boundary annually. Physics rather than commercial argument defends this pool. Advanced packaging keeps widening this pool steadily.
Gross Margin: 42%-56%

Recovery Equipped Account Supply

Vapour systems recovering 64% of fluid make premium chemistry competitive against cheaper fluids used once and discarded. Installed equipment locks the account and improves margin. Sell the equipment and maintenance alongside the chemistry itself. Equipment partnership is the practical route in. Sell the system together.
Gross Margin: 38%-52%

Distributed Maintenance Products

The strategic watch-out. Catalogue competition on undemanding specifications, with technical service consumed by accounts that will never justify it. It holds channel presence and brand visibility, and should be resourced for exactly that. Do not staff it with applications engineers. Resource it minimally instead. Nothing more.
Gross Margin: 18%-26%

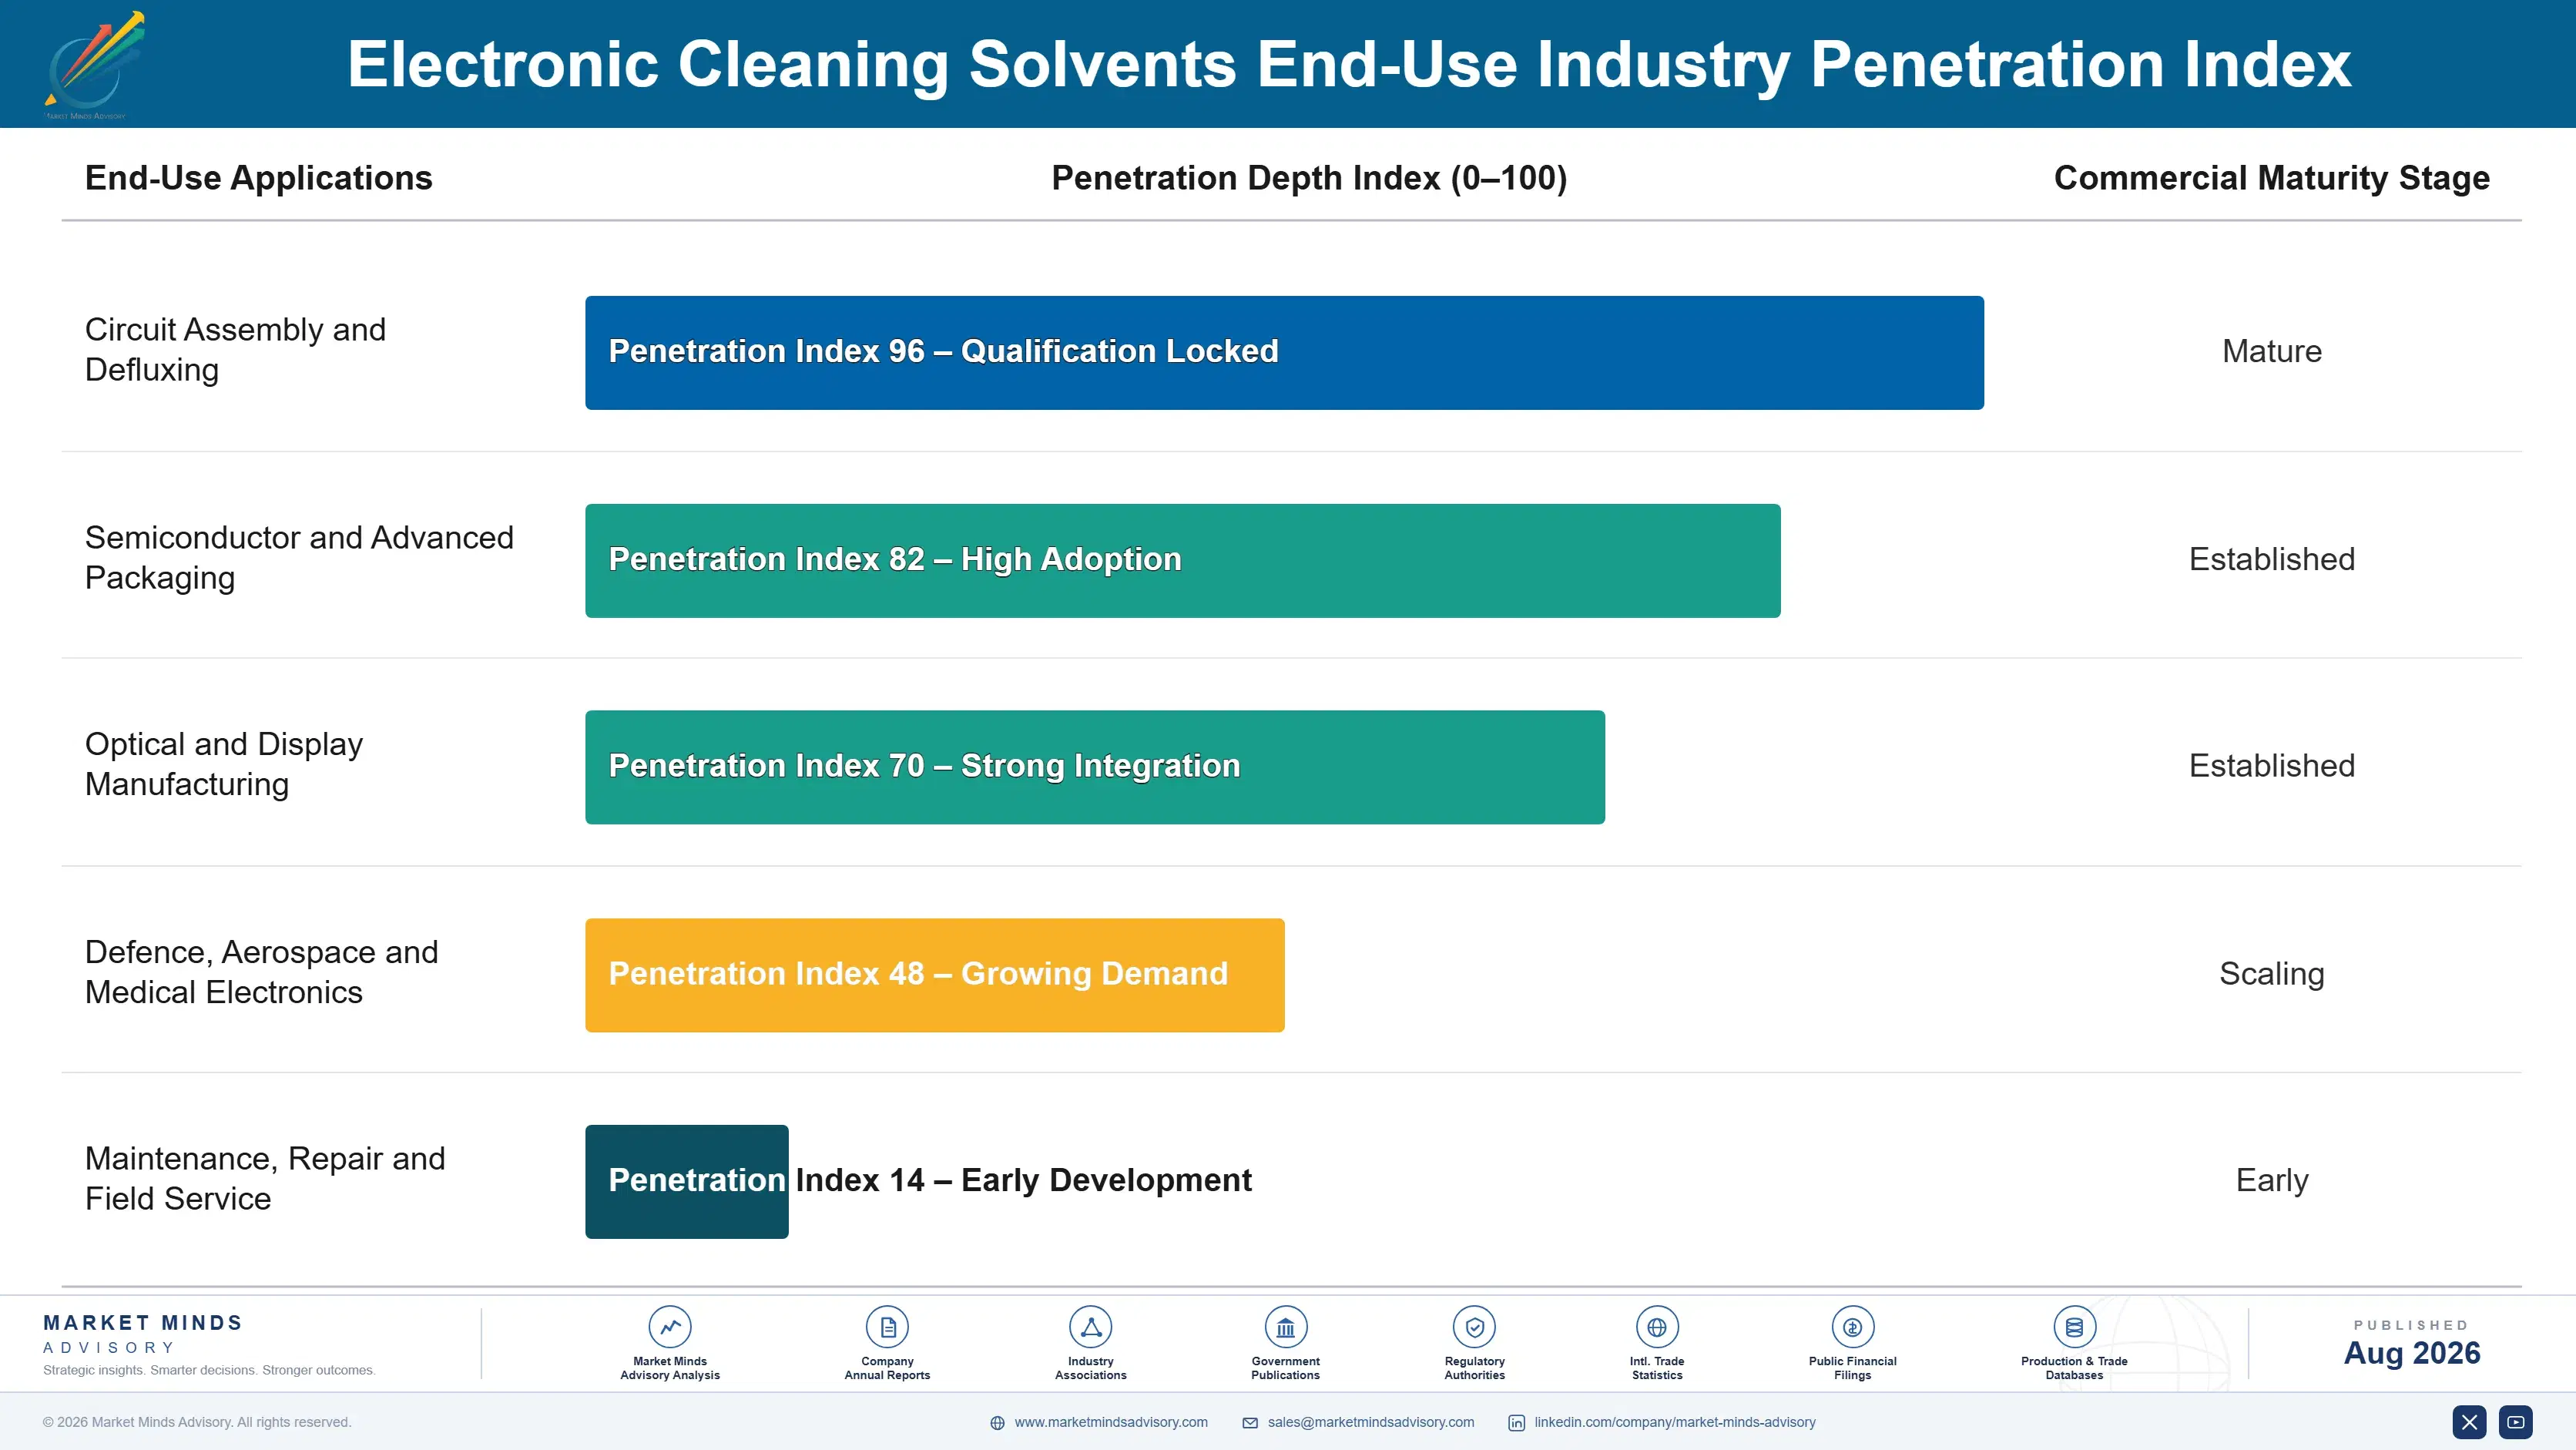
How Demand Actually Reaches Suppliers

The annuity here is qualification rather than consumption. Once a cleaner is written into a production process, validated against ionic contamination and reliability standards, and referenced in manufacturing documentation, it stays there until something forces a change, which is typically supply withdrawal or regulation rather than any commercial decision. That makes positions extremely durable and extremely difficult to win, and it explains why a simultaneous forced transition is worth so much to whoever is prepared for it.
Adoption depth varies sharply by manufacturer type. Defence, aerospace, and medical electronics qualify most slowly and hold longest, since their reliability requirements make any change genuinely risky. High-volume consumer assembly qualifies faster and weighs cost more heavily. Contract manufacturers qualify to their customers' specifications rather than their own. Maintenance and repair operations buy from catalogues with no qualification at all.

The buyer has shifted toward process engineering and reliability functions rather than purchasing. Those engineers evaluate cleanliness test data and regulatory roadmaps, never a price list. A supplier arriving with a competitive quotation and no cleanliness validation data will not be evaluated at all, and that filter operates before purchasing is ever involved in the conversation.
electronic-cleaning-solvents-market-end-use-penetration-index-1787549399145

Where the Money Sits

These are among the four positions where our research anticipates prominent divergence between winners and laggards over the coming forecast period. Each is grounded in the demand model, the regulatory perimeter, and the announced capacity pipeline.
01 / TRANSITION WINDOW EXPLOITATION

Support requalification now, because the window closes soon

A dominant supplier withdrawing from fluorinated production forced thousands of lines to requalify at once, and qualification takes fourteen months of testing that engineering teams must fit around live production schedules. Suppliers providing test protocols, on-site support, and validation data compress that timeline and win positions that ordinarily take a decade of patient selling to take from an incumbent. Technical service investment during this window converts at 4 to 6 times normal competitive rates, and it stops converting entirely once lines are requalified.
02 / RECOVERY ECONOMICS SELLING

Sell the degreaser, because it justifies the chemistry price

Vapour systems recover 64% of fluid on average and considerably more when properly maintained, which is the entire reason a forty-two dollar per litre solvent competes against a cheaper fluid used once and thrown away. Suppliers providing equipment, maintenance, and recovery optimisation make that argument concrete rather than theoretical while locking the account through installed hardware. Chemistry margin on recovery-equipped accounts runs 10 to 18 percentage points above open cleaning supply, and the required investment is equipment partnership rather than any chemical manufacturing at all.
03 / GREENFIELD FACILITY TARGETING

Qualify at commissioning, because nobody has to be displaced

New assembly plants across India, Vietnam, Thailand, and Mexico qualify cleaning chemistry from scratch rather than inheriting an incumbent position, which makes them the only genuinely contestable demand in a market defined by qualification lock-in. Assembly takes 58% of volume and follows production location directly, and a position won at commissioning holds for the facility's whole operating life. Technical service reach into those locations decides outcomes, and suppliers organised around established accounts consistently arrive long after somebody else has already qualified.
04 / TRANSITION ROADMAP POSITIONING

Promise a path forward, because permanence claims are disbelieved

Electronics manufacturers have been forced through chlorinated, brominated, and now fluorinated chemistry withdrawals within thirty years, and engineering teams discount any supplier claim of permanence completely as a result. Offering a chemistry family with defined substitution pathways, and contractually committing to fund requalification if restriction arrives, addresses the fear that actually governs the decision. Suppliers positioning this way report qualification decisions moving 3 to 5 months faster, at the cost of a contractual commitment rather than any product development work whatsoever.

Engagement Snapshot From the Field

A live engagement with an industry participant carrying material or product regulatory and market exposure ahead of a defining policy shift, showing how our research translates into a defensible multi-year portfolio strategy.
MARKET MINDS ADVISORY · CLIENT ENGAGEMENT SUMMARY
Electronic Cleaning Solvents Producer Strategic Portfolio Review and Transition Roadmap 2026·Investment Scenario on Electronic Cleaning Solvents Exposure Evaluation 2025-26
CLIENT PROFILE
A European formulator of precision cleaning chemistry supplying electronics assembly and maintenance customers across the region, with revenue near EUR 54 million (client-reported, unverified by MMA). The portfolio was weighted toward hydrofluoroether-based products bought as intermediates, applications laboratory capacity was limited, and no recovery equipment offer existed. Intermediate supply was single sourced. Customer requalification had already begun.
STRATEGIC CHALLENGE
The withdrawal of a dominant fluorochemical supplier had put the client's intermediate supply at risk while simultaneously forcing its customers to requalify, and competitors with their own fluorochemical capacity were approaching those accounts with support the client could not offer. New assembly plants in Poland and Romania were qualifying chemistry the client had not been invited to propose.
MMA APPROACH
MMA assessed intermediate supply security against alternative sources, sized the requalification opportunity across the client's served accounts and adjacent competitors, and modelled applications laboratory investment against qualification win rates. Forty-seven expert interviews with process engineers, reliability specialists, and plant managers established how qualification decisions are actually made. Support capacity proved decisive.
KEY FINDINGS
  1. Every qualification the client had won in five years had turned on applications support during testing rather than on product performance or price, and laboratory capacity was the binding constraint on winning more.
  2. Competitors holding fluorochemical capacity were offering supply guarantees the client could not match, and three accounts had already begun qualifying alternatives on that basis alone.
  3. Newly commissioned assembly plants in the region qualified chemistry within months of opening, and the client learned of six such facilities only after competitors had already been qualified.
  4. Customers rated a contractual requalification guarantee against future restriction more persuasive than any performance claim, and no supplier in the region was offering one at all.
CLIENT PROFILE
A European formulator of precision cleaning chemistry supplying electronics assembly and maintenance customers across the region, with revenue near EUR 54 million (client-reported, unverified by MMA). The portfolio was weighted toward hydrofluoroether-based products bought as intermediates, applications laboratory capacity was limited, and no recovery equipment offer existed. Intermediate supply was single sourced. Customer requalification had already begun.
STRATEGIC CHALLENGE
The withdrawal of a dominant fluorochemical supplier had put the client's intermediate supply at risk while simultaneously forcing its customers to requalify, and competitors with their own fluorochemical capacity were approaching those accounts with support the client could not offer. New assembly plants in Poland and Romania were qualifying chemistry the client had not been invited to propose.
MMA APPROACH
MMA assessed intermediate supply security against alternative sources, sized the requalification opportunity across the client's served accounts and adjacent competitors, and modelled applications laboratory investment against qualification win rates. Forty-seven expert interviews with process engineers, reliability specialists, and plant managers established how qualification decisions are actually made. Support capacity proved decisive.
KEY FINDINGS
  1. Every qualification the client had won in five years had turned on applications support during testing rather than on product performance or price, and laboratory capacity was the binding constraint on winning more.
  2. Competitors holding fluorochemical capacity were offering supply guarantees the client could not match, and three accounts had already begun qualifying alternatives on that basis alone.
  3. Newly commissioned assembly plants in the region qualified chemistry within months of opening, and the client learned of six such facilities only after competitors had already been qualified.
  4. Customers rated a contractual requalification guarantee against future restriction more persuasive than any performance claim, and no supplier in the region was offering one at all.
RECOMMENDED STRATEGY
Phase 1: Phase one: expand applications laboratory capacity immediately, since qualification support rather than product performance decides every contest the business enters. Phase 2: Phase two: secure multi-year intermediate supply and offer customers matching availability guarantees, neutralising the advantage integrated competitors currently hold. Match their guarantees directly. Phase 3: Phase three: build a greenfield facility tracking process to reach new assembly plants at commissioning rather than discovering them after qualification has closed.
OUTCOME
The client doubled applications laboratory capacity within eight months and secured a three-year intermediate agreement. Qualification win rate rose from 22% to 47% across two years, four greenfield facilities were won at commissioning, and blended gross margin improved 6.3 percentage points (client-reported, unverified by MMA).

Frequently Asked Questions

Foundational context covering the market sizes, CAGR, scope, country, region and competition that inform every finding below. This section is provided to cover basics and most often pre-purchase conversations, answered from the MMA Primary Research Dataset.

What is the current size of the Electronic Cleaning Solvents Market?

The market was valued at USD 2.0 billion in 2025, rising to an estimated USD 2.13 billion in 2026. East Asia holds the largest regional share at 30% of global value.

How large will the Electronic Cleaning Solvents Market be by 2036?

MMA forecasts USD 4.04 billion by 2036 under the base case, an expansion multiple of 1.89 times the 2026 value. That represents USD 1.91 billion of incremental value across the forecast period.

What is the CAGR for the Electronic Cleaning Solvents Market 2026 to 2036?

The base case CAGR is 6.6%, with a bull case of 7.8% and a bear case of 5.3%. The spread reflects uncertainty over fluorinated compound restriction and aqueous substitution.

Which segment is growing fastest?

Hydrofluoroolefin solvents grow fastest at 14.8%, roughly 2.24 times the market rate, as formulators move away from restricted chemistries. Aqueous and semi-aqueous systems follow at 8.6%.

Who are the major companies in the Electronic Cleaning Solvents Market?

3M, Chemours, Honeywell, AGC Chemicals, and Zestron lead on precision cleaning solvent supply. The top five hold roughly 51%, with fluorochemical manufacturing capability explaining most of it.

Which country is growing fastest?

India grows fastest at 9.8%, driven by electronics manufacturing incentive schemes pulling assembly into the country. Each new facility qualifies chemistry from scratch rather than inheriting an incumbent.

Report Segmentation Architecture

The full report scope spans multiple orthogonal segmentation dimensions, with cross-tabulated demand data provided for each dimension pair. Coverage extends further to regional breakdowns, trend trajectories, and the competitive detail needed to support segment-level decision-making.

By Solvent Chemistry

  • Hydrofluoroether Solvents
  • Hydrofluoroolefin Solvents
  • Brominated and Chlorinated Solvents
  • Modified Alcohol and Hydrocarbon Blends
  • Aqueous and Semi-Aqueous Systems

By End-Use Industry

  • Circuit Assembly and Defluxing
  • Semiconductor and Advanced Packaging
  • Optical and Display Manufacturing
  • Defence, Aerospace and Medical Electronics
  • Maintenance, Repair and Field Service

By Sales Model

  • Qualified Production Line Supply
  • Chemistry and Recovery Equipment Bundles
  • Electronics Distributor Channel
  • Contract Manufacturer Specification Supply
  • Technical Service Led Qualification Programmes

By Region

  • North America
  • Western Europe
  • East Asia
  • South Asia and Pacific
  • Latin America
  • Middle East and Africa
  • Eastern Europe

Scope, Methodology, and Coverage

Every figure in this report is reproducible from documented input assumptions. The scope below maps the historical period, the forecast horizon, the segmentation dimensions, and the countries covered, alongside the underlying primary and qualitative methodology.
Historical Period
2020 to 2025
Forecast Period
2026 to 2036
Base Year
2025 (USD billions; MMA Primary Research Dataset, August 2026)
Market Definition
The market comprises precision cleaning solvents and fluids used in electronics manufacturing and maintenance, covering hydrofluoroether solvents, hydrofluoroolefin solvents, brominated and chlorinated solvents, modified alcohol and hydrocarbon blends, and aqueous and semi-aqueous cleaning systems. Value is measured at supplier level across circuit assembly and defluxing, semiconductor and advanced packaging, optical manufacturing, high-reliability electronics, and field maintenance applications. Industrial metal degreasing outside electronics, photoresist strippers and developers, planarisation slurries, cleaning equipment sold separately, and consumer electronics care products fall outside scope.
Quantitative Units
USD billions (current prices); million litres of cleaning fluid supplied annually; USD per litre by chemistry and grade
Segmentation Dimensions
By Solvent Chemistry; By End-Use Industry; By Sales Model; By Region
Regions Covered
North America, Western Europe, East Asia, South Asia and Pacific, Latin America, Middle East and Africa, Eastern Europe
Countries Covered
United States, Canada, Mexico, Germany, France, United Kingdom, Italy, Netherlands, Ireland, Poland, Czechia, Hungary, Slovakia, Romania, China, Japan, South Korea, Taiwan, India, Vietnam, Thailand, Malaysia, Singapore, Australia, Brazil, Israel, Turkey, Saudi Arabia, Morocco, South Africa
Key Companies Profiled
3M, Chemours, Honeywell, AGC Chemicals, Zestron, Kyzen, MicroCare, Techspray, Inventec Performance Chemicals, Vigon International, Chemtronics, Solvay, Arkema, Daikin Industries, Shin-Etsu Chemical, Enviro Tech International, Poly Systems USA, Kaneko Chemical, JNC Corporation, Petroferm
Quantitative Methodology
Primary survey, n=3,800 respondents, Q4 2025, six countries; demand-side model with trade association cross-validation
Qualitative Methodology
47 expert interviews, Q4 2025; applied to validate demand model assumptions, identify emerging dynamics, and assess competitive positioning
Report Format
PDF and XLSX data workbook (Word format preview document)
Publisher
Market Minds Advisory
Report Code
MMA-2026-CHM-226
Published
August 2026
Contact
sales@marketmindsadvisory.com | www.marketmindsadvisory.com

Purchase the full Electronic Cleaning Solvents Market Report (2026 to 2036).

The full report sizes precision electronics cleaning demand across five chemistry families, five end-use categories, and seven regions with 2026 to 2036 forecasts under base, bull, and bear cases. It models qualification cycles and the requalification wave created by fluorochemical withdrawal, which is the defining commercial event in this market. Competitive profiles cover twenty suppliers assessed consistently on precision cleaning revenue, fluorochemical capability, and applications service depth. Cost analysis traces fluorinated feedstock exposure against aqueous alternatives by portfolio mix. Commercial guidance addresses transition window exploitation, recovery economics, greenfield targeting, and roadmap positioning.
Five chemistry families sized separately by region
Requalification wave modelled across affected production lines
Component standoff geometry mapped against aqueous viability
Solvent recovery rates quantified in premium chemistry economics
Fluorinated restriction scenarios assessed across the portfolio
Twenty suppliers compared on applications service capability

Built For The People Who Decide

From boardroom strategy to bench-side execution, this report is read cover-to-cover by leaders shaping the next decade of their industry, turning demand scenarios, market dynamics and valuation benchmarks into decisions.
CXOs/ Presidents/ VPs/ Managers
M&A and Corporate Development
Strategy Teams and R&D Heads
Procurement and Product Directors
Regulatory and Compliance Leaders
Investor Relations and Equity Analysts