Market Minds Advisory
Industrial Automation Market

Industrial Automation Market: Variability Rather Than Labour, And A Chinese Market Nobody Foreign Is Winning

Automation is sold as labour substitution and bought as variability elimination. The operator being replaced was also fixing the part that arrived slightly wrong, and nobody ever wrote that down.

Lead Analyst

David Horsley

Published

September 2026

Make Smarter Decisions with Customized Research Insights

Request a free sample report and evaluate market opportunities, growth trends, and competitive dynamics relevant to your business needs.

2025 MARKET VALUE$196.4BMarket Size 2025
2036 FORECAST VALUE$467.3BBase Case , 2026 to 2036
CAGR 2026 TO 20368.2 %Bull 9.5% / Bear 6.9%
INCREMENTAL OPPORTUNITY$254.8BNet 10- year value creation
EXPANSION MULTIPLE2.20x2036 value over 2026 base
Strategic Levers
M&A Pipeline
Regional Outlook
Country Rankings
Competitive Intelligence
Segmental Deep-dive
Call-Us : 91 93563 13602

Executive Snapshot and Market Trajectory

A robot costing two years of wages looks like an easy calculation and remains a hard sale, because the operator it replaces was also absorbing variability nobody documented. Automating reveals every tolerance problem the humans quietly fixed. The market reaches USD 196.4 billion in 2025 and grows at 8.2%.
Machine vision and inspection systems grow fastest at 13.6%, about 1.66 times the market rate, precisely because vision is the layer letting automation cope with variation people used to handle by looking. East Asia holds 42% of value, far above the band this framework applies, because China installs more industrial robots than the rest of the world combined. North America takes 19% and Western Europe 18%. The calculation was never the obstacle here.
Concentration sits at 33%, low for a technology market and still falling, because Chinese domestic manufacturers now hold the majority of their own market and it is the largest one anywhere. The international majors have grown revenue and lost position simultaneously for a decade. Competition turns on integrator availability as much as on product, since projects wait on engineers rather than on equipment.
Market Definition
The industrial automation market covers equipment and software controlling discrete and hybrid manufacturing operations, including industrial robots, machine vision, motion control, programmable controllers, industrial computing, networking, and machine safety systems. Continuous and batch process control architectures including distributed control systems, safety instrumented systems, and advanced process control software are excluded, as are field instrumentation, machine tools, and enterprise planning software.
Base Year Value
$196.4B in 2025 (MMA Primary Research Dataset, August 2026)
Forecast Period
2026 to 2036, eleven discrete annual values
CAGR
8.2% base case. Bull 9.5%. Bear 6.9%.
Fastest Growth Segment
Machine Vision and Inspection Systems: 13.6% CAGR
Fastest Growth Country
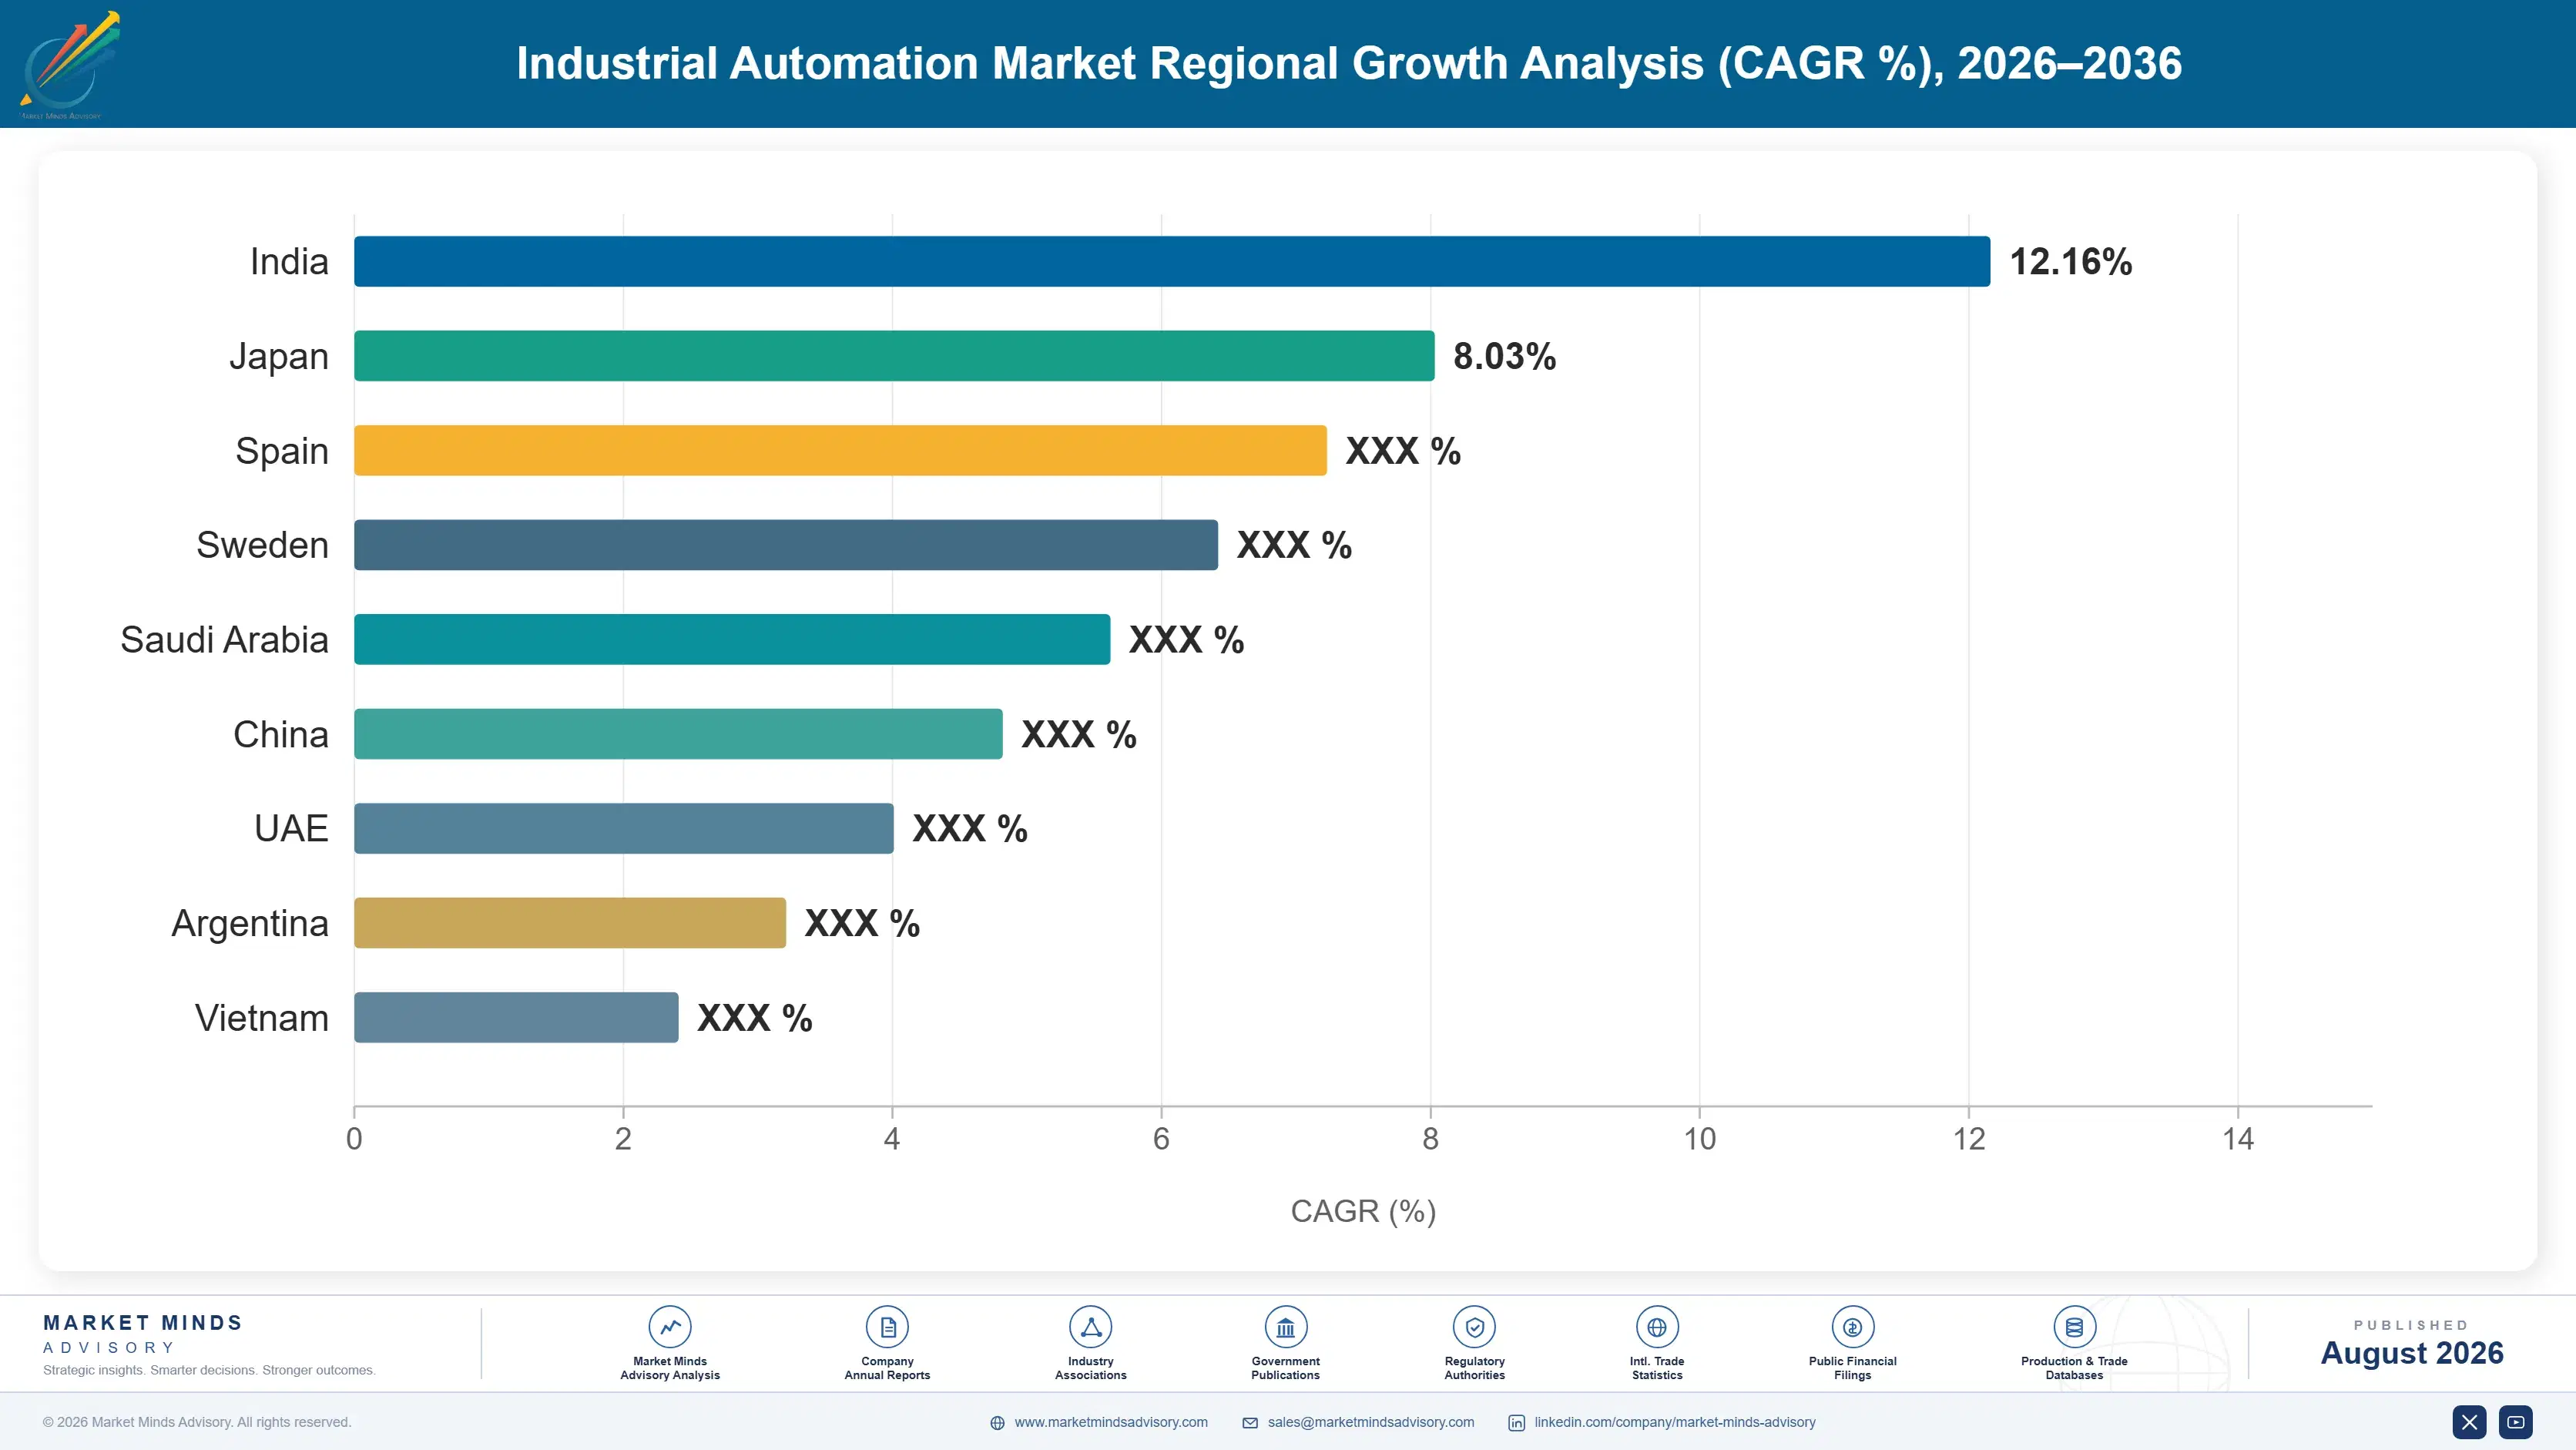
India: 12.4% CAGR
Fastest Growth Region
South Asia and Pacific: 10.4% CAGR
Largest Region
East Asia: 42% of 2025 global value
Market Leaders
Siemens, ABB, Fanuc, Rockwell Automation, Mitsubishi Electric. Source: MMA Primary Research Dataset, July 2026.
Primary Survey
n=3,800 procurement and R&D decision-makers, Q4 2025, six countries
Methodology
Demand-side build-up, cross-validated against public data, 47 expert interviews

Industrial Automation Market Forecast Scenarios

industrial-automation-market-size-forecast-scenario-1787334080319
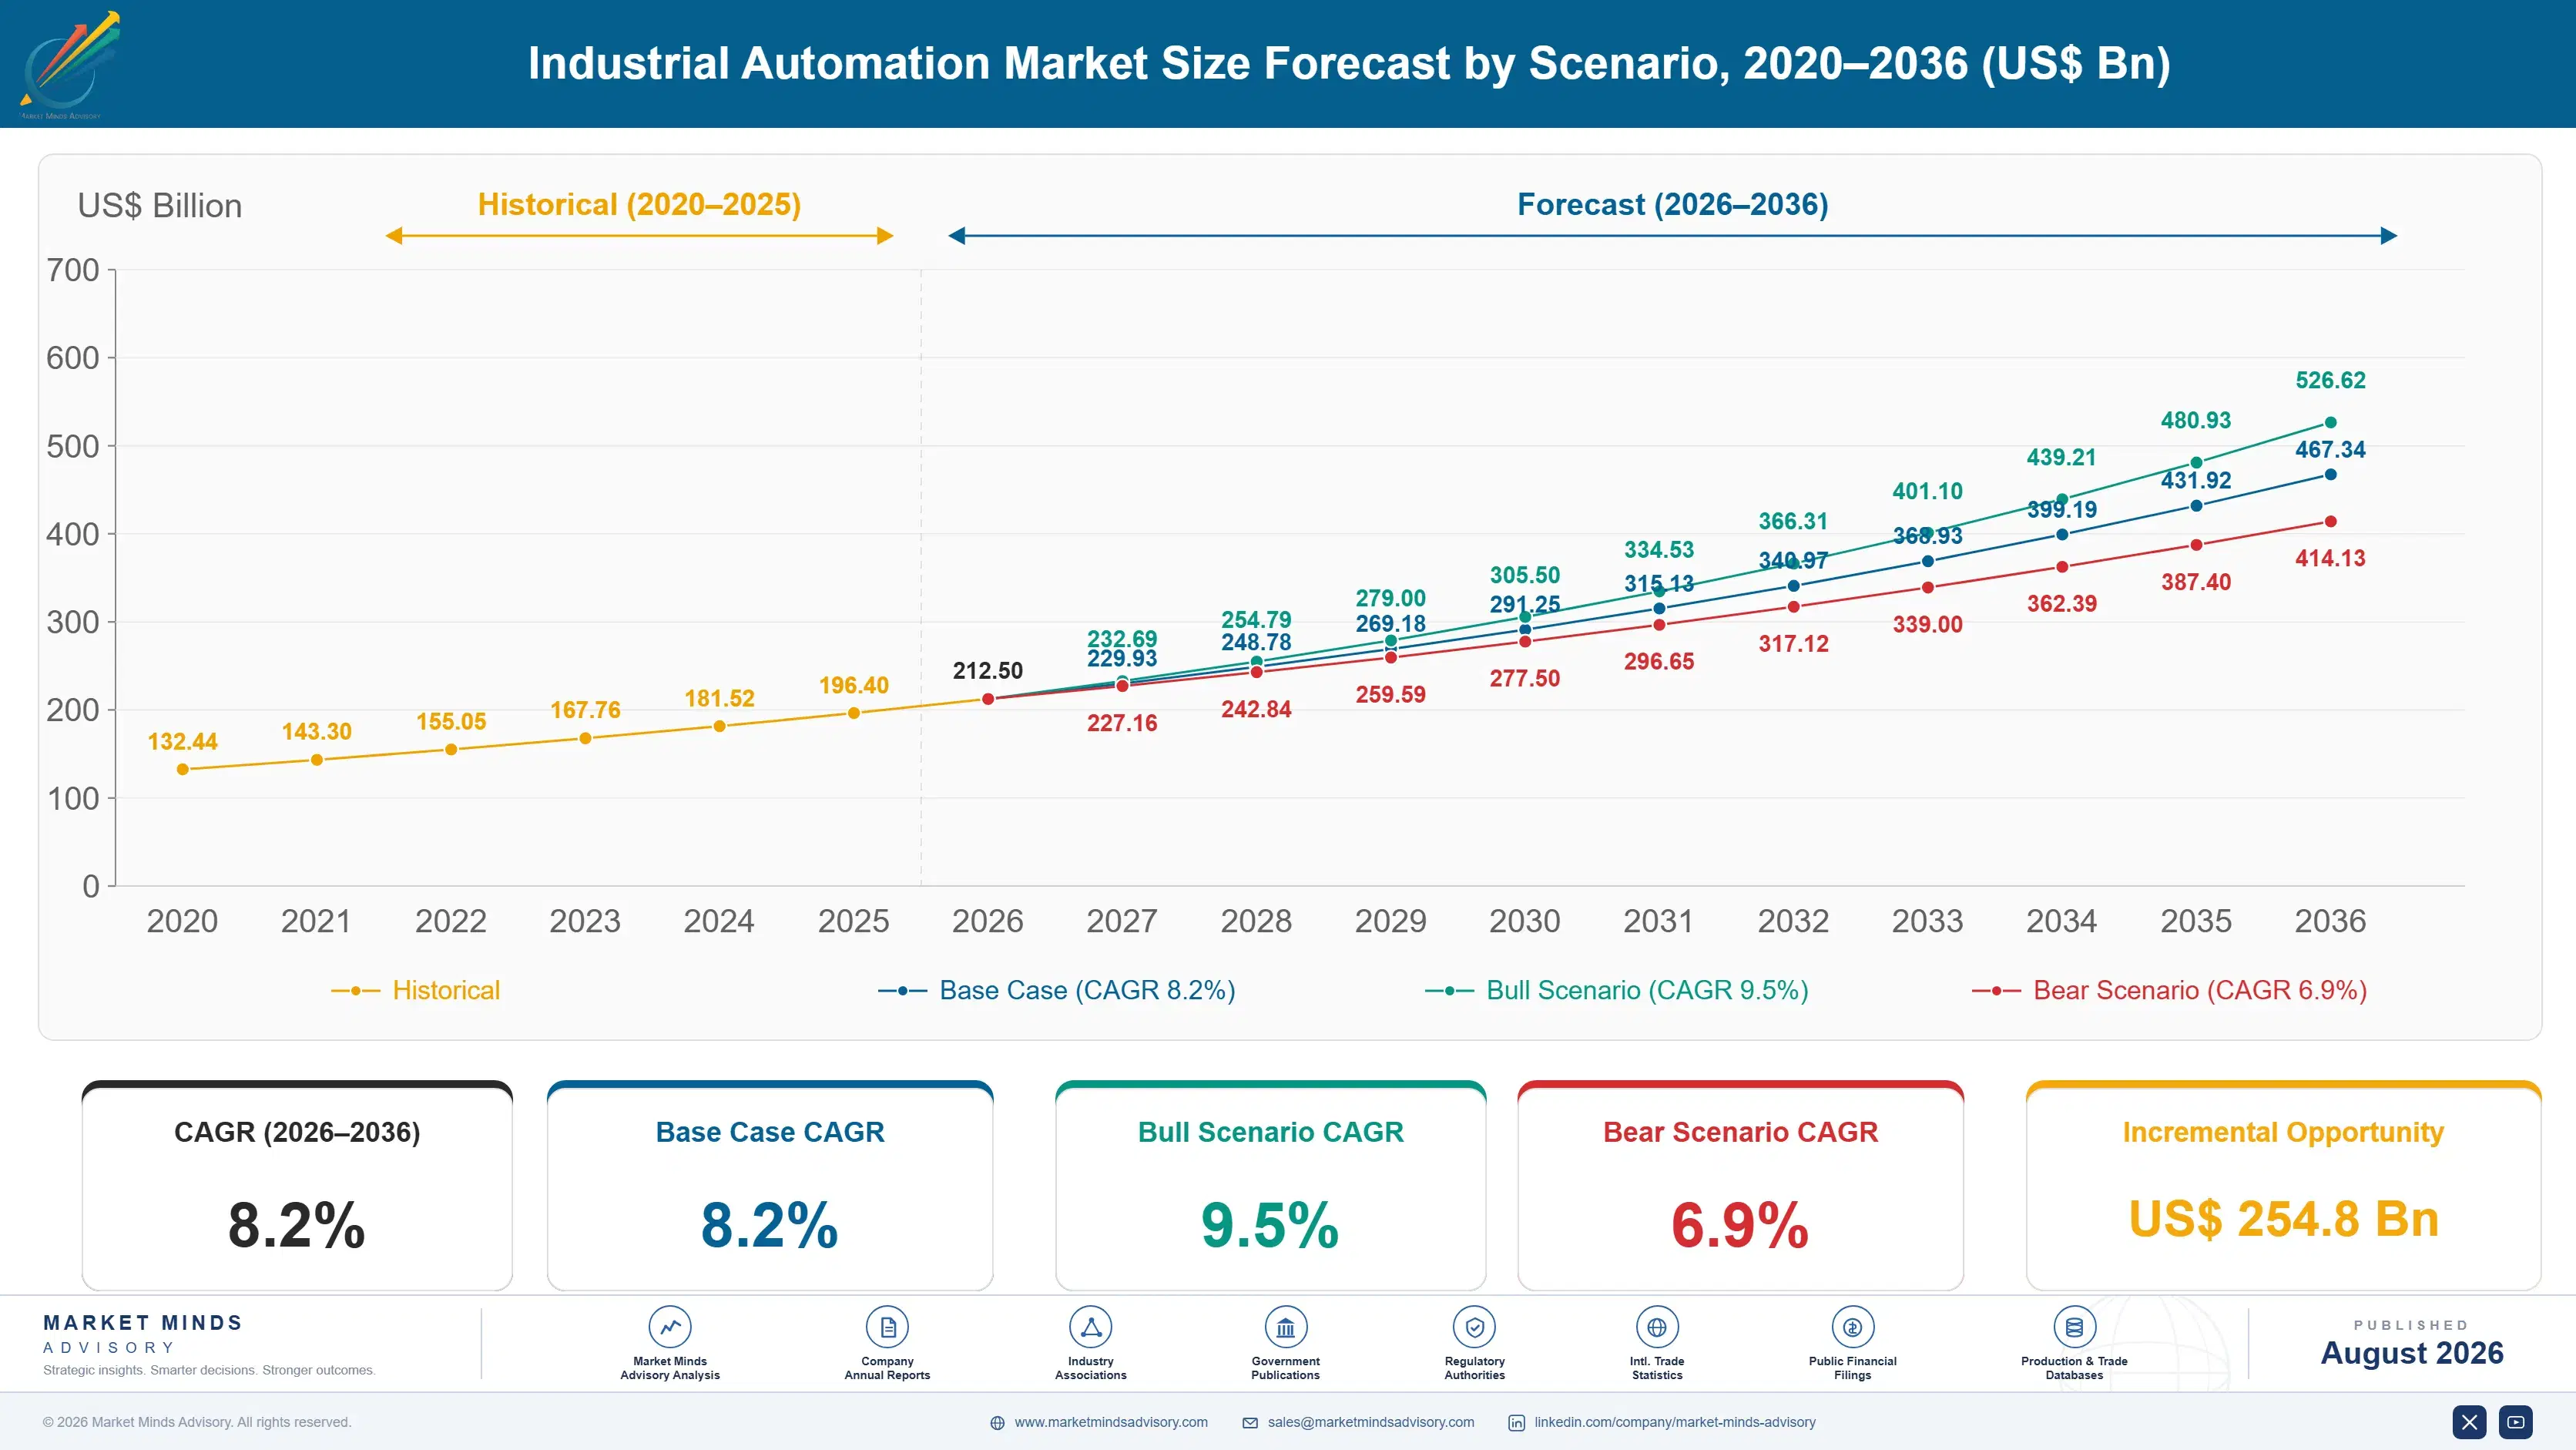
Between 2020 and 2025 the market grew strongly and the competitive map inverted underneath it. Chinese robot and controller manufacturers took share from the international majors in the world's largest automation market every single year, while labour availability drove installation everywhere. Supply chain disruption made resilience an argument automation had never been able to use. A 7.0% historical CAGR conceals a share transfer larger than the growth itself.
Three mechanisms carry the 8.2% base case. Labour availability rather than labour cost is the largest, since manufacturers across developed markets cannot recruit for repetitive work at any wage they can justify. Reshoring and supply chain restructuring is the second, because a plant built in a high wage country only works if it is heavily automated. And Chinese and Indian manufacturing capacity keeps expanding, which is where most unit growth in this category actually occurs.
The 9.5% bull case turns on vision and machine learning making automation viable in high-mix low-volume work that has resisted it for forty years. The 6.9% bear case is manufacturing capital deferral, which reaches automation orders within two quarters because a deferred line is a cancelled order. Integrator capacity constrains both more than manufacturing ever does.

Automating Reveals What The Operators Were Fixing

The business case is always labour and the difficulty is always variability. An operator handling a part that arrived slightly out of tolerance adjusts without thinking and without recording it. A machine cannot, so automating a process exposes every dimensional problem, fixture drift, and material inconsistency the people were absorbing. That is why over 40% of automation projects overrun.
TOP FIVE CONCENTRATION33%Domestic Chinese manufacturers keep taking share in the largest market
AVERAGE CELL VALUEUSD 180,000Typical installed robotic work cell including integration and safety
INTEGRATION COST SHARE58%Portion of project value spent on engineering rather than hardware
PROJECT OVERRUN RATEOver 40 percentShare of automation projects exceeding original schedule or budget
ROBOT SERVICE LIFE10 to 15 yearsOperating years before a manipulator is retired or rebuilt
LEADING PRODUCER SHARE48%Manufacturing concentrates where robot installation volume is highest
It also explains where the growth is. Machine vision grows fastest because it is the layer that gives a cell the ability to see what varied and respond, which is exactly the capability the removed operator provided. Automation without vision only works where the input is genuinely consistent, and very little manufacturing is. Very little manufacturing has genuinely consistent input.
Integration is 58% of project value, not hardware. A robot is a commodity with a published price; making it work in one particular plant with one particular set of parts is engineering somebody has to do. The scarcity of people who can do it decides how fast this market grows far more reliably than any product roadmap does. People rather than product decide how fast this market can grow.
"Every automation project I have seen fail, failed at the interface between the machine and the mess. The robot worked. The parts were not as consistent as the drawing said, and the operator who had been quietly compensating for that since 2011 had already left."
Director, Manufacturing Technology Practice · MMA Technology Practice &mid

Market Trends

Vision Becomes The Layer That Handles Variation

Automation historically required consistent input, which is why it took hold in high volume repetitive work and stalled everywhere else. Vision systems combined with learned models let a cell locate a part that is not quite where it should be, reject one that is not quite right, and adapt a grip to something arriving at an unexpected angle. That reaches the high-mix low-volume manufacturing which has resisted automation for four decades and represents most factories by count. The segment grows at 13.6% against a market at 8.2%, and it grows by removing the precondition rather than by improving the cameras.
Market Impact: Vacancies unfilled beyond 90 days
Chinese Domestic Suppliers Take Their Own Market

China installs more industrial robots each year than the rest of the world combined, and domestic manufacturers now hold the majority of that market after a decade of steady gain against the international majors. Estun, Inovance, and their peers compete adequately on performance for most applications and decisively on price, delivery, and local service. The foreign majors have grown Chinese revenue and lost Chinese position simultaneously throughout, which is an uncomfortable combination to explain. Those same domestic suppliers are now exporting into Southeast Asia, India, and increasingly Europe on the cost position they built at home.
Market Impact: New plants automate 3 times denser

Market Opportunities and Growth Drivers

Labour Availability Replaces Labour Cost As The Argument

Manufacturers across developed markets cannot recruit for repetitive production work at any wage the product can carry, which is a different problem from wages being high. A vacancy nobody applies for cannot be solved by paying more, and the line either runs automated or does not run. That converts automation from an efficiency investment competing against other projects into a capacity decision with no alternative. Plant managers describe it in exactly those terms and finance directors approve on that basis rather than on any payback calculation the supplier presented. No wage increase solves an unfilled vacancy.
Market Impact: Integration takes 58% of project va

Reshoring Only Works If The Plant Is Heavily Automated

Manufacturing returning to high wage countries under supply chain resilience and industrial policy cannot compete on labour cost by definition, so the new plants are automated to a degree the old ones never were. Semiconductor fabrication, battery production, and pharmaceutical manufacturing all fall into that pattern and all involve very large capital programmes. Those facilities specify automation density several times ordinary manufacturing, and the specification is written at design stage rather than retrofitted. Industrial policy funding in the United States and Europe accelerates the same effect regardless of the underlying commercial logic.
Market Impact: Over 40% of projects overrun

Market Restraints and Challenges

System Integrator Capacity Constrains Every Project Timeline

Automation is manufactured by product companies and delivered by system integrators, and integration is 58% of project value while the people who can do it are genuinely scarce. The root cause is that integration requires manufacturing process knowledge alongside controls engineering, and that combination takes years to develop and cannot be recruited quickly. Commercially this caps how fast the market can grow regardless of demand, and it pushes lead times out on projects already sold. Suppliers are mitigating with pre-engineered cells, integrator training programmes, and configuration tools that reduce the engineering hours a project consumes.
Market Impact: Vision grows at 13.6% annually

Automation Exposes Variability That Nobody Documented

An operator absorbs part variation, fixture drift, and material inconsistency continuously and without recording any of it, so the process specification describes something more consistent than reality. The root cause is that nobody measured what the person was actually compensating for until the person was removed. Commercially this produces project overruns above 40% and damages the supplier's reputation for problems the customer's process created. Suppliers are mitigating with process capability studies before quotation, vision-enabled cells that tolerate variation, and phased commissioning that surfaces problems early. Phased commissioning surfaces the problems earlier.
Market Impact: China installs over 50% of robots
3 additional market trends, 4 additional growth drivers, and 2 additional restraints and challenges are covered in the full report. Contact sales@marketmindsadvisory.com to access the complete intelligence.

Segment CAGR and Growth Architecture

Segmentation follows automation layer, meaning where in the control and execution hierarchy a product sits, because that determines who specifies it, what it integrates with, the engineering content around it, and the competitive field. End-use industry, application type, and deployment model are handled in the framework and commentary rather than as segments. Layer decides the competitive field entirely.
industrial-automation-market-market-share-analysis-1787334080861

Machine Vision and Inspection Systems

Machine vision grows fastest at 13.6%, about 1.66 times the market rate, and it grows by removing automation's oldest precondition rather than by any camera improvement. A cell with vision can locate a part that is not quite where the fixture assumed, reject one outside tolerance, and adapt to presentation the programmer did not anticipate, which is exactly what the removed operator was doing. That reaches high-mix low-volume manufacturing which resisted automation for four decades and still represents most factories by count. Learned models have widened it further into surface inspection and defect classification that rule-based systems never handled. Keyence and Cognex hold unusually strong positions built on application engineering rather than on optics.
CAGR 13.6%

Industrial Robots and Manipulators

Industrial robots grow at 9.8%, and the interesting movement is competitive rather than volumetric. China installs more units annually than the rest of the world combined and domestic manufacturers now hold the majority of that market, having taken share from the international majors every year for a decade. Collaborative and lighter payload formats have opened applications traditional caged cells could not reach economically, particularly in smaller manufacturers with no automation experience at all. The manipulator itself has commoditised considerably, which pushes value toward the controller, the software, and the integration around it. Price per axis keeps falling while project value holds, because the engineering content rises to fill the gap.
CAGR 9.8%
Full segment breakdown across 7 segments available in the complete report.

Regional Architecture and Country Demand Map

Regional shares follow manufacturing output and robot installation density rather than economic size, which puts most figures outside the bands this framework applies. Each out-of-band share is explained in its own paragraph, and the reason is the same concentration of manufacturing in every case. Manufacturing concentration explains all of it.

East Asia

East Asia holds 42% of value, far above the 30% ceiling this framework applies, because China alone installs more industrial robots each year than every other country combined and Japanese and Korean manufacturing add substantially on top. The competitive story matters more than the size. Domestic Chinese manufacturers have taken the majority of their own market across a decade, competing adequately on performance and decisively on price and delivery. Japanese suppliers remain dominant in precision motion and robotics globally while their domestic market matures. Korean demand concentrates in semiconductor and battery manufacturing. Growth at 9.2% exceeds the global rate, and almost all the incremental value is being captured by domestic suppliers rather than by anybody else.
Share: 42% | CAGR: 9.2% (2026 to 2036)

South Asia and Pacific

Fastest growth anywhere sits in South Asia and Pacific at 10.4%, on 11% of value. Indian manufacturing is expanding under production incentive schemes and supply chain diversification, and automation density remains low enough that almost any investment represents genuine first adoption rather than replacement. Automotive, electronics, and pharmaceutical plants lead, and Indian integrators are developing capability faster than most observers expected. Australian demand is small and concentrated in food processing and mining. Southeast Asian electronics assembly is absorbing capacity relocating from China and automating as it does so. Almost all of this is first installation, which explains a growth rate that no mature manufacturing region can approach. Density that low makes almost anything genuine adoption.
Share: 11% | CAGR: 10.4% (2026 to 2036)
Regional intelligence for 5 additional markets available in the complete report: North America, Western Europe, Eastern Europe, Latin America, Middle East and Africa. Contact sales@marketmindsadvisory.com.
industrial-automation-market-country-cagr-analysis-1787334081367

Where Automation Value Actually Accrues

Four levers matter here, and product specification is the least of them, because a robot is a commodity with a published price. Integration capacity, process capability assessment, vision enablement, and Chinese market realism decide outcomes instead. A supplier competing on repeatability figures against another adequate machine is discussing what no project ever failed on.

Build Integration Capacity Before Selling More Hardware

Integration is 58% of project value and the people who can do it are scarce enough that projects wait on availability rather than on equipment. A supplier who sells hardware into a market with no integrator capacity has sold a delayed project and an unhappy customer. Pre-engineered cells, configuration tools that cut engineering hours, and funded integrator training all raise how much work a fixed pool of people can deliver. That is the single most effective growth investment available in this category and almost nobody funds it properly. Almost nobody funds this properly today.
Market Impact: Integration takes 58% of the total

Study The Process Before Quoting The Cell

Over 40% of automation projects overrun, and most of the overrun traces to part variation, fixture drift, and material inconsistency that the removed operator was absorbing without recording. A capability study before quotation costs an engineer a week and finds the problems while they are still the customer's to fix rather than the supplier's to explain. Suppliers who quote from a drawing inherit whatever reality turns out to be. Those who measure first quote higher, win less often, and deliver projects that work. Reality is messier than the drawing claims.
Market Impact: Over 40% of all projects overrun th

Lead With Vision On Anything High Mix

Automation historically needed consistent input, which confined it to high volume repetitive work and left most factories untouched. A vision-enabled cell locates what moved, rejects what is wrong, and adapts to presentation nobody anticipated, which removes the precondition rather than working around it. That opens high-mix low-volume manufacturing representing the majority of plants by count and almost none by current automation spend. Vision grows at 13.6% for exactly this reason, and suppliers treating it as an accessory to a robot sale have the relationship inverted. The relationship is inverted at most suppliers.
Market Impact: Vision now grows at 13.6% every sin

Decide Honestly What China Is Worth Defending

Domestic Chinese manufacturers hold the majority of the world's largest automation market and have gained share every year for a decade against competitors with better products. Defending position there costs price concessions that reset global pricing expectations and reach every other market through customer benchmarking. The honest options are competing on applications where domestic capability genuinely falls short, or accepting a smaller and more profitable Chinese position. Most international suppliers have chosen neither and are drifting toward the worse outcome by default. Domestic suppliers already hold over 50% of that market.
Market Impact: Domestic suppliers hold over 50% of

Who Controls the Margin Pool

Concentration sits at 33% for the top five and continues falling, which is unusual in a technology market and reflects Chinese domestic suppliers taking the largest single market from the international majors. The gap between leaders and challengers is application engineering and integrator relationships rather than machine performance, which converged years ago. All participants here are assessed on one basis, revenue from discrete and hybrid automation equipment and software.
Competition runs on four lines. Integrator relationships decide which products reach projects, since the integrator specifies more often than the manufacturer does. Application engineering decides whether a cell works in a plant with real variability. Vision capability decides access to high-mix work. Price decides standard robots and controllers in Asia, where domestic suppliers set the level.

Two pressures will move positions. Chinese manufacturers are exporting the cost position they built at home into Southeast Asia, India, and increasingly Europe, where their absence was never technical. Meanwhile vision and learned models are shifting value from the manipulator to the perception layer. Positions favour whoever holds vision depth alongside integrator reach, and few of the majors hold both.
industrial-automation-market-company-positioning-matrix-1787334081887

Competitive Moat and Risk Dimensions

SIEMENS

Moat: Controller installed base and engineering

Siemens holds the largest programmable controller installed base in discrete manufacturing, and the engineering environment around it is what a plant standardises on across every machine it buys. Changing that means retraining maintenance staff and rewriting programmes nobody wants to touch. Digital engineering tools extend the position into machine design, reaching the builder rather than the user.
SIEMENS

Risk: Weak robotics and vision position

Controller strength does not extend into robotics or machine vision, which are the segments growing fastest and where value is concentrating as manipulators commoditise. Chinese controller manufacturers compete adequately at a fraction of the price in the largest market. Portfolio breadth also means automation competes internally against businesses with clearer returns.
FANUC

Moat: Robot volume and reliability record

Fanuc holds the largest installed robot population worldwide alongside a reliability reputation that genuinely reduces perceived risk on projects where downtime is expensive. Manufacturing scale in robots and computer numerical controls together produces a cost position no Western competitor approaches. Service network density means an automotive plant can get a technician quickly almost anywhere it operates.
FANUC

Risk: Chinese erosion and vision gap

Chinese domestic manufacturers are taking the largest robot market on price and delivery, and Fanuc's position there has weakened steadily despite growing volumes. Vision and perception capability is thinner than the robotics position warrants at a point when that layer is capturing value. Heavy automotive exposure also carries cycle risk as platform investment moves in waves.

Players Tracked

Prominent Players

Siemens
ABB
Fanuc
Rockwell Automation
Mitsubishi Electric

Other Key Players

Yaskawa
KUKA
Schneider Electric
Omron
Keyence
Cognex
Bosch Rexroth
Beckhoff Automation
Estun Automation
Inovance Technology
SMC Corporation
Festo
Universal Robots
Kawasaki Heavy Industries
Denso Wave

Recent Developments

MARCH 2025

Chinese robot manufacturers extend export push into Europe

Chinese industrial robot manufacturers widened sales efforts into European and Southeast Asian markets, competing on delivered price and lead time against suppliers whose positions were never contested on cost. These were competitive moves rather than corporate transactions, and they carry a cost position built in the domestic market.
Signal: A cost position built at home travels, and
OCTOBER 2024

Vision-guided cells reach high-mix manufacturing applications

System integrators reported growing deployment of vision-guided robotic cells into high-mix low-volume manufacturing that previously could not justify automation, using learned models to handle part variation the fixtures never anticipated. These were application developments rather than transactions, and they address the precondition that confined automation for four decades.
Signal: Removing a precondition opens far more add
JULY 2024

Integrator capacity constraints extend automation project timelines

Automation projects across North America and Europe reported extended delivery schedules attributed to system integrator engineer availability rather than to any equipment lead time. These were delivery capacity constraints rather than any commercial event, and they cap how fast the market converts demand into installed capacity.
Signal: When the binding constraint is people rath

Semiconductors, Motors, Castings, Engineering

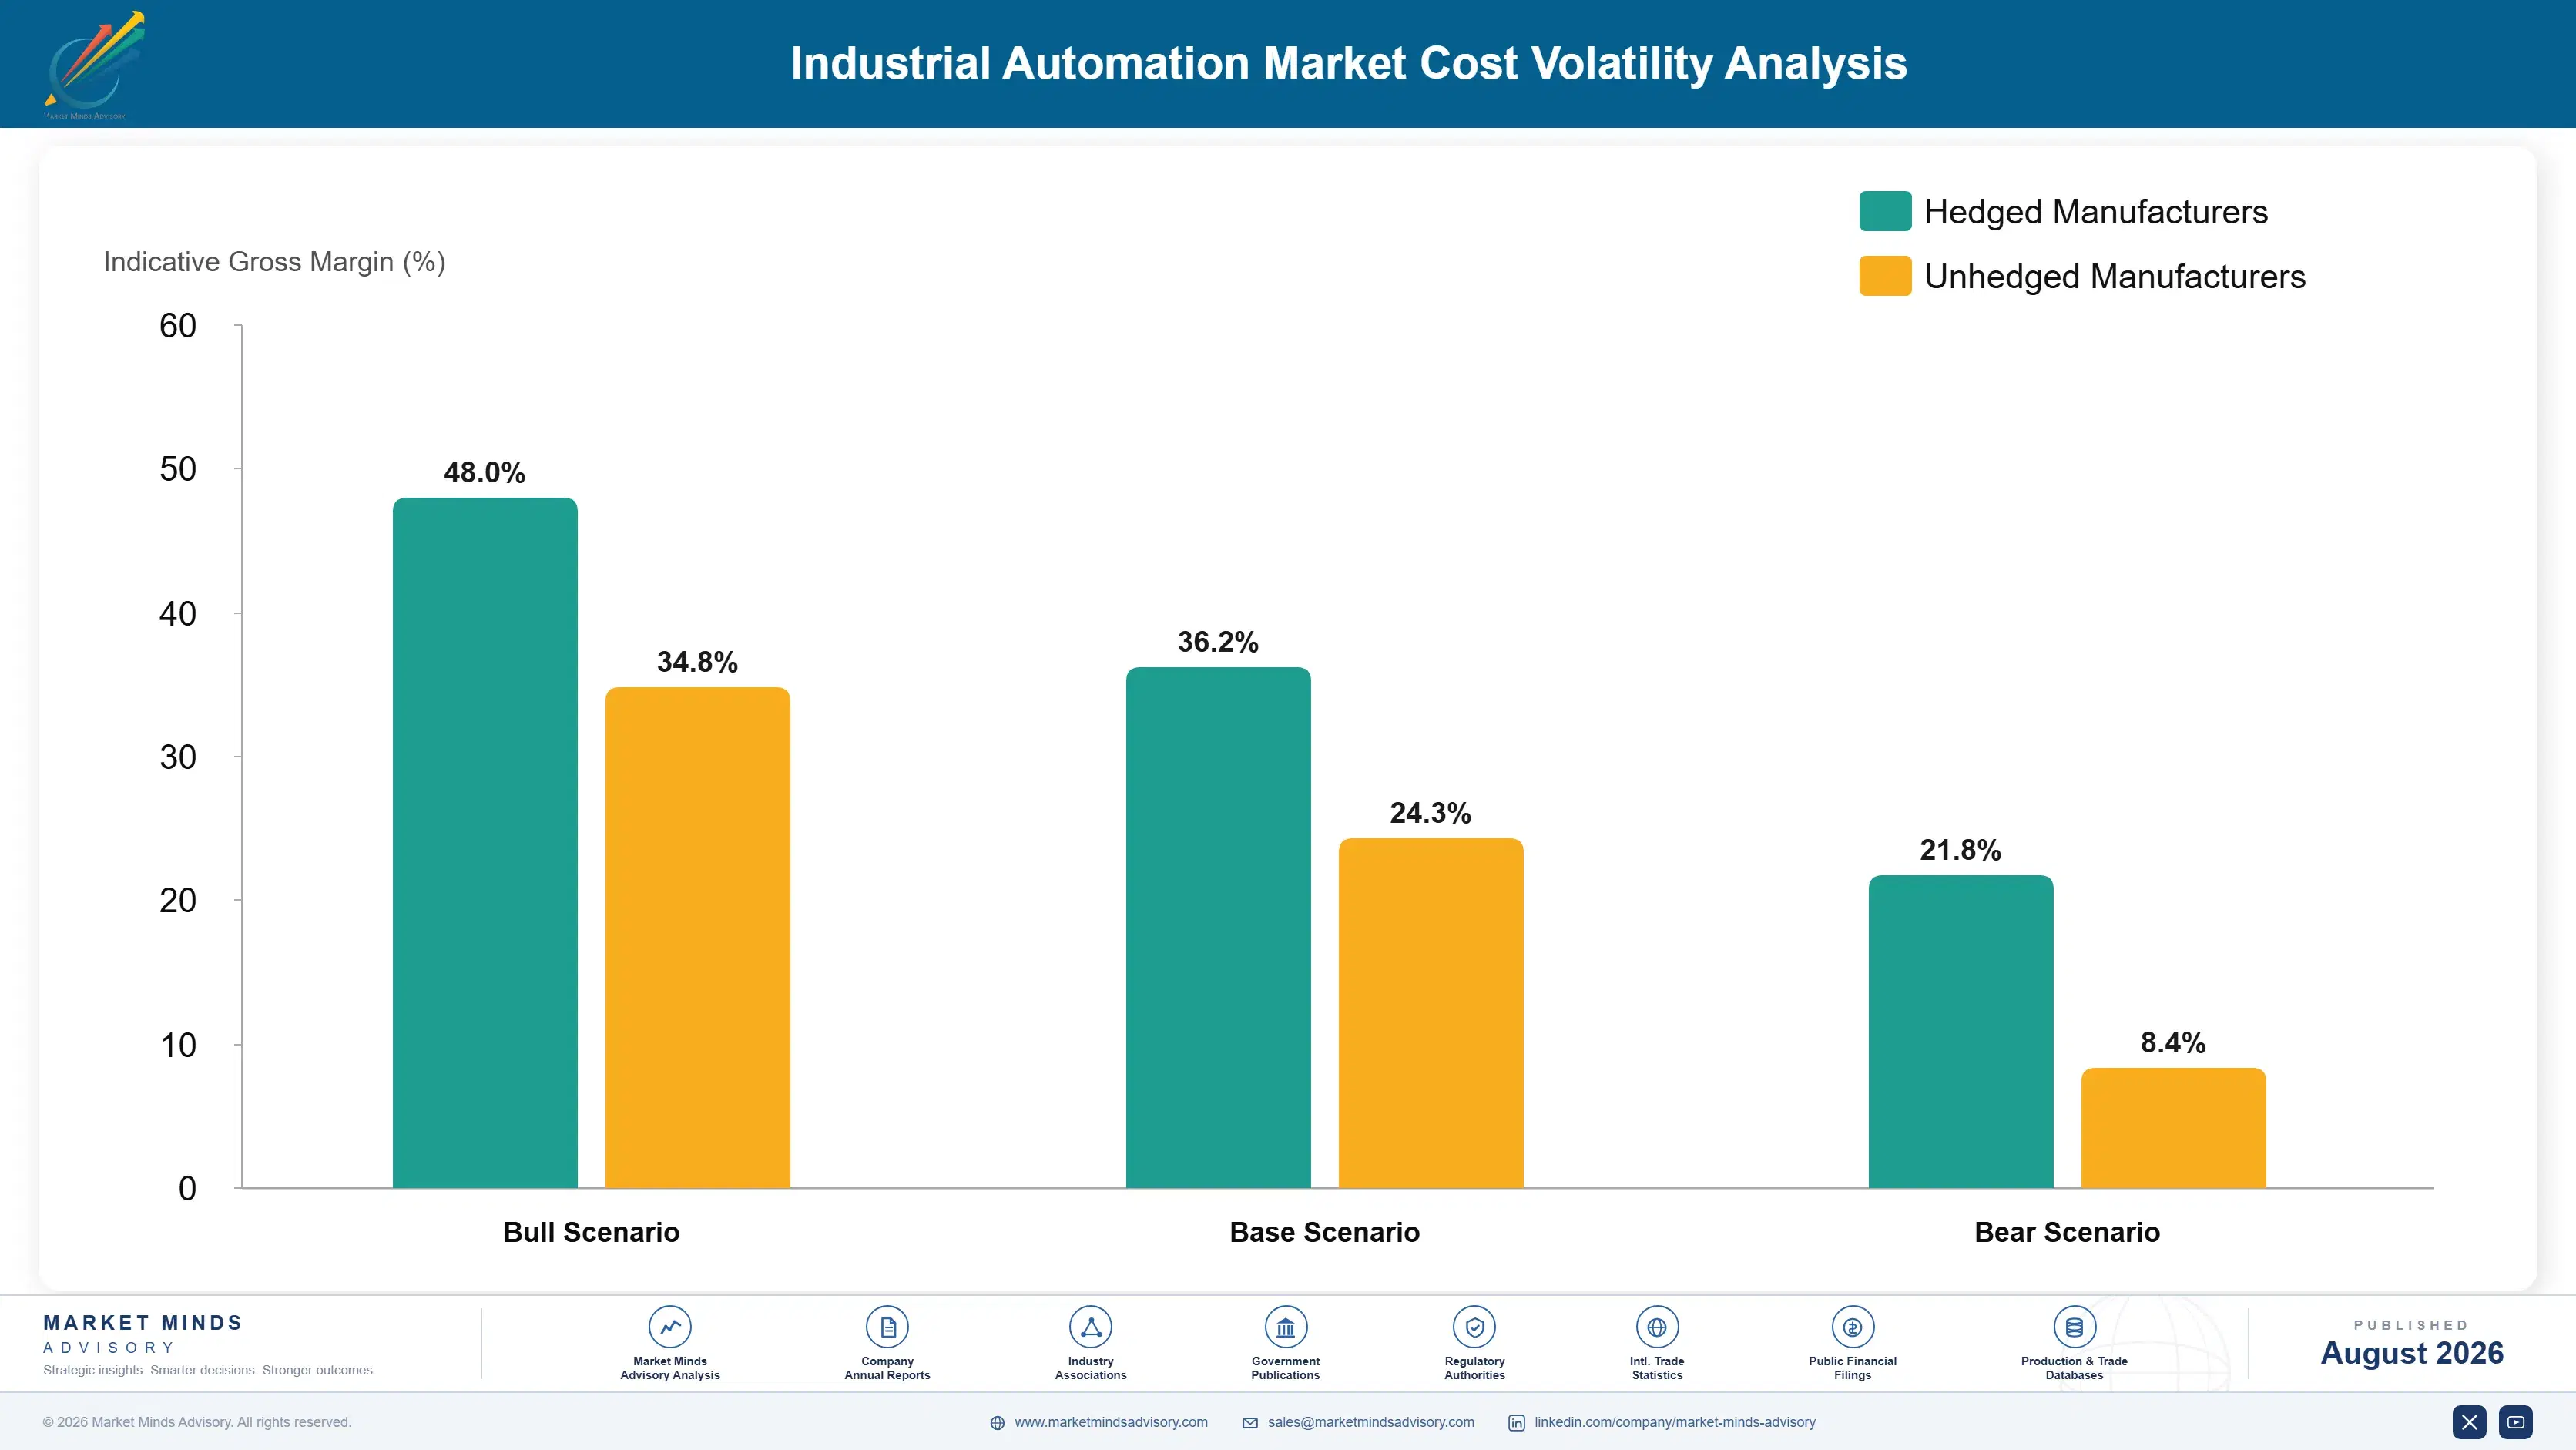
Cost structure differs sharply between hardware and delivered projects. Semiconductors, drives, and control electronics carry 30% to 44% of equipment cost, from suppliers serving far larger industries. Motors, gearboxes, and precision castings add 22% to 34% on robots and motion products. Engineering labour dominates delivered project cost entirely and varies by market more than any manufactured input does.
The 2021 and 2022 semiconductor shortage reached automation harder than most industries, because controllers and drives use mature-node parts reallocated to higher-volume customers and safety-rated products cannot be redesigned quickly. Lead times on some controllers ran past 50 weeks. Siemens and Rockwell Automation both disclosed component supply and cost pressure across that period. Several suppliers rationed allocation to their largest accounts, which cost them smaller customers permanently.

Each range above exceeds three points because a controller and a robot manipulator share electronics but nothing mechanical. Exposure separates by product mix. A controls-weighted supplier carries semiconductor risk with limited substitution under safety certification. A robotics supplier carries motor, gearbox, and casting exposure it can index. Engineering wage inflation reaches every supplier and no purchasing discipline addresses it at all.
industrial-automation-market-cost-volatility-analysis-1787334082081

Dual source controller semiconductors at design stage

Controllers and drives use mature-node parts reallocated whenever larger customers need them, and substituting one in a safety-rated product means repeating certification. Qualifying alternatives during design costs testing time once, while discovering the dependency during a shortage costs a product line most of a year and the customers who got rationed. Very few design for dual sourcing from the outset.

Cut engineering hours rather than component cost

Integration engineering is 58% of delivered project value and rises with wages every year, while hardware cost falls. Configuration tools, pre-engineered cells, and reusable application libraries reduce the hours a project consumes, which improves both margin and delivery capacity at the same time. Most chase component cost because it is measurable and ignore the larger line.

Standardise the mechanical platform across payload range

Motors, gearboxes, and castings carry up to 34% of robot cost and are largely common across payload classes if a supplier designs the range that way. Most robot families grew by accretion instead, with each model developed separately. Consolidating onto shared mechanical platforms costs a redesign cycle and permanently improves purchasing scale, spares inventory, and service training together.

Portfolio Architecture for Margin Defence

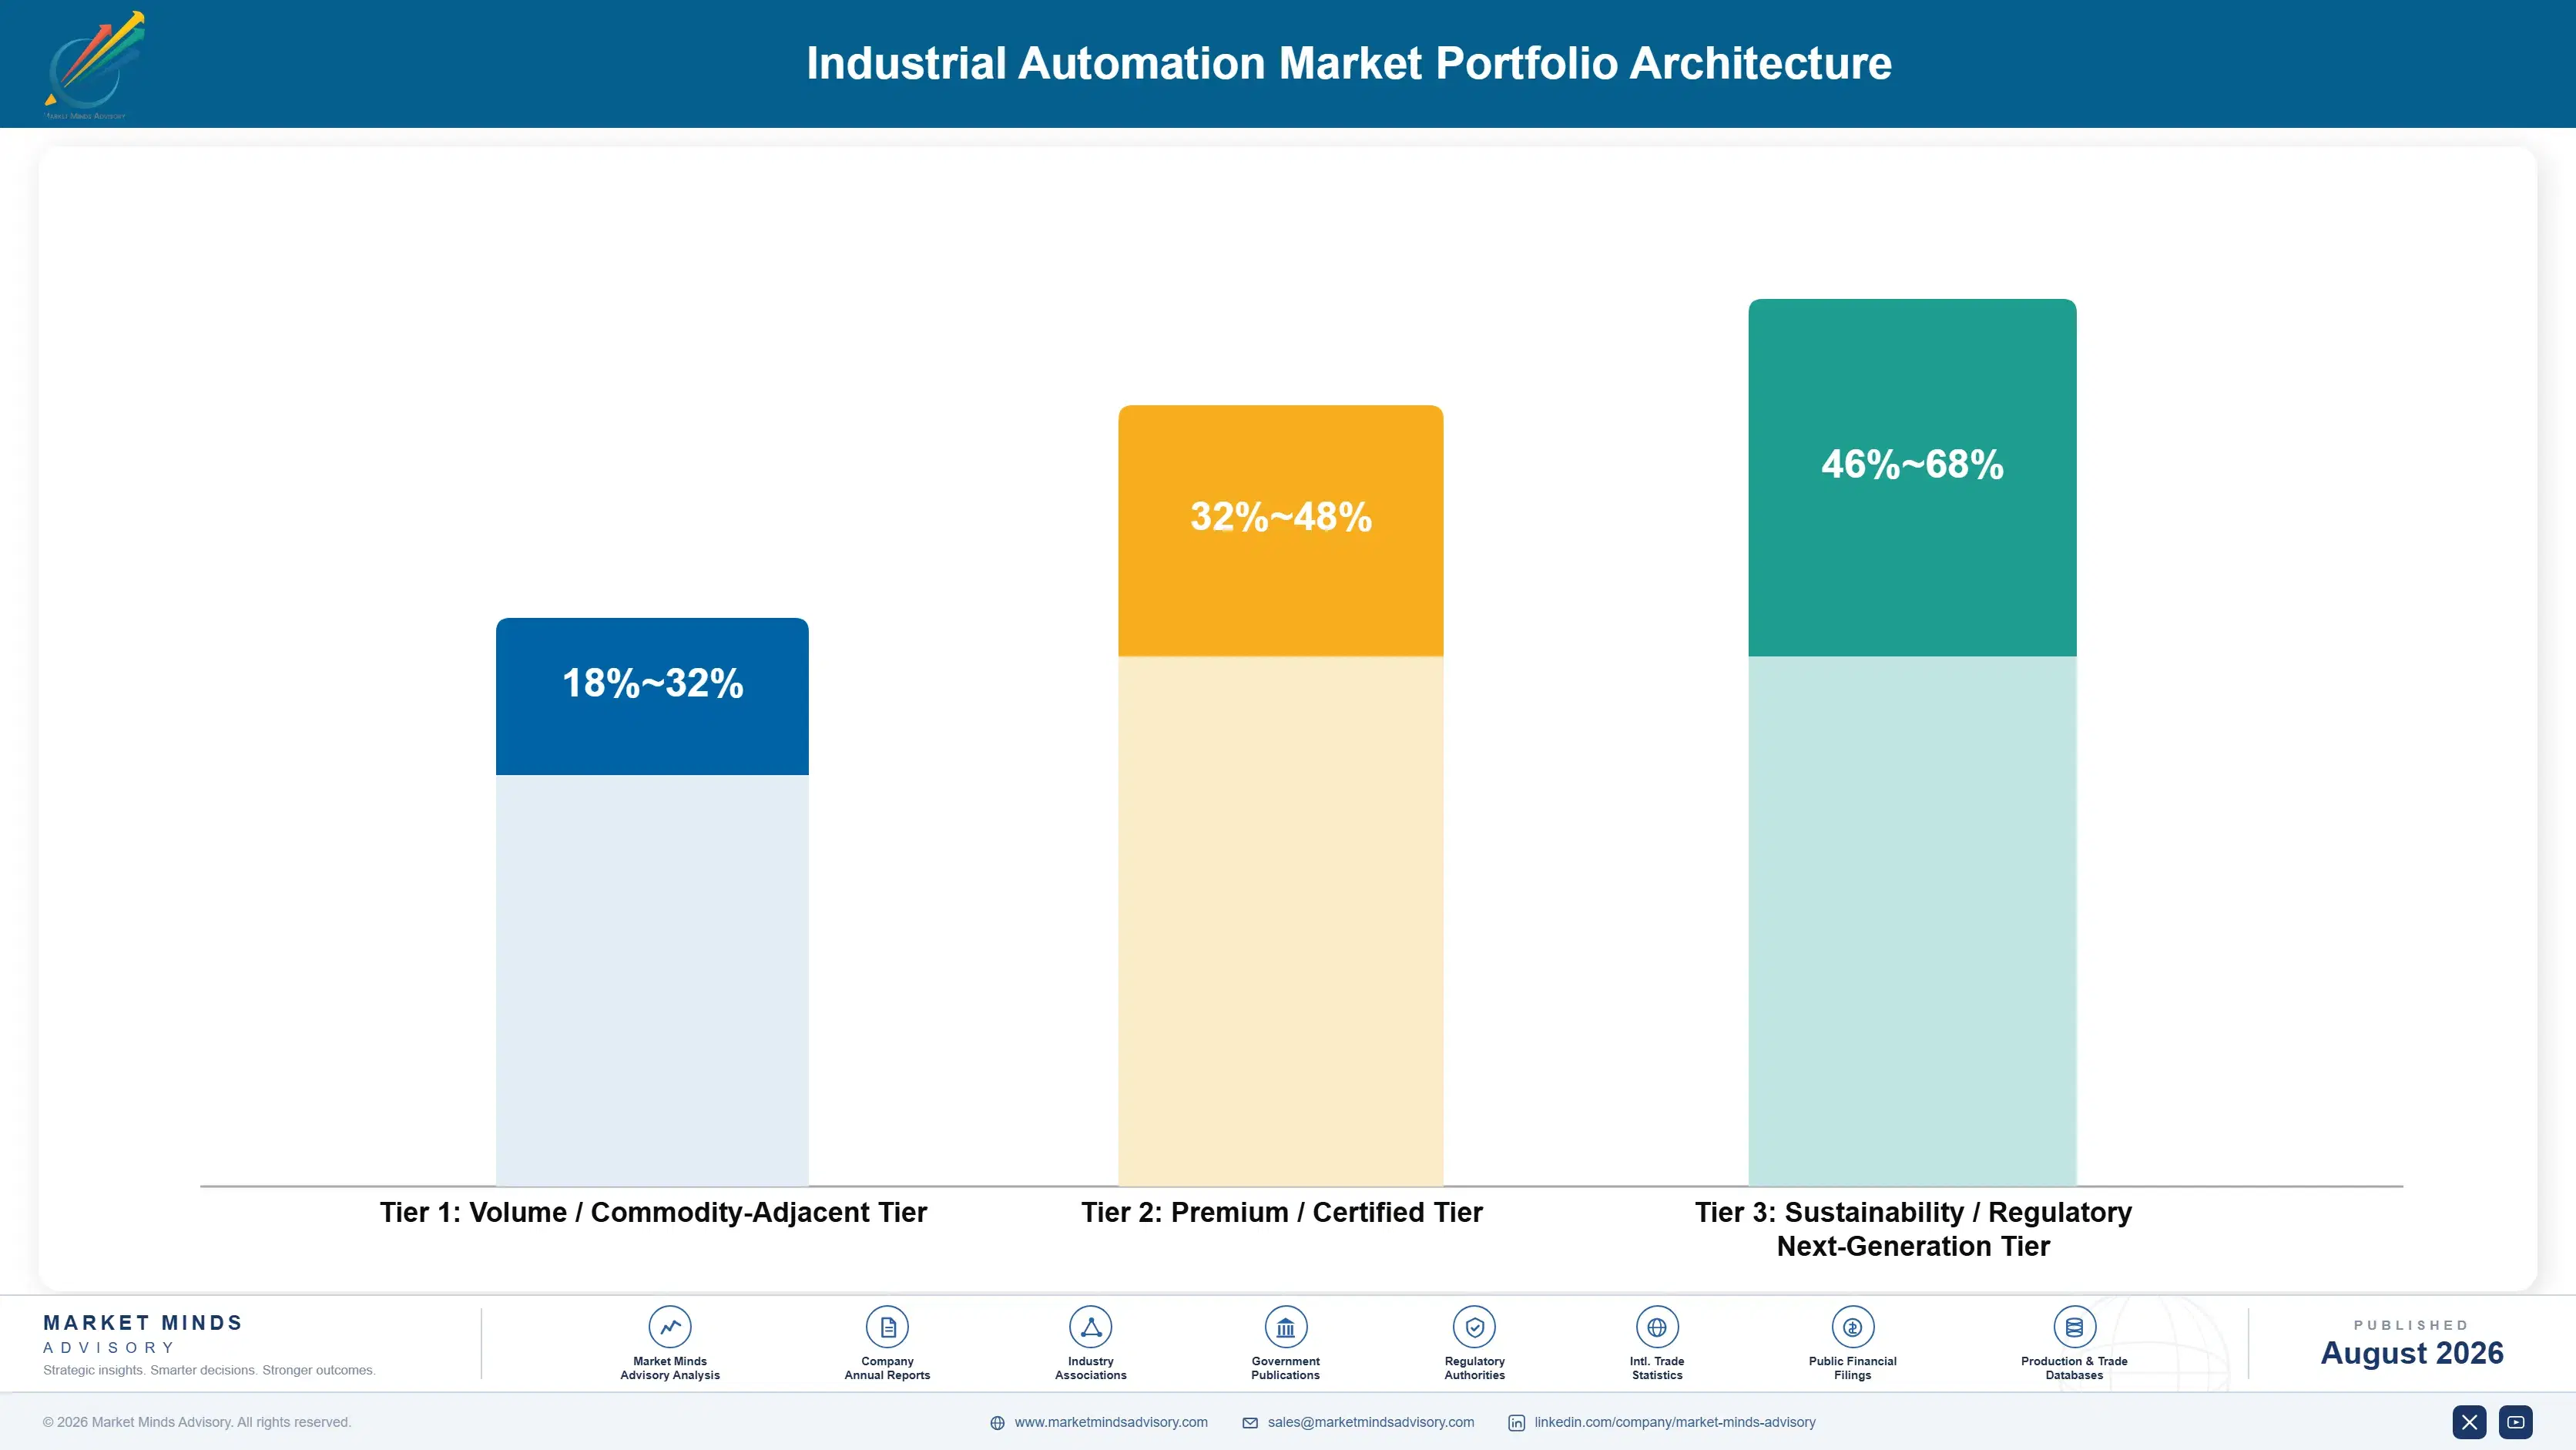
Three tiers sit inside this category and engineering content draws every line. Standard robots, controllers, and drives form the volume tier, where domestic Asian manufacturers set pricing and the hardware has commoditised. Application-engineered cells and safety systems earn more, because somebody has to make them work in a specific plant. Vision, perception software, and pre-engineered application packages price highest, since each removes engineering hours nobody has available.
The tension is between hardware volume that fills the factory and engineering content that earns the return. Manipulators and controllers ship in quantity at prices falling every year against Chinese competition. Application engineering earns considerably better and is limited by people rather than capacity. Suppliers organised as product companies struggle with the second, because it requires a different organisation and a different kind of employee entirely.

High-value pools concentrate where engineering or perception limits competition: vision-enabled cells in high-mix work, safety systems requiring certification, pre-engineered application packages that cut integration hours, and anything sold with process capability work attached. The commodity end is standard payload robots and general purpose controllers, where Chinese manufacturers set the price for everybody.

Volume / Commodity-Adjacent Tier

Standard payload robots, general purpose controllers, and motion drives sold on price and delivery. The range is wide because Chinese manufacturing cost positions and Japanese or European engineering overheads differ enormously on comparable machines.
Gross Margin: 18-32%

Premium / Certified Tier

Application-engineered cells, certified machine safety systems, and precision motion for demanding processes. The range is wide because engineering content varies by application while the hardware inside carries broadly similar cost.
Gross Margin: 32-48%

Sustainability / Regulatory / Next-Generation Tier

Machine vision, perception software, learned inspection models, and pre-engineered application packages. The range is wide because software carries almost no marginal cost while application libraries require continuous development to stay useful.
Gross Margin: 46-68%
industrial-automation-market-portfolio-architecture-1787334082584

High-value Sub-segments and Strategic Watch-out

Machine Vision and Inspection Systems

High value and high growth at 13.6%, the fastest layer, because vision removes the consistency precondition that confined automation to high volume repetitive work for four decades. Application engineering rather than optics decides who wins, which is why Keyence and Cognex hold positions the automation majors have not taken.
Gross Margin: 46-68%

Industrial Robots and Manipulators

High value with strong growth at 9.8%, though the competitive movement matters more than the volume since Chinese domestic suppliers now hold the majority of the largest market. The manipulator has commoditised and value is migrating toward the controller, the software, and the integration around it.
Gross Margin: 18-32%

Programmable Controllers and Industrial PCs

The volume core by installed units at 6.3%, carrying the engineering environment a plant standardises on across every machine it buys. Switching means retraining maintenance and rewriting programmes, which produces unusual stickiness for a product that is otherwise fairly interchangeable. Programme libraries accumulate for decades here.
Gross Margin: 32-48%

Motion Control and Servo Drives

The strategic watch-out at 7.1%, essential to every machine and increasingly supplied by Chinese manufacturers whose performance is adequate for most applications. Precision and high dynamic work remains defensible, while the general purpose volume underneath it erodes steadily on price every year. Adequate is enough for most work.
Gross Margin: 18-32%

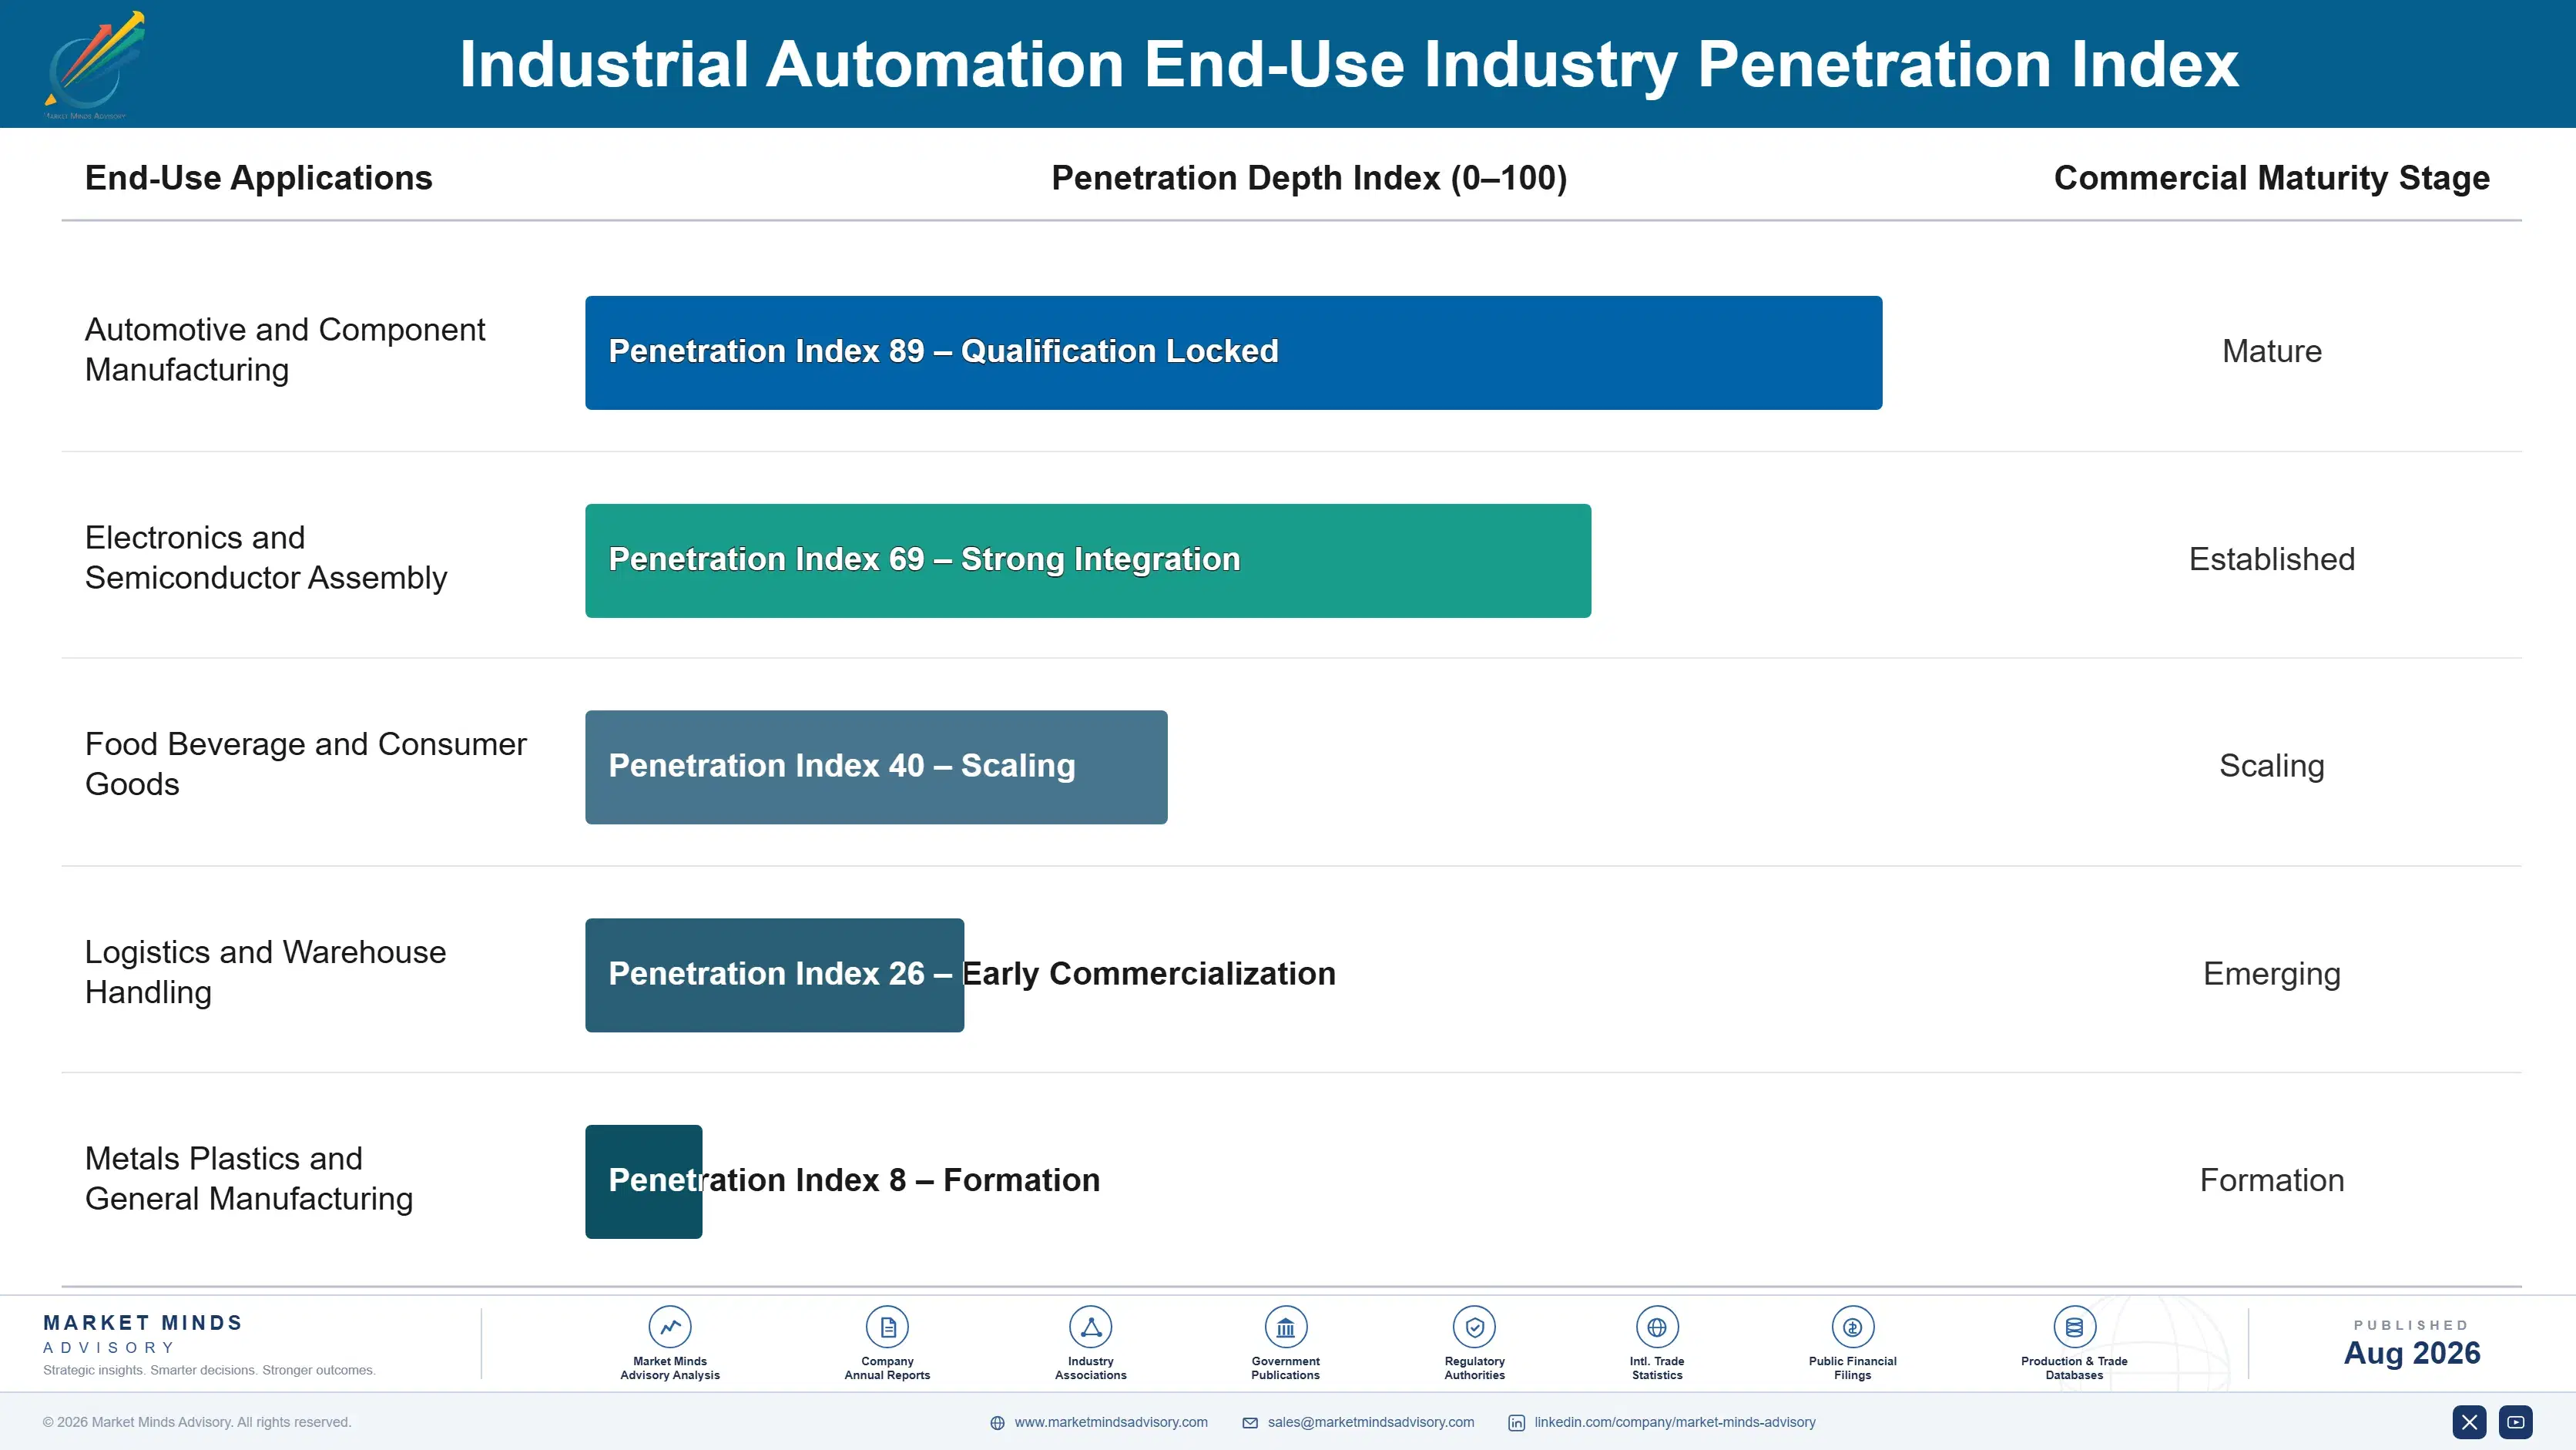
How Automation Demand Gets Committed

Demand commits at machine design or line specification and then repeats across every similar machine a plant buys, because a manufacturer standardising on one controller environment does not want two sets of programming skills. That produces genuine platform lock at the controls layer and much weaker lock at the robot layer, where manipulators are interchangeable. The competitive moments are a new plant, a standard review, and a project where the incumbent integrator has no capacity.
Stickiness varies by layer rather than by industry. Controller and engineering environments stick hardest, since maintenance training and programme libraries accumulate around them for decades. Safety systems stick nearly as hard through certification records. Vision sticks through application configuration nobody wants to redo. Robots stick least of all, because a manipulator is specified by payload and reach and a competitor's will do the same job.

The buyer has moved from a plant engineer to a system integrator and, on larger programmes, to a corporate manufacturing engineering standard. Twenty years ago a works engineer chose equipment. Now an integrator specifies within a corporate standard that named approved suppliers years earlier. Manufacturers selling to plants compete for choices a standards document and an integrator already narrowed.
industrial-automation-market-end-use-penetration-index-1787334083074

Our Call On Industrial Automation

These are among the four positions where our research anticipates prominent divergence between winners and laggards over the coming forecast period. Each is grounded in the demand model, the regulatory perimeter, and the announced capacity pipeline.
01 / INTEGRATION CAPACITY BUILDING

The constraint is people, not product

Integration accounts for 58% of delivered project value and the engineers capable of doing it are scarce enough that projects now wait on availability rather than on equipment lead times. A supplier selling more hardware into a market with no integrator capacity has sold a delayed project and an unhappy customer who will remember it. Pre-engineered cells, configuration tooling, and funded integrator training all raise the output of a fixed pool of people, which is the single most effective growth investment in this category and almost nobody funds it seriously.
02 / PROCESS CAPABILITY DISCIPLINE

Measure the variation before quoting the cell

More than 40% of automation projects overrun, and the overrun almost always traces to part variation, fixture drift, and material inconsistency that the departed operator was absorbing continuously without ever recording any of it. A capability study before quotation costs an engineer a week and surfaces those problems while they remain the customer's to fix rather than the supplier's to explain afterwards. Suppliers quoting from a drawing inherit whatever reality turns out to be, and reality in most factories is considerably messier than the specification claims.
03 / PERCEPTION LAYER PRIORITY

Vision removes the precondition, not the operator

Automation historically required consistent input, which confined it to high volume repetitive work and left the majority of factories by count effectively unaddressable at almost any price. A vision-enabled cell locates what moved, rejects what is wrong, and adapts to presentation nobody programmed for, which is precisely the capability the removed operator was providing all along. Vision therefore grows at 13.6% against a market at 8.2%, and suppliers treating it as an accessory attached to a robot sale have the commercial relationship exactly inverted.
04 / CHINA POSITION REALISM

Choose a defensible position or lose gradually

Domestic Chinese manufacturers hold over half of the world's largest automation market and have gained share every single year for a decade against competitors with demonstrably better products. Defending that position on price costs concessions which reset global expectations and reach every other market through customer benchmarking within months. The honest choices are competing only where domestic capability genuinely falls short, or accepting a smaller and more profitable Chinese business, and most international suppliers have chosen neither and are drifting toward the worse outcome.

Engagement Snapshot From the Field

A live engagement with an industry participant carrying material or product regulatory and market exposure ahead of a defining policy shift, showing how our research translates into a defensible multi-year portfolio strategy.
MARKET MINDS ADVISORY · CLIENT ENGAGEMENT SUMMARY
Industrial Automation Producer Strategic Portfolio Review and Transition Roadmap 2026·Investment Scenario on Industrial Automation Exposure Evaluation 2025-26
CLIENT PROFILE
A European automation manufacturer with roughly USD 640 million in annual revenue engaged MMA after order intake grew strongly while revenue recognition stalled and customer satisfaction fell (client-reported, unverified by MMA). The company had won more projects than it had ever won before and was delivering them later than it ever had, and the two facts had not been connected internally.
STRATEGIC CHALLENGE
Sales wanted more territory coverage to convert a strong pipeline. Operations wanted manufacturing capacity investment to shorten equipment lead times. Nobody had measured where project time was actually being consumed between order and commissioning. The board needed a position before approving a capacity programme that could not easily be reversed later.
MMA APPROACH
MMA traced thirty completed projects from order to sign-off, measuring elapsed time and cost at each stage rather than accepting the reported schedule. We surveyed 50 partner integrators on their capacity, backlog, and what limits their throughput. We then modelled three routes: sales territory expansion, manufacturing capacity investment, and an integration enablement programme.
KEY FINDINGS
  1. Equipment lead time accounted for a minor share of elapsed project duration, while integration engineering and commissioning consumed most of it (client-reported, unverified by MMA).
  2. Partner integrators reported turning away work for lack of engineers, and several were quoting start dates many months beyond the client's equipment availability.
  3. Projects using the client's pre-engineered cell configurations completed substantially faster than bespoke ones, and nobody inside the company had ever tracked that difference at all.
  4. Manufacturing capacity investment modelled worst of the three routes, because equipment lead time was never the binding constraint on any project measured.
CLIENT PROFILE
A European automation manufacturer with roughly USD 640 million in annual revenue engaged MMA after order intake grew strongly while revenue recognition stalled and customer satisfaction fell (client-reported, unverified by MMA). The company had won more projects than it had ever won before and was delivering them later than it ever had, and the two facts had not been connected internally.
STRATEGIC CHALLENGE
Sales wanted more territory coverage to convert a strong pipeline. Operations wanted manufacturing capacity investment to shorten equipment lead times. Nobody had measured where project time was actually being consumed between order and commissioning. The board needed a position before approving a capacity programme that could not easily be reversed later.
MMA APPROACH
MMA traced thirty completed projects from order to sign-off, measuring elapsed time and cost at each stage rather than accepting the reported schedule. We surveyed 50 partner integrators on their capacity, backlog, and what limits their throughput. We then modelled three routes: sales territory expansion, manufacturing capacity investment, and an integration enablement programme.
KEY FINDINGS
  1. Equipment lead time accounted for a minor share of elapsed project duration, while integration engineering and commissioning consumed most of it (client-reported, unverified by MMA).
  2. Partner integrators reported turning away work for lack of engineers, and several were quoting start dates many months beyond the client's equipment availability.
  3. Projects using the client's pre-engineered cell configurations completed substantially faster than bespoke ones, and nobody inside the company had ever tracked that difference at all.
  4. Manufacturing capacity investment modelled worst of the three routes, because equipment lead time was never the binding constraint on any project measured.
RECOMMENDED STRATEGY
Phase 1: Phase 1 (0 to 9 months): Halt the manufacturing capacity proposal and substantially expand the library of pre-engineered cell configurations. Phase 2: Phase 2 (9 to 24 months): Fund integrator engineer training and certification with committed places rather than open invitations to attend. Phase 3: Phase 3 (24 to 42 months): Expand sales territory only once integrator capacity can absorb the additional order intake generated.
OUTCOME
The board deferred the capacity investment and funded configuration and training work, which operations resisted and the chief executive supported. Project duration on configured cells fell materially and integrator partners took on additional engineers under the training programme (client-reported, unverified by MMA). Territory expansion remains scheduled behind the delivery work rather than ahead of it.

Frequently Asked Questions

Foundational context covering the market sizes, CAGR, scope, country, region and competition that inform every finding below. This section is provided to cover basics and most often pre-purchase conversations, answered from the MMA Primary Research Dataset.

What is the current size of the Industrial Automation Market?

The global market is valued at USD 196.4 billion in 2025, covering robots, machine vision, motion control, programmable controllers, networking, and safety systems in discrete and hybrid manufacturing. Continuous process control architectures are excluded.

How large will the Industrial Automation Market be by 2036?

The market is forecast to reach USD 467.29 billion by 2036 in the base case, about 2.20 times the 2026 level. That represents incremental value of roughly USD 254.79 billion.

What is the CAGR for the Industrial Automation Market 2026 to 2036?

The market grows at an 8.2% CAGR in the base case, with bull and bear scenarios at 9.5% and 6.9%. Integrator capacity constrains both scenarios more than manufacturing capacity does.

Which segment is growing fastest?

Machine vision and inspection systems grow fastest at 13.6%, about 1.66 times the overall rate, because vision removes the input consistency precondition. Industrial robots follow at 9.8%.

Who are the major companies in the Industrial Automation Market?

Leading participants include Siemens, ABB, Fanuc, Rockwell Automation, and Mitsubishi Electric. Concentration is low at roughly 33% and still falling as Chinese domestic manufacturers take their own market.

Which country is growing fastest?

India grows fastest at a 12.4% CAGR, driven by production incentive schemes and supply chain diversification against very low current automation density. China follows on installation volume.

Report Segmentation Architecture

The full report scope spans multiple orthogonal segmentation dimensions, with cross-tabulated demand data provided for each dimension pair. Coverage extends further to regional breakdowns, trend trajectories, and the competitive detail needed to support segment-level decision-making.

By Automation Layer

  • Machine Vision and Inspection Systems
  • Industrial Robots and Manipulators
  • Industrial Networking and Safety Systems
  • Motion Control and Servo Drives
  • Programmable Controllers and Industrial PCs

By End-Use Industry

  • Automotive and Component Manufacturing
  • Electronics and Semiconductor Assembly
  • Food Beverage and Consumer Goods
  • Logistics and Warehouse Handling
  • Metals Plastics and General Manufacturing

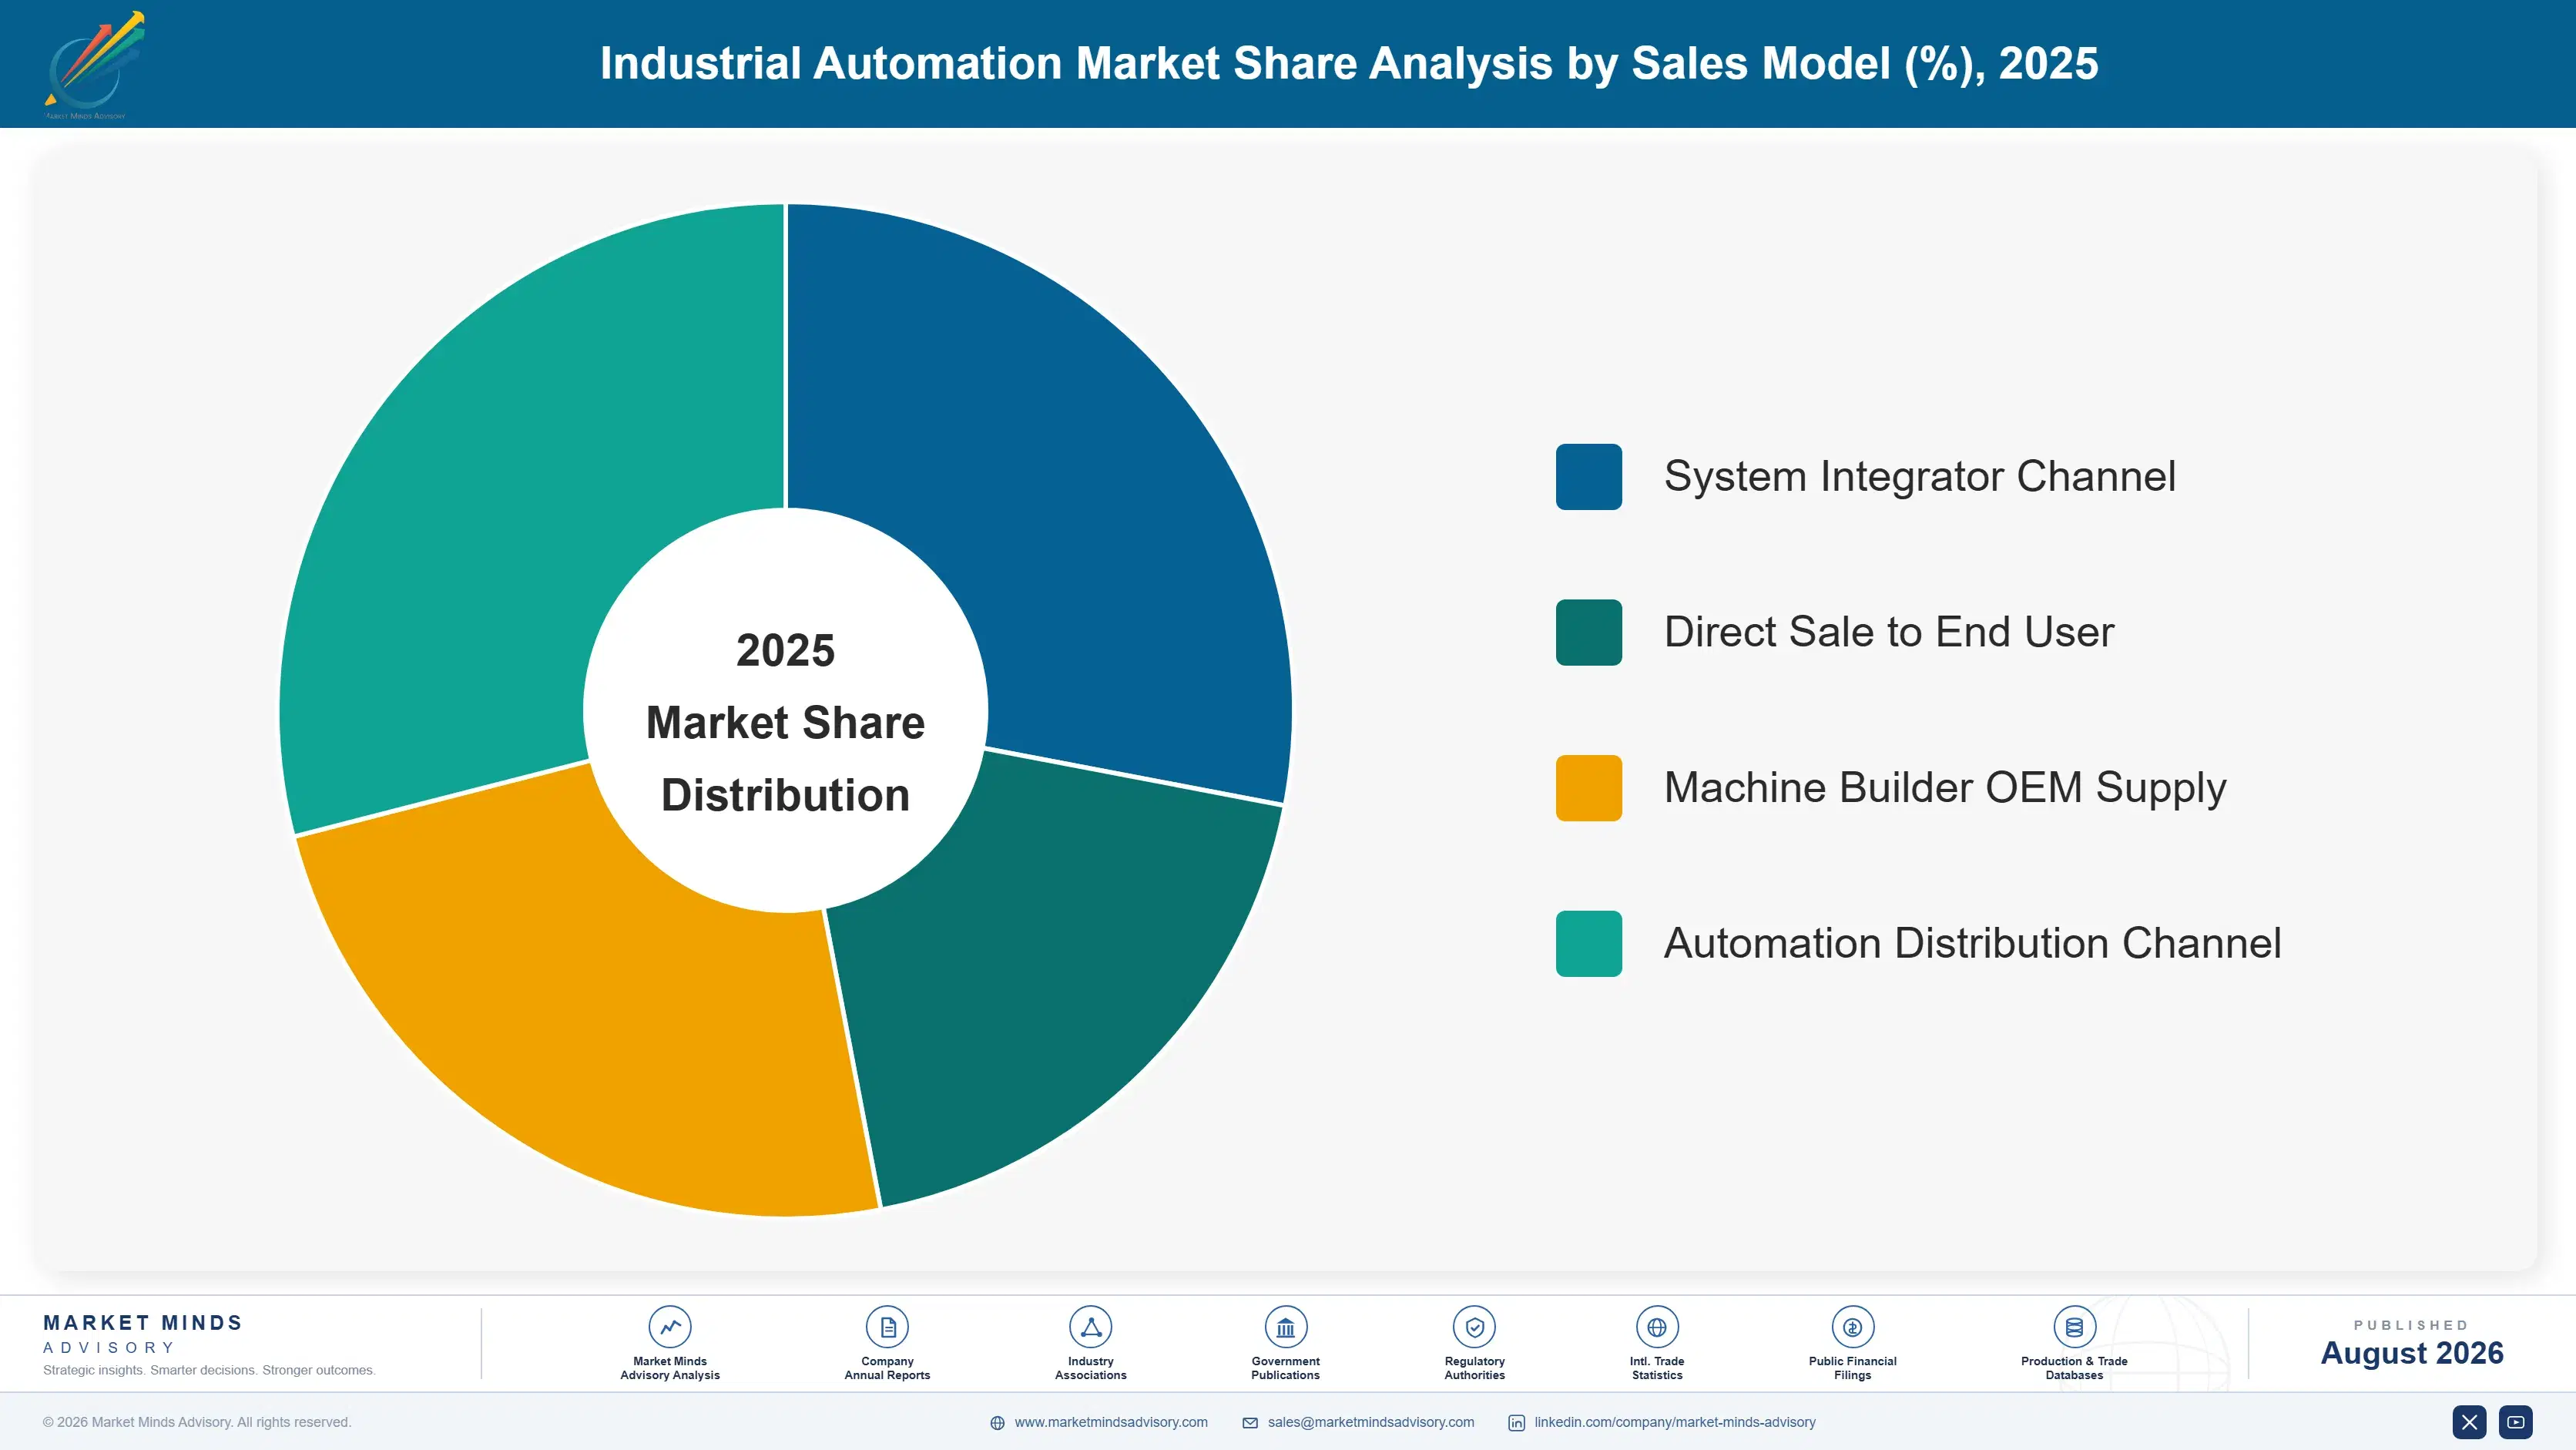
By Sales Model

  • System Integrator Channel
  • Direct Sale to End User
  • Machine Builder OEM Supply
  • Automation Distribution Channel

By Region

  • East Asia
  • South Asia and Pacific
  • North America
  • Western Europe
  • Eastern Europe
  • Latin America
  • Middle East and Africa

Scope, Methodology, and Coverage

Every figure in this report is reproducible from documented input assumptions. The scope below maps the historical period, the forecast horizon, the segmentation dimensions, and the countries covered, alongside the underlying primary and qualitative methodology.
Historical Period
2020 to 2025
Forecast Period
2026 to 2036
Base Year
2025 (USD billions; MMA Primary Research Dataset, August 2026)
Market Definition
The industrial automation market comprises the supply of equipment and software that controls and executes discrete and hybrid manufacturing operations, valued at manufacturer selling prices to system integrators, machine builders, end users, and automation distributors. It spans articulated, collaborative, delta, and cartesian industrial robots and their controllers, machine vision cameras, smart sensors, inspection systems and perception software, servo motors, drives and motion controllers, programmable logic and automation controllers, industrial computing and human machine interfaces, industrial networking hardware and machine safety systems including light curtains, safety controllers and interlocks, together with the engineering software and application libraries supplied around them. Continuous and batch process control architectures including distributed control systems, safety instrumented systems, process supervisory control and advanced process control software, field instrumentation and analytical devices, machine tools and metal forming equipment, electrical distribution and switchgear, warehouse racking and conveyor structures, and enterprise resource and manufacturing execution software are excluded. System integration and commissioning services performed by third parties sit outside scope.
Quantitative Units
USD billions (current prices); volume in thousands of robot and controller units shipped
Segmentation Dimensions
By Automation Layer; By End-Use Industry; By Sales Model; By Region
Regions Covered
East Asia, South Asia and Pacific, North America, Western Europe, Eastern Europe, Latin America, Middle East and Africa
Countries Covered
China, Japan, South Korea, Taiwan, India, USA, Canada, Mexico, Germany, Italy, France, Spain, Netherlands, Sweden, Switzerland, Austria, UK, Poland, Czechia, Slovakia, Hungary, Romania, Brazil, Argentina, Chile, Colombia, Turkey, Saudi Arabia, United Arab Emirates, South Africa, Australia, Singapore, Thailand, Vietnam, Malaysia, Indonesia, and additional markets relevant to this sector
Key Companies Profiled
Siemens, ABB, Fanuc, Rockwell Automation, Mitsubishi Electric, Yaskawa, KUKA, Schneider Electric, Omron, Keyence, Cognex, Bosch Rexroth, Beckhoff Automation, Estun Automation, Inovance Technology, SMC Corporation, Festo, Universal Robots, Kawasaki Heavy Industries, Denso Wave
Quantitative Methodology
Primary survey, n=3,800 respondents, Q4 2025, six countries; demand-side model with trade association cross-validation
Qualitative Methodology
47 expert interviews, Q4 2025; applied to validate demand model assumptions, identify emerging dynamics, and assess competitive positioning
Report Format
PDF and XLSX data workbook (Word format preview document)
Publisher
Market Minds Advisory
Report Code
MMA-2026-TEC-547
Published
August 2026
Contact
sales@marketmindsadvisory.com | www.marketmindsadvisory.com

Purchase the full Industrial Automation Market Report (2026 to 2036).

The full MMA Industrial Automation report sizes the market across five automation layers, five end-use industries, four sales models, and seven regions through 2036. It profiles 20 participants on a consistent basis of discrete and hybrid automation revenue, scoring each on integrator reach, application engineering depth, perception capability, and Chinese market position. Scenario models quantify how labour availability, reshoring investment, and integrator capacity move both volume and achievable margin. The report also includes robot installation density benchmarking by country, Chinese domestic share tracking by segment, integrator capacity assessment by region, and project overrun analysis across application types.
Five-layer and four-channel market sizing to 2036
Twenty-participant benchmark on discrete automation revenue
Robot installation density benchmarking by country and industry
Chinese domestic share tracking by automation segment
System integrator capacity assessment across major regions
Project overrun analysis across application and industry types

Built For The People Who Decide

From boardroom strategy to bench-side execution, this report is read cover-to-cover by leaders shaping the next decade of their industry, turning demand scenarios, market dynamics and valuation benchmarks into decisions.
CXOs/ Presidents/ VPs/ Managers
M&A and Corporate Development
Strategy Teams and R&D Heads
Procurement and Product Directors
Regulatory and Compliance Leaders
Investor Relations and Equity Analysts