Market Minds Advisory
Automated and Closed Cell Therapy Processing Systems Market

Automated and Closed Cell Therapy Processing Systems Market: Solving the Manufacturing Bottleneck

Cell therapy manufacturers are racing to replace manual, open cleanroom processing with automated closed systems as approvals multiply faster than operator training can scale, forcing suppliers to prove chain-of-identity reliability across thousands of patient-specific batches.

Lead Analyst

Alice Ballenger

Published

September 2026

Make Smarter Decisions with Customized Research Insights

Request a free sample report and evaluate market opportunities, growth trends, and competitive dynamics relevant to your business needs.

2025 MARKET VALUE$3.1BMarket Size 2025
2036 FORECAST VALUE$17.4BBase Case , 2026 to 2036
CAGR 2026 TO 203617.0 %Bull 18.3% / Bear 15.7%
INCREMENTAL OPPORTUNITY$13.8BNet 10- year value creation
EXPANSION MULTIPLE4.81x2036 value over 2026 base
Strategic Levers
M&A Pipeline
Regional Outlook
Country Rankings
Competitive Intelligence
Segmental Deep-dive
Call-Us : 91 93563 13602

Executive Snapshot and Market Trajectory

Cell therapy manufacturing is hitting a scaling wall that automation, not new biology, is what actually solves: every commercial approval multiplies patient-specific batch volume faster than manual cleanroom operators can be trained, and closed automated systems are becoming the only realistic path to meeting demand without sacrificing chain-of-identity integrity.
Process automation and digital orchestration software are growing fastest at roughly 1.24 times the market average as manufacturers seek to track and control patient-specific batches without adding proportional headcount, while cell expansion bioreactors follow closely on commercial-scale manufacturing capacity constraints. North America holds the largest share of spending because the United States concentrates the deepest cell therapy approval base and manufacturing investment, and its suppliers set the technical standards the rest of the industry follows.
Five suppliers, Cytiva, Terumo BCT, Miltenyi Biotec, Sartorius, and Thermo Fisher, hold well over half of global revenue in a market concentrated enough that qualification history matters as much as technical specifications. Chain-of-identity and chain-of-custody regulatory requirements are reshaping which processing platforms cell therapy developers specify, favoring suppliers with proven closed-system track records over open manual processing that regulators view as a contamination and mix-up risk few commercial programs can tolerate.
Market Definition
The automated and closed cell therapy processing systems market covers cell selection and enrichment systems, activation and transduction systems, cell expansion bioreactors, cell washing and volume reduction systems, fill-finish and cryopreservation systems, and process automation and digital orchestration software used in autologous and allogeneic cell therapy manufacturing. It excludes finished cell therapy products, gene editing reagents, and conventional open manual cell processing equipment.
Base Year Value
$3.1B in 2025 (MMA Primary Research Dataset, August 2026)
Forecast Period
2026 to 2036, eleven discrete annual values
CAGR
17.0% base case. Bull 18.3%. Bear 15.7%.
Fastest Growth Segment
Process Automation and Digital Orchestration Software: 21.0% CAGR
Fastest Growth Country
China: 19.5% CAGR
Fastest Growth Region
South Asia and Pacific: 19.0% CAGR
Largest Region
North America: 32% of 2025 global value
Market Leaders
Cytiva, Terumo BCT, Miltenyi Biotec, Sartorius, Thermo Fisher. Source: MMA Analysis based on company annual reports.
Primary Survey
n=3,800 procurement and R&D decision-makers, Q4 2025, six countries
Methodology
Demand-side build-up, cross-validated against public data, 47 expert interviews

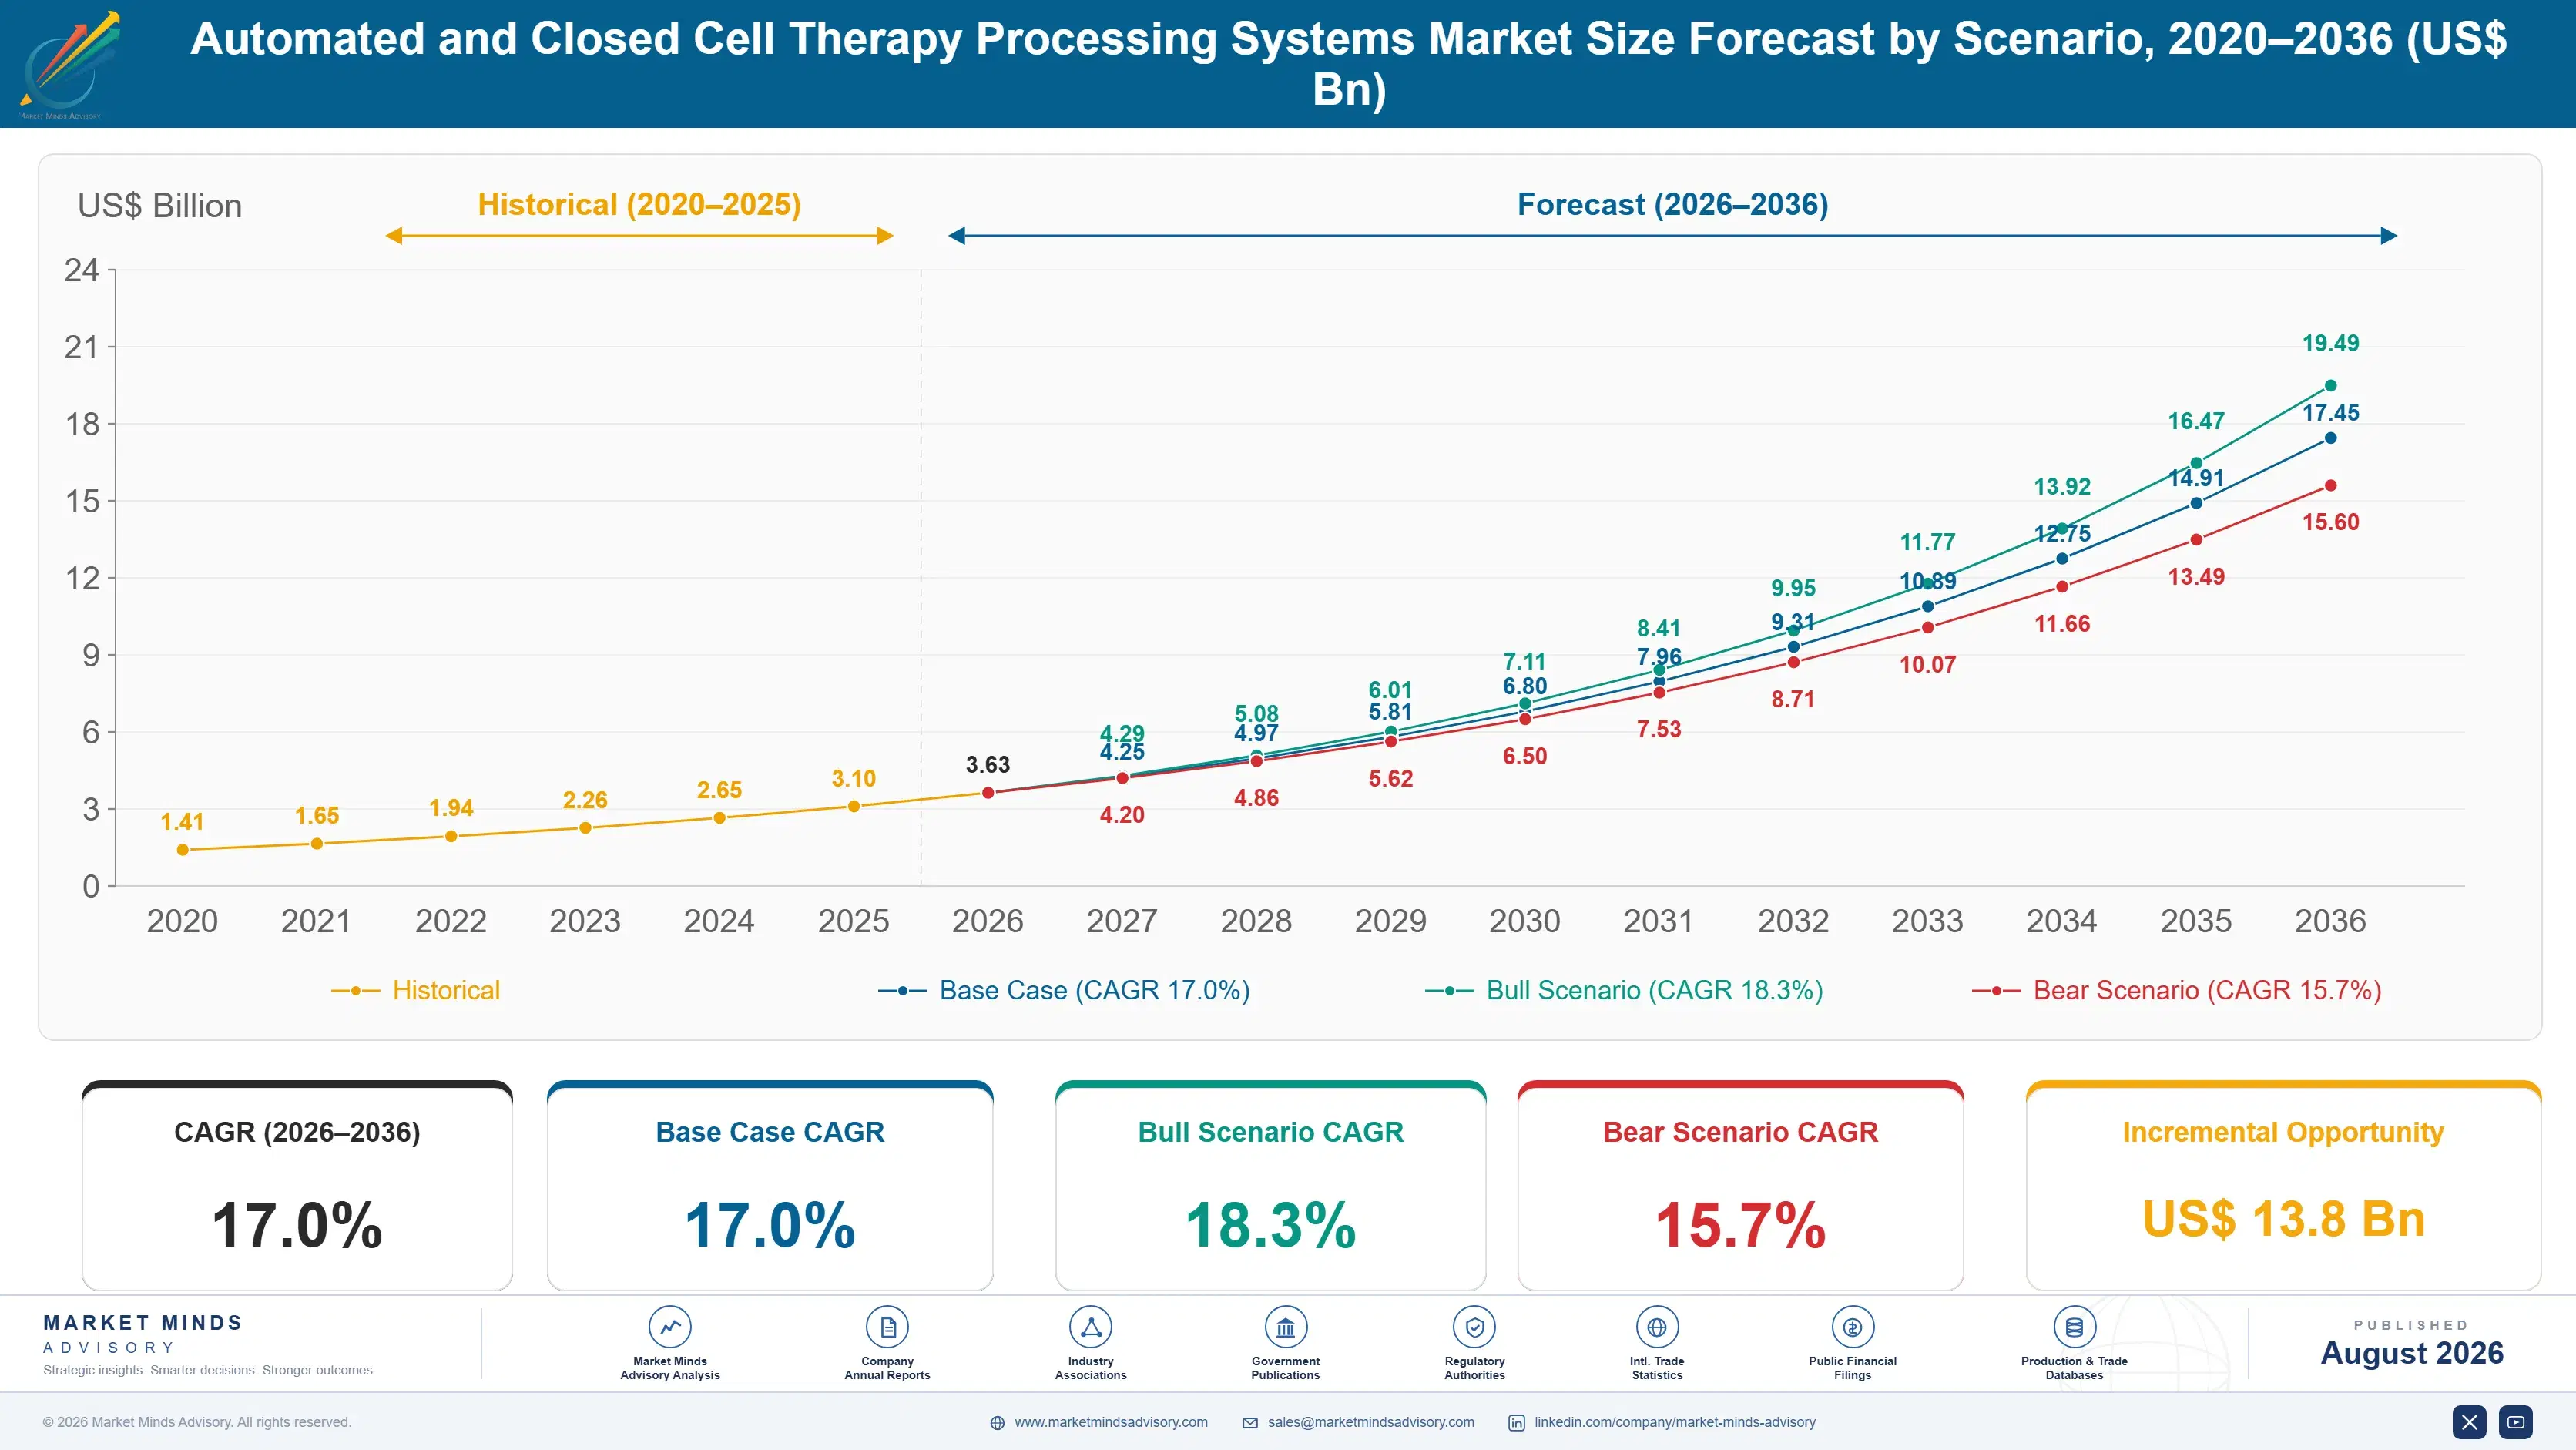
Automated and Closed Cell Therapy Processing Systems Market Forecast Scenarios

automated-and-closed-cell-therapy-processing-syste-size-forecast-scenario-1787300940771
The market grew from a small base through the early 2020s as the first CAR-T therapies reached commercial approval, then accelerated sharply from 2023 as approvals multiplied manufacturing volume across more developers simultaneously. Manual processing capacity became a genuine bottleneck during this period, pushing developers toward automated closed systems. The result was a 16.0 percent historical CAGR, still accelerating as approvals continue expanding.
The base case rests on three mechanisms. First, each new commercial approval multiplies manufacturing batch volume that automated systems, not additional operators, must absorb given the severe shortage of qualified cleanroom cell processing technicians industry-wide. Second, regulators favor closed-system processing over open manual processing given the chain-of-identity and contamination risks unique to patient-specific autologous therapies. Third, allogeneic cell therapy programs are beginning to reach commercial scale, requiring the larger-batch bioreactor and automation capacity closed systems are positioned to provide.
The bull case turns on accelerating allogeneic commercialization if additional programs beyond current leaders reach approval this decade, pulling automated processing demand above current forecasts as manufacturing shifts toward larger, less patient-specific batches. The bear case centers on slower-than-expected cell therapy adoption that delays capacity expansion decisions, extending the working life of existing manual and semi-automated processing infrastructure.

Automation Becomes the Real Manufacturing Bottleneck

Automated and closed cell therapy processing systems sit at the intersection of two forces: commercial approvals multiplying manufacturing volume faster than skilled cleanroom operators can be trained, and regulators tightening chain-of-identity requirements that make automation a compliance necessity rather than an efficiency upgrade. Both forces push developers toward closed platforms that reduce contamination and mix-up risk, rather than toward the cheaper open manual processing that built th
CR5 CONCENTRATION58%Top five suppliers hold well over half of revenue
AVERAGE SYSTEM VALUE$1.8 million per closed platformEnterprise platform deals dwarf individual standalone component purchases
TOP PRODUCING COUNTRY SHARE29%United States leads global cell therapy equipment manufacturing
CLOSED SYSTEM PENETRATION34% of new manufacturing linesAutomated platforms increasingly replace manual open processing steps
TRADE INTENSITY23% of output exportedCross-border platform and component shipments rise with demand
INPUT COST SHARE40% of COGSSingle-use consumables and sensor components dominate production costs
Commercially, the market behaves like an enterprise software and equipment relationship more than a component sale. Cytiva and Miltenyi Biotec both increasingly sell complete platform packages bundling hardware, single-use consumables, and orchestration software rather than standalone instruments, since cell therapy manufacturers need an integrated validated system rather than components to assemble independently. Smaller specialized providers compete on specific process step innovations within the broader manufacturing workflow that larger suppliers have not yet addressed.
Over the next decade, process automation software and expansion bioreactors will keep growing faster than conventional selection and washing systems, and suppliers without proven closed-system platforms will increasingly lose specification battles to those that have already validated chain-of-identity performance with major cell therapy developers.
"The bottleneck in cell therapy was never the biology, it was always going to be the cleanroom. Whoever solves manufacturing throughput without sacrificing chain-of-identity wins the next five years of this market."
Director, Cell and Gene Therapy Manufacturing Practice · MMA Healthcare | Cell a

Market Trends

Commercial Approvals Multiply Manufacturing Volume Rapidly

Cell therapy commercial approvals have expanded since the first CAR-T therapies reached market, with each new approval adding manufacturing volume that must be absorbed by a cleanroom operator workforce that cannot scale at the same pace given the specialized training required. Manufacturers report that operator availability, not equipment cost, is the binding constraint on manufacturing capacity expansion, since qualified cell processing technicians require months of specialized training before they can independently run manual processing steps. Cytiva and Miltenyi Biotec both report accelerating demand for automated platforms framed by customers as a workforce constraint solution rather than a pure cost-efficiency upgrade.
Market Impact: Adds 20 percent allogeneic platform demand
Chain-of-Identity Requirements Increasingly Favor Closed-System Processing

Autologous cell therapy manufacturing requires maintaining strict chain-of-identity between a specific patient's starting material and their final infused product, and open manual processing steps create meaningful opportunity for sample mix-up or contamination that closed automated systems substantially reduce through integrated tracking and reduced manual handling. Regulators have increasingly signaled preference for closed-system processing in guidance documents and inspection findings, treating open processing as a risk factor requiring additional mitigation rather than an acceptable default approach. Terumo BCT and Sartorius both report closed-system platform orders growing considerably faster than open or semi-automated equipment across every major cell therapy manufacturing region.
Market Impact: Cuts required operator headcount 30 percent

Market Opportunities and Growth Drivers

Allogeneic Cell Therapy Programs Approach Commercial Scale

Allogeneic, or off-the-shelf, cell therapy programs are increasingly approaching commercial scale, requiring manufacturing platforms that can produce far larger batches serving many patients rather than the single-patient batches autologous therapy manufacturing has traditionally required. This shift favors automated bioreactor and expansion systems engineered for larger-scale production, a meaningfully different technical requirement than the smaller-scale automation autologous manufacturing has relied upon to date. Equipment suppliers report allogeneic-focused platform orders growing from a small base but accelerating meaningfully as more programs advance through clinical development toward anticipated commercial approval within the forecast period.
Market Impact: Adds 25 percent capital cost

Cleanroom Operator Shortage Makes Automation Essential

The specialized cleanroom cell processing technician workforce has not scaled at the same pace as commercial cell therapy demand, creating a genuine talent shortage that manufacturers increasingly cite as their primary capacity expansion constraint rather than equipment or facility availability. Training a qualified cell processing technician typically takes considerably longer than training staff for many other manufacturing roles, given the technical complexity and regulatory stakes involved in handling patient-specific biological material. Automated closed systems reduce the number of highly trained operators a given manufacturing volume requires, directly addressing this workforce constraint rather than simply improving process efficiency at the margin.
Market Impact: Delays platform adoption 14 months

Market Restraints and Challenges

High Capital Cost Slows Smaller Manufacturer Adoption

Fully automated closed processing platforms carry substantial upfront capital cost that smaller cell therapy developers and academic medical center manufacturing programs often cannot easily justify relative to their current, smaller manufacturing volumes. The root cause is that automation technology development cost gets spread across a still-limited installed base compared with more mature manufacturing equipment categories, keeping per-unit pricing elevated until volume scales further industry-wide. Some suppliers are addressing this by offering leasing and pay-per-batch commercial models that lower the upfront capital barrier, letting smaller developers access automated technology without the full capital outlay outright purchase would require.
Market Impact: Lifts automated platform orders 28 percent

Validation Requirements Slow New Platform Adoption

Switching to a new automated processing platform requires regulatory validation to demonstrate the new process produces a comparable product to what clinical trials were conducted on, taking a year or more before a developer can use a new platform commercially. The root cause is that a manufacturing process change for an approved biological product requires regulators to confirm product comparability, since process changes can alter product characteristics that affect safety or efficacy in ways not always obvious. Suppliers are addressing this by offering comparability data packages and technical support during platform transitions, reducing the validation burden developers would otherwise face.
Market Impact: Lifts closed-system specification rate 24 percent
3 additional market trends, 3 additional growth drivers, and 3 additional restraints and challenges are covered in the full report. Contact sales@marketmindsadvisory.com to access the complete intelligence.

Segment CAGR and Growth Architecture

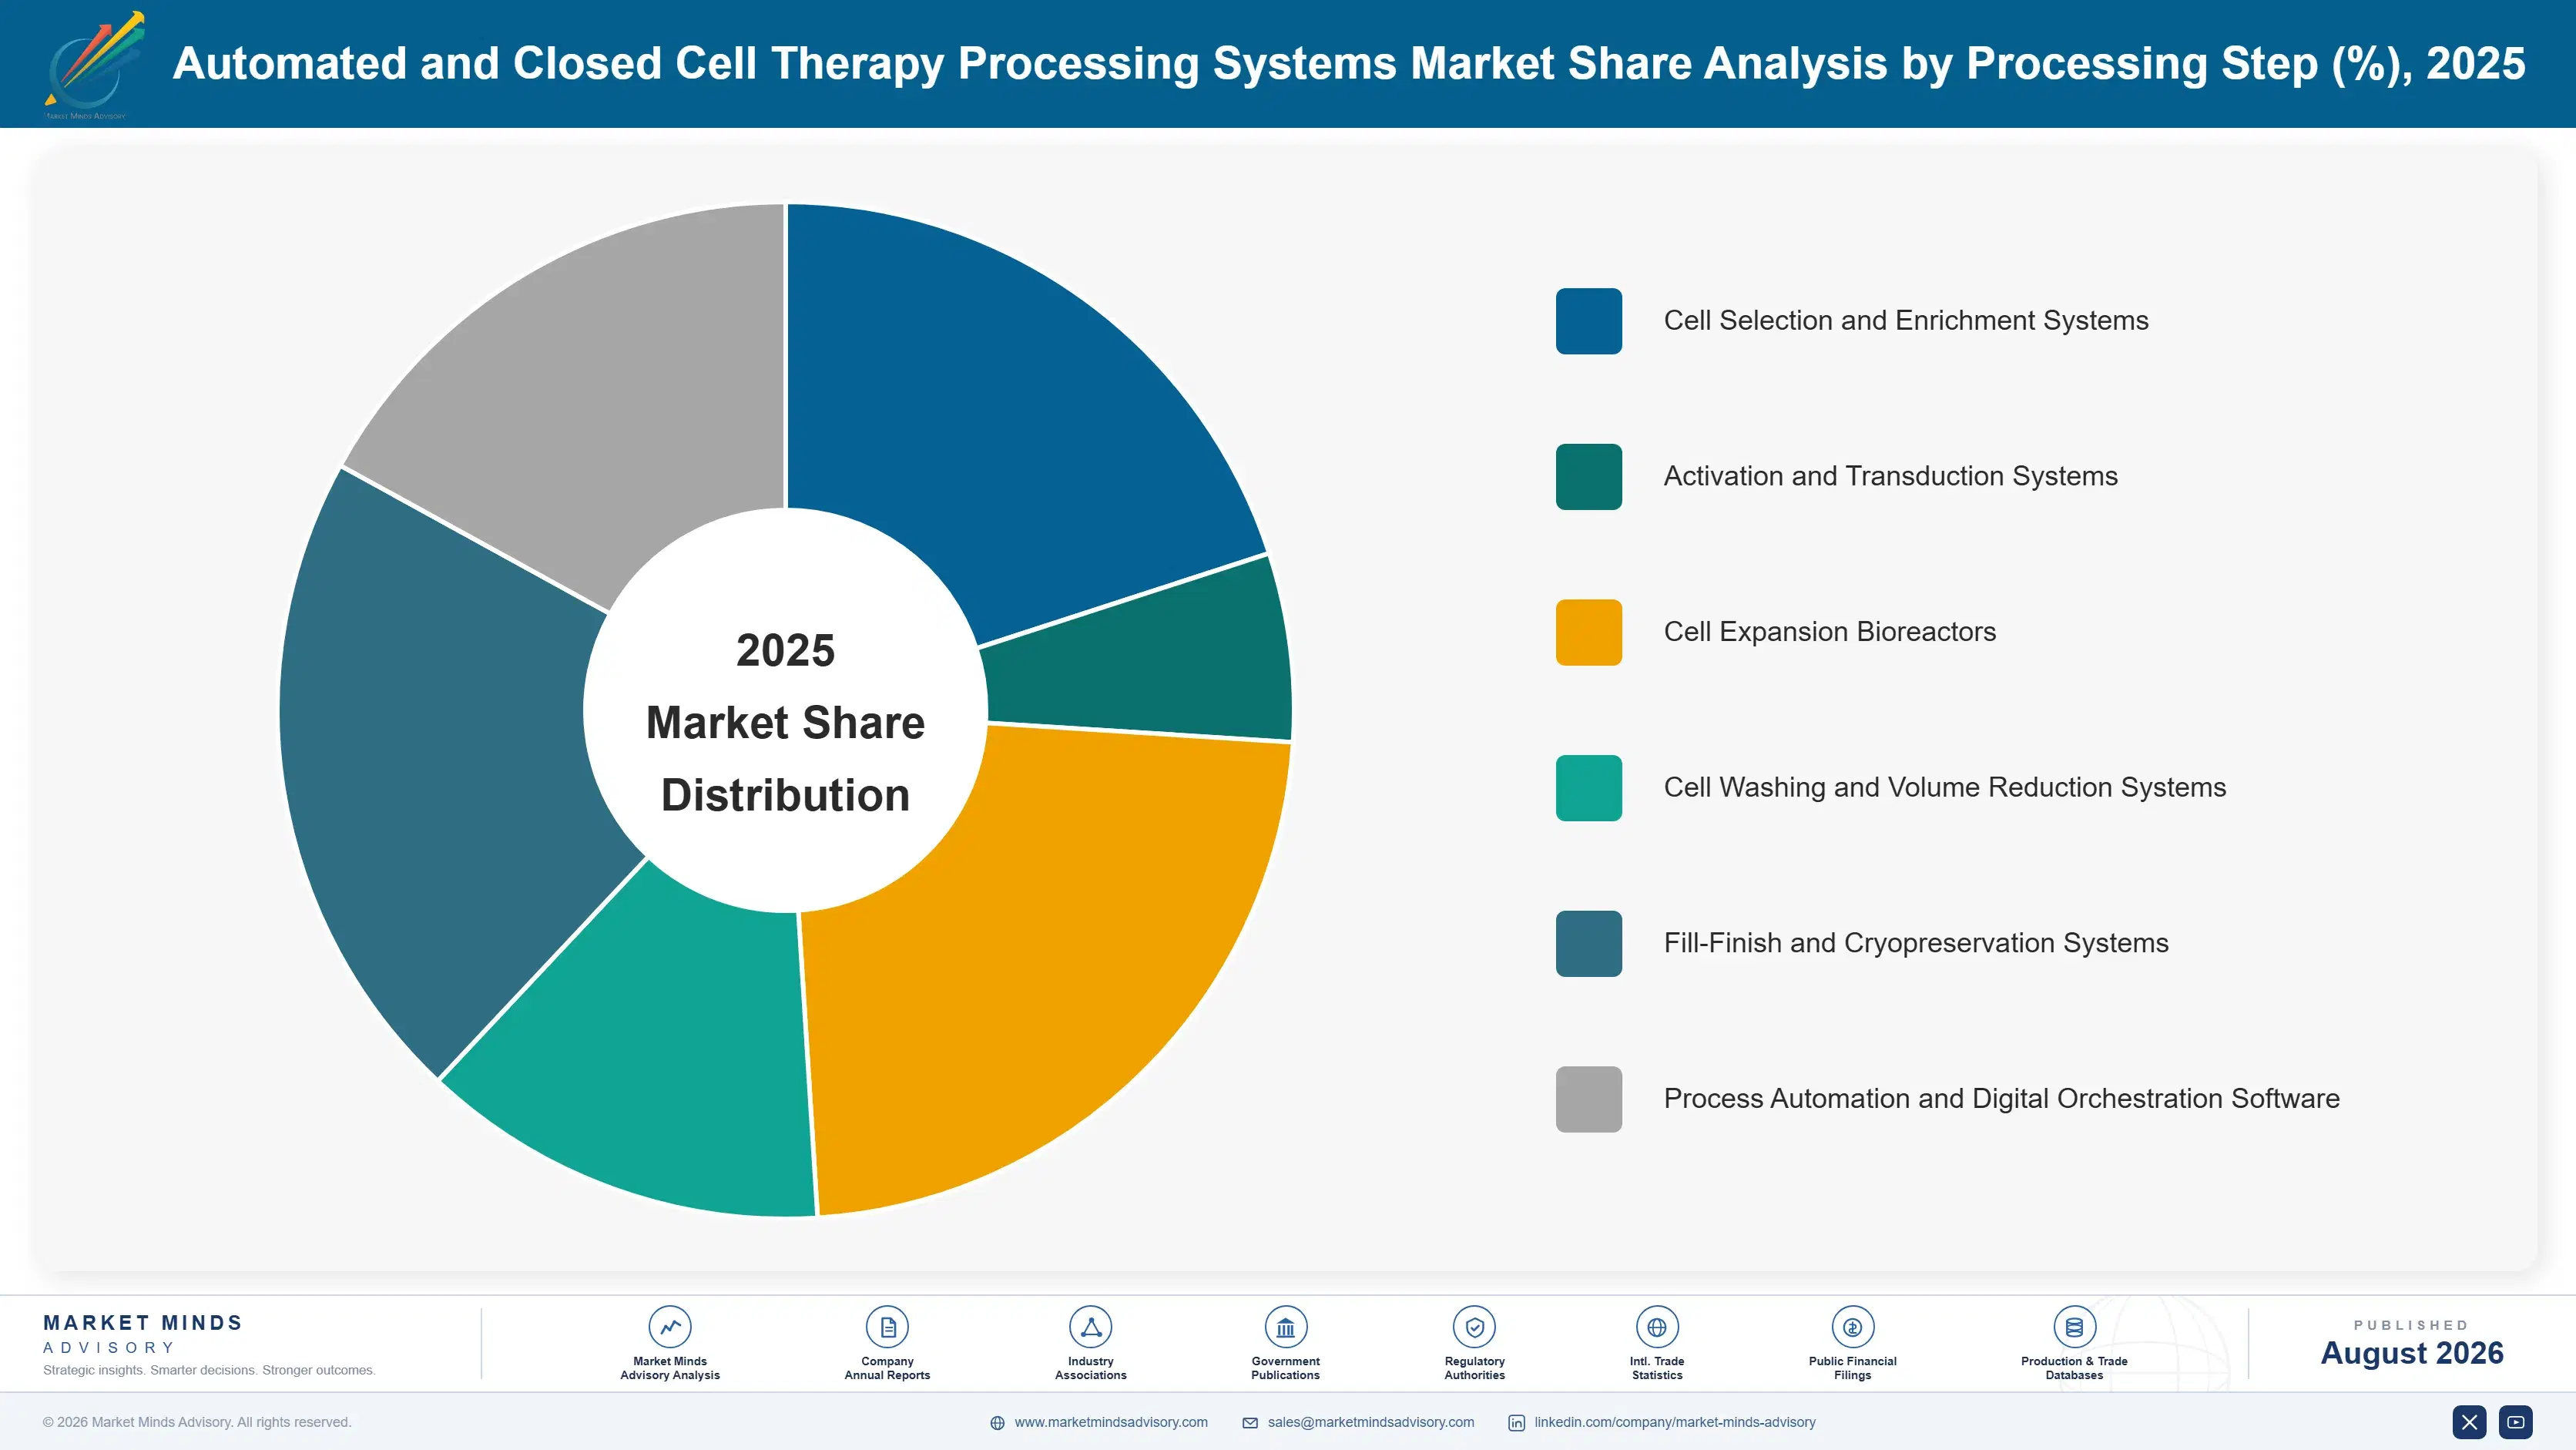
Segmentation follows processing step rather than end-use therapy type or manufacturing scale, since a single manufacturing process typically requires equipment across every category in sequence. Six categories span the manufacturing workflow from initial cell selection through expansion, formulation, and digital process control, reflecting how developers budget and validate each step as a distinct capital line.
automated-and-closed-cell-therapy-processing-syste-market-share-analysis-1787300941313

Process Automation and Digital Orchestration Software

Process automation and digital orchestration software is growing fastest as manufacturers seek to track and control patient-specific batches across complex multi-step processes without adding proportional headcount, a particularly attractive proposition given the severe cleanroom operator shortage constraining capacity expansion industry-wide. Cytiva and several specialized software providers lead deployments at commercial-scale manufacturing facilities, while smaller analytics specialists compete on niche applications like real-time chain-of-identity tracking and predictive quality control. This category carries meaningfully higher margins than physical equipment sales, since software deployment costs scale favorably once the underlying platform is built, and suppliers increasingly bundle orchestration software with hardware sales to capture recurring subscription revenue rather than one-time equipment purchases alone.
CAGR 21.0%

Cell Expansion Bioreactors

Cell expansion bioreactors are growing quickly as commercial-scale manufacturing requires larger, more consistent cell populations than the smaller-scale expansion systems clinical trial manufacturing historically used. Terumo BCT and Miltenyi Biotec both lead commercial-scale expansion bioreactor deployments, while smaller specialized providers compete on specific cell type applications like tumor-infiltrating lymphocyte expansion, which requires distinct technical approaches compared with CAR-T cell expansion. Allogeneic cell therapy programs approaching commercial scale are driving demand for meaningfully larger-batch bioreactor systems than autologous manufacturing has traditionally required, a genuinely new technical requirement reshaping supplier product roadmaps. Qualification cycles for expansion bioreactors run considerably longer than for simpler processing steps, creating durable technical relationships once a system is validated into a production process.
CAGR 19.0%
Full segment breakdown across 6 segments available in the complete report.

Regional Architecture and Country Demand Map

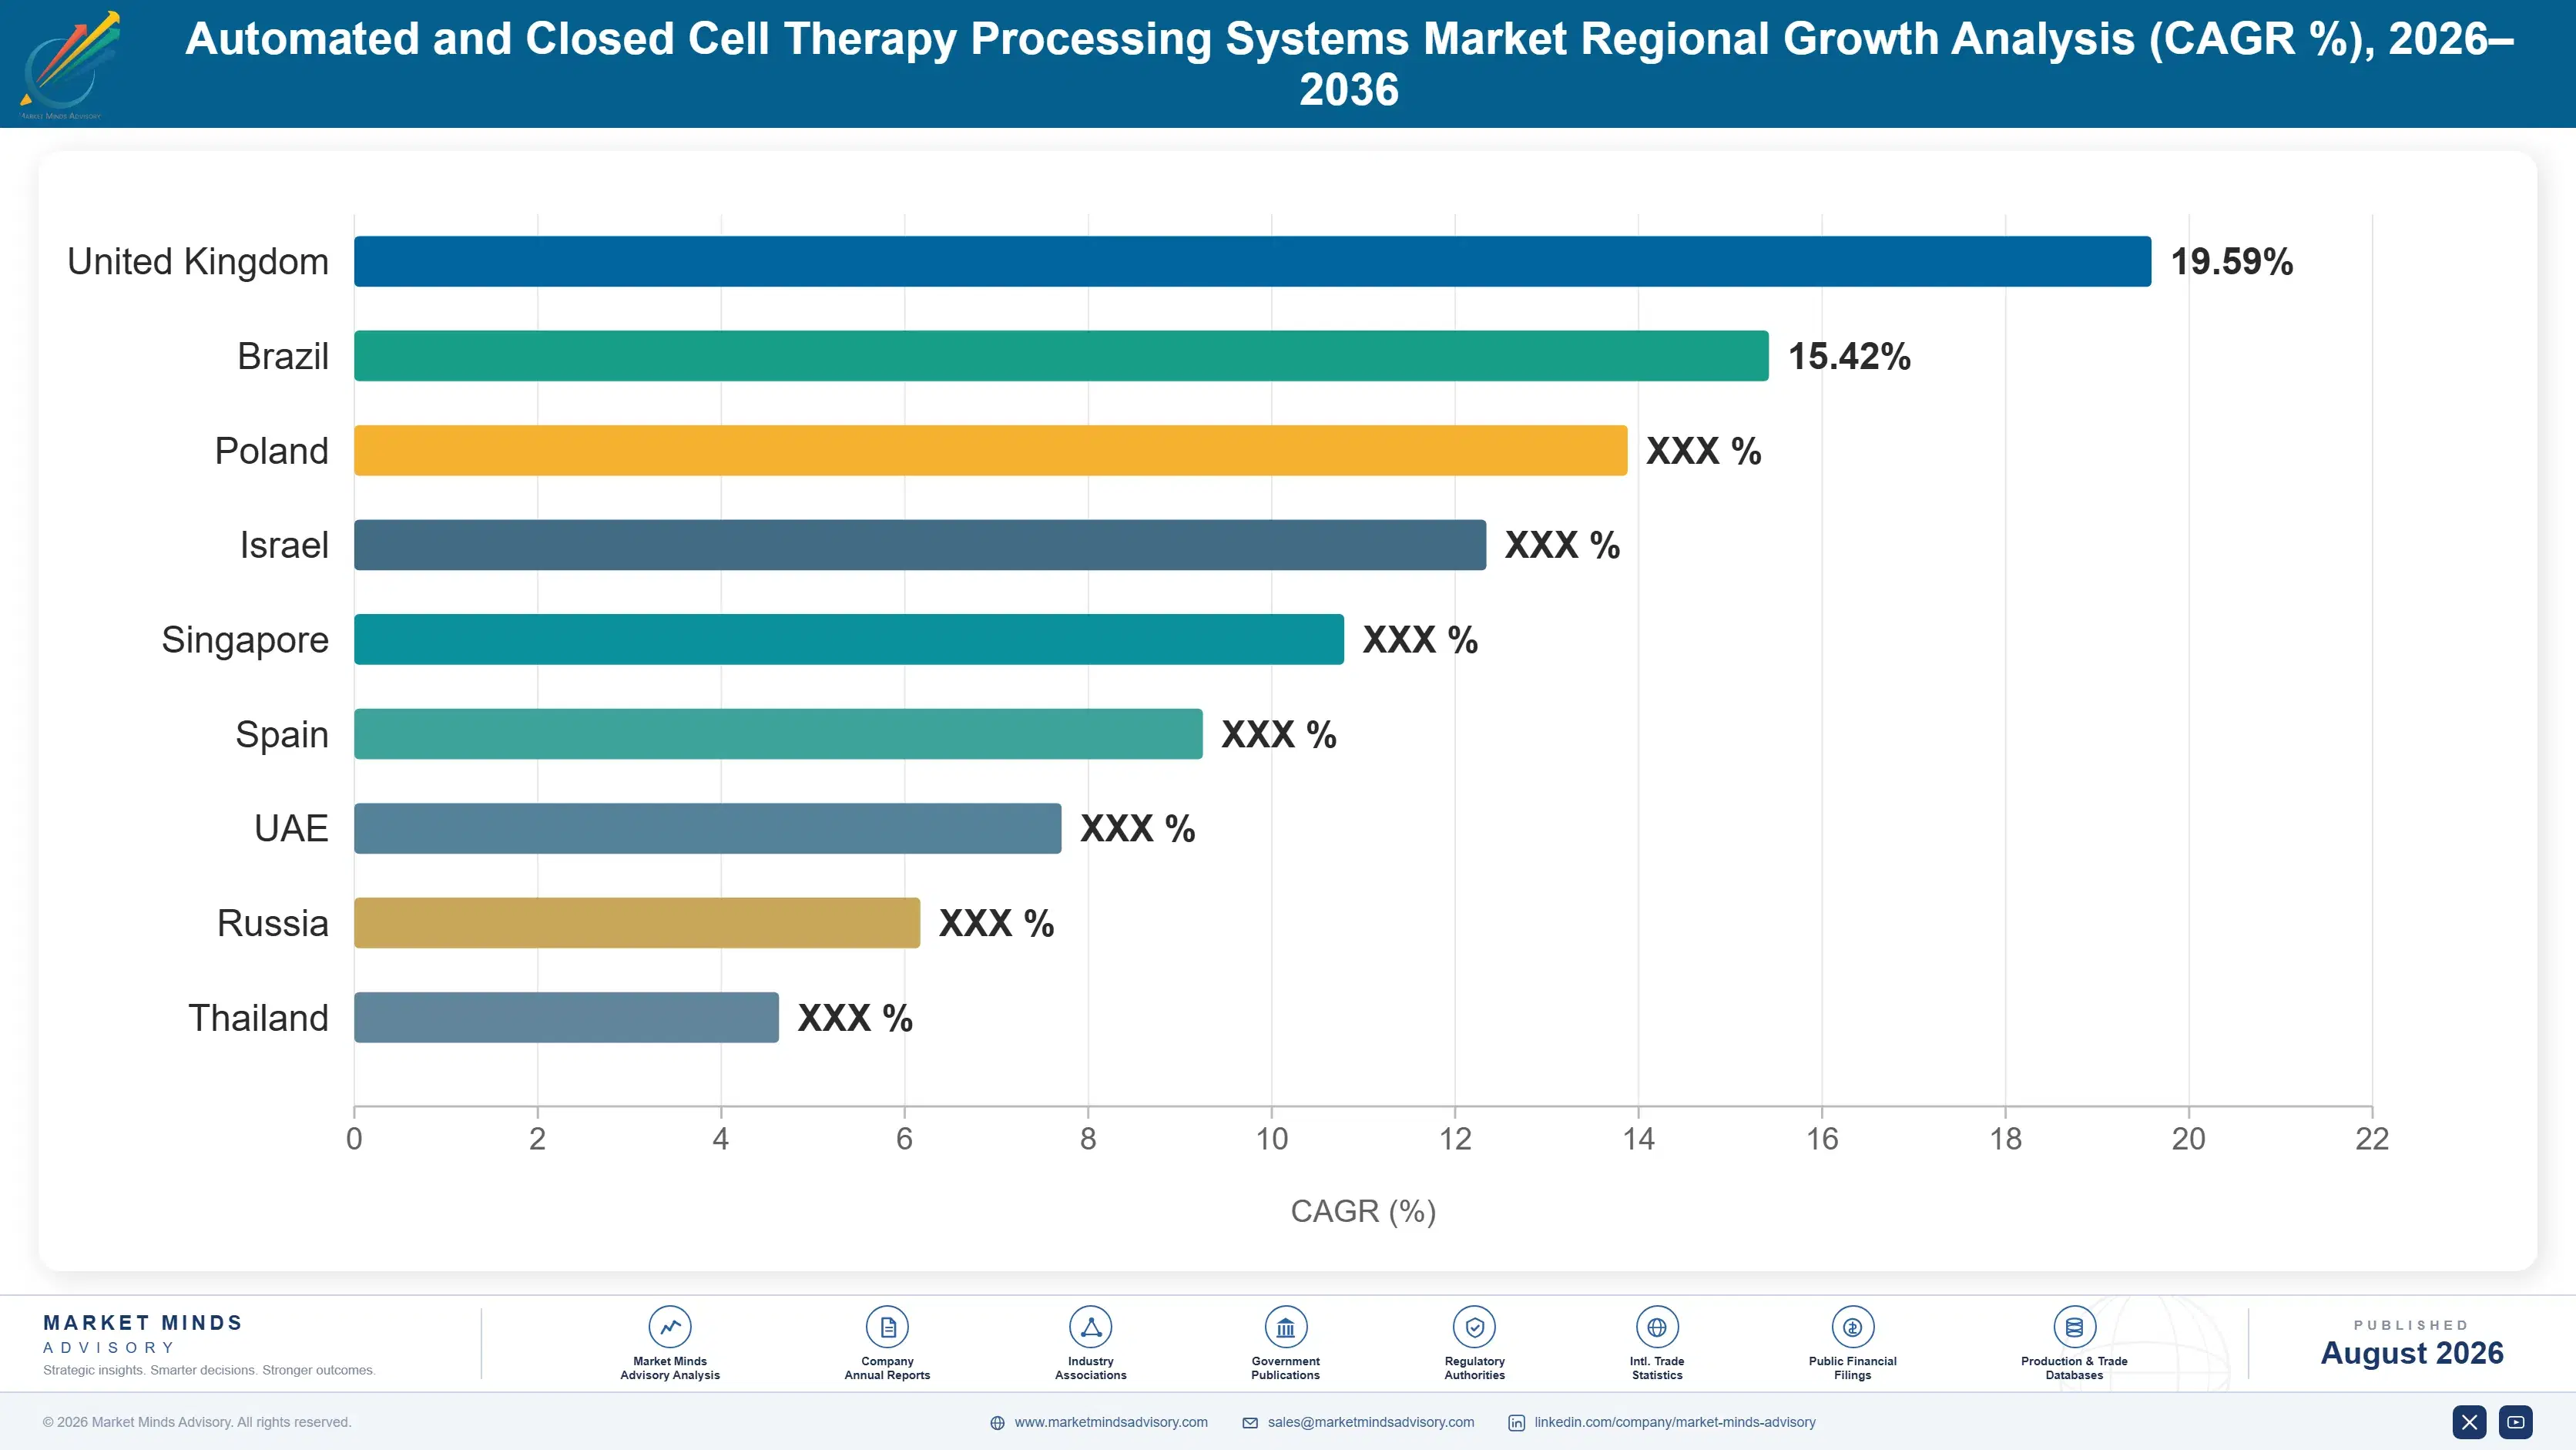
Demand concentrates where cell therapy commercial approvals and manufacturing investment are both deepest. North America leads on United States approval density and manufacturing capacity investment, East Asia gains share fastest on China's expanding domestic cell therapy approvals, while Western Europe sustains steady demand tied to established biopharma manufacturing infrastructure.

North America

United States cell therapy commercial approvals concentrate more manufacturing volume and capacity investment than any other country, anchored by developers including Kite Pharma, Bristol Myers Squibb, and Novartis all operating substantial cell therapy manufacturing networks domestically. Cytiva and Terumo BCT, both with significant United States manufacturing and technical service presence, are well positioned to capture this domestic demand growth as more commercial programs scale. The National Institutes of Health's sustained research funding continues generating the foundational science that commercial cell therapy programs build upon, a public research infrastructure few other countries can match at comparable scale. Canada's smaller but growing cell therapy manufacturing sector contributes a genuinely additive layer of regional demand.
Share: 32% | CAGR: 18.0% (2026 to 2036)

East Asia

China's cell therapy sector has expanded dramatically, with multiple domestically developed CAR-T therapies reaching commercial approval and driving substantial new manufacturing capacity investment across the country's biopharma sector. Domestic equipment suppliers are scaling rapidly to serve this demand, though many Chinese cell therapy developers still rely on imported automated platforms for the most technically demanding manufacturing steps where domestic alternatives have not yet matched Western supplier validation history. Japan and South Korea's more established pharmaceutical manufacturing sectors sustain steady demand tied to both domestic development and technology transfer partnerships with Western cell therapy developers. Singapore's biomanufacturing hub status is attracting cell therapy manufacturing investment from multinational developers, and Hong Kong's role as a regional financing hub adds further incremental momentum.
Share: 25% | CAGR: 18.2% (2026 to 2036)
Regional intelligence for 5 additional markets available in the complete report: Western Europe, South Asia and Pacific, Latin America, Middle East and Africa, Eastern Europe. Contact sales@marketmindsadvisory.com.
automated-and-closed-cell-therapy-processing-syste-country-cagr-analysis-1787300941943

Where Equipment Suppliers Can Grow Margin

Hardware sales alone will not sustain margins as closed-system platform technology matures and price competition intensifies across commodity processing components. The more durable path runs through orchestration software subscriptions, validation data services, and platform leasing models, each of which carries pricing power that standalone equipment sales increasingly lack in a maturing manufacturing technology market.

Bundling Orchestration Software With Platform Hardware Sales

Bundling process automation and digital orchestration software with closed processing platform hardware sales turns a one-time equipment purchase into a recurring subscription relationship that captures ongoing value from workflow optimization and chain-of-identity tracking delivered over the platform's operating life. Cytiva reports software-attached platform sales command an estimated 25 percent higher lifetime revenue than hardware-only sales, since customers pay recurring fees for continued access to orchestration algorithms and documentation support rather than a single upfront payment. This model deepens customer relationships, since switching away from a bundled platform requires replacing both hardware and accumulated process validation data built up over years.
Market Impact: Software-attached platform sales add 25 percent lifetime revenue

Offering Regulatory Validation Data Package Services

Cell therapy developers increasingly need help navigating the extensive regulatory comparability documentation required when adopting a new automated processing platform, creating demand for suppliers that can offer bundled validation data packages alongside their core equipment products. Suppliers with established regulatory documentation capability can charge a meaningful premium for that support, since developers avoid the substantial cost and risk of building comparability packages independently for each new platform adoption. Terumo BCT has built dedicated regulatory support capability specifically to serve developers transitioning from manual to automated processing, capturing an estimated 20 percent premium on programs where validation support is included.
Market Impact: Validation data services command a 20 percent premium

Expanding Platform Leasing and Pay-Per-Batch Models

Automated closed processing platforms carry substantial upfront capital cost that smaller cell therapy developers and academic medical centers often cannot justify, and suppliers that offer leasing or pay-per-batch commercial models capture recurring revenue while lowering the capital barrier for developers evaluating automation for the first time. This model particularly appeals to smaller developers and academic manufacturing programs who cannot justify outright capital purchase for volumes that may scale unpredictably as clinical programs advance. Miltenyi Biotec has expanded leasing programs significantly since 2023, capturing early customers among smaller developers previously priced out of automated technology adoption entirely.
Market Impact: Leasing programs win 22 percent more new customers

Building Dedicated Allogeneic-Specific Large-Batch Platform Portfolios

Allogeneic cell therapy developers increasingly require manufacturing platforms engineered for substantially larger batch volumes than autologous manufacturing has traditionally demanded, and suppliers that build dedicated allogeneic-scale platform portfolios rather than adapting autologous-scale systems can command premium pricing for the additional engineering work involved. This approach particularly appeals to developers pursuing off-the-shelf cell therapy programs, since generic autologous-scale platforms often cannot economically scale to the batch volumes allogeneic commercial manufacturing requires. Sartorius has expanded its allogeneic-scale platform portfolio significantly since 2023, capturing an estimated 15 percent larger share of new allogeneic manufacturing programs than suppliers offering only autologous-scale systems.
Market Impact: Wins 15 percent more new allogeneic manufacturing programs

Who Controls the Margin Pool

Five suppliers, Cytiva, Terumo BCT, Miltenyi Biotec, Sartorius, and Thermo Fisher, hold well over half of global revenue in a market concentrated enough that qualification history and regulatory track record matter as much as technical specifications. Cytiva and Miltenyi Biotec both run the broadest validated platform portfolios spanning the entire manufacturing workflow, from initial cell selection through fill-finish and cryopreservation.
Current competitive activity centers on three fronts. Suppliers are racing to build allogeneic-scale platform capability as that manufacturing category approaches commercial scale, since early validation is becoming a genuine competitive differentiator. They are building orchestration software and leasing programs to capture recurring revenue, and expanding regulatory validation data services to shorten customer adoption timelines. Specialized software providers are entering by partnering directly with equipment makers on chain-of-identity tracking capability.

Emerging pressure comes from two directions. Chinese domestic equipment suppliers are exporting increasingly credible conventional and automated processing equipment into Southeast Asian markets at prices Western suppliers struggle to match. Specialized automation start-ups are also entering by partnering directly with cell therapy developers on custom platform development, threatening to capture premium specification business before established suppliers fully commercialize their own next-generation allogeneic-scale platforms and defend existing accounts.
automated-and-closed-cell-therapy-processing-syste-company-positioning-matrix-1787300942520

Competitive Moat and Risk Dimensions

CYTIVA

Moat: Broadest Validated Platform Portfolio

Cytiva operates the broadest portfolio of validated closed processing platforms spanning the entire cell therapy manufacturing workflow from selection through fill-finish, letting it serve developers as a single integrated technology partner rather than requiring multiple vendor relationships. That breadth of field-proven validation history is difficult for smaller specialized competitors to replicate without years of parallel qualification investment.
CYTIVA

Risk: Danaher Integration Complexity

Cytiva's position within Danaher's broader life sciences portfolio can slow decision-making and resource allocation compared with more focused pure-play competitors, particularly on emerging technology bets where faster-moving specialized suppliers increasingly win early customer relationships through quicker technical response, forcing Cytiva to compete on speed as well as breadth.
MILTENYI BIOTEC

Moat: Deep Cell Selection Technology Leadership

Miltenyi Biotec's decades of magnetic cell separation and selection technology development give it the most field-proven track record in the industry's most technically demanding processing step, built through years of formulation refinement other suppliers are only now beginning to match at comparable scale and validation depth.
MILTENYI BIOTEC

Risk: Narrower Allogeneic Platform Presence

Miltenyi Biotec's commercial strength remains concentrated in autologous-scale processing technology, leaving it with a narrower presence in the allogeneic-scale platform category than some competitors as that segment's growth increasingly outpaces conventional autologous manufacturing demand, a gap rivals with dedicated allogeneic portfolios are actively working to widen further.

Key Players

Cytiva
Terumo BCT
Miltenyi Biotec
Sartorius
Thermo Fisher

Others

Lonza
Fresenius Kabi
MaxCyte
Cellares
Multiply Labs
Ori Biotech
CellVec
Vivebiotech
Charles River Laboratories
Catalent
WuXi Advanced Therapies
Bio-Techne
Akadeum Life Sciences
STEMCELL Technologies
Cellular Biomedicine Group

Recent Developments

APRIL 2025

Cytiva Launches Allogeneic-Scale Expansion Bioreactor Platform

Cytiva launched a new large-batch expansion bioreactor platform specifically engineered for allogeneic cell therapy manufacturing, targeting developers scaling off-the-shelf programs toward commercial production at scale. The launch followed extensive field validation with several undisclosed developer customers across allogeneic manufacturing programs in North America and Western Europe.
Signal: Signals major suppliers extending proven technology into the fastest-growing segment of the cell therapy manufacturing equipment market.
SEPTEMBER 2024

Terumo BCT Acquires Chain-of-Identity Tracking Software Specialist

Terumo BCT acquired a privately held chain-of-identity tracking software specialist to strengthen its process orchestration capability ahead of expanding commercial manufacturing platform deployments across its global customer base. The acquisition adds proprietary tracking and documentation technology to Terumo BCT's existing automated processing hardware portfolio, deepening its software capability considerably.
Signal: Signals consolidation in orchestration software as suppliers bring specialized tracking capability in-house rather than partnering externally.
JANUARY 2025

Miltenyi Biotec Expands Chinese Manufacturing Capacity

Miltenyi Biotec opened an expanded automated processing equipment manufacturing facility in China dedicated to serving the country's rapidly growing domestic cell therapy manufacturing sector. The facility increases Miltenyi Biotec's Chinese production capacity and supports faster technical response to local developer specification requirements across the region.
Signal: Signals Western suppliers investing directly in Chinese manufacturing capacity to defend share against domestic equipment makers.

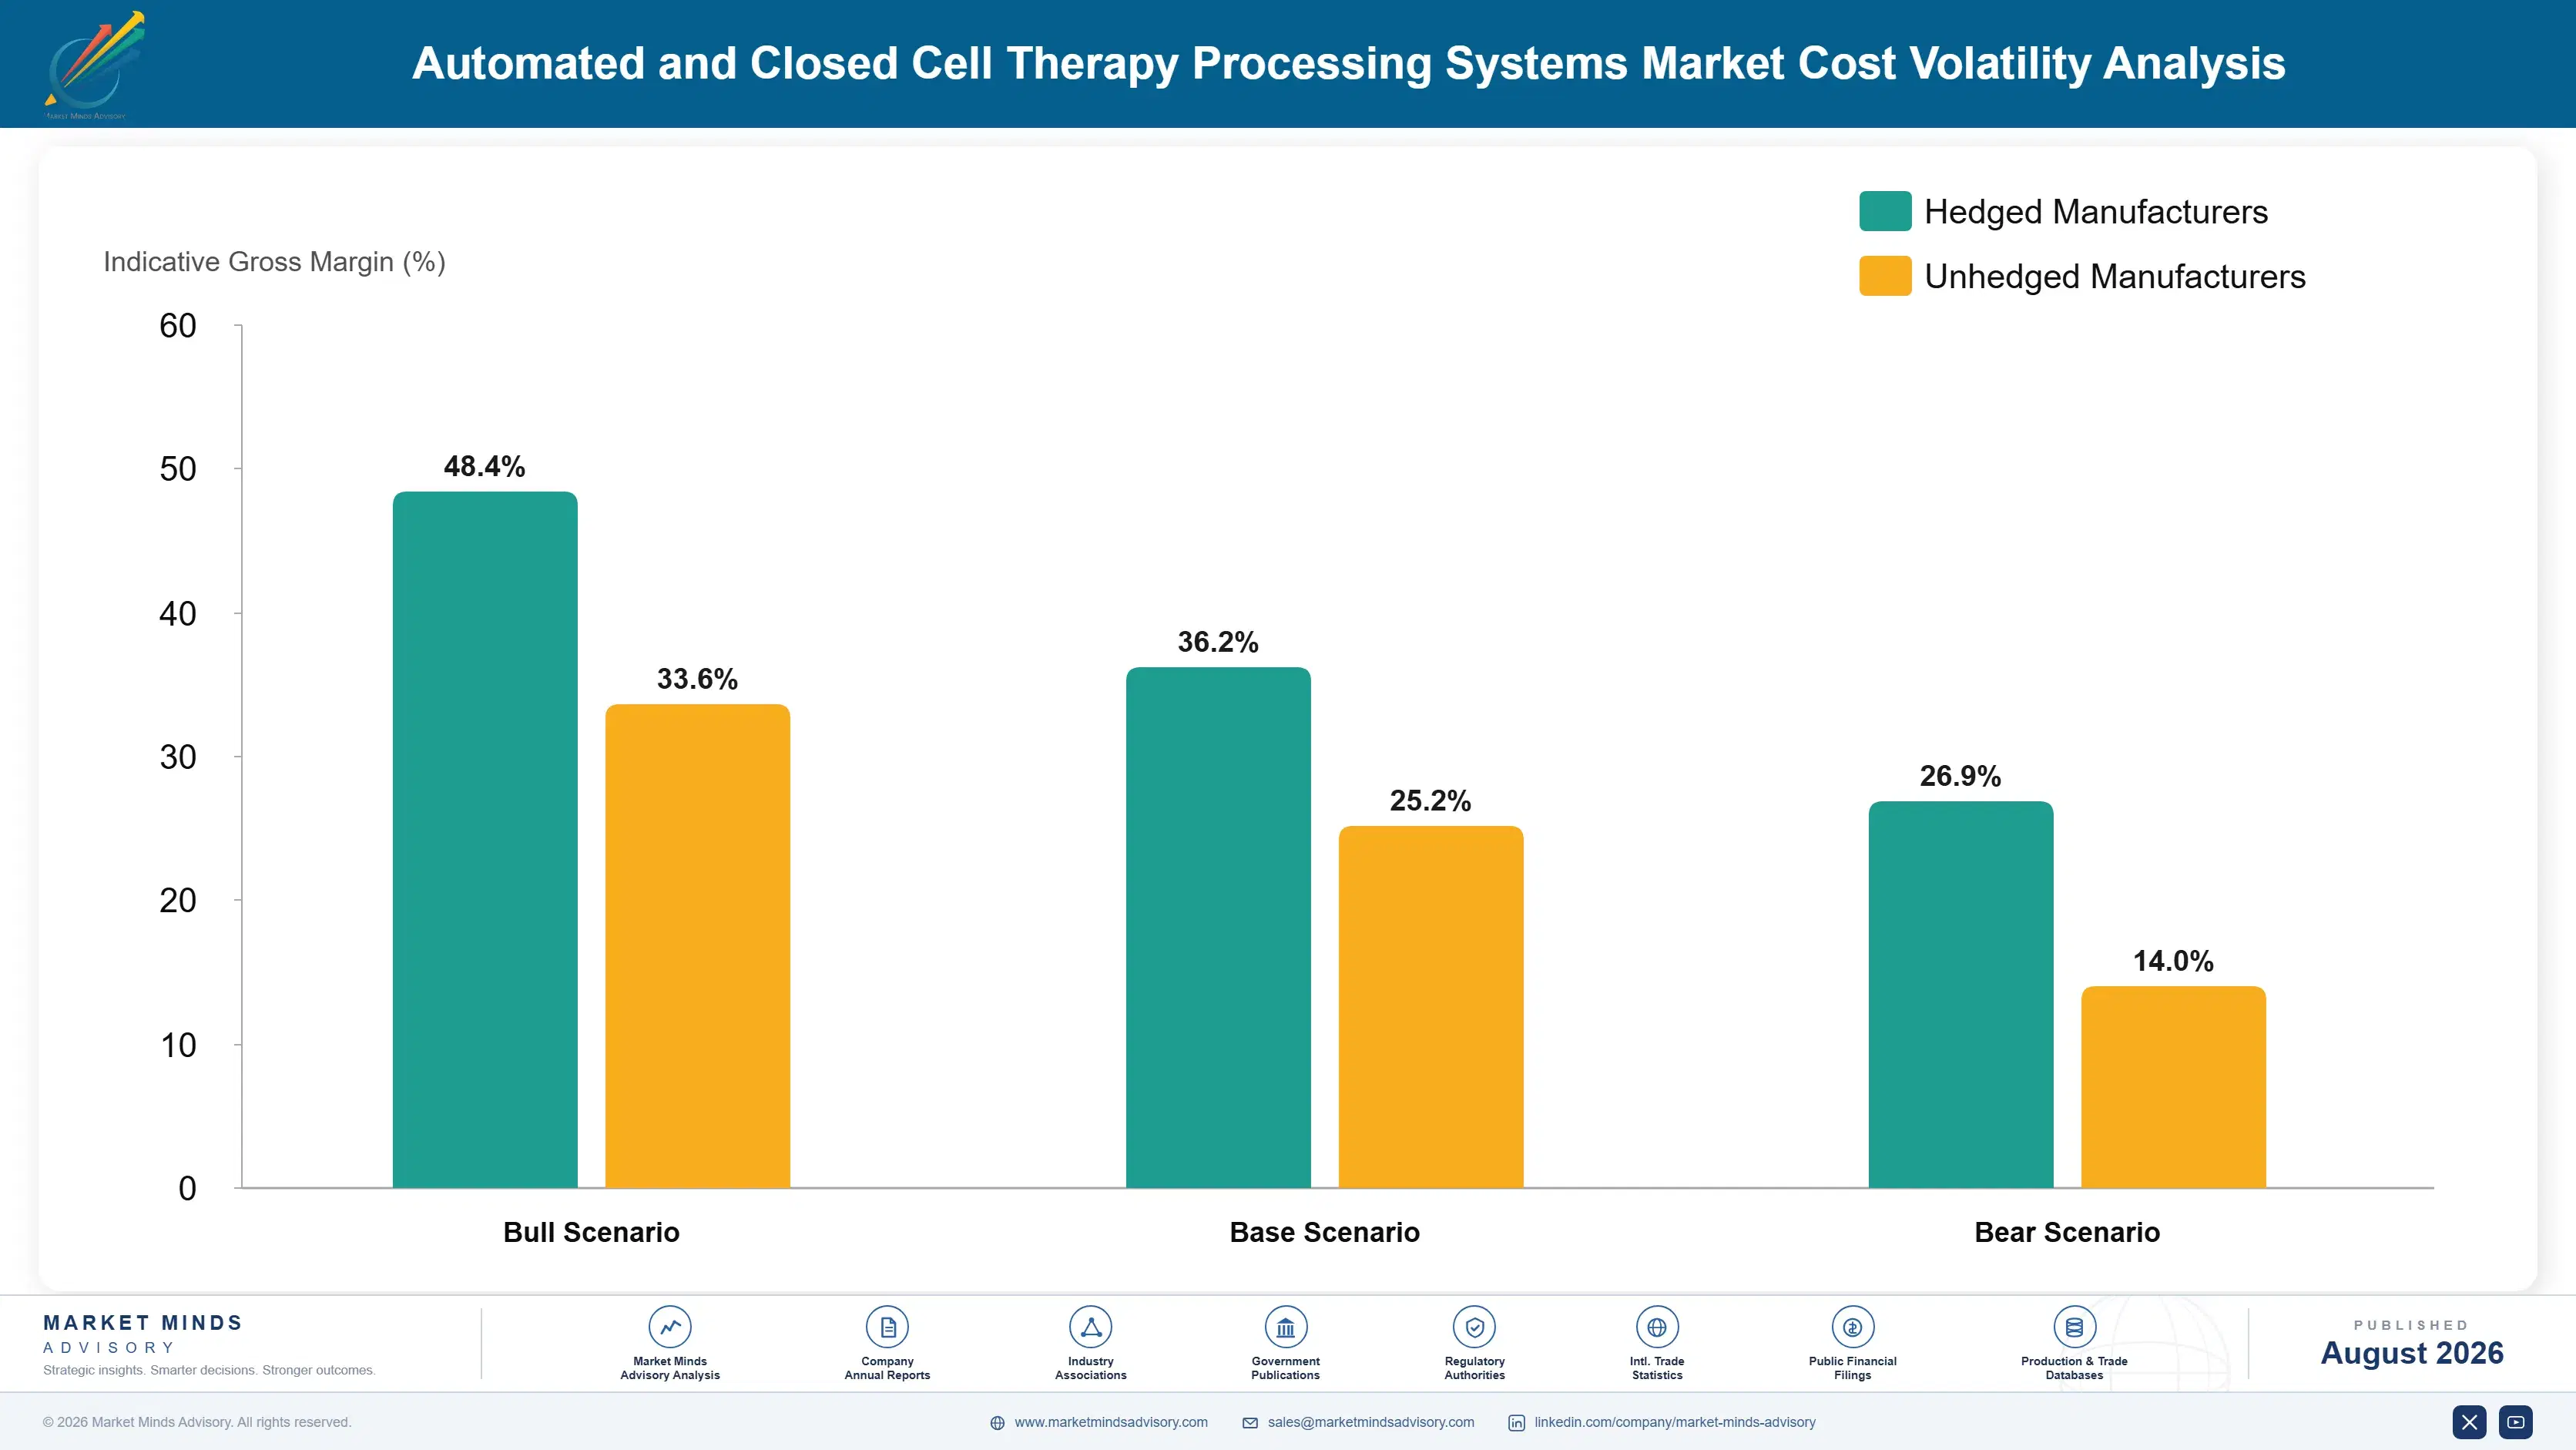
Single-Use Consumable Cost Exposure

Single-use consumables and sensor components together account for roughly 40 percent of automated cell therapy processing equipment cost of goods sold, with specialized bag and cartridge manufacturing concentrated among a handful of qualified producers whose capacity cannot be added as quickly as demand sometimes requires. Component sourcing is the sharper constraint, since specialized single-use consumable manufacturing capacity takes considerable time to expand and validate.
Single-use consumable supply became a genuine bottleneck during 2022 and 2023 as commercial manufacturing demand outpaced available production capacity industry-wide, pushing lead times out substantially at several major suppliers according to industry capacity tracking. Cytiva's 2023 annual report cited consumable supply constraints as a factor limiting near-term revenue growth despite strong underlying demand, and several suppliers announced dedicated capacity expansion investments specifically in response to the constraint becoming a genuine competitive issue.

The disadvantage falls hardest on smaller suppliers without in-house consumable production or long-term supply agreements. Cytiva and Terumo BCT, with scale to invest in dedicated manufacturing capacity, absorb demand surges more smoothly than smaller suppliers dependent on third-party component manufacturers. That gap widens further for suppliers without diversified sourcing, who face both capacity constraints and potential quality variability across production batches.
automated-and-closed-cell-therapy-processing-syste-cost-volatility-analysis-1787300942722

Expanding In-House Consumable Manufacturing Capacity

Leading suppliers are investing directly in dedicated single-use consumable manufacturing capacity rather than relying entirely on third-party producers, reducing exposure to capacity constraints during periods of surging commercial demand. Cytiva and Terumo BCT have both announced capacity expansion investments since 2023, and several suppliers are also qualifying secondary manufacturing partners to build redundancy into their supply chains.

Diversifying Component Sourcing Partners

Several suppliers have moved to qualify multiple single-use consumable manufacturers rather than relying on a single producer, reducing exposure to any one supplier's capacity constraints or quality issues. This diversification adds modest coordination complexity but meaningfully reduces the risk of a single manufacturing disruption affecting an entire product line's availability across major markets and customer accounts.

Building Long-Term Capacity Reservation Agreements

Leading suppliers are negotiating long-term capacity reservation agreements with component manufacturers, securing guaranteed production slots ahead of anticipated demand rather than competing for available capacity on the spot market during periods of industry-wide tightness. This approach requires accurate demand forecasting but provides meaningfully more supply certainty than spot market purchasing offers most smaller competitors.

Portfolio Architecture for Margin Defence

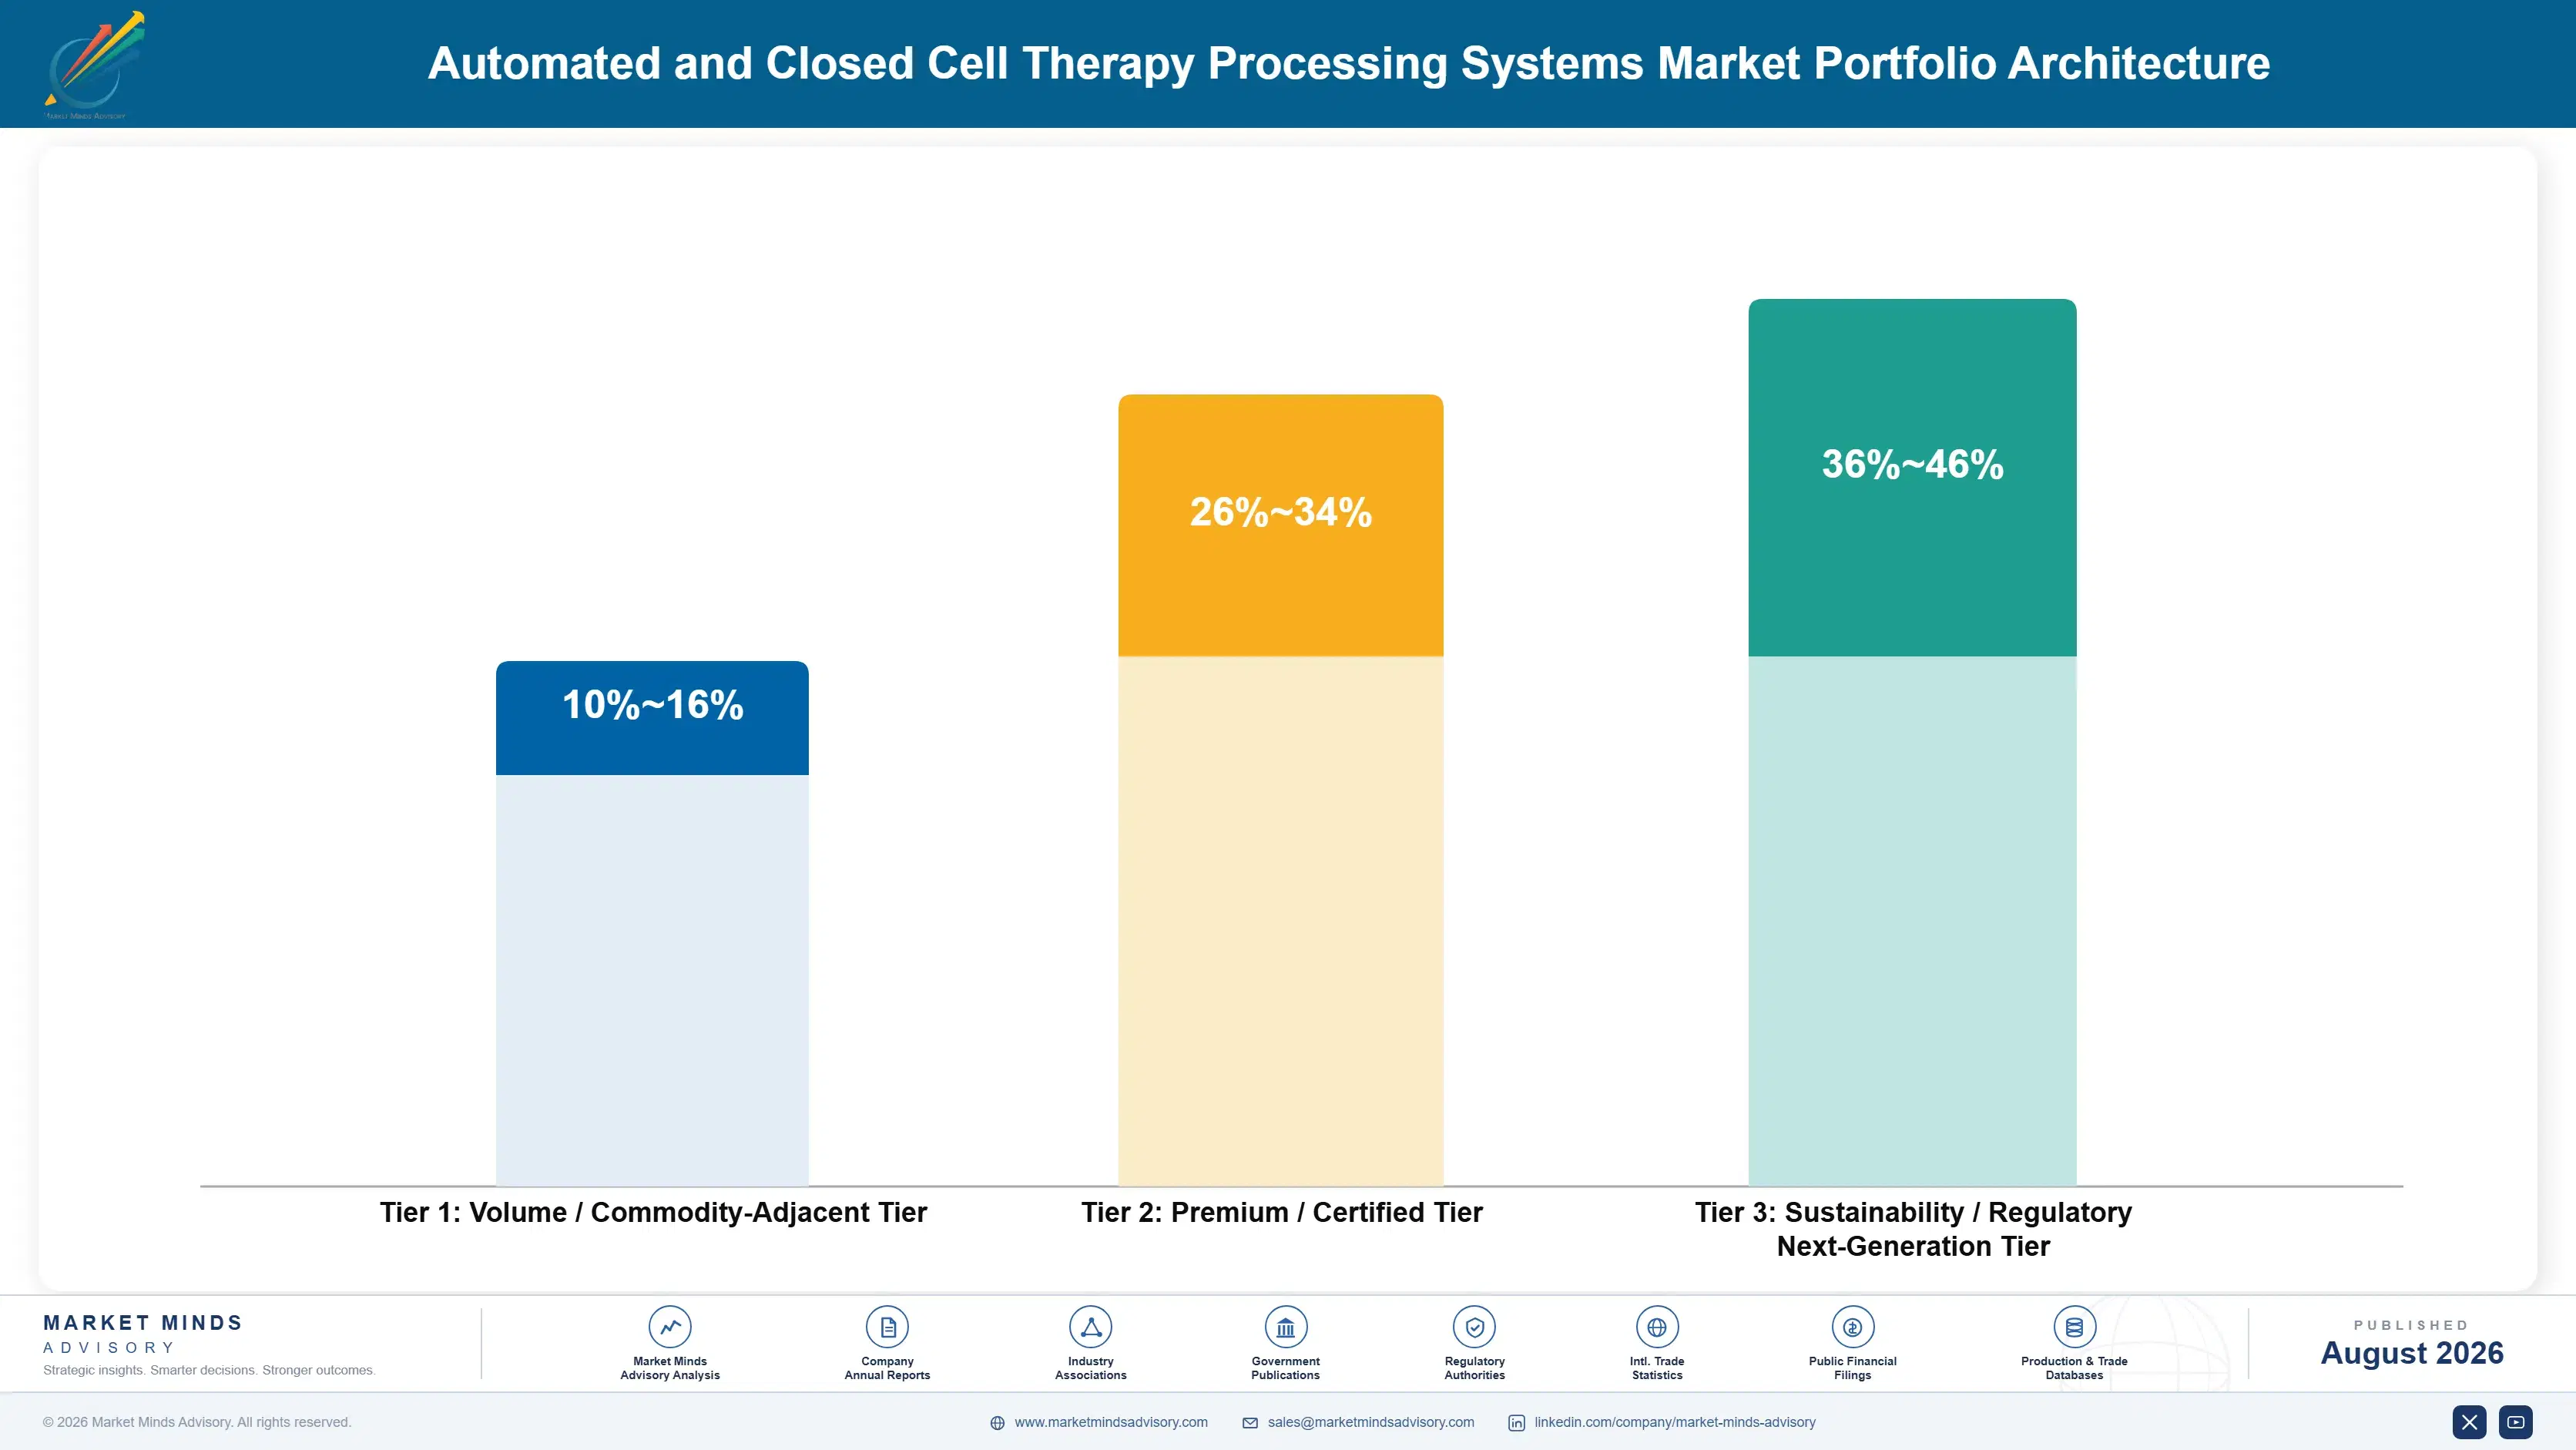
The portfolio splits into three tiers. Commodity manual and semi-automated processing components sit at the volume base with thin margins, competing mainly on price and delivery reliability. Premium closed-system platforms and validated selection technology occupy the middle tier, commanding stronger margins through regulatory validation and technical qualification. Allogeneic-scale platforms and orchestration software subscriptions sit at the top, where margins run richest and competitive inten
The tension between volume and premium runs through how suppliers allocate research investment. Conventional component manufacturing requires steady throughput to cover fixed production costs, pulling suppliers toward volume even as that segment's growth slows relative to premium formats, while allogeneic-scale platforms and software demand sustained investment that only pays off once developer adoption scales. Suppliers that lean too far toward either extreme risk losing either the cash generation the volume base provides or the margin growth premium platforms deliver.

High-value margin pools concentrate in allogeneic-scale platforms and orchestration software subscriptions, where qualification barriers keep competition thin and developers pay premium prices for validated reliability on commercial-scale manufacturing programs. That concentration is likely to deepen as allogeneic cell therapy programs continue advancing toward commercial approval.

Volume / Commodity-Adjacent Tier

Commodity manual and semi-automated processing components sold primarily on price and delivery reliability to a broad base of academic and early-stage cell therapy manufacturers worldwide, competing chiefly on cost and reliable delivery schedules.
Gross Margin: 10%-16%

Premium / Certified Tier

Closed-system platforms and validated selection and expansion technology sold with technical support to developers advancing commercial-scale manufacturing programs, where qualification history and validated performance carry more weight than list price alone.
Gross Margin: 26%-34%

Sustainability / Regulatory / Next-Generation Tier

Allogeneic-scale manufacturing platforms and orchestration software subscriptions built for developers requiring validated performance and chain-of-identity assurance at commercial scale, where qualification barriers keep competition thin and margins run richest across the entire supplier portfolio.
Gross Margin: 36%-46%
automated-and-closed-cell-therapy-processing-syste-portfolio-architecture-1787300943225

High-value Sub-segments and Strategic Watch-out

Allogeneic-Scale Manufacturing Platforms

Developers advancing off-the-shelf cell therapy programs toward commercial approval are forcing suppliers to specify validated large-batch platforms with limited existing supplier competition. Qualification barriers keep the field narrow, and volume is expanding faster than almost any other category tracked in this report by a wide margin.
Gross Margin: 36%-46%

Orchestration Software Subscriptions

Recurring software revenue attached to process automation and chain-of-identity tracking grows steadily as manufacturers standardize on proven platforms across their global manufacturing networks. Growth is moderate compared with allogeneic hardware demand but margins are among the richest in the portfolio once technical expertise is built.
Gross Margin: 34%-42%

Commodity Manual and Semi-Automated Components

The largest revenue base by volume, sold into academic and early-stage manufacturers worldwide on price and delivery reliability rather than advanced technical differentiation. Growth tracks manufacturing program starts closely and margins stay thin, but the segment funds next-generation platform development across the broader supplier portfolio.
Gross Margin: 10%-16%

Chinese Domestic Equipment Exports

Chinese suppliers are exporting increasingly credible conventional processing equipment at prices well below Western equivalents, initially into Southeast Asian markets where price sensitivity runs higher than in mature manufacturing regions. If technical gaps close further, this segment could pressure premium pricing industry-wide within the coming decade.
Gross Margin: 16%-24%

Recurring Software Revenue Inside Every Platform

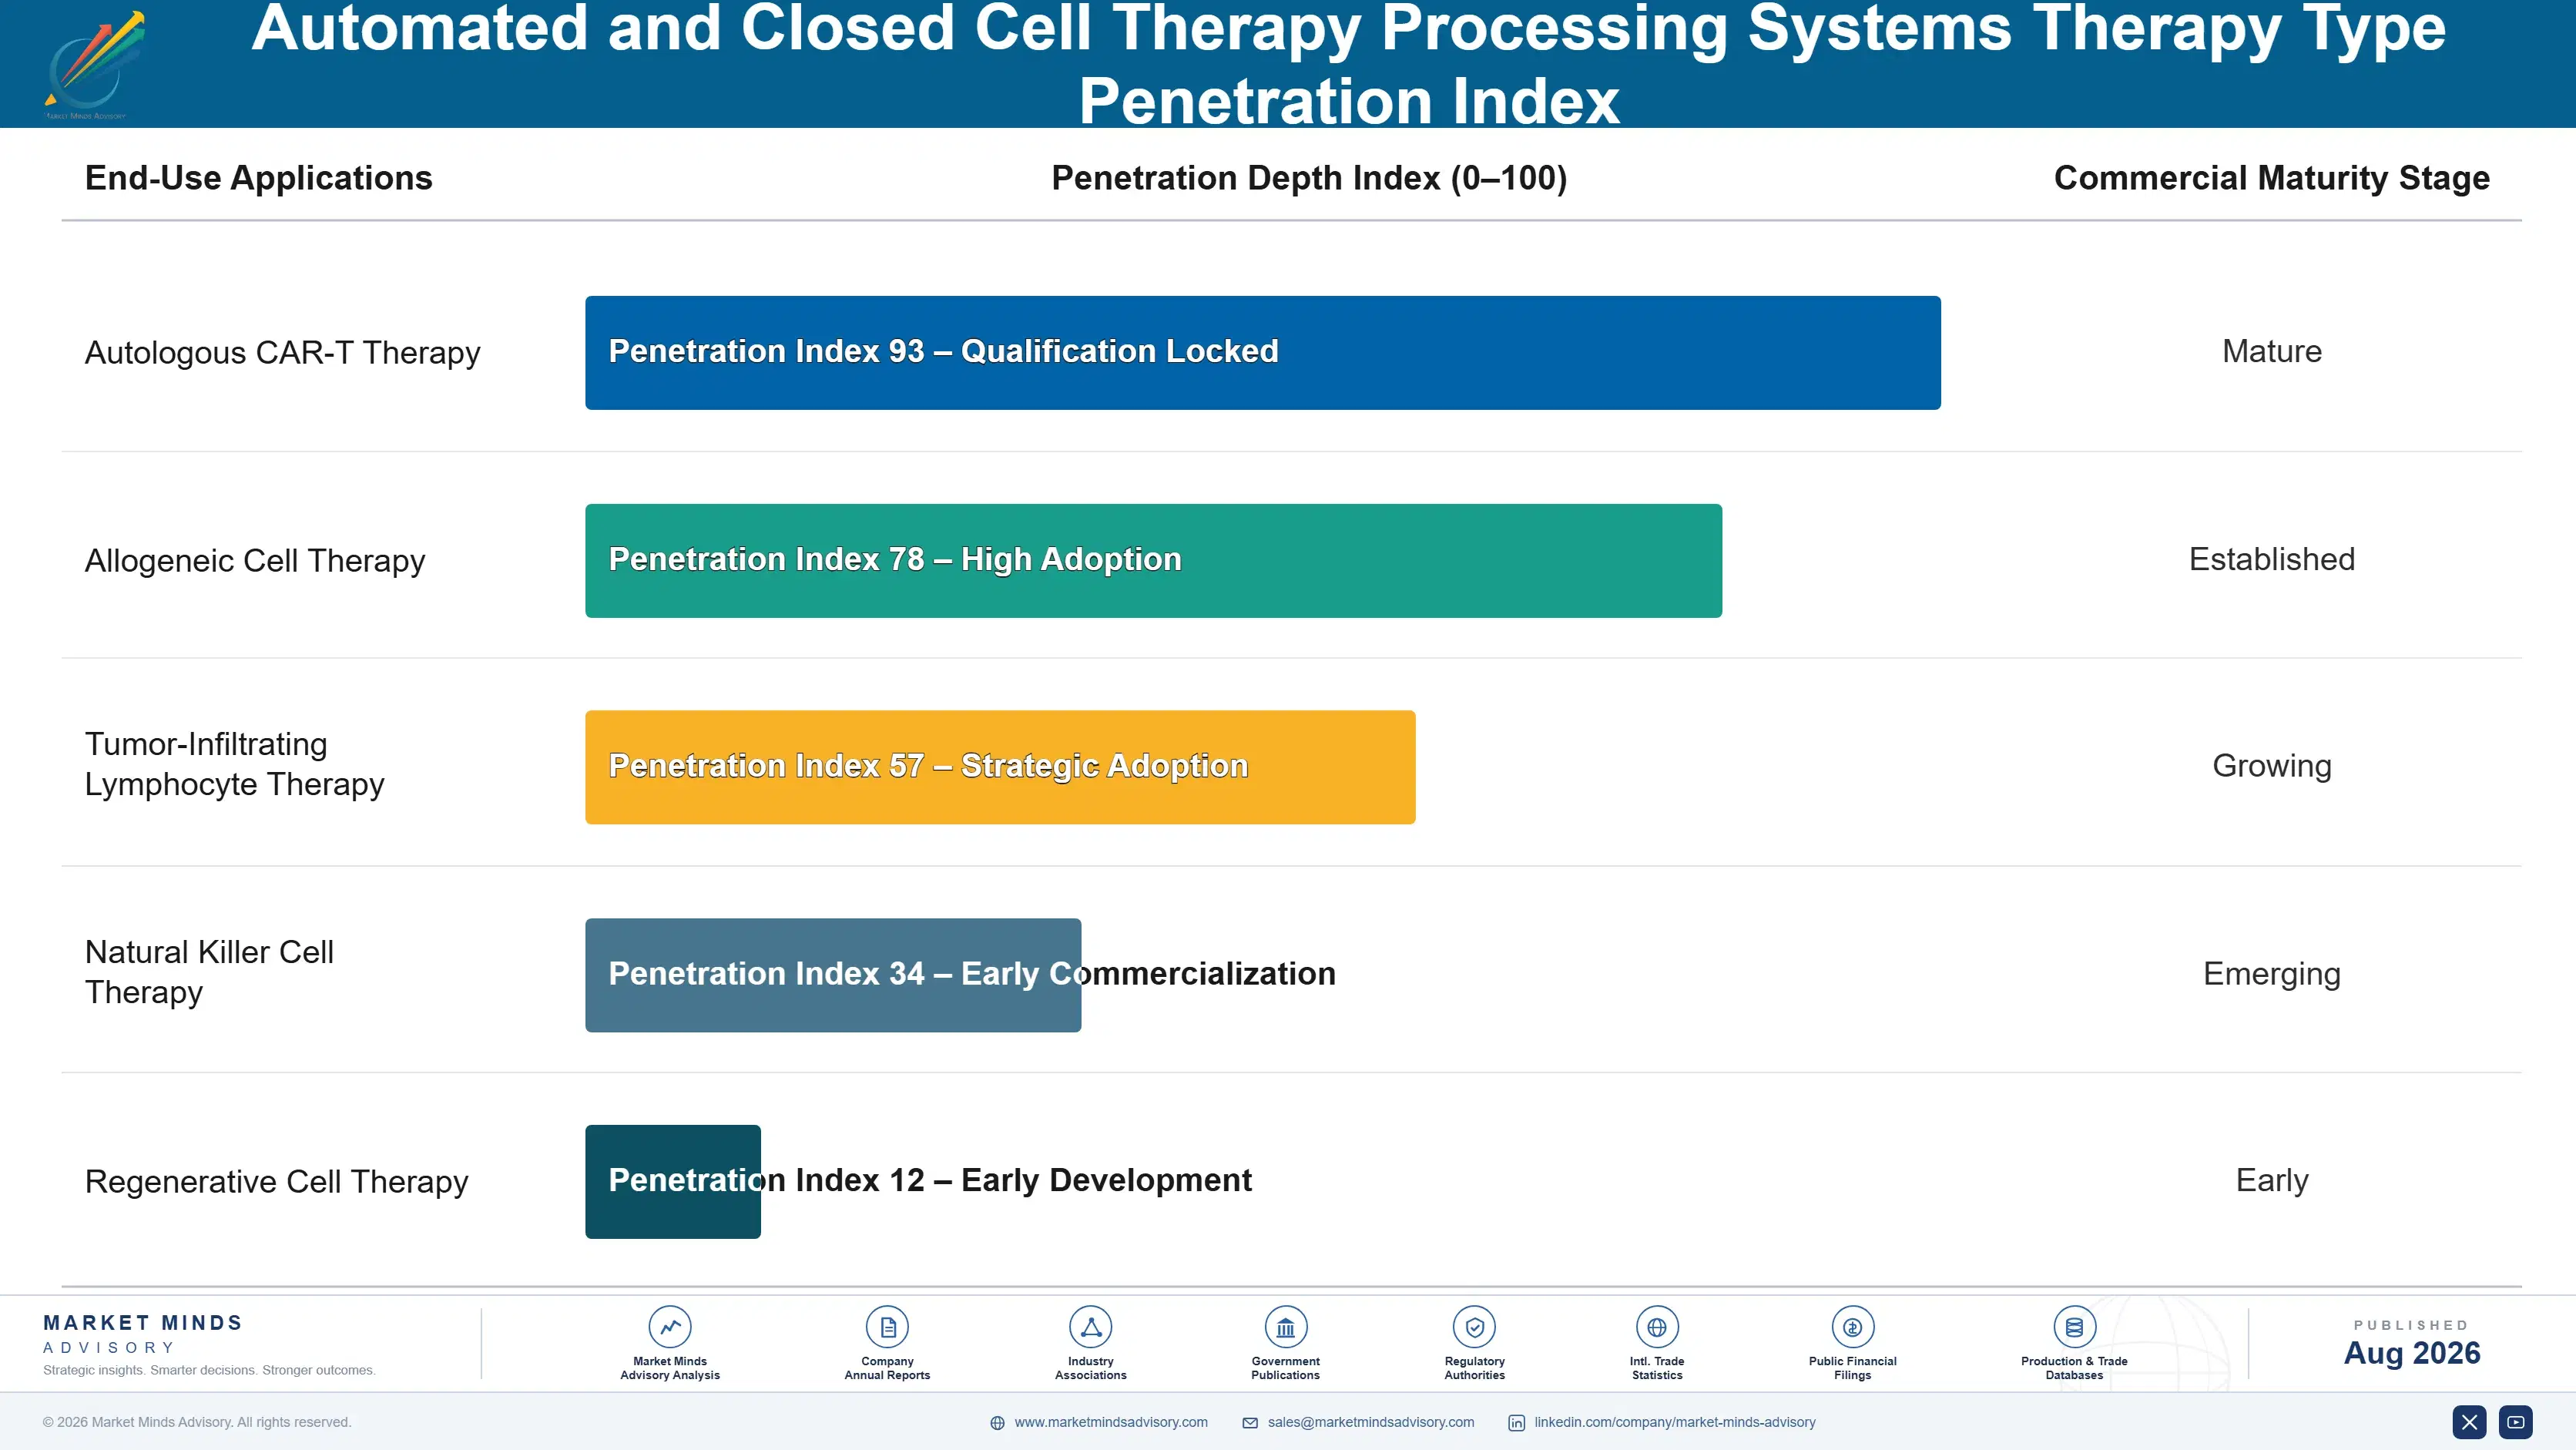
Automated cell therapy processing systems generate revenue closer to an annuity than a one-time sale once orchestration software subscriptions and support agreements are included, since every operating manufacturing line consumes another cycle of consumables, software licensing, and validation support regardless of near-term clinical pipeline volatility. That repeat-purchase dynamic gives suppliers more predictable revenue than headline biotech funding volatility alone would suggest, provided th
Adoption depth varies sharply by customer type. Large commercial manufacturers sign multi-year platform agreements that lock in preferred suppliers across their global facility network, creating high switching costs once a technology is validated into an approved manufacturing process. Smaller academic developers behave differently, purchasing equipment more transactionally on a project-by-project basis and remaining more price-sensitive, which keeps competition sharper but limits how much recurring revenue any single supplier can count on.

A generational shift in buyer profiles is underway as manufacturing engineers who trained on automated closed-system platforms replace an older generation more familiar with manual cleanroom processing. That shift favors suppliers with strong automation and software technology over those competing purely on legacy equipment reliability, and it is reshaping which suppliers get invited to new facility technology selection.
automated-and-closed-cell-therapy-processing-syste-end-use-penetration-index-1787300943724

Where MMA Sees the Opportunity

These are among the four positions where our research anticipates prominent divergence between winners and laggards over the coming forecast period. Each is grounded in the demand model, the regulatory perimeter, and the announced capacity pipeline.
01 / ALLOGENEIC PLATFORM PRIORITY

Prioritize allogeneic-scale platform development ahead of commercial scaling

Allogeneic cell therapy programs are approaching commercial scale faster than many suppliers anticipated, and developers increasingly exclude suppliers without validated large-batch platform technology from consideration for new manufacturing programs across their global facility networks and regional expansion plans. Suppliers that have not yet invested in allogeneic-scale platform development risk missing the fastest-growing and most defensible segment of this market for years to come. MMA recommends prioritizing allogeneic-scale platform investment over incremental improvements to autologous-scale equipment lines facing more moderate growth prospects industry-wide.
02 / ORCHESTRATION SOFTWARE INVESTMENT

Build orchestration software capability to deepen customer relationships

Software-attached platform sales command meaningfully higher lifetime revenue than hardware-only sales, and suppliers without orchestration software capability are increasingly excluded from the higher-margin contract structures Cytiva and other leaders have already built across their largest accounts. That gap will likely widen as manufacturers standardize on suppliers offering integrated hardware and software platforms rather than assembling systems from multiple vendors independently. MMA recommends investing in orchestration software capability now, rather than continuing to compete purely on hardware specifications and price alone.
03 / VALIDATION SERVICE EXPANSION

Build regulatory validation data services ahead of customer demand

Suppliers that build comprehensive regulatory validation data packages can meaningfully shorten customer qualification timelines, a genuine competitive advantage in a market where validation speed increasingly determines purchasing decisions among time-constrained developers under approval pressure. Suppliers without pre-packaged validation documentation are losing deals to competitors like Terumo BCT that have invested in reducing this specific customer friction point. MMA recommends investing in validation data package development now, before competitors establish this capability as a standard expectation rather than a genuine differentiator.
04 / LEASING MODEL EXPANSION

Expand leasing models to capture price-sensitive smaller developers

Leasing and pay-per-batch models have opened automated technology adoption to smaller developers who had previously been priced out of the category entirely, a meaningfully larger addressable customer base than outright equipment sales alone could ever reach. Suppliers without leasing capability are ceding this expanding customer segment to competitors like Miltenyi Biotec, which has expanded leasing programs specifically to capture this underserved market segment. MMA recommends building or partnering into leasing capability rather than relying solely on traditional capital equipment sales models.

Engagement Snapshot From the Field

A live engagement with an industry participant carrying material or product regulatory and market exposure ahead of a defining policy shift, showing how our research translates into a defensible multi-year portfolio strategy.
MARKET MINDS ADVISORY · CLIENT ENGAGEMENT SUMMARY
Automated and Closed Cell Therapy Processing Systems Producer Strategic Portfolio Review and Transition Roadmap 2026·Investment Scenario on Automated and Closed Cell Therapy Processing Systems Exposure Evaluation 2025-26
CLIENT PROFILE
The client is a clinical-stage cell therapy developer operating a single manufacturing facility currently relying on manual and semi-automated processing for its lead autologous CAR-T program, reporting approximately 65 million dollars in annual manufacturing and process development spend (client-reported, unverified by MMA). The company faced capacity constraints ahead of an anticipated commercial approval and was evaluating whether to transition to fully automated closed-system processing before or after approval.
STRATEGIC CHALLENGE
Leadership needed to determine whether transitioning to automated processing before commercial approval would meaningfully de-risk the anticipated capacity scale-up, or whether the validation timeline and cost made a post-approval transition a lower-risk path given the urgency of the approval timeline and the company's limited internal automation engineering resources and budget.
MMA APPROACH
MMA benchmarked automation transition timelines and capacity outcomes across comparable clinical-stage developers that transitioned before versus after commercial approval, modeling total risk and cost under both scenarios. The engagement combined primary interviews with three equipment supplier technical teams and secondary analysis of comparable transition timelines to inform the client's strategy.
KEY FINDINGS
  1. Pre-approval automation transition required an estimated 14 months from initial validation to production readiness, longer than the client's anticipated approval timeline initially allowed (client-reported, unverified by MMA).
  2. Post-approval transition risked a capacity gap of several months during which manual processing alone could not meet anticipated commercial demand, a supply risk the client's commercial team viewed as unacceptable (client-reported, unverified by MMA).
  3. Peer developers that transitioned pre-approval reported smoother regulatory review given the additional comparability data available at time of submission, according to interviews conducted for this engagement.
  4. Equipment suppliers offered meaningfully better technical support and pricing when transition planning began well ahead of anticipated approval rather than as a reactive post-approval scramble (client-reported, unverified by MMA).
CLIENT PROFILE
The client is a clinical-stage cell therapy developer operating a single manufacturing facility currently relying on manual and semi-automated processing for its lead autologous CAR-T program, reporting approximately 65 million dollars in annual manufacturing and process development spend (client-reported, unverified by MMA). The company faced capacity constraints ahead of an anticipated commercial approval and was evaluating whether to transition to fully automated closed-system processing before or after approval.
STRATEGIC CHALLENGE
Leadership needed to determine whether transitioning to automated processing before commercial approval would meaningfully de-risk the anticipated capacity scale-up, or whether the validation timeline and cost made a post-approval transition a lower-risk path given the urgency of the approval timeline and the company's limited internal automation engineering resources and budget.
MMA APPROACH
MMA benchmarked automation transition timelines and capacity outcomes across comparable clinical-stage developers that transitioned before versus after commercial approval, modeling total risk and cost under both scenarios. The engagement combined primary interviews with three equipment supplier technical teams and secondary analysis of comparable transition timelines to inform the client's strategy.
KEY FINDINGS
  1. Pre-approval automation transition required an estimated 14 months from initial validation to production readiness, longer than the client's anticipated approval timeline initially allowed (client-reported, unverified by MMA).
  2. Post-approval transition risked a capacity gap of several months during which manual processing alone could not meet anticipated commercial demand, a supply risk the client's commercial team viewed as unacceptable (client-reported, unverified by MMA).
  3. Peer developers that transitioned pre-approval reported smoother regulatory review given the additional comparability data available at time of submission, according to interviews conducted for this engagement.
  4. Equipment suppliers offered meaningfully better technical support and pricing when transition planning began well ahead of anticipated approval rather than as a reactive post-approval scramble (client-reported, unverified by MMA).
RECOMMENDED STRATEGY
Phase 1: Phase 1 (Months 1 to 6): Begin automated platform validation testing in parallel with ongoing manual production, avoiding disruption to current supply. Phase 2: Phase 2 (Months 7 to 12): Complete validation and submit comparability data as part of the commercial approval regulatory package. Phase 3: Phase 3 (Months 13 to 18): Transition fully to automated processing immediately following commercial approval, retiring manual processing capacity entirely across the facility.
OUTCOME
Within eighteen months, the client successfully transitioned to automated processing concurrent with its commercial approval, avoiding both the capacity gap and regulatory delay risks its initial post-approval transition plan would have created (client-reported, unverified by MMA). The company has since adopted pre-approval automation transition as its standard approach for future manufacturing programs.

Frequently Asked Questions

Foundational context covering the market sizes, CAGR, scope, country, region and competition that inform every finding below. This section is provided to cover basics and most often pre-purchase conversations, answered from the MMA Primary Research Dataset.

What is the current size of the Automated and Closed Cell Therapy Processing Systems Market?

The global automated and closed cell therapy processing systems market was valued at approximately 3.1 billion dollars in 2025. Growth is driven primarily by commercial approval expansion and cleanroom operator shortages.

How large will the Automated and Closed Cell Therapy Processing Systems Market be by 2036?

MMA forecasts the market reaching approximately 17.4 billion dollars by 2036, roughly 4.81 times its 2026 value. Allogeneic-scale platforms and orchestration software account for much of that growth.

What is the CAGR for the Automated and Closed Cell Therapy Processing Systems Market 2026 to 2036?

The market is projected to grow at a 17.0 percent compound annual rate over the forecast period. Bull and bear scenarios range from 15.7 to 18.3 percent depending on allogeneic commercialization pace.

Which segment is growing fastest?

Process automation and digital orchestration software is the fastest-growing segment, expanding at roughly 1.24 times the overall market rate. Chain-of-identity tracking demand without added headcount is the primary driver.

Who are the major companies in the Automated and Closed Cell Therapy Processing Systems Market?

Cytiva, Terumo BCT, Miltenyi Biotec, Sartorius, and Thermo Fisher lead the market on a revenue basis. Together they hold well over half of global revenue.

Which country is growing fastest?

China is the fastest-growing country, driven by rapidly expanding domestic cell therapy commercial approvals and manufacturing investment. Domestic equipment suppliers are scaling quickly to serve rising demand.

Report Segmentation Architecture

The full report scope spans multiple orthogonal segmentation dimensions, with cross-tabulated demand data provided for each dimension pair. Coverage extends further to regional breakdowns, trend trajectories, and the competitive detail needed to support segment-level decision-making.

By Processing Step

  • Cell Selection and Enrichment Systems
  • Activation and Transduction Systems
  • Cell Expansion Bioreactors
  • Cell Washing and Volume Reduction Systems
  • Fill-Finish and Cryopreservation Systems
  • Process Automation and Digital Orchestration Software

By Therapy Type

  • Autologous CAR-T Therapy
  • Allogeneic Cell Therapy
  • Tumor-Infiltrating Lymphocyte Therapy
  • Natural Killer Cell Therapy
  • Regenerative Cell Therapy

By Commercial Model

  • Direct Equipment Sale
  • Platform Leasing Agreement
  • Software Subscription Service
  • Regulatory Validation Support Contract

By Region

  • North America
  • Western Europe
  • East Asia
  • South Asia and Pacific
  • Latin America
  • Middle East and Africa
  • Eastern Europe

Scope, Methodology, and Coverage

Every figure in this report is reproducible from documented input assumptions. The scope below maps the historical period, the forecast horizon, the segmentation dimensions, and the countries covered, alongside the underlying primary and qualitative methodology.
Historical Period
2020 to 2025
Forecast Period
2026 to 2036
Base Year
2025 (USD billions; MMA Primary Research Dataset, August 2026)
Market Definition
The automated and closed cell therapy processing systems market covers cell selection and enrichment systems, activation and transduction systems, cell expansion bioreactors, cell washing and volume reduction systems, fill-finish and cryopreservation systems, and process automation and digital orchestration software used in autologous and allogeneic cell therapy manufacturing. It excludes finished cell therapy products, gene editing reagents, and conventional open manual cell processing equipment.
Quantitative Units
USD billions (current prices); installed platform units and facility line counts where applicable
Segmentation Dimensions
By Processing Step; By Therapy Type; By Commercial Model; By Region
Regions Covered
North America, Western Europe, East Asia, South Asia and Pacific, Latin America, Middle East and Africa, Eastern Europe
Countries Covered
USA, China, Germany, France, UK, Japan, South Korea, India, Australia, Canada, Brazil, Mexico, Indonesia, Vietnam, Thailand, Malaysia, UAE, Saudi Arabia, South Africa, Nigeria, Turkey, Poland, Netherlands, Italy, Spain, Sweden, Switzerland, Argentina, Colombia, Singapore, and additional markets relevant to this sector
Key Companies Profiled
Cytiva, Terumo BCT, Miltenyi Biotec, Sartorius, Thermo Fisher, Lonza, Fresenius Kabi, MaxCyte, Cellares, Multiply Labs, Ori Biotech, CellVec, Vivebiotech, Charles River Laboratories, Catalent, WuXi Advanced Therapies, Bio-Techne, Akadeum Life Sciences, STEMCELL Technologies, Cellular Biomedicine Group
Quantitative Methodology
Primary survey, n=3,800 respondents, Q4 2025, six countries; demand-side model with trade association cross-validation
Qualitative Methodology
47 expert interviews, Q4 2025; applied to validate demand model assumptions, identify emerging dynamics, and assess competitive positioning
Report Format
PDF and XLSX data workbook (Word format preview document)
Publisher
Market Minds Advisory
Report Code
MMA-2026-HLT-101
Published
August 2026
Contact
sales@marketmindsadvisory.com | www.marketmindsadvisory.com

Purchase the full Automated and Closed Cell Therapy Processing Systems Market Report (2026 to 2036).

The full report provides detailed sizing and ten-year forecasts for each of the six processing step categories tracked in this analysis, alongside country-level detail across thirty markets. It includes a complete competitive benchmarking of the top twenty suppliers on a revenue basis, with moat and risk analysis for the two market leaders. The report also contains a dedicated single-use consumable supply chain risk assessment, plus scenario modeling across bull, base, and bear cases through 2036. Buyers receive access to the underlying primary survey and expert interview datasets referenced throughout the analysis.
Ten-year forecasts across all six processing step categories
Competitive benchmarking of twenty profiled equipment suppliers
Single-use consumable and component supply chain analysis
Bull, base, and bear scenario modeling through 2036
Country-level sizing across thirty tracked national markets
Access to underlying primary survey and interview data

Built For The People Who Decide

From boardroom strategy to bench-side execution, this report is read cover-to-cover by leaders shaping the next decade of their industry, turning demand scenarios, market dynamics and valuation benchmarks into decisions.
CXOs/ Presidents/ VPs/ Managers
M&A and Corporate Development
Strategy Teams and R&D Heads
Procurement and Product Directors
Regulatory and Compliance Leaders
Investor Relations and Equity Analysts