Market Minds Advisory
Stem Cell Therapy Market

Stem Cell Therapy Market: Hematopoietic, Mesenchymal, and Induced Pluripotent Cell-Based Treatments

Induced pluripotent stem cell therapies with off-the-shelf manufacturing potential are pulling capital from donor-dependent hematopoietic protocols as developers chase scalability and broader indication reach, forcing legacy makers to add iPSC capability or lose specification battles.

Lead Analyst

Alice Ballenger

Published

August 2026

Make Smarter Decisions with Customized Research Insights

Request a free sample report and evaluate market opportunities, growth trends, and competitive dynamics relevant to your business needs.

2025 MARKET VALUE$18.0BMarket Size 2025
2036 FORECAST VALUE$66.4BBase Case , 2026 to 2036
CAGR 2026 TO 203612.6 %Bull 13.9% / Bear 11.3%
INCREMENTAL OPPORTUNITY$46.1BNet 10- year value creation
EXPANSION MULTIPLE3.28x2036 value over 2026 base
Strategic Levers
M&A Pipeline
Regional Outlook
Country Rankings
Competitive Intelligence
Segmental Deep-dive
Call-Us : 91 93563 13602

Executive Snapshot and Market Trajectory

Stem cell therapy remains overwhelmingly a hematopoietic transplant product by treated-patient volume, but induced pluripotent stem cell therapies are the clearest growth story now, gaining share on manufacturing scalability that donor-dependent protocols cannot match. Biopharma developers increasingly treat that shift as a genuine specification decision, not a footnote.
iPSC therapies are growing more than forty-five percent faster than the category overall, as biopharma developers convert pipeline specifications to cut donor dependency and satisfy broader indication reach requirements simultaneously. North America holds the largest regional share on its concentrated biopharma R&D and regulatory approval base, while India's expanding cell therapy manufacturing and clinical trial sector is now the single fastest-growing national market this report tracks closely.
Thirty-six percent concentration among the top five developers, evaluated here on estimated global revenue, reflects a meaningfully consolidated category where manufacturing platform depth and clinical trial breadth increasingly separate leaders from the long tail of regional developers. Off-the-shelf manufacturing capability and multi-indication clinical evidence increasingly determine which developers can win multi-year health system contracts from those still competing purely on unit price. Smaller developers increasingly compete only on price for shrinking commodity volume.
Market Definition
The stem cell therapy market comprises hematopoietic, mesenchymal, embryonic, adipose-derived, neural, and induced pluripotent stem cell products administered as therapeutic treatments, including both autologous and allogeneic formats sold to hospitals, transplant centers, and specialty clinics. It excludes gene therapies not derived from stem cell platforms, CAR-T and other engineered immune cell therapies not stem-cell-based, and stem cell research reagents not intended for direct patient administration.
Base Year Value
$18.0B in 2025 (MMA Primary Research Dataset, August 2026)
Forecast Period
2026 to 2036, eleven discrete annual values
CAGR
12.6% base case. Bull 13.9%. Bear 11.3%.
Fastest Growth Segment
Induced Pluripotent Stem Cell (iPSC) Therapy: 18.6% CAGR
Fastest Growth Country
India: 16.4% CAGR
Fastest Growth Region
South Asia and Pacific: 14.6% CAGR
Largest Region
North America: 31% of 2025 global value
Market Leaders
Mesoblast Limited, Vertex Pharmaceuticals Incorporated, Fate Therapeutics, Inc., Vericel Corporation, and Athersys, Inc. lead the category. Source: MMA Analysis based on company annual reports and investor filings.
Primary Survey
n=3,800 procurement and R&D decision-makers, Q4 2025, six countries
Methodology
Demand-side build-up, cross-validated against public data, 47 expert interviews

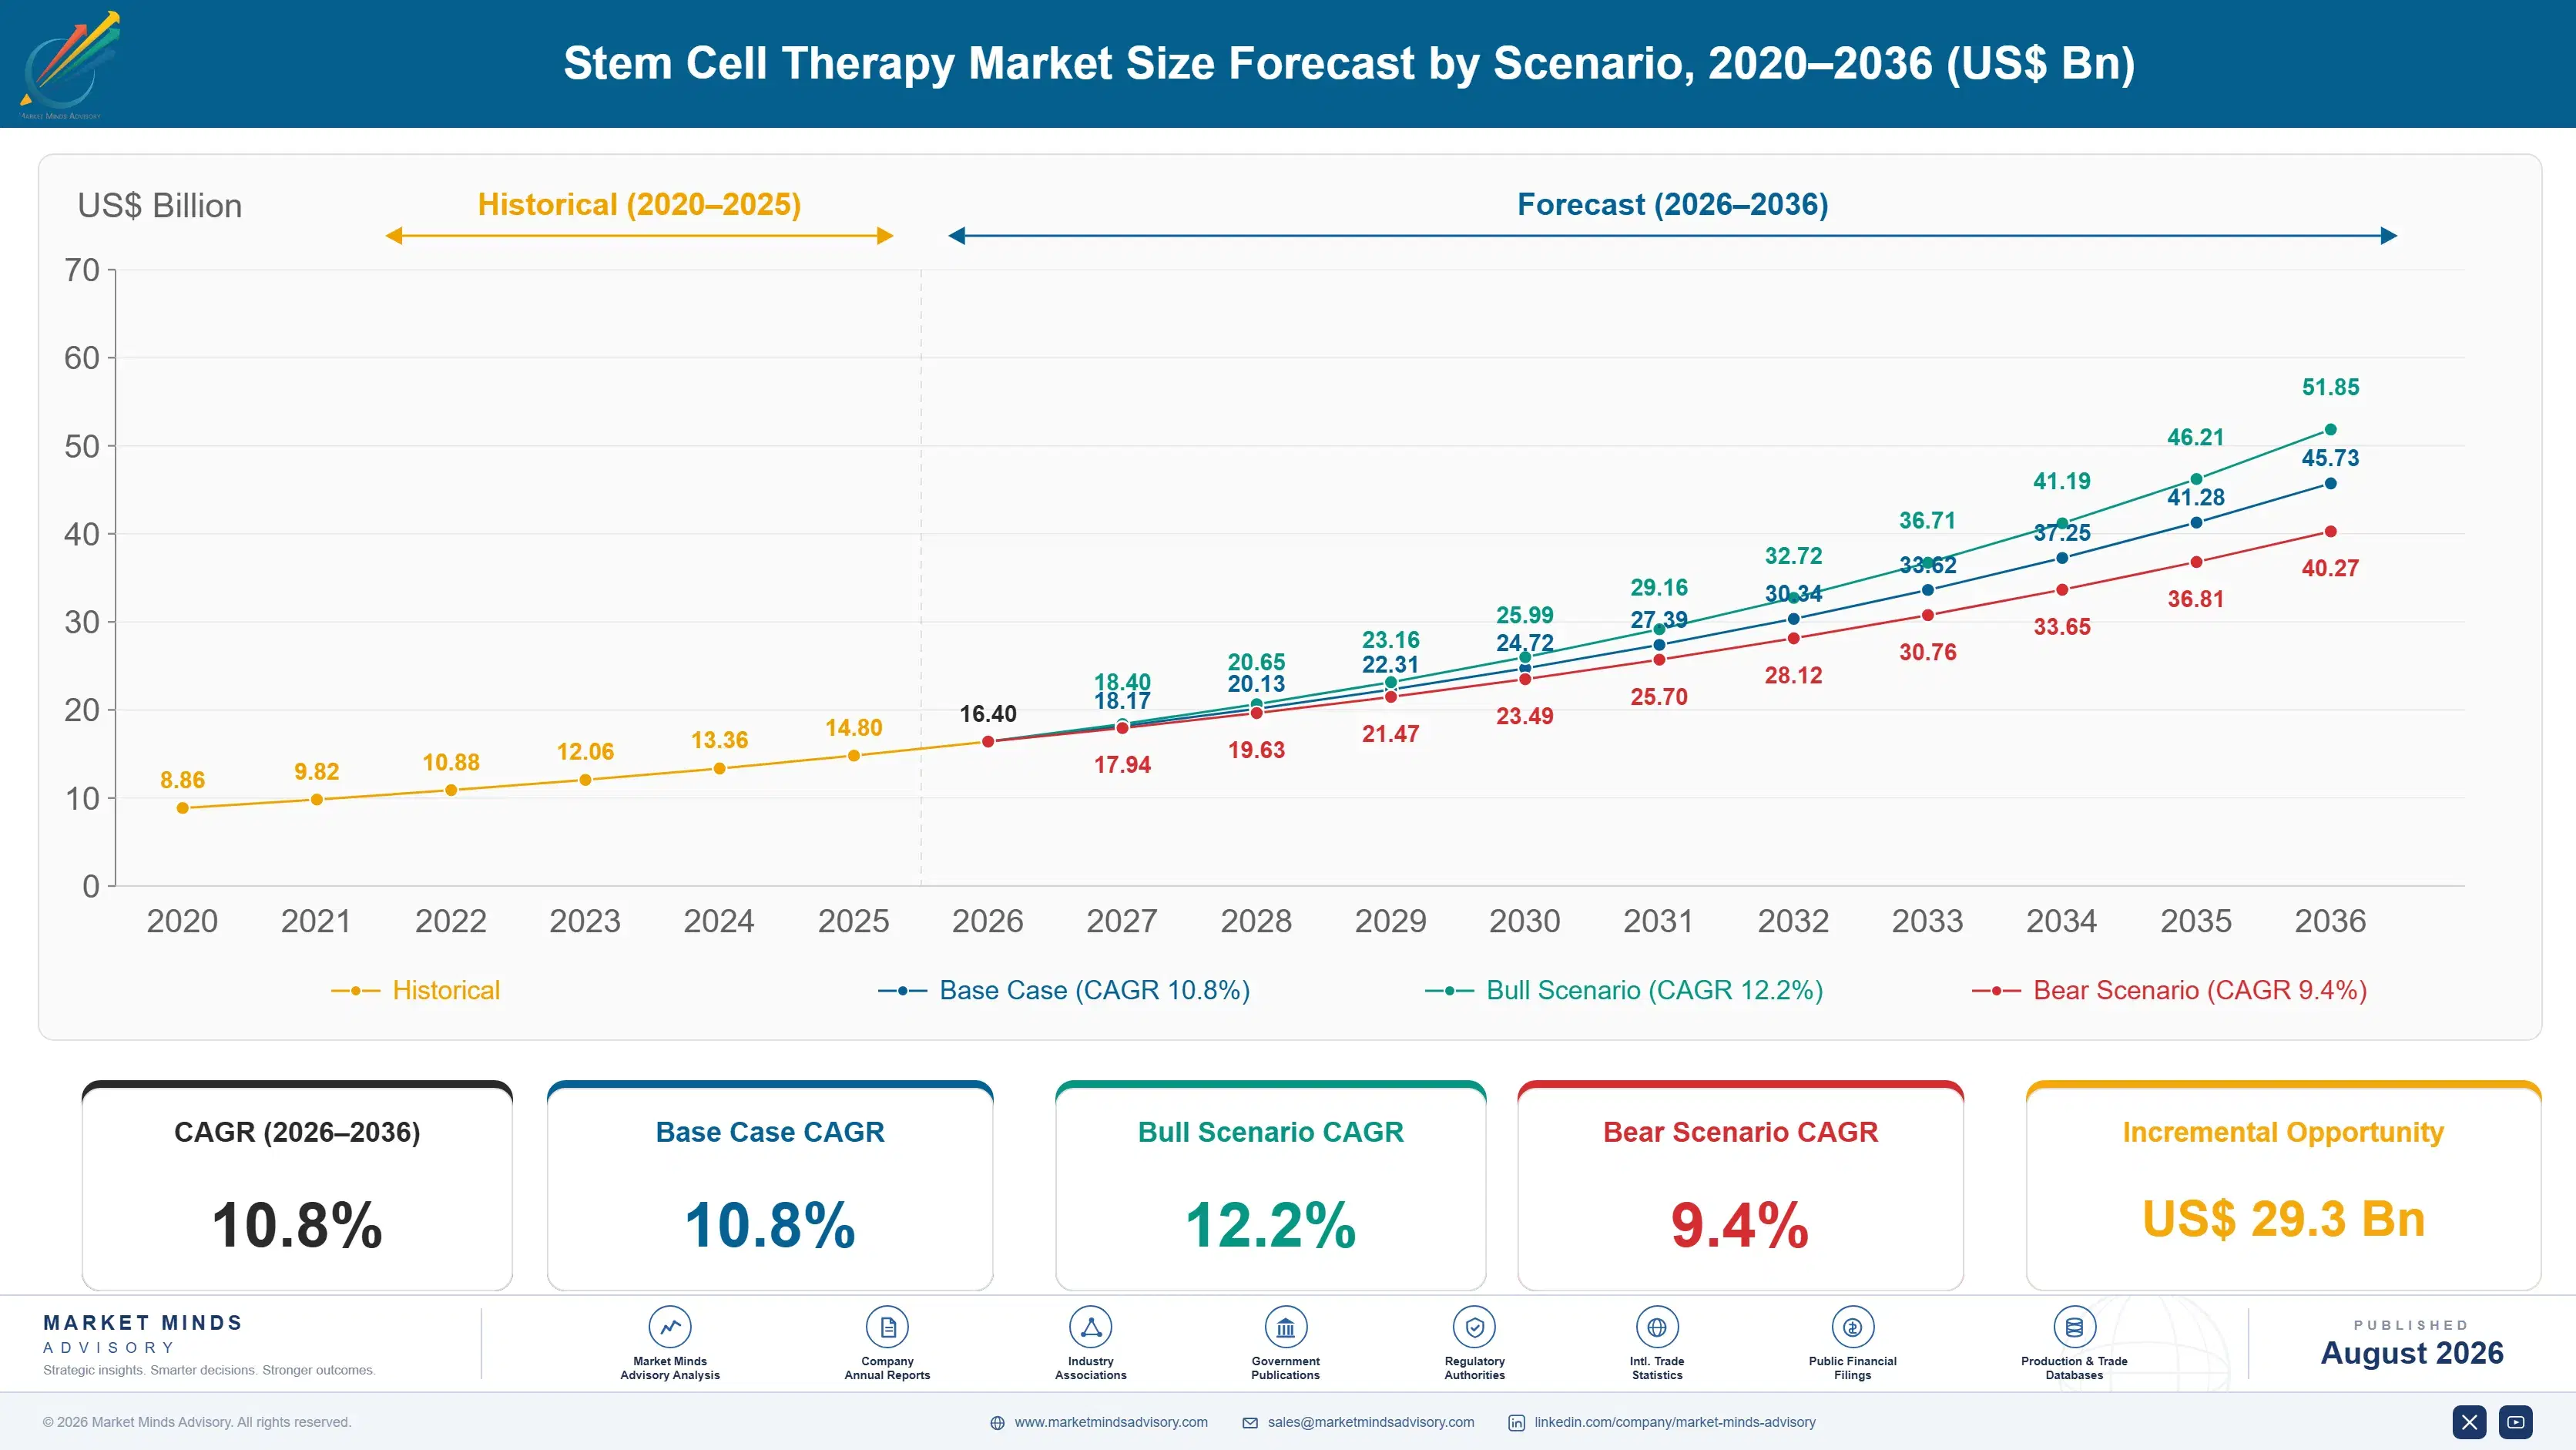
Stem Cell Therapy Market Forecast Scenarios

stem-cell-therapy-market-size-forecast-scenario-1787309045695
Between 2020 and 2025 the category grew at roughly 9.6 percent annually as the first wave of approved CAR-T and hematopoietic stem cell therapies expanded into new indications and geographies following initial regulatory clearances. Allogeneic platforms remained largely in clinical trials through most of that stretch, with autologous approaches dominating commercial revenue across nearly every major market.
The base case assumes 10.8 percent annual growth through 2036, anchored in three mechanisms: continued commercial expansion of approved autologous therapies into broader patient populations and additional treatment lines, accelerating allogeneic platform approvals as manufacturing and immune-compatibility challenges are solved by leading developers, and expanding clinical trial and manufacturing infrastructure across China driving new pipeline volume well ahead of the category average. Manufacturing scale and cost reduction increasingly determine which developers can achieve sustainable commercial pricing.
A bull case builds around allogeneic platforms achieving regulatory approval faster than expected as manufacturing challenges resolve ahead of schedule, pushing growth toward 12.2 percent. The bear case centers on reimbursement pressure and manufacturing cost overruns slowing commercial adoption, pulling growth down toward 9.4 percent if payers broadly resist premium pricing across most major markets.

Where Donor-Dependent Protocols Meet Scalable Cell Platforms

Stem cell therapy occupies an unusual position within regenerative medicine, where a genuinely established donor-dependent technique now competes directly against scalable, manufacturing-managed cell platforms for the same clinical specification line item. That shift means growth increasingly concentrates in whichever format a given developer's scalability requirement actually demands. Established clinical trial relationships remain the strongest defense smaller developers still hold against lar
MARKET CONCENTRATION (CR5)36%Revenue concentrated among leading global cell therapy developers
AVERAGE SELLING PRICE$285,000 per treatmentBlended price across hematopoietic and iPSC therapy formats
TOP PRODUCING COUNTRY SHAREUnited States, 29% of revenueReflects concentrated biopharma R&D and manufacturing capacity base
CAPACITY UTILISATION68%Cell manufacturing and processing suites run below full capacity
COMPONENT COST SHARE47% of production costCell processing media and cryopreservation dominate unit cost
ALLOGENEIC FORMAT PENETRATION24% of treated patientsShare of patients now receiving off-the-shelf allogeneic therapy
Competitive character centers on manufacturing scalability and multi-indication clinical breadth rather than pure unit price alone, since large biopharma developers increasingly specify platform format based on total commercial-scale value rather than production cost in isolation. Manufacturing platform depth increasingly determines which developers can even bid on large-scale health system contracts. Developers lacking documented allogeneic manufacturing capability increasingly struggle to even qualify for large multi-year supply agreements.
Over the next decade, iPSC adoption and off-the-shelf manufacturing depth will likely determine how much of the category's remaining growth potential converts into actual volume rather than continuing to split share between donor-dependent and allogeneic formats indefinitely. Smaller specialty transplant centers, where hematopoietic protocols still satisfy standard-of-care requirements, represent legacy formats' most defensible remaining stronghold industry-wide.
"Stem cell therapy used to mean waiting for a matched donor and hoping the timeline worked. Now a developer wants a frozen, off-the-shelf product ready the day a patient needs it, and that single requirement has rewritten who leads the category."
Director, Regenerative Medicine and Cell Therapy Practice · MMA Regenerative Med

Market Trends

iPSC Platforms Displace Donor-Dependent Protocols in Scalable Indications

Biopharma developers increasingly specify induced pluripotent stem cell platforms over conventional donor-dependent protocols for their flagship regenerative medicine pipelines, converting manufacturing specifications well ahead of any regulatory mandate requiring the switch specifically. Manufacturing-scalability requirements at major biopharma developers increasingly extend into platform choices, giving development teams formal internal justification for pursuing a meaningful capital premium that previous cost-only development criteria would have rejected outright. Developers with established iPSC capability report pipeline investment from scalable-indication accounts growing meaningfully faster than donor-dependent programs, reflecting a genuine shift rather than simple marketing repositioning.
Market Impact: Adds 5% annual baseline treatment d
Multi-Indication Clinical Evidence Reshapes Platform Investment Decisions

Health systems increasingly require multi-indication clinical evidence bundled with cell therapy platforms before a developer can even enter their approved treatment protocol list, pushing manufacturers to secure broader clinical trial capability well ahead of broader industry adoption of similar requirements across the category. Clinical research organizations and developers increasingly coordinate trial design directly, since a developer unable to demonstrate multi-indication efficacy risks losing approved-treatment status with major health system accounts entirely. This dynamic is consolidating demand around developers with dedicated trial capability, favoring larger companies over smaller regional developers offering only single-indication commodity formats.
Market Impact: Adds 7% annual manufacturing-driven

Market Opportunities and Growth Drivers

Global Regenerative Medicine Investment Sustains Baseline Demand

Global regenerative medicine investment continues expanding steadily across both developed and emerging biopharma markets, and a meaningful share of that investment still requires stem cell therapy platforms regardless of which specific cell type a given developer ultimately selects for its treatment pipeline. Health systems report that stem cell therapy remains the preferred approach specifically for degenerative and hematologic conditions that alternative treatment modalities handle less definitively than regenerative techniques built for tissue and immune system reconstitution. This baseline demand floor supports steady volume even as platform choice continues shifting within the category.
Market Impact: Delays roughly 15% of launches

Cell Therapy Manufacturing Capacity Expands Across South Asia

Cell therapy manufacturing capacity continues expanding meaningfully across India and other South Asian markets, driven by both domestic biotech investment growth and multinational biopharma developers building regional manufacturing capacity to serve rapidly growing patient populations more efficiently. Developers report that platform specification decisions for new manufacturing facilities increasingly default toward allogeneic capability from the outset rather than donor-dependent-only equipment, an advantage that favors developers with established regional clinical trial networks over new entrants lacking comparable local support. This manufacturing-driven volume growth substantially exceeds the modest growth rates typical of mature developed biopharma markets elsewhere.
Market Impact: Adds roughly 41% cost premium curre

Market Restraints and Challenges

Regulatory Approval Timeline Uncertainty Delays Platform Investment

Cell therapy regulatory approval pathways remain lengthy and outcome-uncertain across major healthcare regulators, and developers facing unpredictable approval timelines frequently delay committing capital toward new manufacturing platforms until regulatory clarity stabilizes enough to justify the investment confidently. The root cause is that platform conversion requires meaningful upfront capital that smaller developers cannot easily absorb during uncertain approval periods without straining constrained development budgets considerably. Developers are responding by pursuing phased regulatory pathways and expanded-access programs rather than requiring full commercial approval before generating any revenue. Full conversion timelines vary considerably by developer size.
Market Impact: Adds 18.6% annual iPSC segment dema

Manufacturing Cost Premium Slows Broader Conversion

Allogeneic and iPSC-derived therapies still cost meaningfully more per treatment than conventional donor-dependent protocols, a price gap that continues narrowing but has not yet closed enough to make conversion economically self-justifying without a specific scalability requirement driving the switch. The root cause is that off-the-shelf manufacturing and cryopreservation infrastructure remain a smaller developer base than donor-dependent processing built up over decades, keeping allogeneic costs elevated until production scale catches up with growing demand. Developers are responding by investing in expanded manufacturing capacity to close that cost gap faster than organic demand would achieve.
Market Impact: Affects protocol approval for 25%
3 additional market trends, 4 additional growth drivers, and 2 additional restraints and challenges are covered in the full report. Contact sales@marketmindsadvisory.com to access the complete intelligence.

Segment CAGR and Growth Architecture

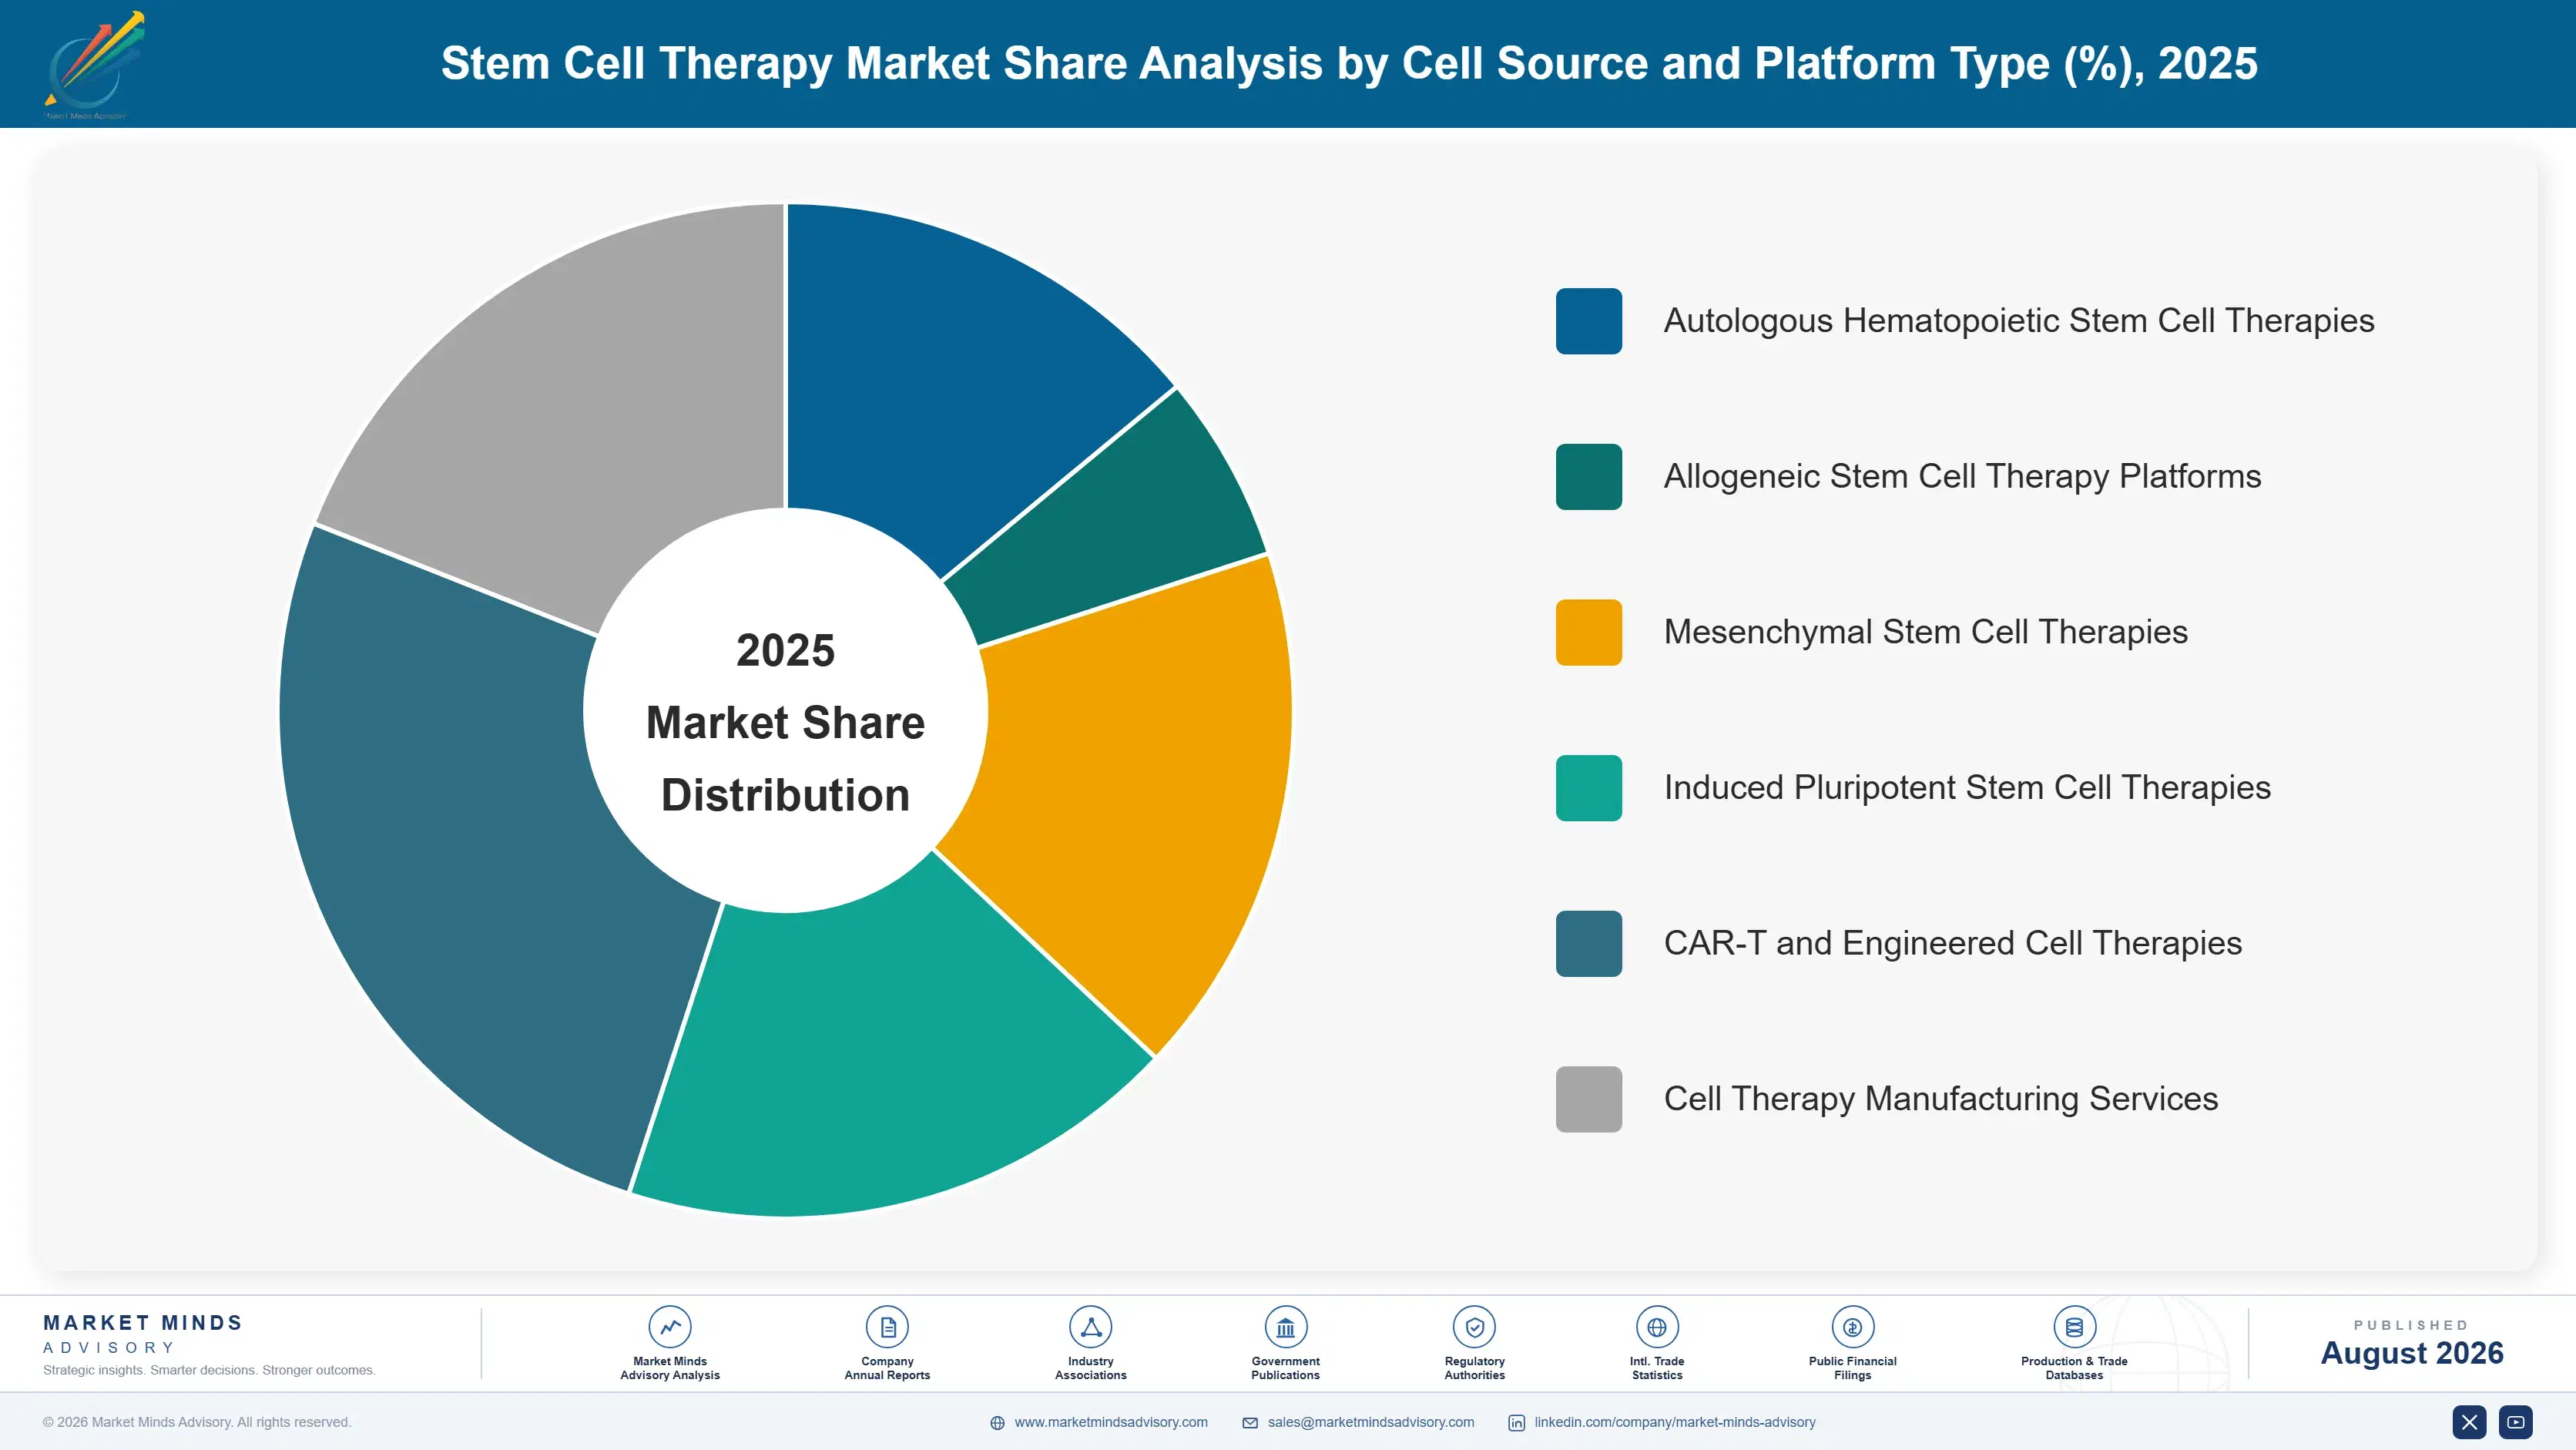
MMA segments the stem cell therapy market by cell type, distinguishing hematopoietic, mesenchymal, induced pluripotent, embryonic, adipose-derived, and neural stem cell therapy because each carries distinct manufacturing and regulatory qualification requirements used across hematologic and solid-tissue indications alike. used across academic institutions and commercial biopharma developers of widely varying scale, funding levels, and clinical trial ambitions worldwide.
stem-cell-therapy-market-market-share-analysis-1787309046289

Induced Pluripotent Stem Cell (iPSC) Therapy

iPSC therapy is growing fastest as biopharma developers with formal manufacturing-scalability requirements convert away from conventional donor-dependent protocols toward platforms offering off-the-shelf availability and broad indication reach simultaneously. Developers with established iPSC manufacturing capability and reprogramming expertise capture disproportionate share, since that capability requires considerable investment that smaller regional developers generally cannot justify without confidence in sustained pipeline growth from major biopharma accounts. Manufacturing-scalability requirements at major developers increasingly extend into platform specifications, giving development teams formal internal justification for pursuing a meaningful capital premium that previous cost-only development criteria would have rejected outright. This segment commands meaningfully higher per-treatment pricing than commodity donor-dependent formats given its specialized manufacturing and platform investment.
CAGR 18.6%

Neural Stem Cell Therapy

Neural stem cell therapy forms the second-fastest-growing segment, offering targeted central nervous system regeneration capability that appeals to developers pursuing indications including stroke recovery, spinal cord injury, and neurodegenerative disease where alternative treatment modalities offer limited restorative potential for damaged neural tissue. Developers increasingly develop neural stem cell formulations optimized for targeted delivery and engraftment, deepening technical relationships with academic medical centers that favor established developers over new entrants lacking comparable neurological trial investment and documentation. This segment benefits from genuine differentiation within the broader stem cell category itself, since neural formats target central nervous system indications specifically rather than the hematologic and orthopedic positioning that other cell types increasingly occupy.
CAGR 15.8%
Full segment breakdown across 6 segments available in the complete report.

Regional Architecture and Country Demand Map

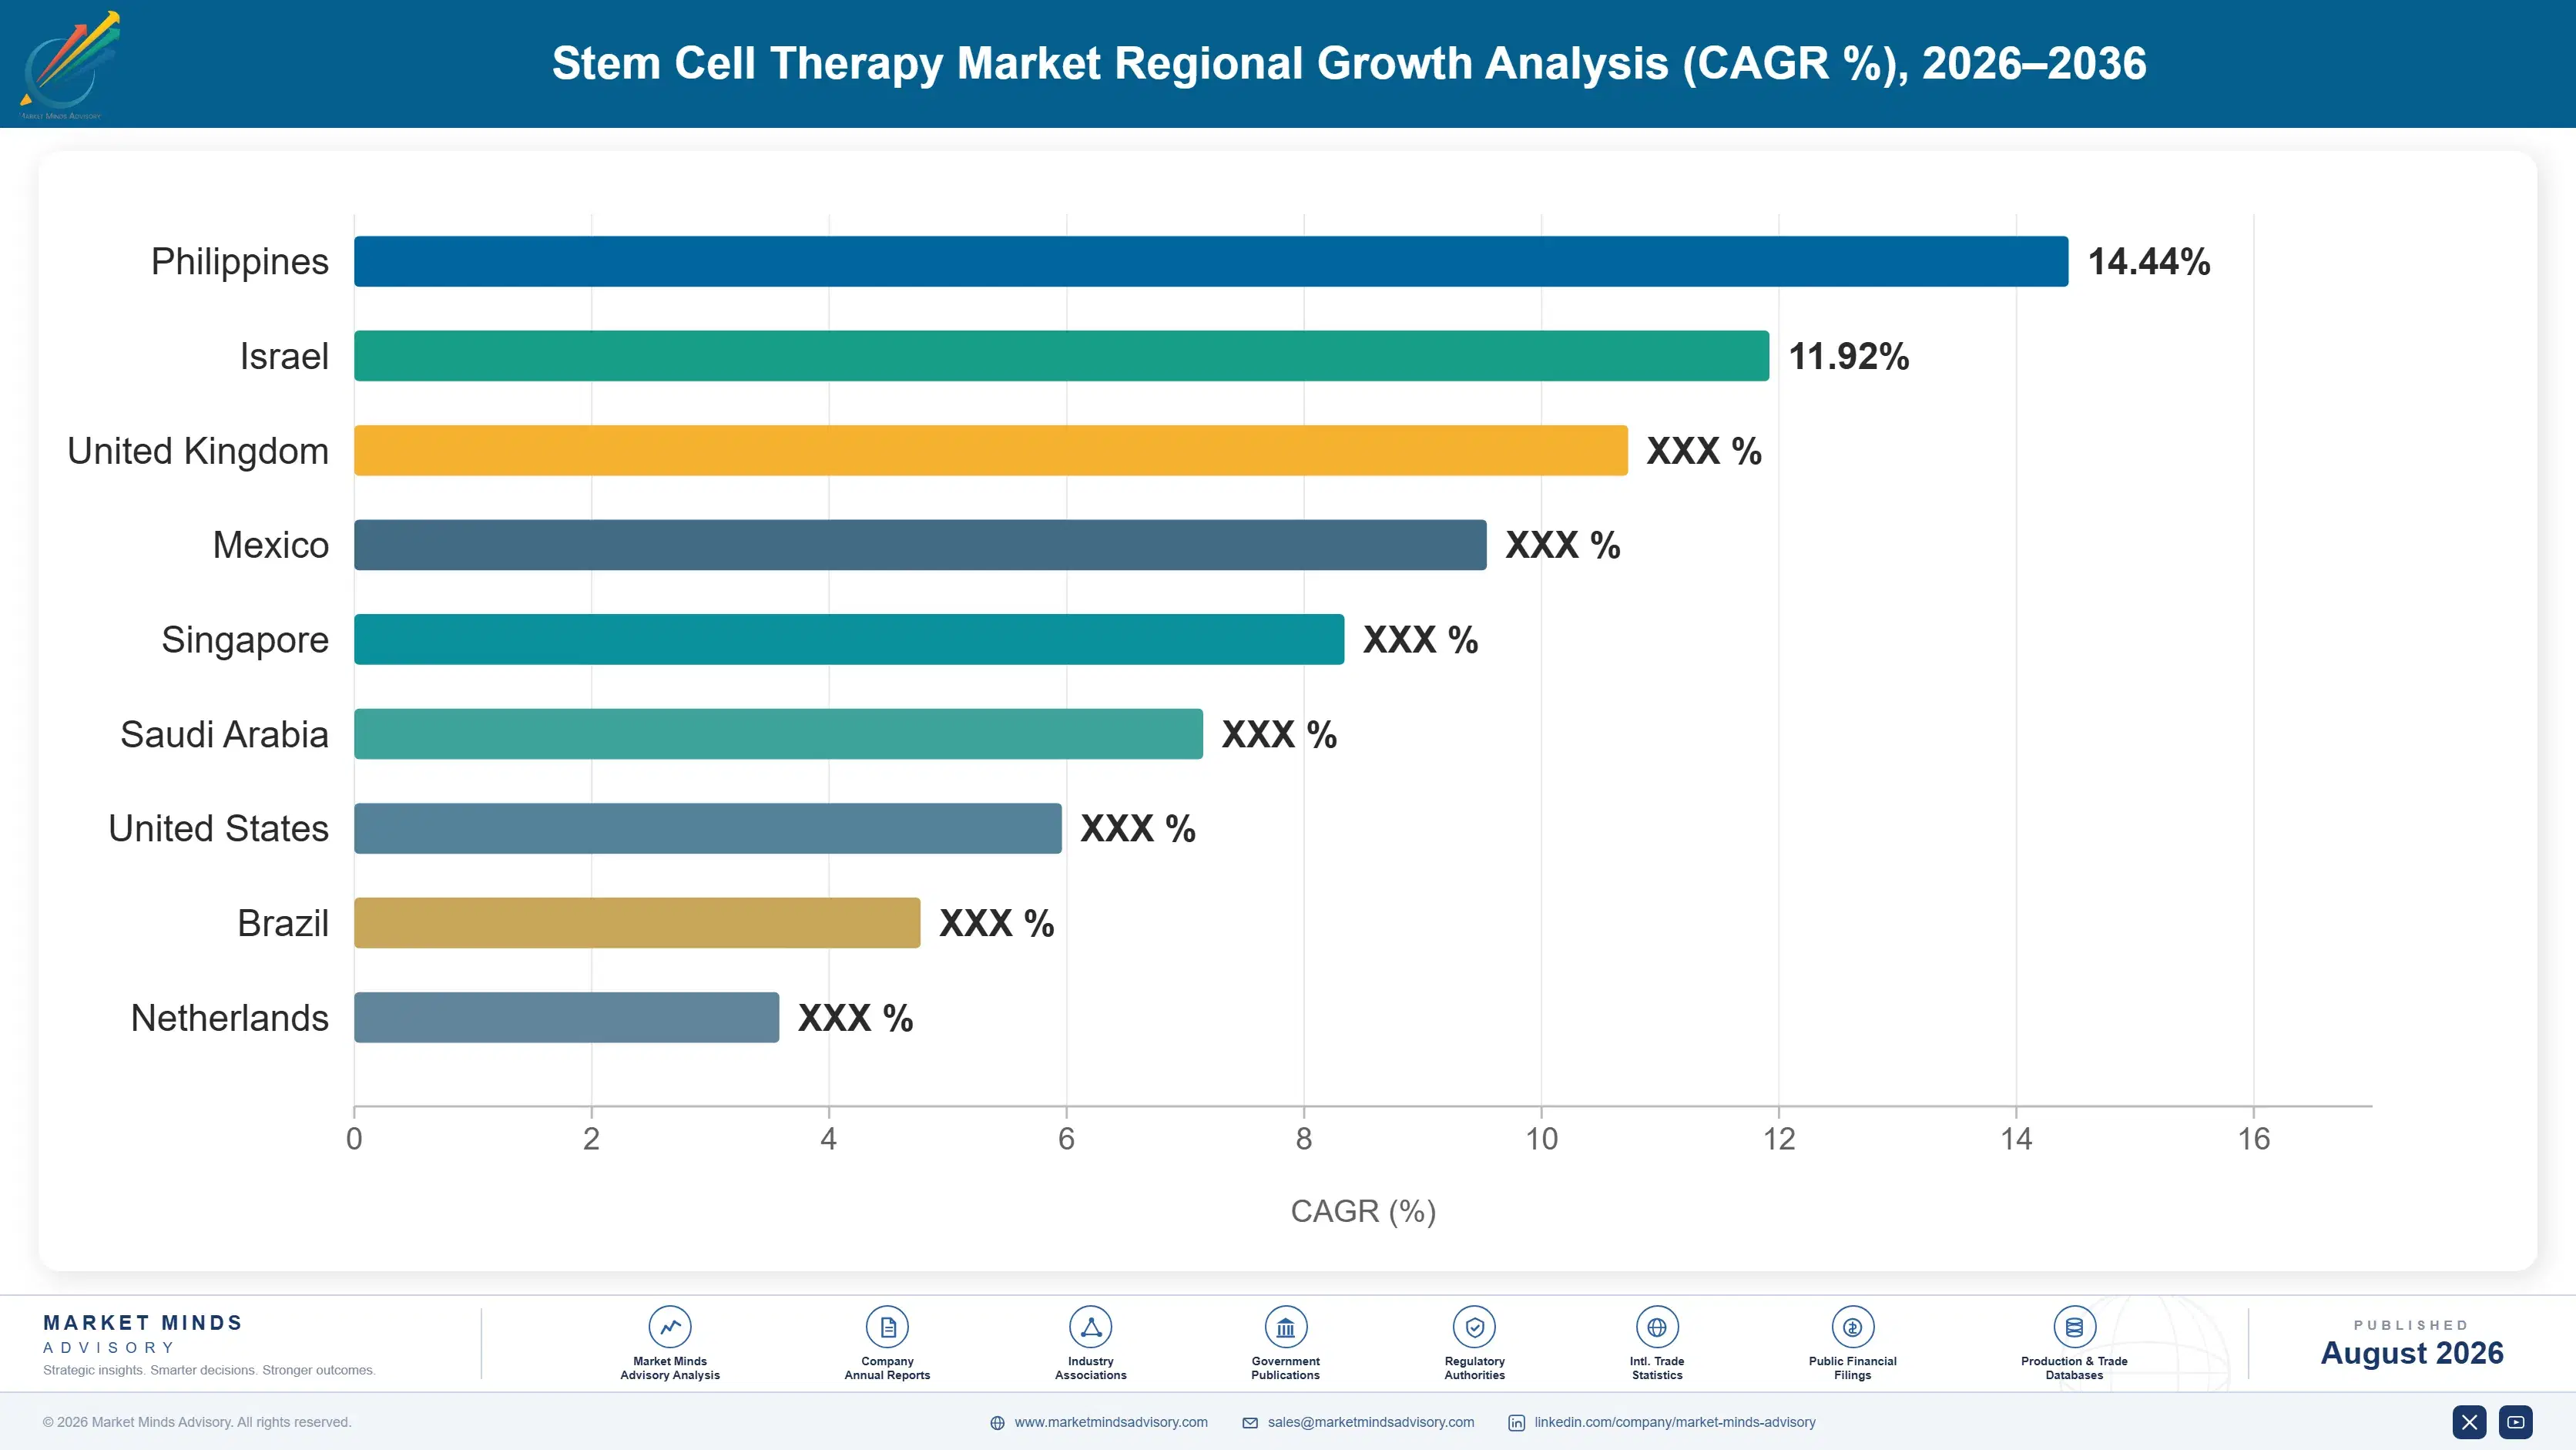
North America holds the largest share on its concentrated biopharma R&D and regulatory approval base, while Western Europe follows on established clinical trial infrastructure. South Asia and Pacific is growing fastest as cell therapy manufacturing capacity expands. Overall demand keeps tracking global biopharma investment growth closely.

North America

United States biopharma developers anchor North American demand, with iPSC platform adoption accelerating meaningfully across major regenerative medicine pipelines given the region's concentrated biotech R&D and FDA regulatory pathway experience. Canada's smaller market follows broadly similar consumption patterns, benefiting from close clinical collaboration integration with United States biopharma networks given cross-border regulatory alignment and shared research funding frameworks. Manufacturing-scalability-driven allogeneic adoption has accelerated meaningfully among large biopharma developers with formal commercial-scale commitments, though donor-dependent protocols still dominate smaller academic transplant programs across most of the region. Growth here trails East Asia and South Asia because the region's cell therapy development base is comparatively mature and already largely built out. overall.
Share: 31% | CAGR: 13.4% (2026 to 2036)

Western Europe

Germany, the United Kingdom, and France lead Western European demand through well-developed biopharma research bases and some of the world's most established clinical trial networks, pushing iPSC and allogeneic adoption faster here than in most other regions globally. European Medicines Agency advanced therapy regulation increasingly favors validated allogeneic platforms over conventional donor-dependent alternatives, adding regulatory tailwind that supports category conversion across most member states specifically. The region has also seen a fast donor-to-allogeneic substitution rate, reflecting its advanced regulatory environment and sophisticated academic research base. Growth trails the global average because the region combines both meaningful format substitution pressure and a mature, thoroughly penetrated biopharma development base. Domestic manufacturing capacity continues expanding to meet rising demand.
Share: 23% | CAGR: 11.3% (2026 to 2036)
Regional intelligence for 5 additional markets available in the complete report: East Asia, South Asia and Pacific, Latin America, Middle East and Africa, Eastern Europe. Contact sales@marketmindsadvisory.com.
stem-cell-therapy-market-country-cagr-analysis-1787309046837

Where Developers Can Defend Margin and Grow

Margin defense in stem cell therapy depends heavily on expanding iPSC manufacturing capacity, securing multi-indication clinical evidence depth, and locking health system contracts around off-the-shelf availability that thin commodity margins cannot easily replicate on their own without meaningful investment. The four levers below target distinct points fragmented regional developers cannot easily replicate on their own.

iPSC Manufacturing and Capacity Expansion Program

Scalability-driven demand for iPSC therapy continues outpacing industry-wide manufacturing capacity additions, creating a genuine premium pricing opportunity for developers investing directly in expanded reprogramming and manufacturing capacity ahead of broader industry adoption across the category and its major biopharma customer base. Developers building dedicated iPSC capacity now capture premium pricing from scalability-conscious biopharma customers before capacity constraints ease and competitive pressure intensifies across the segment considerably. Early capacity investors report capturing roughly 26 percent more iPSC volume share than competitors still dependent on constrained third-party manufacturing capacity. This head start compounds as certification becomes a baseline market requirement.
Market Impact: Captures roughly 26% more iPSC segm

Multi-Indication Clinical Trial Partnership and Development Program

Health systems increasingly require multi-indication clinical evidence bundled with cell therapy platforms, and developers investing directly in long-term clinical research partnerships capture approved-treatment status that translates into meaningful order volume from the largest, most evidence-focused health system accounts. Developers with secured trial partnerships report winning roughly 23 percent more large health system contract bids than competitors lacking comparable trial agreements and clinical documentation. Building this evidence portfolio requires sustained research investment, but it captures customers with meaningfully higher switching costs once protocols are calibrated to specific validated indications. That reliability increasingly separates preferred developers from the rest.
Market Impact: Wins roughly 23% more large health

Multi-Year Fixed-Price Manufacturing Component Supply Contracts

Cell processing media and cryopreservation component costs fluctuate meaningfully with broader biotech supply chain commodity market cycles, and developers without long-term supply agreements absorb that volatility directly into thin margins during tight-supply periods that recur unpredictably across the category entirely. Developers negotiating multi-year fixed-price contracts protect margin predictability even during industry-wide price spikes exceeding 22 percent, a stability smaller regional competitors without comparable purchasing scale genuinely cannot replicate independently across their own supply relationships. This approach also improves supply reliability during tight-capacity periods. Manufacturers without such agreements face repeated renegotiation cycles.
Market Impact: Protects margin during roughly 15 t

Expanded-Access Program for Smaller Health Systems

Smaller regional health systems increasingly want access to iPSC and allogeneic platforms but lack the patient volume to justify dedicated development investment on their own, and developers building expanded-access and network partnership programs that spread trial costs across multiple smaller systems can capture business previously lost to larger funded competitors specifically. Companies successfully demonstrating shared-access models capture referral volume from smaller systems that competing formats have not yet fully addressed, a genuinely underserved segment current dedicated-development models cannot efficiently serve. Early program adopters report expanding addressable smaller-system accounts by roughly 19 percent.
Market Impact: Expands smaller-system accounts by

Who Controls the Margin Pool

Five developers, evaluated here on estimated global revenue, hold roughly thirty-six percent of the stem cell therapy category between them, a meaningfully consolidated structure reflecting how strongly manufacturing platform depth and clinical trial scale favor established developers over emerging competitors. The gap between the largest developers and the long tail of regional competitors is substantial on pure platform capability, and iPSC manufacturing depth and multi-indication evidence inc
Current competitive activity centers on three fronts: iPSC manufacturing capacity expansion to capture scalability-driven demand, multi-indication clinical trial partnerships to defend health system contracts, and expanded-access programs to capture budget-constrained smaller accounts. Larger developers are also acquiring smaller regional competitors to expand platform and clinical coverage without building new manufacturing capacity from scratch entirely. Consolidation among smaller regional developers is also accelerating as trial costs rise.

Pressure is building from iPSC and neural stem cell specialists steadily expanding share across scalability-focused biopharma accounts, a threat concentrated specifically in the highest-value product tiers where manufacturing scalability matters more than pure unit price. Ranking shifts are most likely among smaller regional developers unable to fund manufacturing investment, several of which MMA expects to exit or consolidate within the next few years.
stem-cell-therapy-market-company-positioning-matrix-1787309047369

Competitive Moat and Risk Dimensions

MESOBLAST LIMITED

Moat: Deep Mesenchymal Platform Base

Mesoblast maintains genuine depth in mesenchymal stem cell platform development spanning multiple indications and regulatory jurisdictions, giving it meaningfully broader clinical trial expertise and manufacturing scale than competitors who entered the category more recently. Customers value that breadth when evaluating long-term treatment reliability and regulatory track record.
MESOBLAST LIMITED

Risk: Narrower iPSC Platform Depth

Mesoblast's iPSC manufacturing capability remains comparatively less developed than dedicated iPSC specialists who built broader reprogramming expertise earlier, leaving it somewhat exposed in the fastest-growing segment where established iPSC developers hold meaningful technical head starts already. Closing that gap requires sustained investment competitors already committed years ago.
VERTEX PHARMACEUTICALS INCORPORATED

Moat: Deep Cell Manufacturing Platform Base

Vertex maintains genuine depth in stem-cell-derived islet cell manufacturing developed through significant commercial-scale investment, giving it meaningfully better ability to serve health systems seeking documented scalable manufacturing performance than competitors relying on less established platforms. That depth shortens qualification cycles competitors cannot easily match. Customers value that depth when facing complex regulatory submissions.
VERTEX PHARMACEUTICALS INCORPORATED

Risk: Narrower Multi-Indication Portfolio Depth

Vertex's stem cell therapy portfolio remains concentrated in a narrower set of indications than diversified competitors who built broader multi-indication capability earlier, leaving it somewhat exposed among health systems seeking a single supplier spanning multiple therapeutic areas. Closing that gap will require sustained investment over time.

Players Tracked

Prominent Players

Mesoblast Limited
Vertex Pharmaceuticals Incorporated
Fate Therapeutics, Inc.
Vericel Corporation
Athersys, Inc.

Other Key Players

Lineage Cell Therapeutics, Inc.
CRISPR Therapeutics AG
Celularity Inc.
Pluristem Therapeutics Inc.
ReNeuron Group plc
BrainStorm Cell Therapeutics Inc.
Cynata Therapeutics Limited
Cellular Biomedicine Group, Inc.
Novadip Biosciences
TiGenix NV
Takeda Pharmaceutical Company Limited
Bluebird bio, Inc.
CellSeed Inc.
Novartis AG
Gilead Sciences, Inc.

Recent Developments

MARCH 2025

Mesoblast Expands Manufacturing Capacity in New Jersey

Mesoblast completed an organic capacity expansion at its existing New Jersey facility, adding dedicated allogeneic manufacturing and quality testing capability to meet growing demand from health systems converting toward off-the-shelf platforms. Timeline details for the expansion remain forthcoming for now. Timeline details for the expansion remain forthcoming for now.
Signal: Reflects developers investing directly in
JUNE 2025

Vertex Signs Multi-Year Clinical Research Partnership Agreement

Vertex signed a multi-year clinical research partnership agreement with an academic medical center network to accelerate multi-indication trial validation across its cell therapy product line, becoming a preferred developer recommended directly to health systems with formal evidence requirements. The agreement includes joint development of future trial protocols as well.
Signal: Shows developers pursuing direct clinical
SEPTEMBER 2025

Fate Therapeutics Acquires Regional Manufacturer in Southeast Asia

Fate Therapeutics acquired a majority equity stake in a regional Southeast Asian cell therapy manufacturer, expanding its production footprint to serve the region's growing biotech research sector, which has become one of the fastest-growing demand pools within the broader category. Terms of the transaction were not disclosed publicly.
Signal: Signals established developers acquiring r

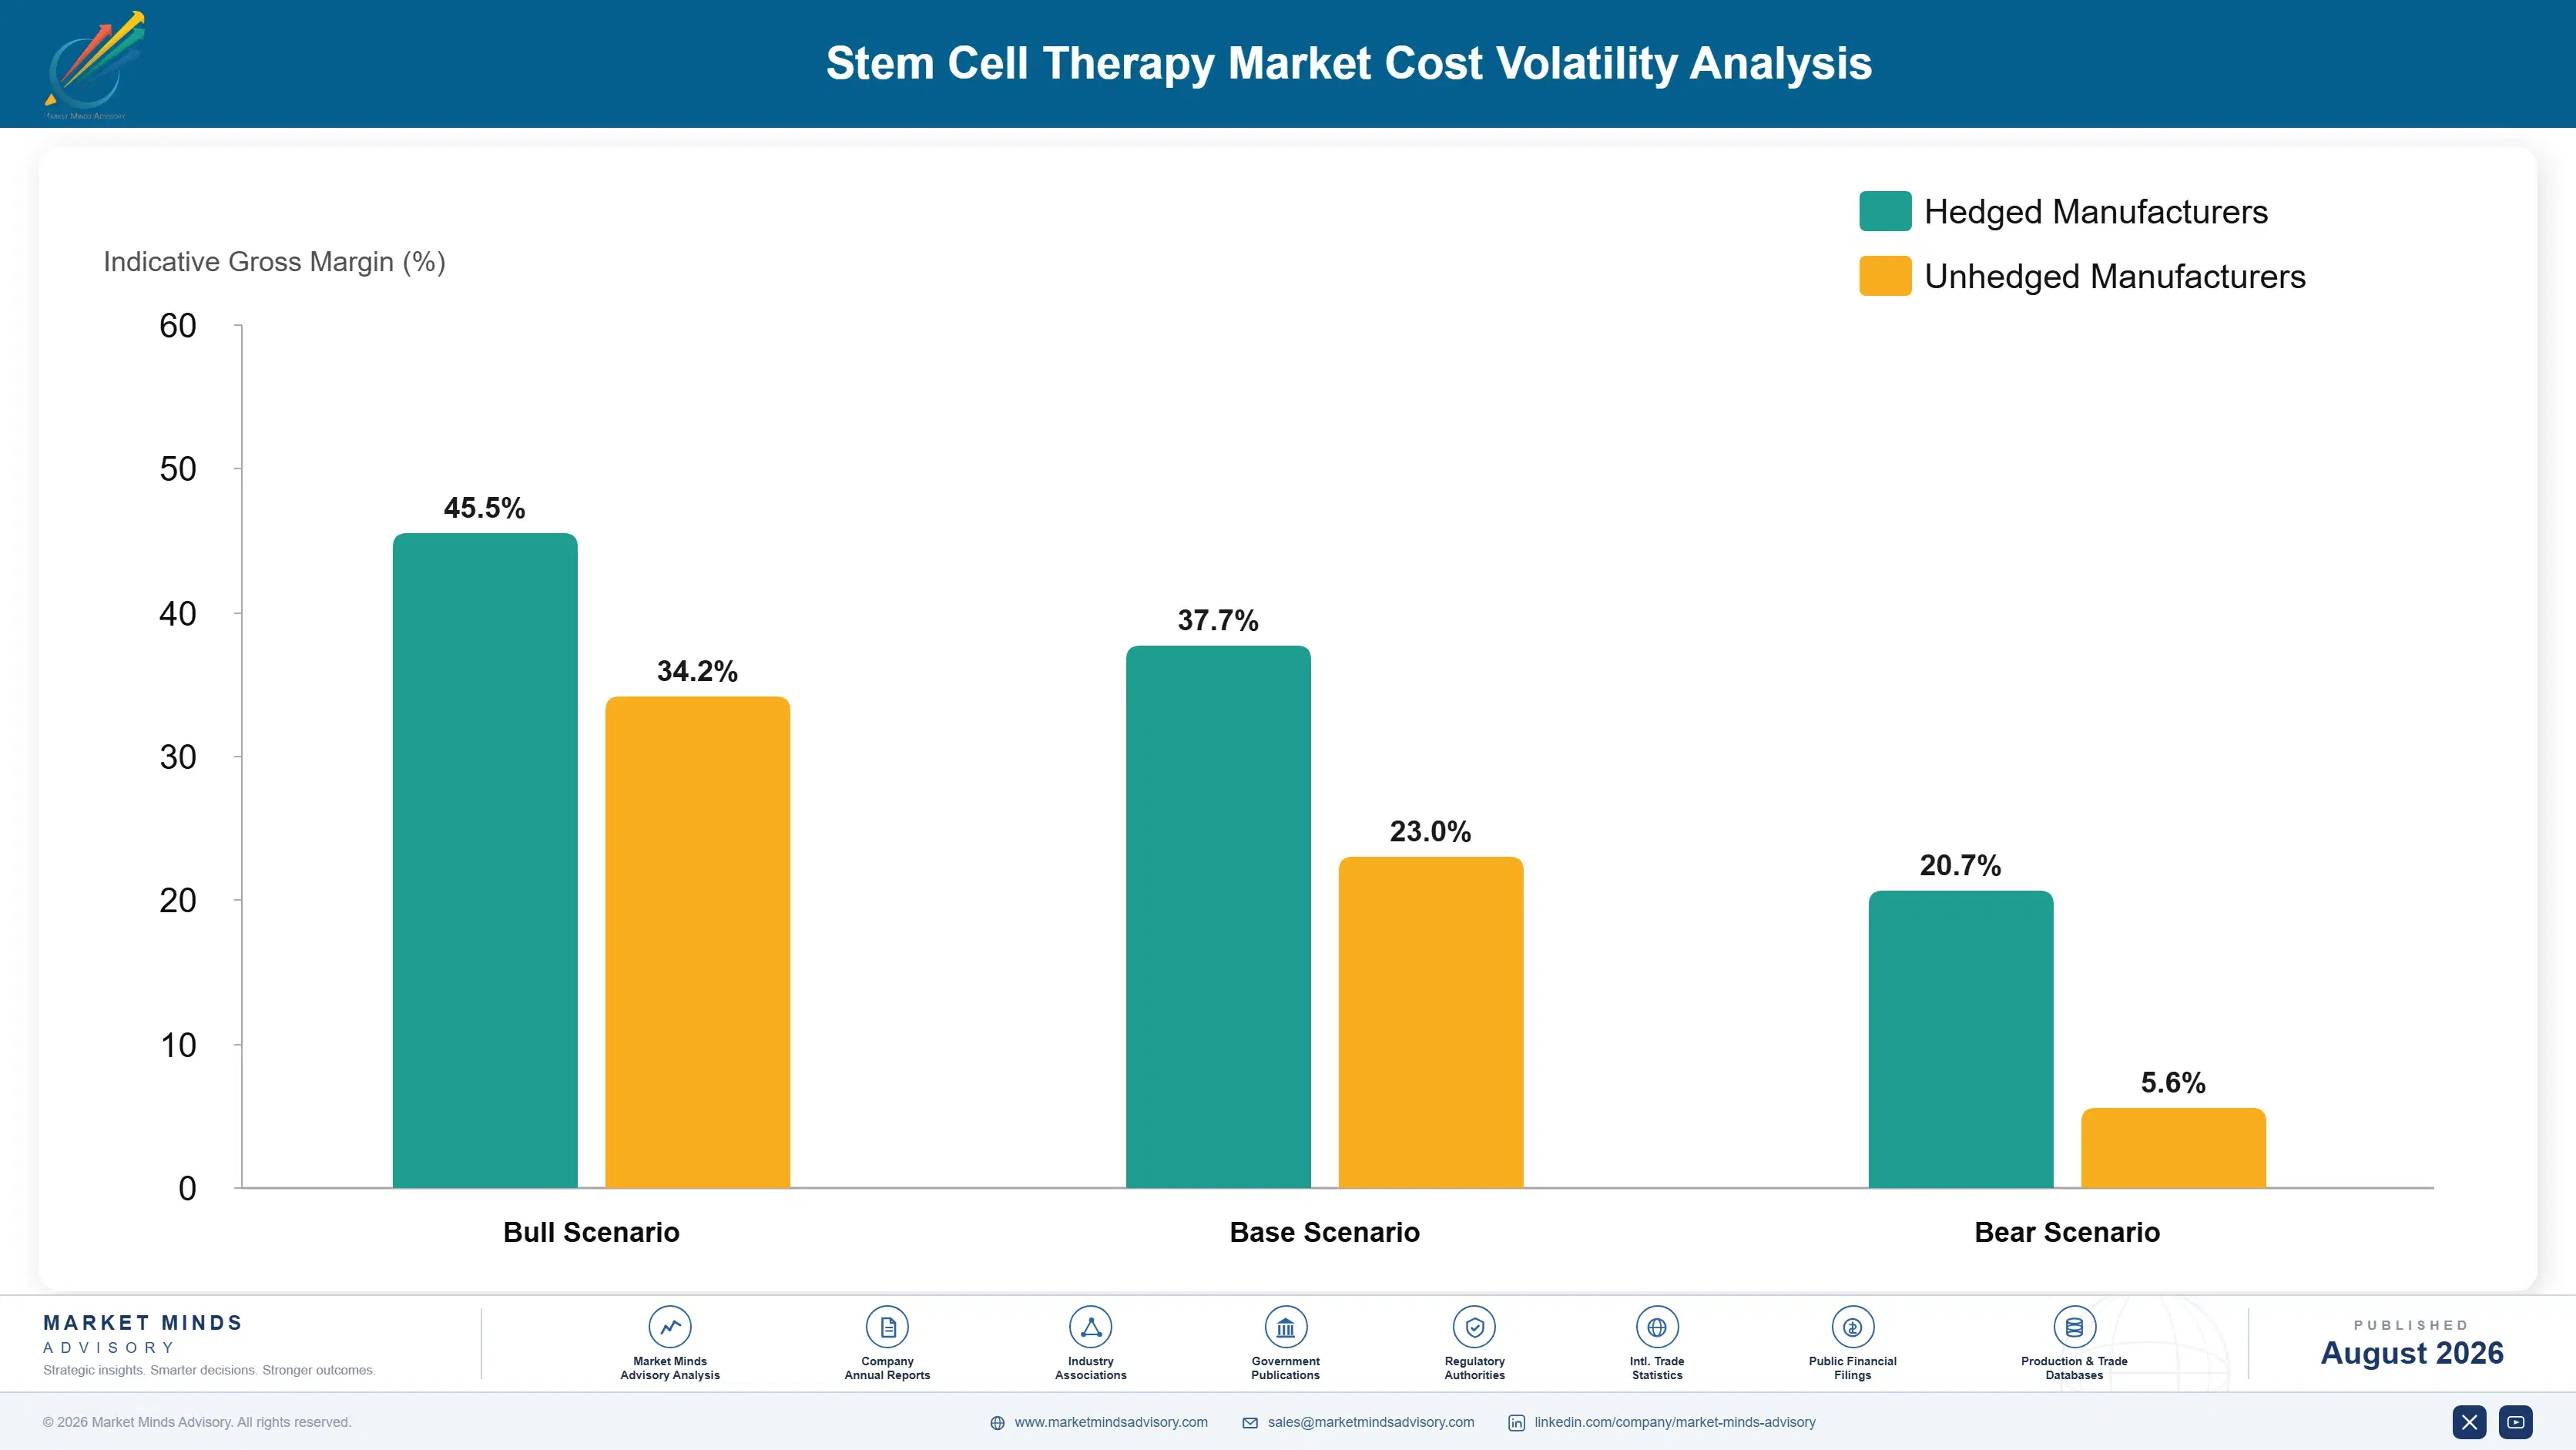
Cell Processing Media and Cryopreservation Component Exposure

Cell processing media and cryopreservation components together represent an estimated 42 to 52 percent of cost of goods sold for a typical stem cell therapy product, sourced from global biotech supply chain and specialty chemical production concentrated among a relatively small number of major component suppliers. This dual dependency leaves developers with limited substitution options when either component category faces disruption simultaneously.
Specialty cell culture media prices rose meaningfully during 2024 after global biotech supply chain capacity tightened following production constraints across several major producing regions, according to figures the EIA tracks for specialty biotech manufacturing input costs alongside broader industrial commodity conditions across domestic and internationally traded volumes. Smaller developers without long-term component contracts reported input cost increases exceeding 22 percent within two quarters, a shock larger integrated developers with hedged supply absorbed more comfortably.

Smaller regional developers without the purchasing scale to negotiate multi-year fixed-price component contracts absorb raw material volatility directly into thin margins, while the largest developers use long-term supply agreements spanning both component categories simultaneously. This gap compounds over time: undercapitalized developers either raise prices, risking volume loss to established competitors, or hold pricing and erode margin, a choice larger integrated developers rarely face.
stem-cell-therapy-market-cost-volatility-analysis-1787309047569

Multi-Year Fixed-Price Component Supply Contracts

Locking cell processing media and cryopreservation component procurement into two to four year fixed-price agreements with primary suppliers protects margin predictability during spot market volatility, though it requires accepting somewhat higher baseline pricing during calm periods, a trade-off larger developers with stronger balance sheets absorb more comfortably than smaller regional developers operating on thinner working capital margins.

Vertical Integration into Media Production

The largest developers are selectively integrating backward into cell culture media production, reducing dependence on open-market purchasing even though the capital investment required puts this option genuinely out of reach for smaller regional developers competing primarily on price and delivery proximity to their health system customers. This approach also improves supply reliability during tight-capacity periods.

Regional Component Sourcing Diversification Strategy

Shifting a portion of component procurement toward Southeast Asian and Eastern European producing regions reduces exposure to any single producing region's supply disruption or currency risk simultaneously, though this diversification requires meaningful supplier qualification investment that smaller developers often cannot justify. Early movers report meaningfully steadier input pricing overall. Fewer developers have made this shift industry-wide so far.

Portfolio Architecture for Margin Defence

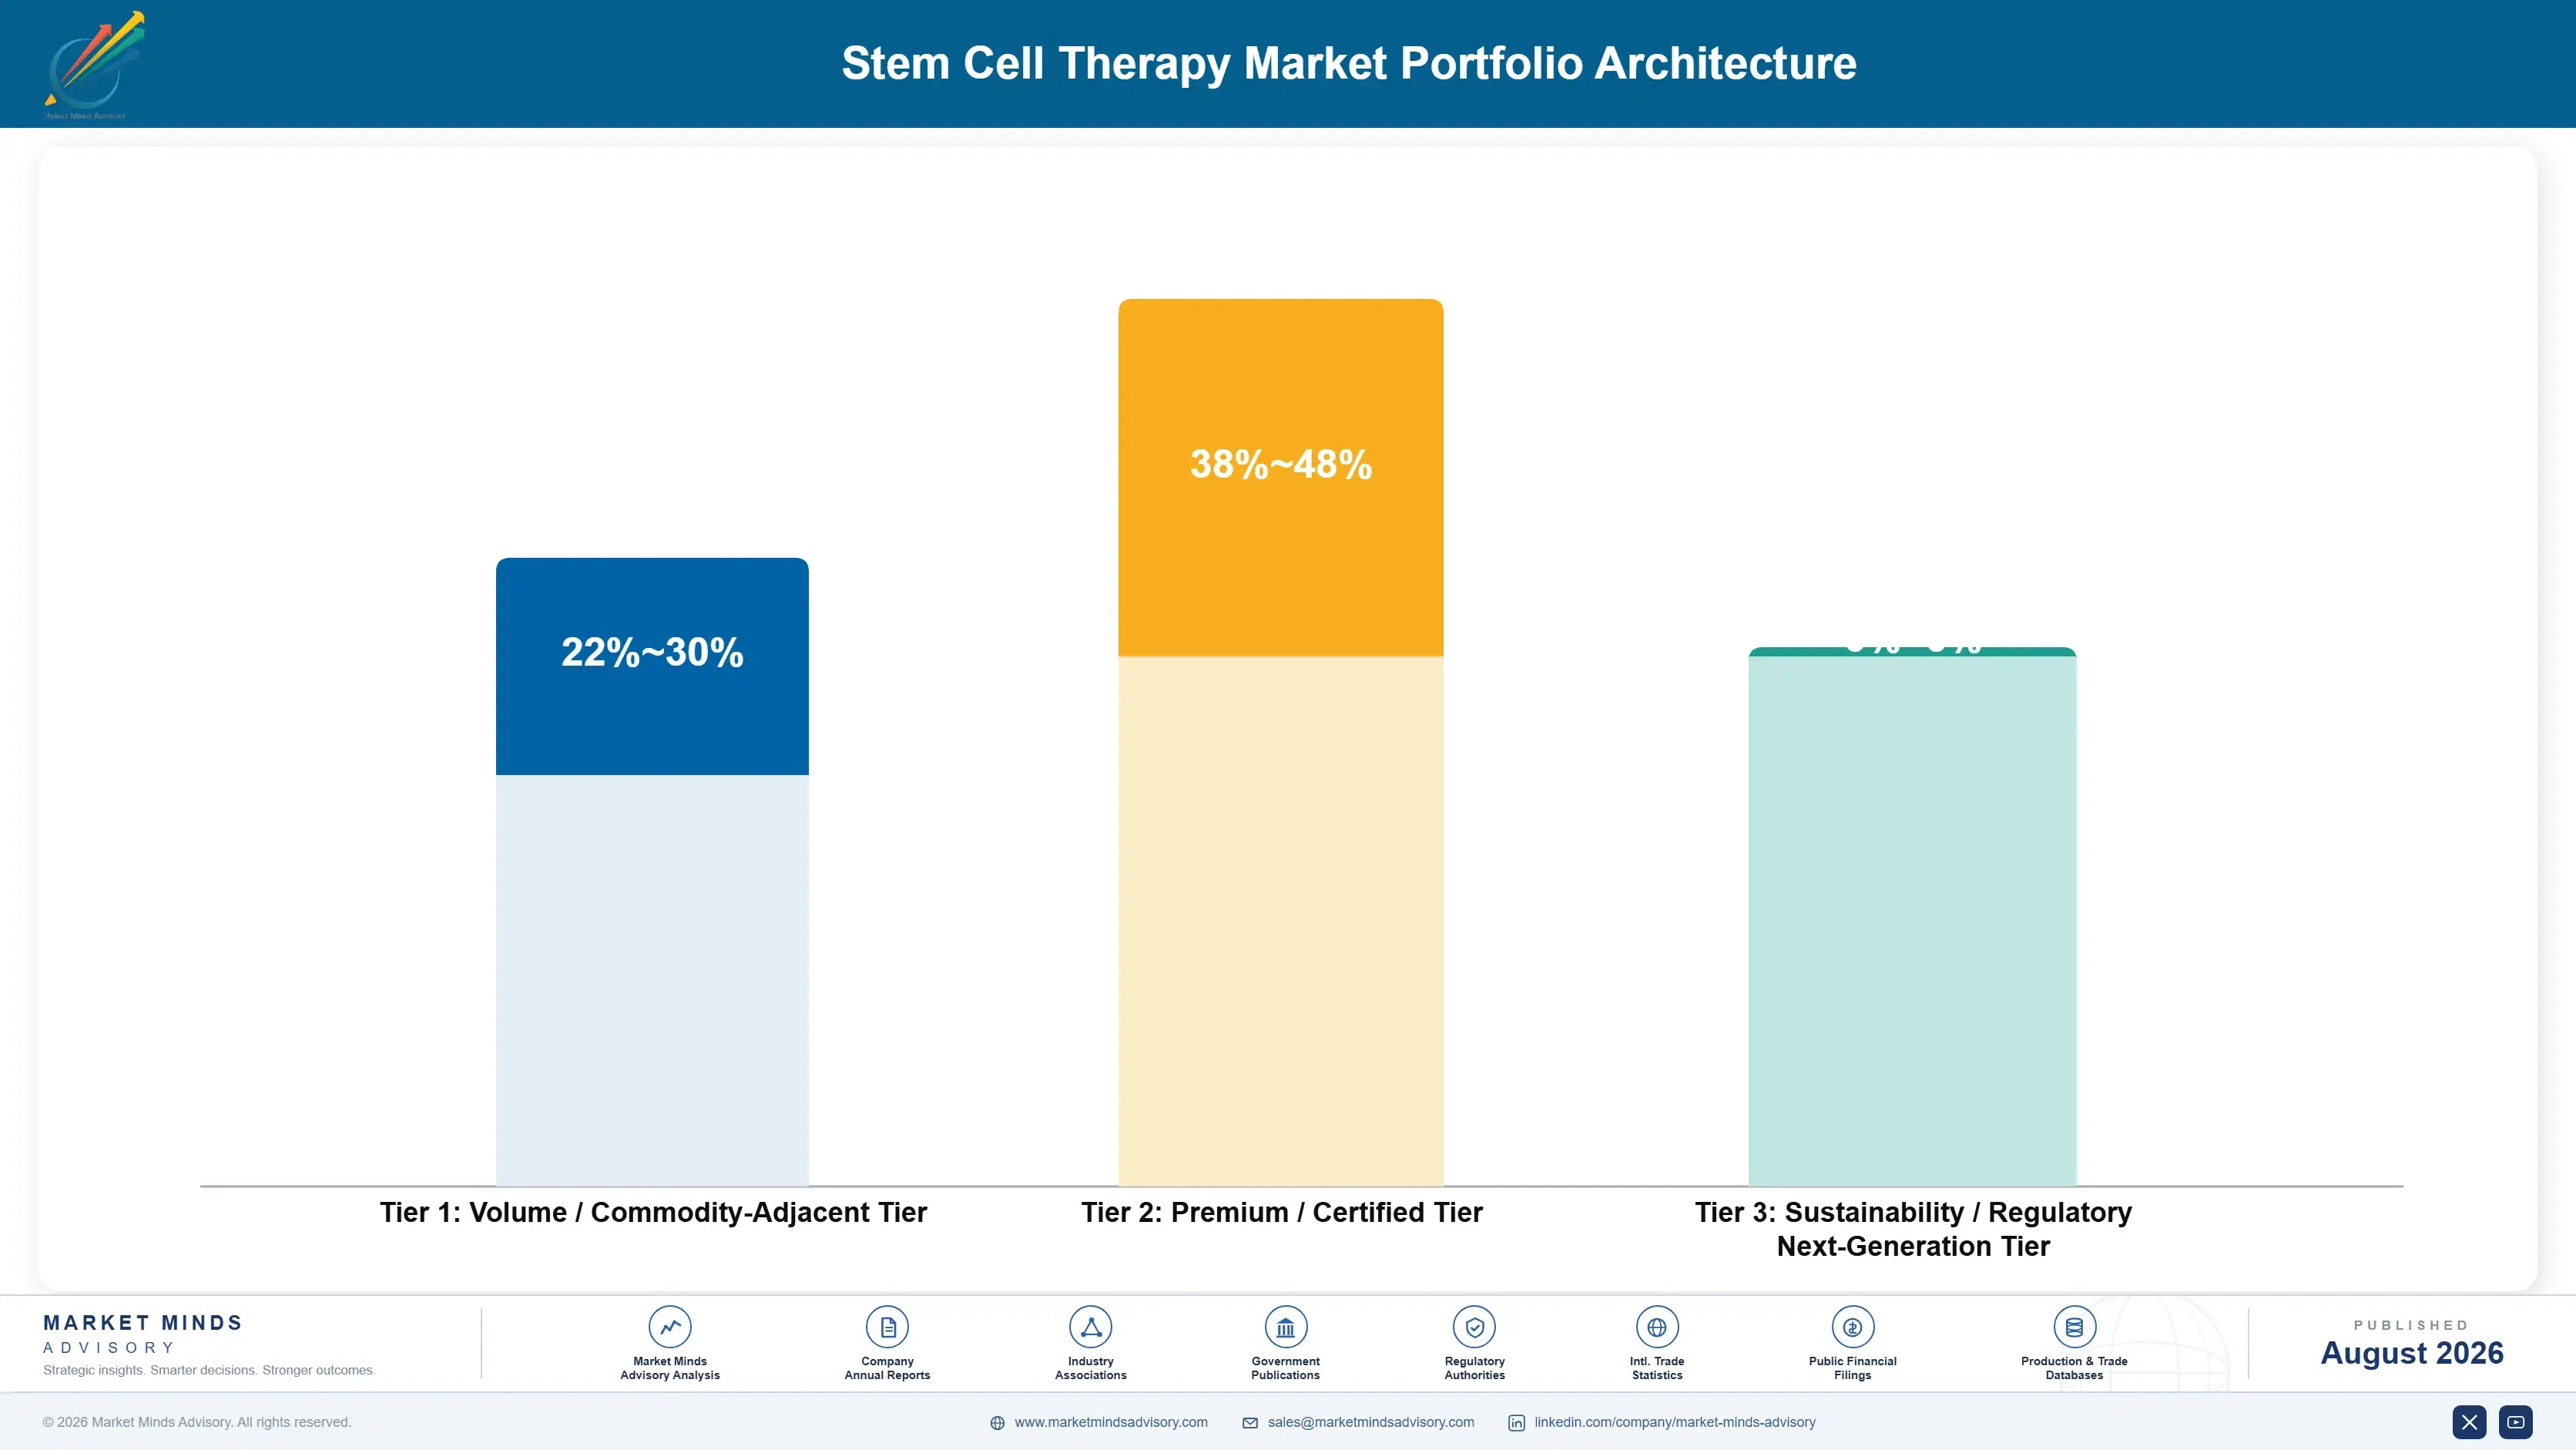
Stem cell therapy portfolios split cleanly into three margin tiers. Volume commodity-adjacent hematopoietic and donor-dependent protocols sold through competitive bidding to smaller transplant centers carry the thinnest margins but the highest treated-patient volume, competing primarily on price and availability rather than scalability credentials. Premium allogeneic and iPSC formats command meaningfully higher margins tied to manufacturing depth and clinical evidence rather than material cost a
The tension between commodity donor-dependent volume and premium allogeneic positioning shapes nearly every strategic decision developers make, from where to invest manufacturing capital, to which health system relationships to prioritize for joint clinical development. Chasing volume through commodity donor-dependent formats generates steady cash flow but exposes developers directly to substitution pressure from allogeneic alternatives, while over-indexing on premium allogeneic positioning limits addressable market size given how much smaller the truly scalability-driven biopharma base remains today. Developers unable to fund manufacturing investment risk sliding entirely into the lowest-margin commodity tier.

High-value margin pools concentrate specifically in iPSC and neural formats, both growing faster than the broader category and commanding pricing that neither commodity hematopoietic nor standard mesenchymal formats currently achieve at comparable scale within the category.

Volume / Commodity-Adjacent Tier

Standard hematopoietic and donor-dependent protocols sold through competitive bidding to smaller transplant centers, competing primarily on price, availability, and basic treatment functionality rather than scalability credentials, supported by lower barriers to entry.
Gross Margin: 20-26%

Premium / Certified Tier

Allogeneic and iPSC formats backed by formal manufacturing validation and multi-indication clinical testing, sold primarily to scalability-focused biopharma developers requiring documented performance credentials. This tier increasingly determines which developers win large multi-year health system contracts.
Gross Margin: 36-44%

Sustainability / Regulatory / Next-Generation Tier

Next-generation gene-edited iPSC platforms and predictive engraftment monitoring systems targeting scalability-focused biopharma developers ahead of anticipated advanced therapy regulation tightening across major markets. Margins here remain the highest in the category but require sustained manufacturing and clinical investment to defend.
Gross Margin
stem-cell-therapy-market-portfolio-architecture-1787309048074

High-value Sub-segments and Strategic Watch-out

iPSC and Allogeneic Formats

iPSC therapy represents the fastest-growing, highest-margin pocket of the category, moving from niche specialty product into standard scalability-driven procurement requirement as biopharma developer manufacturing commitments continue expanding across major accounts. Developers without dedicated iPSC capability risk losing these accounts entirely. That risk compounds annually as manufacturing standards rise.

Multi-Indication Clinical Programs

Cell therapy platforms formally validated across multiple indications are growing steadily as health systems increasingly specify broad clinical evidence, commanding a meaningful price premium that reflects the trial investment required to earn approved-treatment status. Developers lacking evidence depth increasingly struggle to even qualify for these bids.

Standard Hematopoietic Protocols

The largest volume segment by treated-patient count, standard hematopoietic protocols delivered through established transplant center relationships anchor category revenue even as growth moderates, remaining the primary entry point through which most smaller centers first specify stem cell treatment. Pricing pressure remains intense among competing regional developers.

iPSC Substitution Threat

iPSC and neural stem cell specialists capturing share among scalability-focused biopharma accounts represent a genuine strategic threat to legacy donor-dependent developers lacking comparable manufacturing and clinical capability, eroding volume among the largest, most scalability-driven accounts. Developers that close this gap fastest stand to defend the most volume.

Where Manufacturing Depth Decides Recurring Revenue

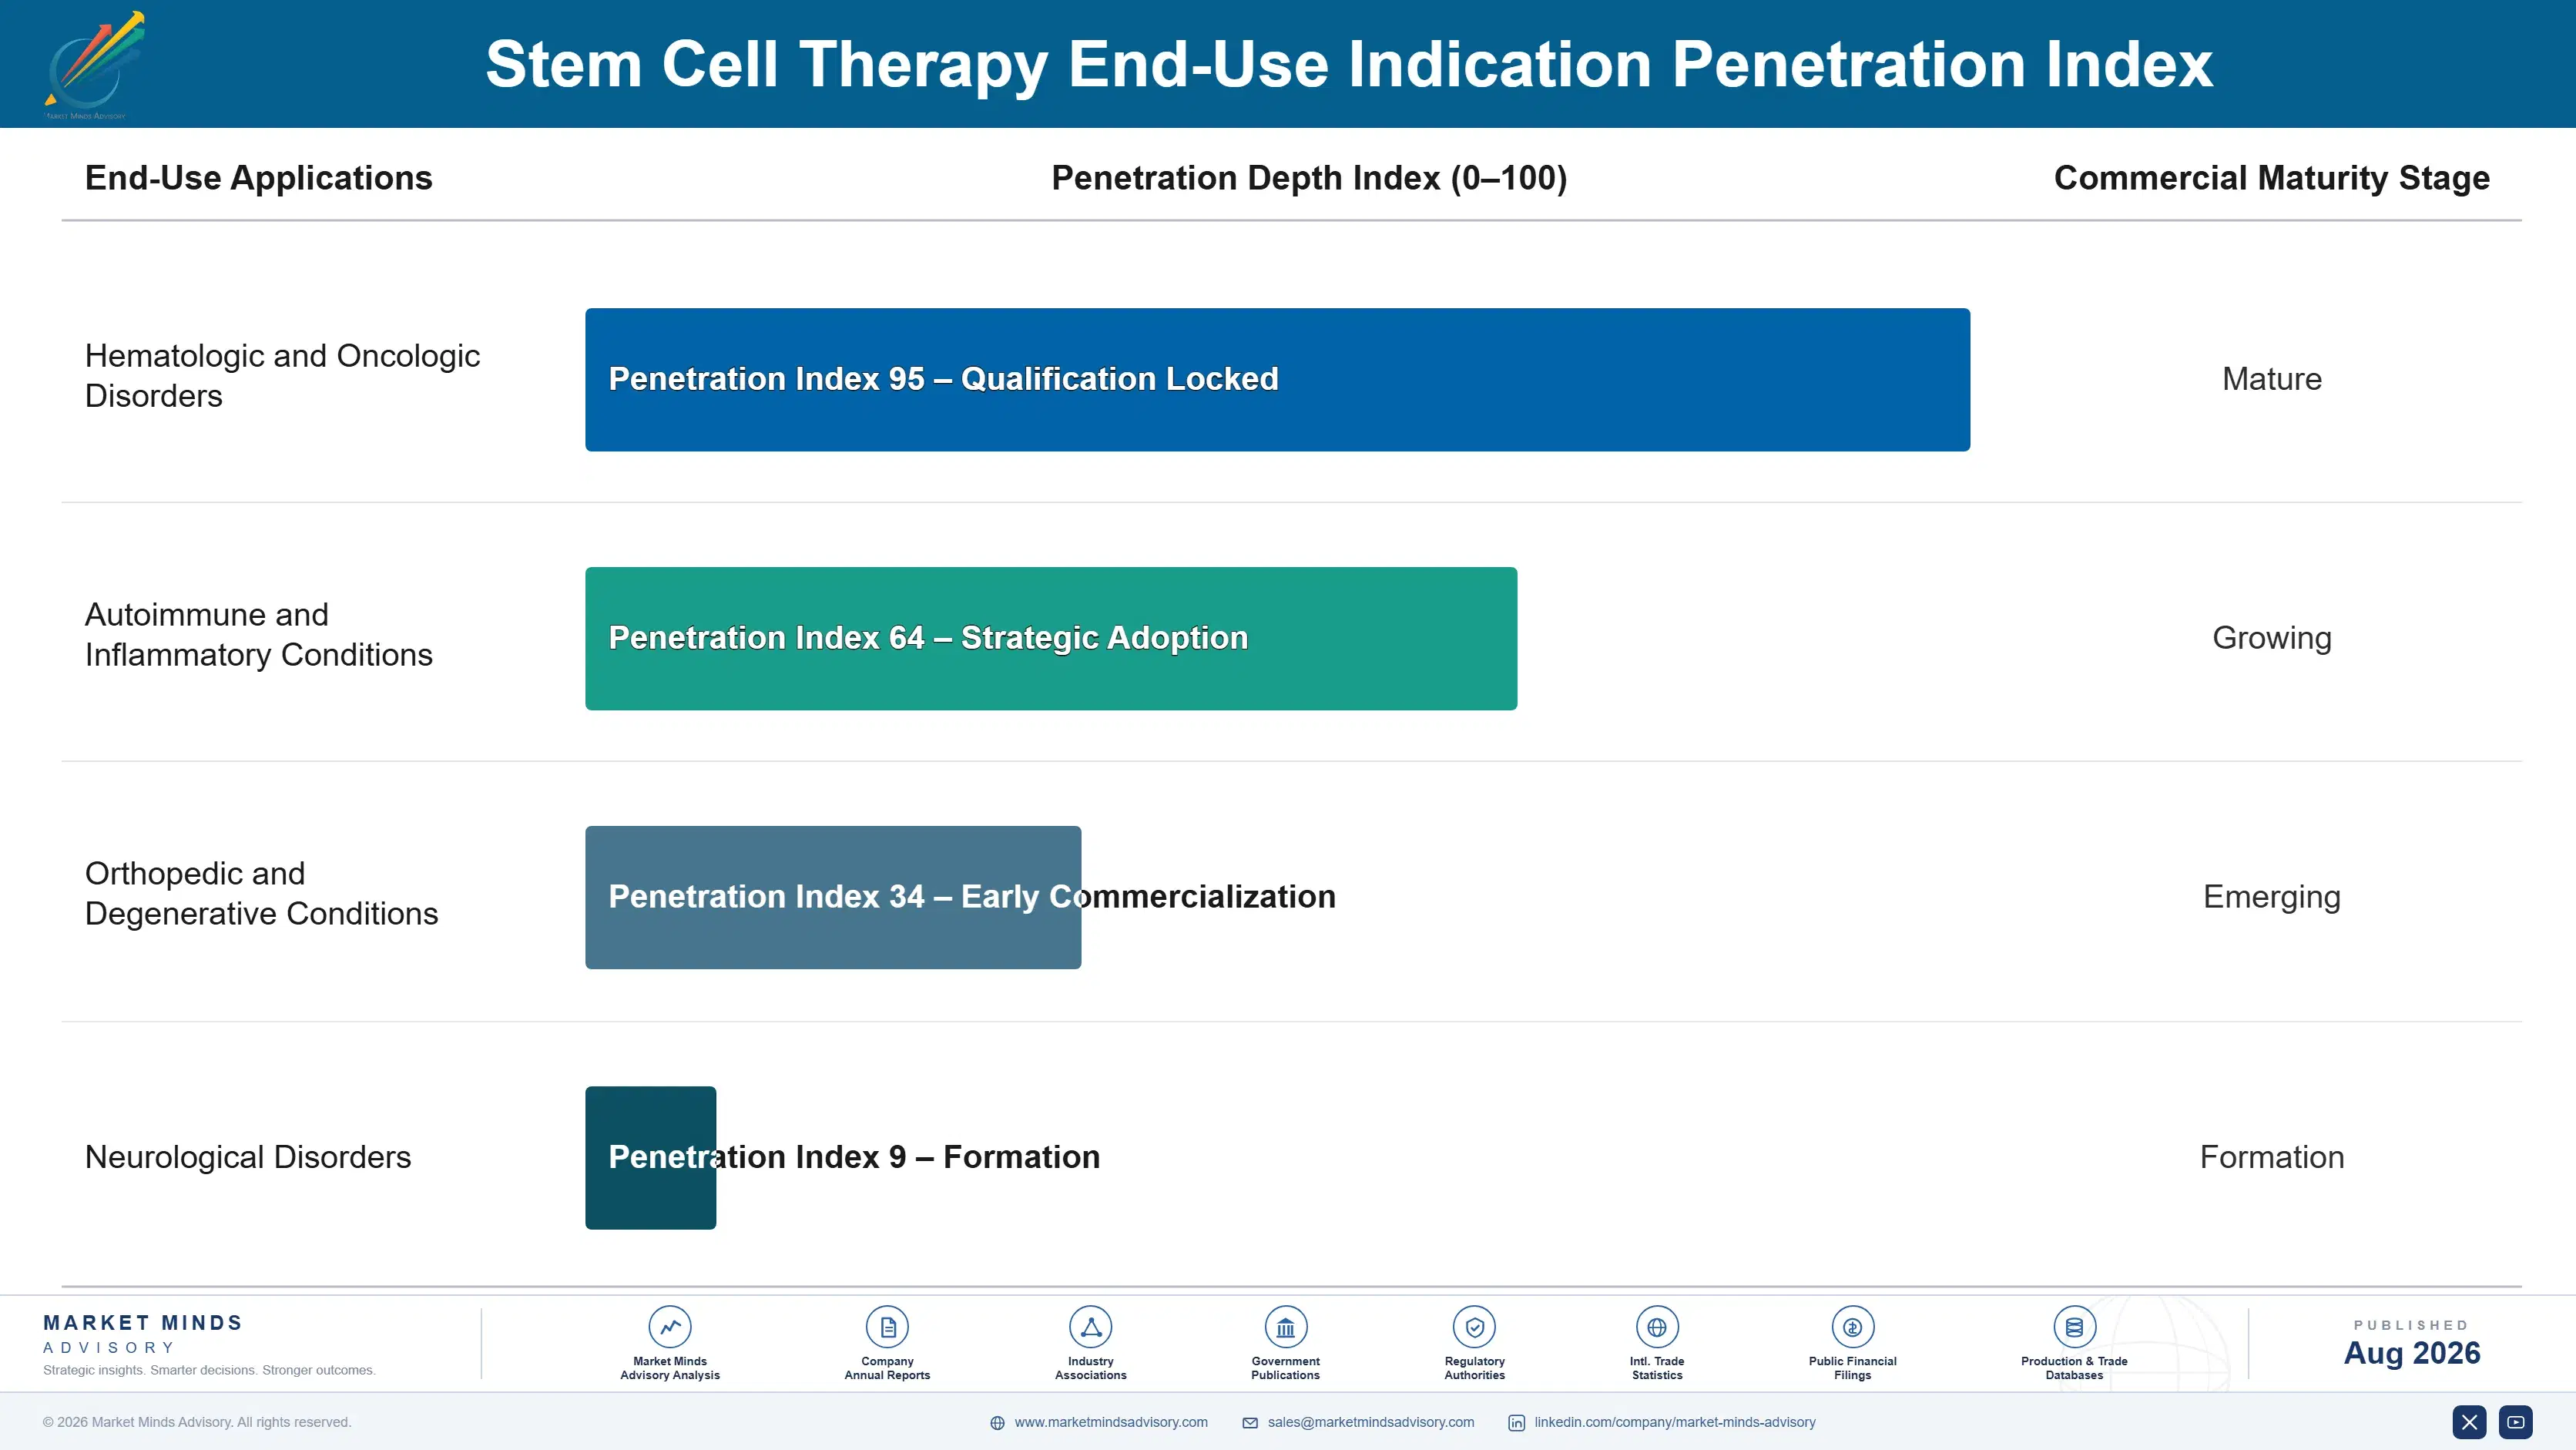
Stem cell therapy demand tracks regenerative medicine research and treatment investment directly rather than generating true durable-goods-style replacement demand, since each treatment is a discrete clinical event replaced through ongoing procurement tied to patient volume rather than any fixed lifespan consideration. Repeat purchase comes from ongoing health system and developer relationships rather than any individual treatment's outcome, meaning developer revenue depends heavily on retaining
Adoption depth varies considerably by end-use vertical. Academic biopharma developers show the most volatile format loyalty, since manufacturing-scalability requirements and internal quality audits can shift an entire pipeline's specification relatively quickly once allogeneic alternatives prove commercially viable. Specialty transplant centers show meaningfully deeper hematopoietic loyalty, since established donor networks and lower patient volume favor durable simple formats over more expensive allogeneic alternatives. Mid-tier regional health systems sit in a genuinely defensible middle position between these two extremes.

A generational shift among biopharma procurement buyers, increasingly trained to weigh total scalability and multi-indication value rather than upfront unit price alone, is reshaping specification decisions gradually, favoring iPSC and allogeneic formats over undifferentiated commodity hematopoietic protocols even where switching costs remain meaningfully higher today across most clinical programs.
stem-cell-therapy-market-end-use-penetration-index-1787309048564

Where Developers Should Focus Investment Next

These are among the four positions where our research anticipates prominent divergence between winners and laggards over the coming forecast period. Each is grounded in the demand model, the regulatory perimeter, and the announced capacity pipeline.
01 / IPSC MANUFACTURING INVESTMENT

Expand manufacturing capacity to capture scalability demand growth

Scalability-driven demand for iPSC therapy continues outpacing industry-wide manufacturing capacity additions, creating a genuine premium pricing opportunity for developers investing directly in expanded reprogramming and manufacturing capacity ahead of broader industry adoption across the category and its major biopharma customer base today. Developers building dedicated iPSC capacity now capture premium pricing from scalability-conscious biopharma customers before capacity constraints ease and competitive pressure intensifies across the segment considerably. Companies that delay this investment risk losing scalability-driven accounts permanently to competitors offering more reliable manufacturing supply.
02 / CLINICAL TRIAL PARTNERSHIPS

Secure multi-indication agreements to defend health system contracts

Health systems increasingly require multi-indication clinical evidence bundled with cell therapy platforms, and developers investing directly in long-term clinical research partnerships capture approved-treatment status that translates into meaningful order volume from the largest, most evidence-focused health system accounts available today. Building this evidence portfolio requires sustained research investment, but it captures customers with meaningfully higher switching costs once protocols are calibrated to specific validated indications and documented outcomes. Waiting risks permanently ceding these accounts to competitors with faster trial timelines instead.
03 / COMPONENT SUPPLY HEDGING

Lock multi-year contracts to protect margin against volatility

Cell processing media and cryopreservation component costs fluctuate meaningfully with broader biotech supply chain commodity cycles, and developers without long-term supply agreements absorb spot-market volatility directly into thin margins during tight-supply periods that recur unpredictably across both component categories without warning. Developers negotiating multi-year fixed-price contracts protect margin predictability even during industry-wide price spikes, a stability smaller regional competitors without comparable purchasing scale cannot replicate on their own without meaningful investment. Developers that skip this hedging discipline remain exposed every time either component market tightens unexpectedly.
04 / EXPANDED-ACCESS PROGRAM DEVELOPMENT

Build shared-access programs for budget-constrained health systems

Smaller regional health systems increasingly want access to iPSC and allogeneic platforms but lack the patient volume to justify dedicated development investment on their own, and developers building expanded-access and network partnership programs that spread trial costs across multiple smaller systems can capture business previously lost to larger funded competitors specifically and permanently. Companies successfully demonstrating shared-access models capture referral volume from smaller systems that competing formats have not yet fully addressed, an underserved segment current dedicated-development models cannot serve. This investment compounds over time.

Engagement Snapshot From the Field

A live engagement with an industry participant carrying material or product regulatory and market exposure ahead of a defining policy shift, showing how our research translates into a defensible multi-year portfolio strategy.
MARKET MINDS ADVISORY · CLIENT ENGAGEMENT SUMMARY
Stem Cell Therapy Producer Strategic Portfolio Review and Transition Roadmap 2026·Investment Scenario on Stem Cell Therapy Exposure Evaluation 2025-26
CLIENT PROFILE
The client is a regional academic transplant center generating approximately 410 million dollars in annual revenue (client-reported, unverified by MMA), operating a hematopoietic stem cell transplant program treating both pediatric and adult patients across a multi-hospital referral network. The company had relied on conventional donor-dependent protocols across its transplant program and faced rising wait times among patients lacking matched donor availability.
STRATEGIC CHALLENGE
Management needed to determine whether adopting allogeneic off-the-shelf platforms across the transplant program justified the capital cost and clinical workflow changes required, while also evaluating whether a partial adoption targeting only the highest-wait-time patient cohort could deliver most of the access-improvement benefit at a fraction of the cost. That decision carried real budget implications heading into the next capital planning cycle.
MMA APPROACH
MMA conducted primary interviews with the client's transplant medicine, quality assurance, and value-based care contracting teams, benchmarked allogeneic adoption outcomes at comparable academic transplant centers, and modeled cost and wait-time impact under three adoption scenarios before presenting a phased recommendation. MMA also reviewed the client's current developer relationships to assess adoption feasibility.
KEY FINDINGS
  1. Patients lacking matched donor availability accounted for the large majority of the client's extended transplant wait times over the preceding two years, per internal quality records reviewed.
  2. Comparable academic transplant centers that adopted allogeneic platforms for high-wait-time cohorts reported measurably reduced time-to-transplant within two quarters, according to comparable case data MMA reviewed.
  3. Partial adoption targeting only the highest-wait-time patient cohort would cost meaningfully less upfront than full program-wide adoption based on comparable capital estimates reviewed.
  4. Allogeneic platform costs ran an estimated 39 percent above conventional donor-dependent protocols across the specific formats evaluated for the client's transplant program volume.
CLIENT PROFILE
The client is a regional academic transplant center generating approximately 410 million dollars in annual revenue (client-reported, unverified by MMA), operating a hematopoietic stem cell transplant program treating both pediatric and adult patients across a multi-hospital referral network. The company had relied on conventional donor-dependent protocols across its transplant program and faced rising wait times among patients lacking matched donor availability.
STRATEGIC CHALLENGE
Management needed to determine whether adopting allogeneic off-the-shelf platforms across the transplant program justified the capital cost and clinical workflow changes required, while also evaluating whether a partial adoption targeting only the highest-wait-time patient cohort could deliver most of the access-improvement benefit at a fraction of the cost. That decision carried real budget implications heading into the next capital planning cycle.
MMA APPROACH
MMA conducted primary interviews with the client's transplant medicine, quality assurance, and value-based care contracting teams, benchmarked allogeneic adoption outcomes at comparable academic transplant centers, and modeled cost and wait-time impact under three adoption scenarios before presenting a phased recommendation. MMA also reviewed the client's current developer relationships to assess adoption feasibility.
KEY FINDINGS
  1. Patients lacking matched donor availability accounted for the large majority of the client's extended transplant wait times over the preceding two years, per internal quality records reviewed.
  2. Comparable academic transplant centers that adopted allogeneic platforms for high-wait-time cohorts reported measurably reduced time-to-transplant within two quarters, according to comparable case data MMA reviewed.
  3. Partial adoption targeting only the highest-wait-time patient cohort would cost meaningfully less upfront than full program-wide adoption based on comparable capital estimates reviewed.
  4. Allogeneic platform costs ran an estimated 39 percent above conventional donor-dependent protocols across the specific formats evaluated for the client's transplant program volume.
RECOMMENDED STRATEGY
Phase 1: Phase 1 (Months 1 to 5): Adopt allogeneic platforms for the highest-wait-time patient cohort ahead of the next transplant program review cycle. Phase 2: Phase 2 (Months 6 to 12): Formalize a long-term clinical research agreement with a qualified developer to secure consistent multi-indication supply. Phase 3: Phase 3 (Months 12 to 18): Evaluate wait-time outcomes and expand allogeneic adoption to additional patient cohorts based on demonstrated results.
OUTCOME
Within eighteen months, the client reported a meaningful reduction in transplant wait times among the adopted patient cohort (client-reported, unverified by MMA), while phased adoption kept capital investment aligned with available budget. Management credited the phased, evidence-driven approach with protecting patient access without overcommitting capital upfront.

Frequently Asked Questions

Foundational context covering the market sizes, CAGR, scope, country, region and competition that inform every finding below. This section is provided to cover basics and most often pre-purchase conversations, answered from the MMA Primary Research Dataset.

What is the current size of the Stem Cell Therapy Market?

The stem cell therapy market reached an estimated 18.0 billion dollars in 2025. Growth is being driven by iPSC platform conversion and expanding global regenerative medicine investment.

How large will the Stem Cell Therapy Market be by 2036?

MMA projects the market will reach approximately 66.40 billion dollars by 2036 under the base case scenario, roughly 3.28 times the 2026 starting value over the ten-year forecast window.

What is the CAGR for the Stem Cell Therapy Market 2026 to 2036?

The base case CAGR is 12.6 percent annually through 2036, with a bull case of 13.9 percent and a bear case of 11.3 percent depending on iPSC platform adoption pace.

Which segment is growing fastest?

iPSC therapy is growing fastest, at roughly 18.6 percent annually, nearly 1.48 times the category average as developers convert away from donor-dependent protocols. This lead reflects genuine specification shifts among scalability-focused developers.

Who are the major companies in the Stem Cell Therapy Market?

Mesoblast, Vertex Pharmaceuticals, Fate Therapeutics, Vericel, and Athersys all currently lead the category based on estimated global revenue across major regions. Concentration remains high given the category's manufacturing-intensive entry barriers.

Which country is growing fastest?

India is the fastest-growing major market, expanding at an estimated 16.4 percent annually as cell therapy manufacturing capacity continues rising steadily nationwide. Formal manufacturing capacity is spreading beyond its largest hubs.

Report Segmentation Architecture

The full report scope spans multiple orthogonal segmentation dimensions, with cross-tabulated demand data provided for each dimension pair. Coverage extends further to regional breakdowns, trend trajectories, and the competitive detail needed to support segment-level decision-making.

By Cell Type

  • Hematopoietic Stem Cell Therapy
  • Mesenchymal Stem Cell Therapy
  • Induced Pluripotent Stem Cell (iPSC) Therapy
  • Embryonic Stem Cell Therapy
  • Adipose-Derived Stem Cell Therapy
  • Neural Stem Cell Therapy

By End-Use Industry

  • Hematologic and Oncologic Disorders
  • Orthopedic and Musculoskeletal Conditions
  • Cardiovascular Disease
  • Neurological and Central Nervous System Disorders

By Commercial Dimension

  • Direct Health System Supply
  • Biopharma Licensing Agreements
  • Expanded-Access Programs
  • Export and Import Volume

By Region

  • North America
  • Western Europe
  • East Asia
  • South Asia and Pacific
  • Latin America
  • Middle East and Africa
  • Eastern Europe

Scope, Methodology, and Coverage

Every figure in this report is reproducible from documented input assumptions. The scope below maps the historical period, the forecast horizon, the segmentation dimensions, and the countries covered, alongside the underlying primary and qualitative methodology.
Historical Period
2020 to 2025
Forecast Period
2026 to 2036
Base Year
2025 (USD billions; MMA Primary Research Dataset, August 2026)
Market Definition
The stem cell therapy market comprises hematopoietic, mesenchymal, embryonic, adipose-derived, neural, and induced pluripotent stem cell products administered as therapeutic treatments, including both autologous and allogeneic formats sold to hospitals, transplant centers, and specialty clinics. It excludes gene therapies not derived from stem cell platforms, CAR-T and other engineered immune cell therapies not stem-cell-based, and stem cell research reagents not intended for direct patient administration.
Quantitative Units
USD billions (current prices); treated-patient volume in units where applicable
Segmentation Dimensions
Cell Type; End-Use Industry; Commercial Dimension; By Region
Regions Covered
North America, Western Europe, East Asia, South Asia and Pacific, Latin America, Middle East and Africa, Eastern Europe
Countries Covered
USA, Germany, UK, France, Japan, South Korea, China, India, Australia, Canada, Brazil, Mexico, Indonesia, Vietnam, UAE, Saudi Arabia, South Africa, Nigeria, Turkey, Poland, Czech Republic, Netherlands, Italy, Spain, Sweden, Switzerland, Argentina, Colombia, Singapore, and additional markets relevant to this sector
Key Companies Profiled
Mesoblast Limited, Vertex Pharmaceuticals Incorporated, Fate Therapeutics, Inc., Vericel Corporation, Athersys, Inc., Lineage Cell Therapeutics, Inc., CRISPR Therapeutics AG, Celularity Inc., Pluristem Therapeutics Inc., ReNeuron Group plc, BrainStorm Cell Therapeutics Inc., Cynata Therapeutics Limited, Cellular Biomedicine Group, Inc., Novadip Biosciences, TiGenix NV, Takeda Pharmaceutical Company Limited, Bluebird bio, Inc., CellSeed Inc., Novartis AG, Gilead Sciences, Inc.
Quantitative Methodology
Primary survey, n=3,800 respondents, Q4 2025, six countries; demand-side model with trade association cross-validation
Qualitative Methodology
47 expert interviews, Q4 2025; applied to validate demand model assumptions, identify emerging dynamics, and assess competitive positioning
Report Format
PDF and XLSX data workbook (Word format preview document)
Publisher
Market Minds Advisory
Report Code
MMA-2026-HLT-380
Published
August 2026
Contact
sales@marketmindsadvisory.com | www.marketmindsadvisory.com

Purchase the full Stem Cell Therapy Market Report (2026 to 2036).

This report provides a comprehensive analysis of the global stem cell therapy market, covering market sizing, segmentation, and regional dynamics across the 2026 to 2036 forecast period. It profiles twenty leading developers spanning commodity donor-dependent and certified allogeneic formats, with detailed competitive positioning, moat and risk analysis for the two category leaders, and recent corporate developments across capacity, partnerships, and acquisitions. The report examines revenue-generation levers, component input cost exposure, and portfolio margin economics across three product tiers. It draws on primary survey data from 3,800 respondents and 47 expert interviews conducted across six countries in the fourth quarter of 2025.
Ten-year market sizing and growth forecast
Six-segment cell type breakdown with CAGR
Seven-region demand and pricing trend analysis
Twenty-company competitive profiling and moat assessment
Component input cost and supply exposure review
Revenue lever and portfolio margin economics

Built For The People Who Decide

From boardroom strategy to bench-side execution, this report is read cover-to-cover by leaders shaping the next decade of their industry, turning demand scenarios, market dynamics and valuation benchmarks into decisions.
CXOs/ Presidents/ VPs/ Managers
M&A and Corporate Development
Strategy Teams and R&D Heads
Procurement and Product Directors
Regulatory and Compliance Leaders
Investor Relations and Equity Analysts