

Market Minds Advisory
WTTx Market

WTTx Market: WTTx Market. Fixed Wireless Access Meets Fiber Competition Demand

Rapid 5G fixed wireless rollout, intensifying fiber overbuild competition, and expanding rural broadband subsidy funding are reshaping which carriers and equipment vendors capture last-mile wireless broadband market share globally today.

Lead Analyst

Published

September 2026

Make Smarter Decisions with Customized Research Insights

Request a free sample report and evaluate market opportunities, growth trends, and competitive dynamics relevant to your business needs.

2025 MARKET VALUE$12.6BMarket Size 2025
2036 FORECAST VALUE$37.4BBase Case , 2026 to 2036
CAGR 2026 TO 203610.4 %Bull 11.6% / Bear 9.2%
INCREMENTAL OPPORTUNITY$23.5BNet 10- year value creation
EXPANSION MULTIPLE2.69x2036 value over 2026 base
Strategic Levers
M&A Pipeline
Regional Outlook
Country Rankings
Competitive Intelligence
Segmental Deep-dive
Call-Us : 91 93563 13602

Executive Snapshot and Market Trajectory.

WTTx fixed wireless access is rapidly expanding broadband coverage into areas fiber operators have not reached, letting carriers monetize existing cellular spectrum for home internet service. That shift reflects a hard reality: laying fiber to sparsely populated areas costs far more than deploying a wireless radio at an existing tower.
T-Mobile and Verizon are racing to add millions of fixed wireless subscribers before fiber operators complete rural buildout in the same territories, concentrating vendor demand heavily among large carriers in the United States, India, and the Philippines expanding rural coverage using existing cell tower infrastructure. India's Reliance Jio AirFiber rollout and the Philippines' underserved rural population compound this demand as carriers push wireless broadband into areas where fixed-line investment was never commercially viable.
Ericsson and Nokia compete increasingly on network optimization software capability rather than basic radio hardware specifications alone, while spectrum capacity constraints and evolving rural broadband subsidy eligibility rules are reshaping which technology carriers choose for large-scale last-mile deployments. Carriers increasingly evaluate vendors on network capacity management and spectrum efficiency rather than on per-unit hardware price alone, a shift that favors established players with dense field deployment networks.
Market Definition
This report covers fixed wireless access equipment, radio access network infrastructure, and network management software used to deliver home broadband over cellular spectrum rather than wired connections. It excludes traditional mobile handset data plans and satellite broadband services not delivered through terrestrial cellular infrastructure.
Base Year Value
$12.6B in 2025 (MMA Primary Research Dataset, September 2026)
Forecast Period
2026 to 2036, eleven discrete annual values
CAGR
10.4% base case. Bull 11.6%. Bear 9.2%.
Fastest Growth Segment
Network Management and Optimization Software: 16.8% CAGR
Fastest Growth Country
India: 17.6% CAGR
Fastest Growth Region
South Asia and Pacific: 12.8% CAGR
Largest Region
North America: 30% of 2025 global value
Market Leaders
T-Mobile, Verizon, Ericsson, Nokia, Reliance Jio. Source: MMA Analysis based on company disclosures and subscriber estimates.
Primary Survey
n=3,800 procurement and R&D decision-makers, Q4 2025, six countries
Methodology
Demand-side build-up, cross-validated against public data, 47 expert interviews

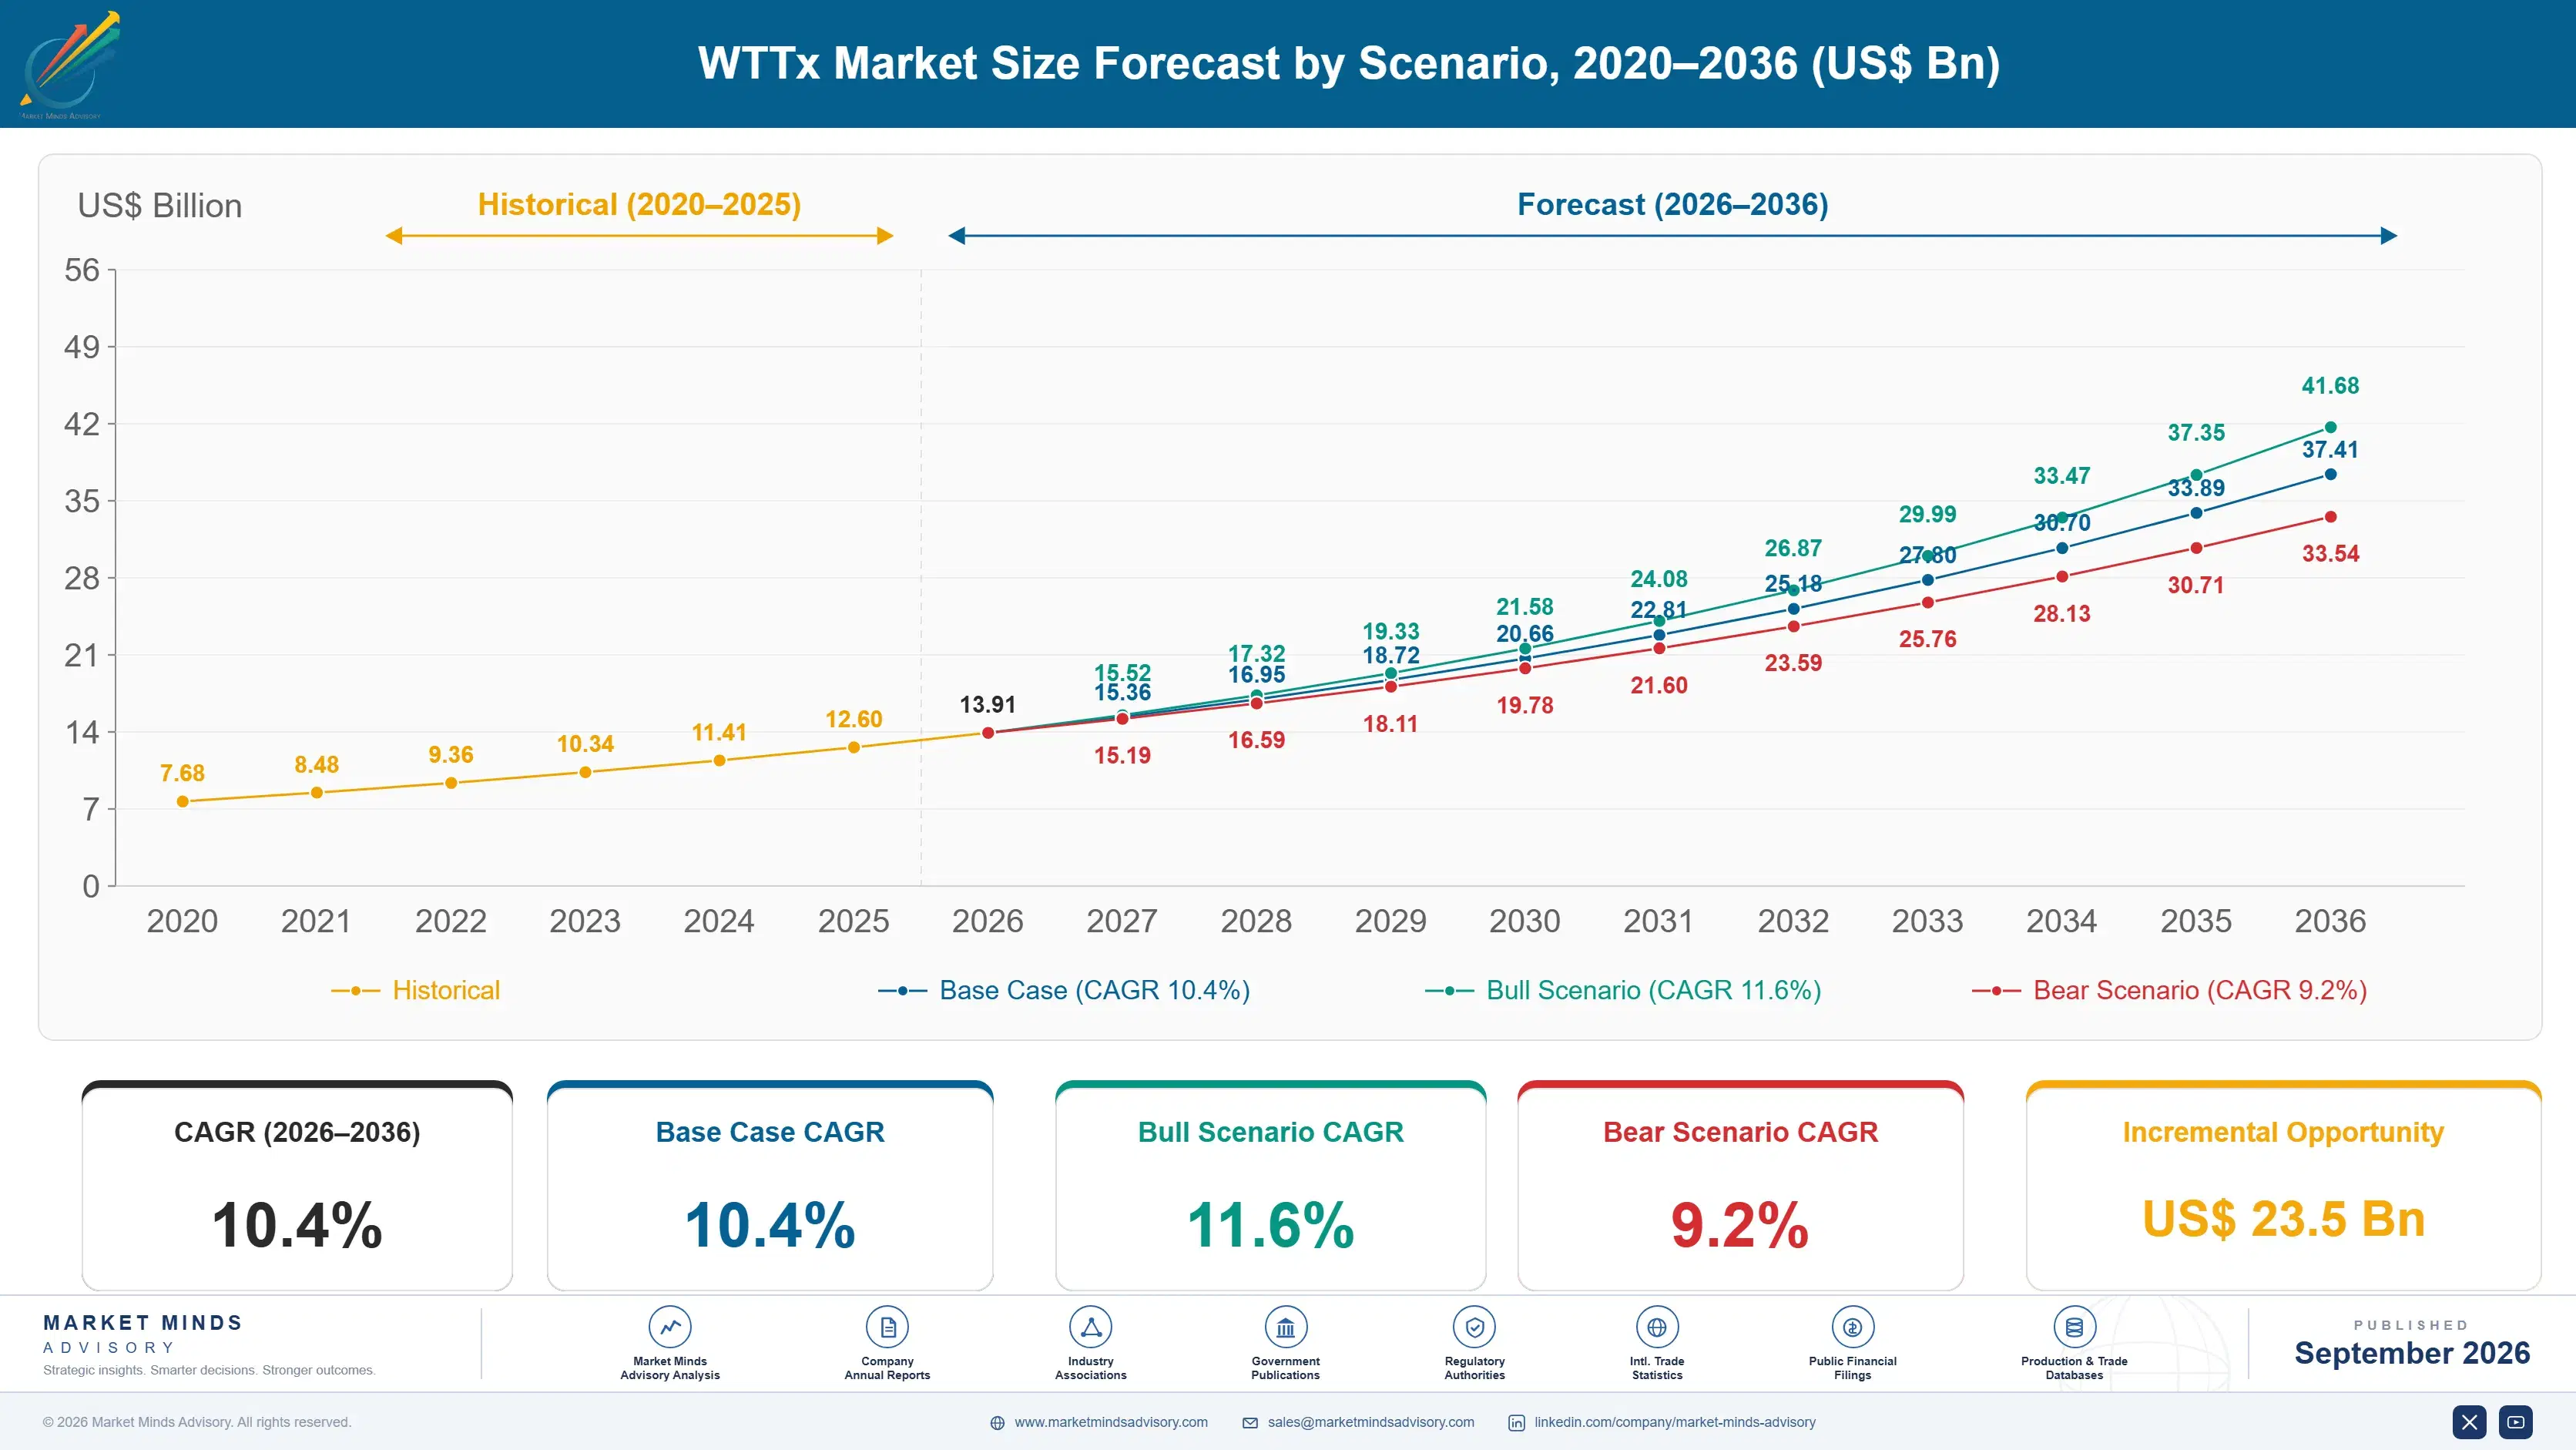
WTTx Market Forecast Scenarios

wttx-market-size-forecast-scenario-1788503700284
WTTx adoption between 2020 and 2025 accelerated sharply as 5G network buildout matured and carriers sought new revenue streams beyond mobile data plans, with the historical 9.6% CAGR reflecting genuine commercial opportunity rather than speculative capacity building. Early deployments through 2022 stayed concentrated among large carriers willing to dedicate spectrum to fixed wireless, but falling equipment prices broadened adoption meaningfully by 2025.
The base case rests on three commercial mechanisms: carriers monetizing existing cellular spectrum and tower infrastructure for home broadband revenue that requires minimal incremental capital investment, rural broadband subsidy programs funding wireless coverage extension where fiber economics do not work, and fiber overbuild competition forcing carriers to defend territory with faster wireless deployment timelines. Vendors demonstrating measurable capacity management alongside spectrum efficiency win contracts at meaningfully higher rates than unproven competitors.
A named bull catalyst would be major economies formally recognizing fixed wireless access as eligible for the same rural broadband subsidy funding as fiber, while the named bear risk is aggressive fiber operator overbuild that captures wireless subscribers once wired infrastructure finally reaches their neighborhood. Either scenario would reshape the pace at which urban carriers, who deploy wireless more cautiously than rural peers, expand broadband capacity.

Wireless Wins the Last Mile Where Fiber Cannot Reach

Market concentration remains fairly high, with the top five vendors holding most global deployed radio share even as regional equipment manufacturers compete effectively for smaller carrier contracts in emerging markets. Ericsson and Nokia lead among large carrier deployments, while regional manufacturers in China and India compete more effectively on price for smaller domestic carriers without the budget for premium global vendor service contracts.
MARKET CONCENTRATIONCR5 51%Top five vendors hold most global deployed radio share
AVERAGE INSTALL COST$210Typical per-subscriber customer premises equipment deployment cost nationwide
NETWORK CAPACITY UTILIZATION68%Average spectrum capacity used across active carrier deployments
RURAL SUBSIDY CONTRIBUTION35%Share of new subscriber growth tied to government funding
SUBSCRIBER CHURN RATE12%Annual customer loss rate across competitive fiber overbuild markets
TAKE RATE44%Share of covered households that subscribe within one year
Install cost has become a critical differentiator, since carriers subsidizing customer premises equipment to win subscribers quickly must weigh upfront hardware investment against expected subscriber lifetime revenue and churn risk. Vendors offering financing arrangements that let carriers spread equipment cost across the subscriber's monthly billing cycle are winning evaluations against providers requiring full upfront payment before any subscriber revenue materializes.
Network capacity utilization continues climbing steadily as carriers push more subscribers onto shared spectrum resources, forcing careful capacity planning to avoid the congestion that would otherwise degrade service quality during peak evening hours. Vendors offering dynamic spectrum allocation software that automatically shifts capacity toward congested cell sites are winning contracts against providers requiring manual network engineering intervention for every capacity adjustment. This automated capability is becoming a baseline expectation among large carriers.
"Carriers spent a decade selling wireless as a mobile product. Now they are selling the exact same spectrum as a home internet replacement, and it works."
Director, Wireless Infrastructure and Broadband Practice · MMA Technology Practice · September 2026

Market Trends

Carriers Expand Rural Coverage Using Existing Tower Assets

Carriers are increasingly deploying fixed wireless access to rural and semi-rural areas by adding home broadband radios to cell towers already built for mobile service, avoiding the trenching and permitting costs that fiber deployment in the same territory would require entirely. This approach lets carriers reach subscriber households months faster than a comparable fiber buildout timeline, since the core infrastructure investment was already made years earlier for mobile network coverage. This capability is becoming a standard rural expansion strategy rather than a niche technology experiment carriers test cautiously before committing capital.
Market Impact: Wireless acquisition costs run 35% lower

Fiber Overbuild Competition Intensifies Subscriber Churn Risk

Fiber operators completing rural and suburban buildout in territories previously served only by fixed wireless are triggering meaningful subscriber churn as households switch to wired connections once available, forcing wireless carriers to defend market share proactively. This competitive dynamic has already reshaped carrier marketing strategy, with some offering aggressive retention pricing specifically targeted at subscribers in neighborhoods where fiber construction crews have been spotted recently. Churn rates in fiber-competitive markets now run roughly 12% annually, meaningfully higher than in areas without comparable wired competition. Analysts expect this dynamic to intensify further as fiber construction accelerates nationwide.
Market Impact: Subsidy-eligible deployments reach 35% of growth

Market Opportunities and Growth Drivers

Existing Spectrum Assets Enable Low-Cost Market Entry

Carriers already holding cellular spectrum licenses can enter the home broadband market with meaningfully lower incremental capital investment than fiber operators building entirely new physical infrastructure from scratch across every subscriber neighborhood. This capital efficiency advantage has already reshaped competitive dynamics in markets where fiber operators face years-long permitting and construction timelines that fixed wireless carriers can bypass almost entirely. Carriers report fixed wireless subscriber acquisition costs running roughly 35% lower than comparable fiber subscriber acquisition in the same territory. Vendors report this trend has meaningfully accelerated equipment sales across the United States and Southeast Asia specifically.
Market Impact: Towers cap density near 200 homes

Rural Broadband Subsidy Eligibility Expands Addressable Market

Government broadband subsidy programs increasingly recognize fixed wireless access as an eligible technology alongside fiber, expanding the addressable subsidized market for carriers that previously could only compete for wired infrastructure funding. This eligibility expansion gives wireless carriers direct access to public funding streams that were historically reserved exclusively for fiber and cable buildout programs in most jurisdictions. Carriers report subsidy-eligible fixed wireless deployments now represent roughly 35% of new rural subscriber growth. This dynamic increasingly rewards carriers that invest early in dedicated subsidy application and compliance documentation capability. Adoption keeps rising steadily.
Market Impact: Overbuild erodes share within 2-3 years

Market Restraints and Challenges

Spectrum Capacity Constraints Limit Subscriber Density

Carriers face genuine spectrum capacity limits that constrain how many fixed wireless subscribers a single cell tower can serve without degrading service quality, forcing careful capacity planning that fiber deployment, with its effectively unlimited per-strand bandwidth, does not require. The root cause is that spectrum is a fundamentally finite, licensed resource shared across mobile and fixed wireless subscribers on the same tower infrastructure simultaneously. Carriers are increasingly deploying small cell densification and dynamic spectrum sharing technology specifically to expand effective subscriber capacity per tower. Adoption of these densification approaches is expanding steadily as tower capacity constraints intensify.
Market Impact: Rural coverage expanded 45% faster

Fiber Overbuild Erodes Long-Term Subscriber Base

Once fiber operators complete buildout in a previously wireless-only territory, subscribers frequently switch to wired connections offering higher and more consistent speeds, eroding the wireless carrier's subscriber base in that specific geography over time. The root cause is that fixed wireless was always a bridge technology for many carriers, valuable specifically because fiber had not yet arrived rather than a permanent competitive alternative. Carriers are increasingly targeting fixed wireless expansion toward areas with the lowest probability of near-term fiber competition specifically. This targeting shift is becoming a core strategic planning priority for carriers evaluating new market expansion opportunities.
Market Impact: Fiber competition pushes churn to 12%
4 additional market trends, 3 additional growth drivers, and 2 additional restraints and challenges are covered in the full report. Contact sales@marketmindsadvisory.com to access the complete intelligence.

Segment CAGR and Growth Architecture

WTTx equipment segments cleanly by component function, spanning customer premises equipment, 5G radio access network infrastructure, network management software, antenna systems, spectrum and backhaul services, and installation services, with software now the fastest-growing category. Customer premises equipment retains the largest installed base today, but network management software is capturing an increasing share of new spending each year.
wttx-market-market-share-analysis-1788503700877

Network Management and Optimization Software

Network management software is growing fastest because carriers managing increasingly dense fixed wireless subscriber bases need automated capacity allocation and congestion prediction capability that manual network engineering cannot scale to match cost-effectively. Vendors embedding dynamic spectrum sharing and predictive congestion alerts directly into their software platforms are winning contracts against competitors still offering only basic network monitoring dashboards without automation. Adoption is expanding fastest among large carriers managing millions of subscribers across sprawling rural and suburban coverage footprints simultaneously. Vendors report renewal rates approaching 82% among carriers who adopted software-driven capacity management within their first full year of comprehensive network deployment. That renewal strength gives vendors durable annuity revenue beyond the initial software licensing agreement itself.
CAGR 16.8%

5G Radio Access Network Infrastructure

5G radio access network infrastructure ranks second-fastest, driven by carriers upgrading from 4G-based fixed wireless deployments toward higher-capacity 5G equipment capable of supporting denser subscriber loads per tower. Vendors offering equipment compatible with both sub-6GHz and mmWave spectrum bands are increasingly winning evaluations against providers requiring separate hardware for each frequency range deployed. Demand for this capability is expanding particularly quickly in markets where carriers are racing to defend territory against accelerating fiber overbuild competition. Several vendors now bundle Wi-Fi 6 mesh networking capability directly into terminal hardware rather than selling it as a separate customer-premises accessory purchase. Carriers increasingly value this bundled simplicity when equipping rural subscribers with limited access to professional installation support.
CAGR 13.6%
Full segment breakdown across 6 segments available in the complete report.

Regional Architecture and Country Demand Map

North America leads WTTx demand, reflecting T-Mobile and Verizon's aggressive subscriber growth, while South Asia and Pacific posts the fastest regional growth rate through 2036 on rural coverage expansion. East Asian carrier scale and Latin American underserved coverage gaps also contribute meaningfully to sustained overall market expansion and continued growth.

North America

The United States drives the overwhelming majority of regional demand as T-Mobile and Verizon aggressively market fixed wireless as a fiber and cable alternative in both rural and select suburban markets. Both carriers have added millions of subscribers by using existing 5G spectrum and tower infrastructure, avoiding the multi-year construction timelines fiber buildout requires. Canada contributes a smaller but growing share, concentrated around rural provinces underserved by traditional wireline infrastructure. Rural cooperative carriers increasingly partner with national providers to extend fixed wireless coverage into the most sparsely populated counties nationwide. Vendors serving this region increasingly bundle equipment financing directly into carrier subscription plans, since upfront hardware cost otherwise deters price-sensitive rural subscribers.
Share: 30% | CAGR: 11.1% (2026 to 2036)

Western Europe

The United Kingdom and Germany anchor regional demand, with carriers using fixed wireless to reach rural communities where fiber rollout has lagged national broadband targets. France and Italy contribute meaningful demand tied to their own rural connectivity gaps, though established fiber incumbents limit fixed wireless growth in denser urban corridors. The Nordic countries maintain lower fixed wireless penetration given already extensive fiber coverage across most populated areas. Spain and Portugal contribute smaller but steadily growing demand tied to national rural broadband targets extending into historically underserved regions. Vendors report longer sales cycles here given the complexity of coordinating spectrum allocation across multiple national regulatory frameworks simultaneously across the region. Ireland shows growing interest tied to expanding rural connectivity funding programs.
Share: 18% | CAGR: 8.9% (2026 to 2036)
Regional intelligence for 5 additional markets available in the complete report: East Asia, South Asia and Pacific, Latin America, Middle East and Africa, Eastern Europe. Contact sales@marketmindsadvisory.com.
wttx-market-country-cagr-analysis-1788503701534

Software Optimization Anchors Recurring Margin

WTTx vendors capture disproportionate margin through four commercial levers tied to network optimization software subscriptions, subsidy compliance services, equipment financing programs, and capacity densification upgrades that basic radio hardware sales alone cannot sustain. Vendors with strong recurring revenue increasingly outperform those competing on hardware price alone. Investors increasingly reward vendors that diversify revenue beyond a single hardware transaction model.

Network Optimization Software Subscription Attach Rates

Vendors bundling network optimization software as a recurring subscription rather than a one-time licensing fee capture ongoing revenue tied directly to deployed radio count, since every added cell site requires continued capacity monitoring and congestion prediction support. Carriers adopting these subscriptions report roughly 25% higher subscriber density per tower, a return on investment case concrete enough that renewal rates for this module consistently exceed renewal rates for basic hardware maintenance contracts. This lever rewards vendors with genuine software engineering depth over those offering monitoring as a marketing checkbox without real automation capability behind it.
Market Impact: Optimization subscriptions raise density by roughly 25% overall

Rural Subsidy Compliance Documentation Support Services

Vendors offering dedicated compliance documentation services that help carriers satisfy government rural broadband subsidy program reporting requirements charge meaningful service fees that carriers would otherwise need to fund through outside consultants or dedicated internal compliance staff. These services typically cut subsidy application processing timelines by roughly 40% compared to carriers navigating compliance requirements without vendor support, letting vendors charge a premium for speed and reduced administrative burden. Vendors without this compliance service capability increasingly lose competitive evaluations to rivals who can demonstrate proven subsidy program qualification track records upfront. Some vendors now guarantee this reduction contractually to differentiate further.
Market Impact: Compliance services cut processing time by roughly 40%

Equipment Financing and Subscriber Billing Programs

Vendors offering equipment financing programs that let carriers spread customer premises equipment cost across the subscriber's monthly billing cycle capture ongoing interest revenue that a single upfront hardware sale would never generate. Carriers using these financing programs report signing roughly 20% more new subscribers than carriers requiring upfront equipment payment, since removing the initial cost barrier meaningfully accelerates subscriber acquisition velocity. This lever positions vendors as genuine growth partners rather than pure equipment suppliers, deepening the underlying carrier relationship considerably. Vendors that fail to offer financing risk losing carriers to more flexible competitors offering these arrangements.
Market Impact: Financing programs add roughly 20% more total subscribers

Capacity Densification Upgrade and Small Cell Sales

Vendors offering small cell densification equipment that expands effective subscriber capacity per tower are capturing carriers facing congestion in high-density fixed wireless deployment areas without requiring an entirely new tower buildout. These densification upgrade deals typically generate roughly 30% higher per-site revenue than standard initial radio deployment, since capacity expansion requires additional specialized engineering and hardware beyond the original installation. This lever positions vendors to capture ongoing capacity expansion revenue that greenfield-focused competitors cannot reasonably serve. Insurers and analysts increasingly factor densification capability into overall carrier network quality assessments considered.
Market Impact: Densification upgrades add roughly 30% more total revenue

Who Controls the Margin Pool

WTTx equipment competition sits at moderate concentration, with CR5 near 51% and Ericsson holding a narrow lead over Nokia among large carrier radio access network deployments, a gap that has held steady despite intensifying software feature competition. T-Mobile, Verizon, and Reliance Jio round out the top five as carrier-vendors that both deploy and increasingly develop proprietary optimization technology internally.
Current competitive activity centers on network optimization software differentiation, equipment financing program expansion, and capacity densification bundling aimed at capturing rural subsidy budgets before rivals lock up the same contracts. Vendors are also racing to build dual-band radio equipment compatible with both sub-6GHz and mmWave spectrum targeting carriers defending territory against fiber overbuild. Subscriber self-installation kits are also becoming a meaningful differentiator among vendors competing for rural carrier contracts specifically today.

Emerging pressure comes from Asian equipment manufacturers entering the mid-tier price band with functionally comparable radios at lower service overhead, alongside carrier-affiliated equipment vendors bundling fixed wireless directly into broader mobile network contracts. Rankings shift most decisively when a vendor secures a marquee large carrier reference account, since that single deployment tends to cascade into adjacent regional contracts.
wttx-market-company-positioning-matrix-1788503702238

Competitive Moat and Risk Dimensions

ERICSSON

Moat: Deep Carrier Radio Access Relationships

Ericsson's decades-long relationships supplying mobile radio access network equipment to major carriers give it a built-in cross-sell channel for fixed wireless equipment that pure-play newcomers would need years to replicate through direct sales efforts alone. Large carriers evaluating new vendors consistently cite this relationship depth as a key factor in retaining Ericsson for network expansion.
ERICSSON

Risk: Slower Software-Native Feature Development

As a large hardware-centric equipment manufacturer, Ericsson's network optimization software division receives comparatively less dedicated engineering investment than a specialist competitor devotes to capacity prediction algorithm development specifically. This gap is becoming increasingly visible in competitive evaluations against dedicated software-focused platforms. Addressing this gap remains a stated product roadmap priority for the company going forward.
T-MOBILE

Moat: First-Mover Fixed Wireless Brand Recognition

T-Mobile's early and aggressive fixed wireless marketing built strong consumer brand association with the category, giving it a default customer preference advantage that competitors must actively out-market to overcome in most territories. Consumers evaluating home broadband options consistently cite this brand recognition as a deciding factor in their provider choice.
T-MOBILE

Risk: Spectrum Capacity Constrains Growth Ceiling

T-Mobile's fixed wireless growth increasingly runs into spectrum capacity limits in its most successful markets, forcing the carrier to pause new subscriber additions in congested areas until additional capacity becomes available. This ceiling is becoming a genuine strategic concern as fiber overbuild competition intensifies in the same territories.

Players Tracked

Prominent Players

Ericsson
Nokia
T-Mobile
Verizon
Reliance Jio

Other Key Players

Samsung Electronics
ZTE Corporation
Huawei
Casa Systems
Airspan Networks
Baicells Technologies
Sercomm Corporation
Askey Computer Corporation
Sagemcom
Arcadyan Technology
Inseego Corp
Netgear Inc
Cradlepoint
Comba Telecom Systems
CommScope Holding

Recent Developments

FEBRUARY 2026

Ericsson launched a network optimization software update adding dynamic spectrum sharing capability across mixed mobile and fixed wireless traffic, aiming to help carriers expand subscriber density without additional tower construction. The update rolled out first to existing customers running large national carrier network deployments before broader availability.
Signal: Signals network optimization software is becoming the primary competitive battleground for equipment vendors this cycle industry-wide.
OCTOBER 2025

T-Mobile expanded a supply agreement with a rural cooperative carrier network to standardize fixed wireless equipment across fifteen state territories, embedding its infrastructure into the cooperative's core subsidy compliance program. Financial terms of the multi-year standardization agreement were not disclosed by either organization involved in the deal.
Signal: Shows carriers defending installed base through large multi-territory standardization agreements with rural cooperatives directly nationwide today.
MARCH 2026

Nokia completed an acquisition of a small cell densification startup to strengthen its capacity expansion capability, addressing a feature gap that had previously pushed some large carrier customers toward standalone densification specialists instead. The acquired startup's existing customer base will transition onto Nokia's core platform during 2026 and 2027.
Signal: Indicates consolidation is accelerating as larger vendors close densification feature gaps rather quickly this coming year.

Radio Frequency Chipset Cost Exposure

WTTx equipment manufacturing depends heavily on radio frequency chipsets and power amplifiers used in customer premises equipment and tower radios, which together account for roughly 33% of unit cost of goods sold across most vendors tracked in the survey. Software-only vendors selling network optimization upgrades face meaningfully less direct exposure to this cost pressure than integrated hardware manufacturers producing complete radio and customer premises equipment.
Semiconductor prices rose sharply during 2025 amid renewed global chip demand from electric vehicle and data center manufacturing, a swing Ericsson's annual report cited directly as a factor pressuring its networks segment margins across several product lines. Smaller equipment fabricators without pre-negotiated chip allocation agreements saw component costs rise considerably faster than larger competitors with existing semiconductor supplier relationships built up over years of prior procurement volume.

Vendors with in-house radio frequency chip design capability absorb these component cost swings far more comfortably than smaller competitors dependent on outside contract manufacturers, meaning exposure varies sharply by vendor scale and manufacturing location. Vendors that diversified chip supplier relationships across multiple regional foundries during the disruption reduced delay risk considerably compared to those still relying on a single concentrated supplier relationship.
wttx-market-cost-volatility-analysis-1788503702455

Diversified Semiconductor Supplier Agreements

Larger vendors are signing agreements with multiple semiconductor foundries rather than depending on a single chip supplier, trading some unit cost efficiency for meaningfully reduced exposure to the kind of allocation-driven cost swings that hit smaller fabricators hardest in 2025. This diversification strategy requires ongoing supplier management but pays off substantially during industry-wide allocation or tariff disruption events.

Software-Focused Product Portfolio Expansion

Vendors expanding software licensing revenue relative to hardware sales reduce direct exposure to radio frequency chip cost swings, since network optimization software runs on equipment already deployed rather than requiring new hardware manufacturing. This positioning also improves gross margin structure meaningfully since software carries lower cost of goods sold than hardware manufacturing at scale.

In-House Radio Frequency Chip Design Investment

Several manufacturers are investing in their own radio frequency chip design capability rather than relying entirely on outside contract manufacturers, capturing the design margin themselves while gaining flexibility to adjust specifications without renegotiating outside contracts. This approach requires meaningful upfront capital investment but pays back quickly through reduced dependence on volatile outside supplier pricing.

Portfolio Architecture for Margin Defence

WTTx economics split across three tiers, with gross margins ranging from the low twenties in commodity radio hardware bundles up past fifty percent in network optimization software and subsidy compliance service contracts. The volume tier competes largely on per-unit price against low-cost Asian manufacturers, while the premium tier commands stronger margins through recurring software subscriptions tied to capacity management and subsidy eligibility.
Tension between volume and premium positioning shapes vendor strategy directly: chasing radio hardware unit sales through aggressive pricing erodes the very margin that funds ongoing software feature development, yet abandoning volume-tier hardware concedes market entry points to Asian competitors. Most successful vendors resolve this by treating hardware as a customer acquisition function that generates recurring software revenue over subsequent years.

High-value margin pools concentrate in network optimization software subscriptions and subsidy compliance services, where recurring revenue commands a premium over one-time hardware sales. Sustainability and next-generation categories, particularly capacity densification and equipment financing programs, remain smaller today but are the segment analysts expect to reprice fastest as fiber competition intensifies. Vendors positioned early in that transition stand to capture disproportionate share of the next decade's growth as fixed wireless competes more directly against fiber operators.

Basic radio and customer premises equipment bundles competing against low-cost Asian manufacturers on per-unit price, sold largely into smaller regional carriers with limited software budget flexibility. Consolidation among smaller regional manufacturers is likely as price competition intensifies further across this segment overall.
Gross Margin

Network optimization software subscriptions and subsidy compliance services sold directly to large national carriers requiring proven capacity management and rural coverage expansion capability. Vendors with proven capacity management track records and dense service networks hold a durable advantage in this tier.
Gross Margin

Capacity densification upgrades and equipment financing programs developed for competitive fiber overbuild markets, an emerging category where coverage requirements are still tightening. Regulatory clarity in the coming years should meaningfully accelerate adoption across this category industry-wide overall.
Gross Margin
wttx-market-portfolio-architecture-1788503703014

High-value Sub-segments and Strategic Watch-out

Network Management and Optimization Software

The fastest-growing and highest-value pool, driven by carriers demanding measurable capacity density improvement, where vendors able to demonstrate concrete subscriber density gains capture disproportionate renewal contract value. Ericsson and Nokia currently hold the strongest track records here, while smaller vendors race to build comparable optimization depth before losing renewal contracts.

5G Radio Access Network Infrastructure

A high-value pool growing more moderately as the 5G upgrade cycle progresses, rewarding vendors already embedded in carrier installed bases over new entrants building standalone hardware. Vendors offering dual-band equipment compatible with both sub-6GHz and mmWave spectrum are winning evaluations against single-band providers. Carriers increasingly favor this flexibility.

Customer Premises Equipment

The volume core of the market, serving basic subscriber connectivity needs at lower margin but steady demand, providing the installed base that subsidizes specialized software development investment. Large diversified manufacturers dominate this tier through existing carrier relationships despite intensifying price competition from lower-cost Asian entrants.

Spectrum and Backhaul Infrastructure Services

A strategic watch-out segment where expanding rural subsidy eligibility could make backhaul infrastructure investment a mandatory rather than optional purchase across most large carrier deployments. Vendors building this capability early may capture disproportionate share once subsidy requirements broaden across major carrier markets over the coming years.

Software Subscriptions Anchor Recurring Demand

WTTx network equipment generates genuine annuity economics once a carrier deploys it at scale, since network optimization subscriptions, subsidy compliance services, and firmware updates recur on an annual renewal cycle rather than a single equipment transaction. This recurring revenue base cushions vendors against cyclical swings in new tower construction and capital equipment budgets across large national carriers.
Adoption stickiness runs deepest at large national carriers, where network optimization software becomes embedded in daily operations workflows that cannot easily transfer to a competitor's platform without significant retraining and network downtime, and shallowest among smaller regional carriers still evaluating whether premium software makes sense at their scale. Rural subsidy-funded carriers sit between these extremes, with stickiness rising as subsidy programs mature.

A generational shift in buyer profiles is underway as network operations managers who grew up with software-first management tools replace an older cohort accustomed to manual capacity planning and paper-based fault logs, gradually normalizing automated WTTx network management as the operational default rather than the specialist exception. That shift favors vendors who invested early in intuitive, dashboard-driven interfaces over legacy competitors. Slow vendors risk ceding the next equipment refresh cycle to more software-forward competitors positioning aggressively.
wttx-market-end-use-penetration-index-1788503703522

Where Software Beats Radio Price

These are among the four positions where our research anticipates prominent divergence between winners and laggards over the coming forecast period. Each is grounded in the demand model, the regulatory perimeter, and the announced capacity pipeline.
01 / NETWORK OPTIMIZATION PRIORITY

Build capacity management software before rivals close the gap

Vendors chasing radio unit sales without network optimization software depth will find margin ceilings well below what large carriers pay for measurable subscriber density improvement, since capacity concerns dominate purchasing decisions more than raw radio specifications. Large carriers specify this capability by name in vendor evaluations now, and vendors that can prove concrete density gains win contracts far more consistently than hardware-only competitors. That capability gap, more than any single feature, currently separates the premium software tier from commodity radio bundles.
02 / SUBSIDY COMPLIANCE INVESTMENT

Build compliance service capability ahead of rivals now

A meaningful share of new deployment decisions turn on rural subsidy program compliance capability, and vendors offering dedicated documentation services win contracts against rivals requiring carriers to fund compliance work through outside consultants. That advantage compounds as government agencies increasingly treat vendor compliance track record as a proxy for overall deployment reliability during procurement evaluations. Vendors slow to build this service capability risk losing evaluations to competitors with proven subsidy qualification records already established across multiple markets and government agencies.
03 / FIBER DEFENSE POSITIONING

Target subscribers unlikely to face near-term fiber competition

Carriers deploying fixed wireless into territories with low probability of near-term fiber buildout capture more durable subscriber relationships than those competing in areas where fiber operators are actively constructing wired infrastructure. Vendors that help carriers identify and prioritize genuinely durable fixed wireless territories using fiber construction data reduce customer churn meaningfully over the subscriber relationship's full lifetime. This targeting discipline compounds quickly given how costly subscriber acquisition becomes once fiber overbuild forces a carrier into aggressive defensive retention pricing measures.
04 / REGIONAL MANUFACTURING POSITIONING

Defend North American leadership while expanding into Asia

North America's concentration of aggressive carrier subscriber growth gives incumbents a durable home-market advantage, but South Asia and Pacific's rural coverage expansion is driving the fastest actual growth rates in the market. Vendors that rely solely on North American reference accounts risk ceding the fastest-growing regional demand to competitors building dedicated Asia-market sales and support infrastructure. Balancing defense of the home market against genuine investment in Asian rural expansion offers the clearest path to capturing both growth vectors simultaneously over time.

Engagement Snapshot From the Field

A live engagement with an industry participant carrying material or product regulatory and market exposure ahead of a defining policy shift, showing how our research translates into a defensible multi-year portfolio strategy.
MARKET MINDS ADVISORY · CLIENT ENGAGEMENT SUMMARY
WTTx Producer Strategic Portfolio Review and Transition Roadmap 2026·Investment Scenario on WTTx Exposure Evaluation 2025-26
CLIENT PROFILE
The client operates a regional rural wireless carrier serving roughly 150,000 subscribers across three underserved states, recently awarded federal subsidy funding to extend fixed wireless broadband to previously unconnected communities. The carrier had operated for over two decades as a regional mobile provider before pivoting toward fixed wireless broadband more recently. Its leadership had limited prior experience negotiating large-scale vendor contracts.
STRATEGIC CHALLENGE
The client faced difficulty selecting equipment vendors and navigating complex federal subsidy compliance requirements, while its limited internal technical staff struggled to evaluate competing proposals from national equipment providers. Board leadership viewed the compliance burden as a growing threat to timely fund disbursement and the deployment timeline overall. Executive leadership prioritized this engagement above other planned technology investments.
MMA APPROACH
MMA analysts benchmarked equipment vendors on subsidy compliance track record, capacity management software depth, and field service network density, then modeled a phased rollout plan matched to the carrier's funding disbursement schedule. The analysis also incorporated a detailed cost comparison against continuing operations with limited internal compliance and technical staff resources.
KEY FINDINGS
  1. Vendor-provided compliance documentation services reduced administrative processing time by roughly 42% compared to internal handling (client-reported, unverified by MMA). Reduced processing burden freed staff time for other carrier operational priorities.
  2. Dynamic spectrum allocation software avoided a costly early tower capacity expansion investment. This decision preserved capital for expanding coverage to additional underserved communities faster than originally planned.
  3. Carrier staff required roughly five weeks of vendor-provided training before achieving full network deployment proficiency. MMA recommended additional dedicated training resources to shorten this onboarding curve.
  4. The carrier reported meaningfully faster subsidy fund disbursement following improved compliance documentation quality (client-reported, unverified by MMA). Funding administrators cited the carrier as a model for other rural applicants.
CLIENT PROFILE
The client operates a regional rural wireless carrier serving roughly 150,000 subscribers across three underserved states, recently awarded federal subsidy funding to extend fixed wireless broadband to previously unconnected communities. The carrier had operated for over two decades as a regional mobile provider before pivoting toward fixed wireless broadband more recently. Its leadership had limited prior experience negotiating large-scale vendor contracts.
STRATEGIC CHALLENGE
The client faced difficulty selecting equipment vendors and navigating complex federal subsidy compliance requirements, while its limited internal technical staff struggled to evaluate competing proposals from national equipment providers. Board leadership viewed the compliance burden as a growing threat to timely fund disbursement and the deployment timeline overall. Executive leadership prioritized this engagement above other planned technology investments.
MMA APPROACH
MMA analysts benchmarked equipment vendors on subsidy compliance track record, capacity management software depth, and field service network density, then modeled a phased rollout plan matched to the carrier's funding disbursement schedule. The analysis also incorporated a detailed cost comparison against continuing operations with limited internal compliance and technical staff resources.
KEY FINDINGS
  1. Vendor-provided compliance documentation services reduced administrative processing time by roughly 42% compared to internal handling (client-reported, unverified by MMA). Reduced processing burden freed staff time for other carrier operational priorities.
  2. Dynamic spectrum allocation software avoided a costly early tower capacity expansion investment. This decision preserved capital for expanding coverage to additional underserved communities faster than originally planned.
  3. Carrier staff required roughly five weeks of vendor-provided training before achieving full network deployment proficiency. MMA recommended additional dedicated training resources to shorten this onboarding curve.
  4. The carrier reported meaningfully faster subsidy fund disbursement following improved compliance documentation quality (client-reported, unverified by MMA). Funding administrators cited the carrier as a model for other rural applicants.
RECOMMENDED STRATEGY
Phase 1: Phase one: deploy to the highest-priority underserved communities first, matched to funding disbursement milestones. This sequencing protects the communities with the most urgent connectivity need first. Phase 2: Phase two: train carrier field staff through vendor-provided certification programs before expanding deployment further. Certification typically requires roughly three weeks of hands-on instruction time overall. Phase 3: Phase three: renegotiate ongoing capacity management and equipment maintenance contracts once the rollout completes. Consolidating contracts at this stage also reduces ongoing vendor management overhead considerably.
OUTCOME
The carrier completed its subsidy-funded fixed wireless deployment within the funding timeline and reported meaningfully faster compliance processing and community connection rates, according to client-reported figures unverified by MMA, strengthening its standing with federal funding administrators. Board leadership credited the phased rollout approach with minimizing operational disruption during the extended deployment period.

Frequently Asked Questions

Foundational context covering the market sizes, CAGR, scope, country, region and competition that inform every finding below. This section is provided to cover basics and most often pre-purchase conversations, answered from the MMA Primary Research Dataset.

What is the current size of the WTTx Market?

The global WTTx market reached an estimated $12.6 billion in 2025, reflecting rapid subscriber growth as carriers monetize existing cellular spectrum and tower infrastructure for home broadband.

How large will the WTTx Market be by 2036?

MMA projects the market will reach approximately $37.41 billion by 2036, driven by network optimization software adoption, rural subsidy expansion, and continued 5G equipment upgrade cycles.

What is the CAGR for the WTTx Market 2026 to 2036?

The market is forecast to grow at a 10.4% compound annual rate between 2026 and 2036, roughly one percentage point above the historical rate recorded over the preceding five-year period.

Which segment is growing fastest?

Network management and optimization software leads growth at 16.8% CAGR, roughly 1.62 times the overall market rate, driven by carriers seeking automated capacity management at scale.

Who are the major companies in the WTTx Market?

Ericsson, Nokia, T-Mobile, Verizon, and Reliance Jio lead the market, together holding an estimated 51% combined revenue concentration across the global deployed radio base today.

Which country is growing fastest?

India leads country-level growth at 17.6% CAGR, supported by Reliance Jio's AirFiber rollout extending broadband connectivity into previously unconnected rural communities across the entire country.

Report Segmentation Architecture

The full report scope spans multiple orthogonal segmentation dimensions, with cross-tabulated demand data provided for each dimension pair. Coverage extends further to regional breakdowns, trend trajectories, and the competitive detail needed to support segment-level decision-making.

By Primary Market Dimension

  • Customer Premises Equipment
  • 5G Radio Access Network Infrastructure
  • Network Management and Optimization Software
  • Outdoor and Indoor Antenna Systems
  • Spectrum and Backhaul Infrastructure Services
  • Installation and Field Deployment Services

By End-Use Industry

  • Residential Broadband
  • Rural Cooperative Carriers
  • Government-Funded Public Infrastructure
  • Small and Medium Business Connectivity

By Commercial Dimension

  • Direct Carrier Equipment Sales
  • Subscription Software Licensing
  • Subsidy Compliance Service Contracts
  • Equipment Financing Programs

By Region

  • North America
  • Western Europe
  • East Asia
  • South Asia and Pacific
  • Latin America
  • Middle East and Africa
  • Eastern Europe

Scope, Methodology, and Coverage

Every figure in this report is reproducible from documented input assumptions. The scope below maps the historical period, the forecast horizon, the segmentation dimensions, and the countries covered, alongside the underlying primary and qualitative methodology.
Historical Period
2020 to 2025
Forecast Period
2026 to 2036
Base Year
2025 (USD billions; MMA Primary Research Dataset, September 2026)
Market Definition
This report defines the WTTx market as fixed wireless access equipment, radio access network infrastructure, and network management software used to deliver home broadband over cellular spectrum rather than wired connections. It excludes traditional mobile handset data plans and satellite broadband services not delivered through terrestrial cellular infrastructure.
Quantitative Units
USD billions, subscriber count, deployed radio units, CAGR percentages
Segmentation Dimensions
Equipment type, end-use category, commercial channel, region
Regions Covered
North America, Western Europe, East Asia, South Asia and Pacific, Latin America, Middle East and Africa, Eastern Europe
Countries Covered
United States, India, China, United Kingdom, Brazil, Philippines, and 25 additional countries
Key Companies Profiled
Ericsson, Nokia, T-Mobile, Verizon, Reliance Jio, and 15 additional companies
Quantitative Methodology
Primary survey, n=3,800 respondents, Q4 2025, six countries; demand-side model with trade association cross-validation
Qualitative Methodology
47 expert interviews, Q4 2025; applied to validate demand model assumptions, identify emerging dynamics, and assess competitive positioning
Report Format
PDF and XLSX data workbook (Word format preview document)
Publisher
Market Minds Advisory
Report Code
MMA-2026-TEC-205
Published
September 2026
Contact
sales@marketmindsadvisory.com | www.marketmindsadvisory.com

Purchase the full WTTx Market Report (2026 to 2036).

This report delivers a comprehensive analysis of the global WTTx market, covering historical performance from 2020 through 2025 and forecasts through 2036 across equipment segments, end-use categories, and seven world regions. It profiles the twenty leading vendors shaping network optimization, subsidy compliance, and 5G upgrade adoption, benchmarks competitive positioning, and quantifies radio frequency chipset cost exposure. Analysts examine revenue diversification levers, portfolio margin economics, and demand stickiness across national carrier, rural cooperative, and government-funded verticals. A dedicated case study illustrates how one rural carrier applied these findings to its own subsidy-funded deployment decisions.
Seven-region market sizing and growth forecasts
Twenty-company competitive benchmarking and moat analysis
Component cost exposure and mitigation strategy analysis
Six-segment equipment type and application breakdown
Revenue lever and margin tier analysis
Anonymized client case study with recommended strategy

Built For The People Who Decide

From boardroom strategy to bench-side execution, this report is read cover-to-cover by leaders shaping the next decade of their industry, turning demand scenarios, market dynamics and valuation benchmarks into decisions.
CXOs/ Presidents/ VPs/ Managers
M&A and Corporate Development
Strategy Teams and R&D Heads
Procurement and Product Directors
Regulatory and Compliance Leaders
Investor Relations and Equity Analysts