Market Minds Advisory
Workover Rigs Market

Workover Rigs Market: Workover Rigs Market. Mature Field Maintenance Sustains Well Intervention Equipment Demand

Aging well inventories across mature oil and gas basins are sustaining workover rig demand, as operators perform recurring well intervention and maintenance work to extend production from fields that would otherwise decline.

Lead Analyst

Published

October 2026

Make Smarter Decisions with Customized Research Insights

Request a free sample report and evaluate market opportunities, growth trends, and competitive dynamics relevant to your business needs.

2025 MARKET VALUE$4.7BMarket Size 2025
2036 FORECAST VALUE$7.3BBase Case , 2026 to 2036
CAGR 2026 TO 20364.1 %Bull 5.3% / Bear 2.9%
INCREMENTAL OPPORTUNITY$2.4BNet 10- year value creation
EXPANSION MULTIPLE1.49x2036 value over 2026 base
Strategic Levers
M&A Pipeline
Regional Outlook
Country Rankings
Competitive Intelligence
Segmental Deep-dive
Call-Us : 91 93563 13602

Executive Snapshot and Market Trajectory.

Workover rig demand continues climbing steadily as aging well inventories across mature oil and gas basins require recurring intervention work, a dynamic sustained by operators extending production from existing wells rather than drilling new ones amid capital discipline pressure. Several major operators have begun phased rig modernization programs. Nationwide too.
Mobile hydraulic workover rigs are growing fastest within the category, expanding at nearly six percent annually as operators favor faster rig-up and rig-down cycles that reduce well downtime relative to conventional mechanical rigs requiring longer setup. The Middle East and Africa anchors global volume given extensive mature field maintenance programs in Gulf state basins, while North America leads on mobile rig fleet deployment tied to shale well intervention activity. Quickly.
Competition splits between large oilfield service companies with integrated well intervention offerings and specialized rig manufacturers competing on mobility and rig-up speed, a division shaping how operators structure service contracts. Expanding mature field maintenance budgets in several major producing economies and tightening well integrity regulations are pulling specifications toward higher-capacity mobile designs, while proven field reliability increasingly separates established suppliers from smaller regional competitors. Broadly.
Market Definition
This report covers mobile and permanent rig equipment used to perform well intervention, workover, and maintenance operations on existing oil and gas wells, including mechanical, hydraulic, and hybrid rig configurations. It excludes drilling rigs used for new well construction, coiled tubing units sold as standalone equipment, and wireline intervention tools sold independently of the rig structure itself.
Base Year Value
$4.7B in 2025 (MMA Primary Research Dataset, October 2026)
Forecast Period
2026 to 2036, eleven discrete annual values
CAGR
4.1% base case. Bull 5.3%. Bear 2.9%.
Fastest Growth Segment
Mobile Hydraulic Workover Rigs: 6.2% CAGR
Fastest Growth Country
Saudi Arabia: 5.8% CAGR
Fastest Growth Region
South Asia and Pacific: 5.9% CAGR
Largest Region
North America: 28% of 2025 global value
Market Leaders
Halliburton, Schlumberger, Weatherford International, Basic Energy Services, KCA Deutag. Source: MMA Analysis based on company annual reports.
Primary Survey
n=3,800 procurement and R&D decision-makers, Q4 2025, six countries
Methodology
Demand-side build-up, cross-validated against public data, 47 expert interviews

Workover Rigs Market Forecast Scenarios

workover-rigs-market-size-forecast-scenario-1791020266619
Workover rig demand grew moderately across 2020 to 2025 at roughly 3.3 percent annually, held back early by pandemic-era capital spending cuts across the oil and gas sector before recovering steadily as operators resumed deferred maintenance programs on aging well inventories. Growth strengthened toward the end of the period as mature basin operators prioritized well intervention spending over new drilling amid capital discipline.
The base case assumes 4.1 percent annual growth through 2036, anchored on three concurrent mechanisms: continued aging of global well inventories requiring recurring intervention work across mature producing basins, sustained capital discipline that favors well maintenance spending over new drilling investment, and expanding mobile rig fleet deployment that improves operational efficiency relative to older mechanical designs. These mechanisms reinforce one another across most major producing economies. Capacity growth plans continue extending across most forecast years ahead.
The bull case centers on accelerated mature field maintenance investment in the Middle East that would require substantially more rig capacity than currently budgeted across the region's aging well inventory. The bear case assumes sustained low oil prices amid demand uncertainty delay discretionary intervention spending, extending the service life of existing rig fleets beyond typical replacement cycles.

Mobile Rig Deployment Redraws Procurement Priorities

The workover rigs market reaches an estimated 4.893 billion dollars in 2026, continuing steady growth driven by aging well inventories and sustained capital discipline across most major producing economies. National and independent oil companies account for the large majority of unit demand, though service contractors operating their own rig fleets represent a smaller but steadily growing buyer segment.
MARKET CONCENTRATION LEVEL41%Reflects fragmentation among established oilfield service contractors broadly
AVERAGE RIG DAY RATE$8,500Varies substantially between mechanical and hydraulic mobile configurations
LEADING SUPPLIER SHARE13%No single vendor dominates despite decades of operator relationship development
MOBILE RIG FLEET SHARE44%Represents growing proportion of installed fleet favoring faster deployment
AVERAGE RIG SERVICE LIFE25 yearsExtends well beyond typical operator capital budget planning cycles
WELL INTEGRITY COMPLIANCE RATE63%Reflects share of operations meeting formal regulatory inspection standards
Average rig day rates vary substantially across the category, from moderate pricing for basic mechanical rigs to significantly higher pricing for advanced hydraulic mobile units with automated handling systems, which fragments the market into distinct procurement tiers rather than one uniform price curve. The Middle East and Africa's mature field scale gives the region outsized influence over unit volume even though North America commands higher average day rates on advanced mobile configurations.
Looking ahead, contractors are racing to expand mobile rig fleet capability and automated handling systems, since margins on basic mechanical rigs continue compressing under competitive operator tender pressure. The companies that control deployment speed and automation engineering, not just basic rig manufacturing, are positioned to capture disproportionate value as mature field maintenance spending intensifies through the decade.
"Nobody drills a new well to fix an old one. The rig that shows up fastest wins the job every time."
Director, Oilfield Services and Well Intervention Practice · MMA Energy Practice · October 2026

Market Trends

Automated Pipe Handling Reduces Crew Size Requirements

Rig operators are increasingly specifying automated pipe handling systems that reduce the manual labor required for tripping operations, cutting crew size requirements and associated safety incident exposure relative to conventional manual handling methods still common across older rig fleets. Contractors able to demonstrate reliable automation performance are winning larger multi-year service contracts than competitors relying on manual-only equipment, since operators increasingly prioritize crew safety metrics alongside basic day rate pricing when evaluating service providers. Several major operators now require this capability in formal procurement specifications. Compliance budgets are rising as a result.
Market Impact: Adds over 45,000 wells requiring intervention
Mature Field Operators Prioritize Rig-Up Speed

Operators managing large well inventories increasingly prioritize rig-up and rig-down speed over basic equipment capacity, since faster deployment directly reduces the non-productive time that drives up intervention cost per well across campaigns covering dozens of wellsites. This has consolidated large intervention contracts toward contractors with proven mobile rig fleets even where dozens of equipment providers technically compete, since operators increasingly require demonstrated deployment speed data before awarding multi-well campaigns. Smaller firms face a costly multi-year path toward comparable mobile fleet investment. This trend is expected to continue through most of the decade ahead.
Market Impact: Adds 14 percent to intervention spending

Market Opportunities and Growth Drivers

Aging Well Inventories Require Systematic Intervention

Global well inventories continue aging across mature producing basins, with each additional year of production increasing the likelihood that mechanical issues or declining performance require workover intervention to restore or sustain output. Each aging well cohort generates recurring intervention demand tied directly to well age and production history, creating predictable multi-year procurement opportunities tied to basin-wide maintenance programs across multiple producing regions worldwide. Many operators now track intervention priority by well age cohort and production history. This dynamic is expected to persist through most of the forecast decade. Quickly. Quickly.
Market Impact: Delays intervention 1 to 2 years

Capital Discipline Favors Maintenance Over New Drilling

Operators facing investor pressure for capital discipline increasingly favor well maintenance spending over new drilling investment, since extending production from existing wells typically requires substantially less capital than drilling replacement wells while delivering comparable incremental output. This calculation increasingly favors intervention spending across most major producing basins, since operators facing capital constraints prioritize the lowest-cost path to sustaining production volumes. This dynamic is expected to persist through most of the forecast decade ahead. This trend shows no signs of slowing across most major producing regions. This dynamic persists across most major producing basins consistently.
Market Impact: Adds 20 percent to mobilization cost

Market Restraints and Challenges

Oil Price Volatility Delays Discretionary Intervention

Operators facing low or volatile oil prices frequently defer discretionary well intervention work regardless of underlying well condition, since intervention spending competes directly against other capital priorities during periods of constrained cash flow across the broader producing portfolio. The root cause is that intervention spending, unlike production operating costs, carries genuine discretion in timing that operators exploit during downturns. Contractors are responding with flexible pricing structures that spread cost across multiple payment periods. Suppliers investing early in flexible terms still gain meaningful contract advantage. Peer operators often request direct introductions before committing resources.
Market Impact: Cuts crew size 25 percent

Remote Well Locations Complicate Rig Mobilization

Wells located in remote or difficult-to-access locations face genuine mobilization challenges that increase rig deployment cost and timeline relative to wells with straightforward road or pipeline infrastructure access, particularly in frontier basins lacking established service infrastructure. This often extends intervention project timelines well beyond initial estimates in remote operating areas. Contractors are addressing this through modular rig designs that simplify transport logistics to difficult locations. Suppliers achieving broader logistics success increasingly command premium pricing over rivals. This trend shows no signs of slowing across most major operating regions. Timelines keep shrinking.
Market Impact: Reaches 29 percent of intervention campaigns
3 additional market trends, 4 additional growth drivers, and 4 additional restraints and challenges are covered in the full report. Contact sales@marketmindsadvisory.com to access the complete intelligence.

Segment CAGR and Growth Architecture

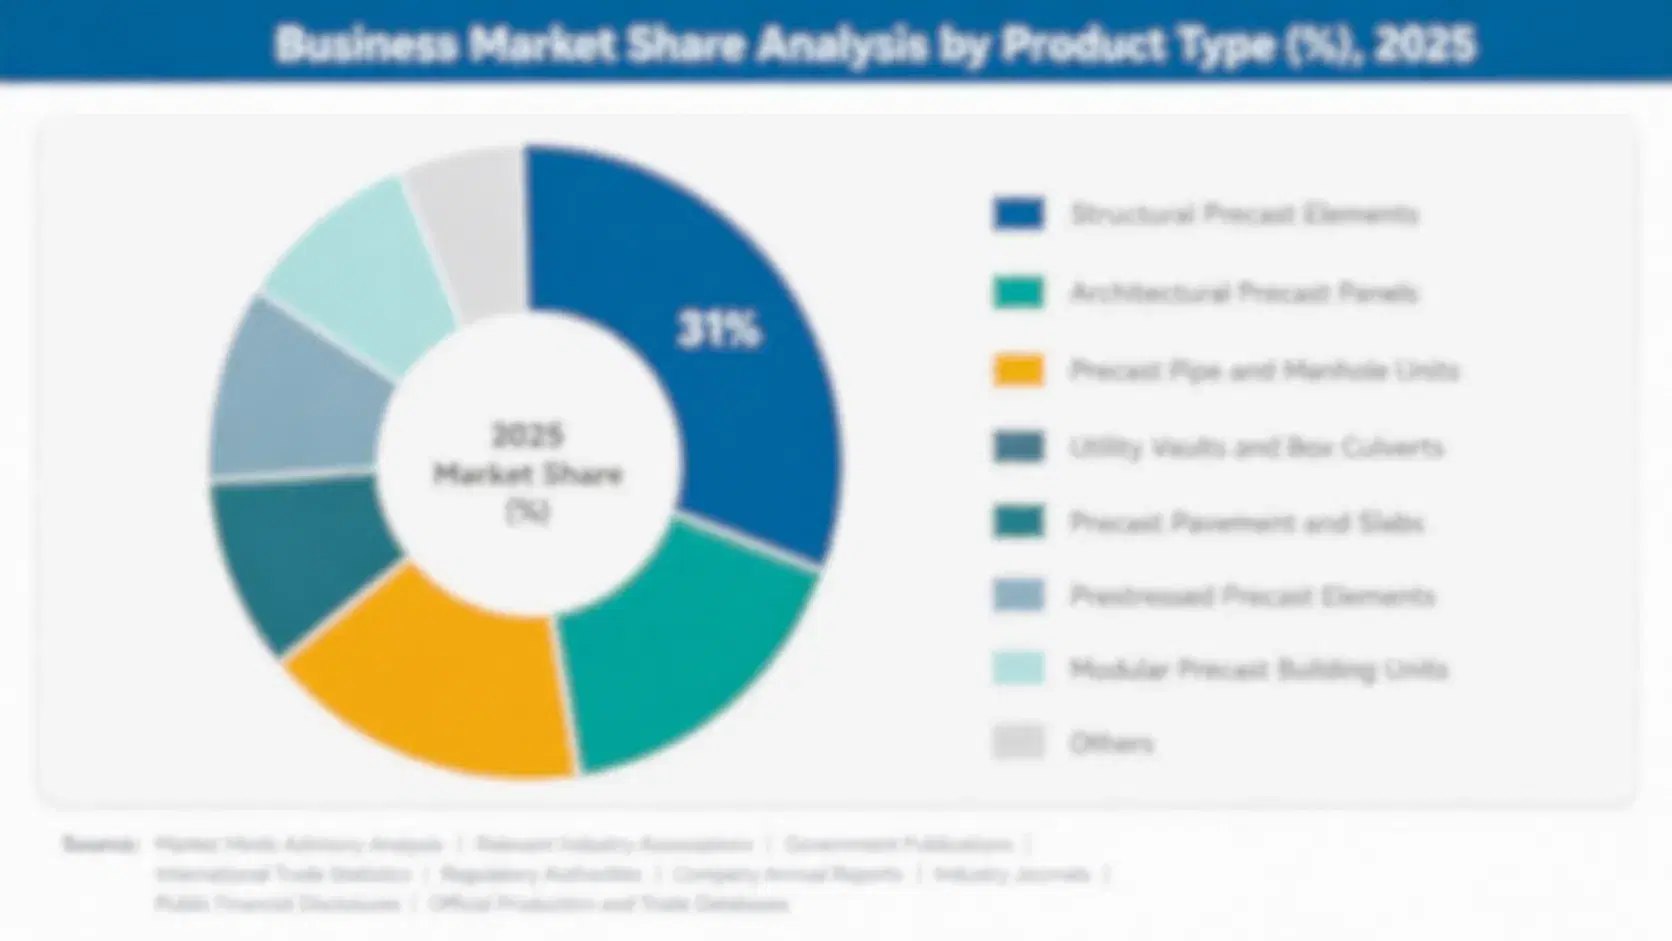
Workover rigs segment by actuation technology rather than application, since the same mechanical, hydraulic, or hybrid architecture applies whether the rig services conventional onshore wells, mature offshore platforms, or unconventional shale wells requiring intervention. Secondary classification by well depth remains useful for engineering planning purposes. Depth increasingly determines viable configuration options across basins. Mostly.
workover-rigs-market-market-share-analysis-1791020266934

Mobile Hydraulic Workover Rigs

Mobile hydraulic workover rigs use hydraulic power systems mounted on self-propelled chassis, delivering substantially faster rig-up and rig-down cycles than conventional mechanical alternatives requiring extensive crane-assisted assembly. This segment is growing at nearly six percent annually, roughly 1.5 times the overall market rate, as operators increasingly prioritize deployment speed across large well intervention campaigns covering dozens of sites. Demand concentrates heavily among operators managing extensive mature well inventories where mobilization efficiency directly drives campaign economics, creating a multi-year fleet modernization opportunity as more operators transition from mechanical rigs. Few competitors can match this deployment speed advantage quickly. Strongly across fleets. Suppliers with strong field service networks retain pricing power here consistently.
CAGR 6.2%

Conventional Mechanical Workover Rigs

Conventional mechanical workover rigs use cable-and-drum hoisting systems, remaining the dominant configuration across established basins where proven reliability outweighs the deployment speed advantages newer hydraulic designs offer. This segment is growing at 3.1 percent annually, below the overall market rate, as the configuration continues dominating volume across standard well maintenance applications. Demand concentrates among operators balancing proven reliability against the efficiency gains that mobile hydraulic alternatives would require switching equipment platforms to capture. Pricing for these systems has remained relatively stable as the technology matures further. Growth here depends heavily on continued conventional basin demand. Strongly across basins. Suppliers with strong distributor relationships retain pricing power in this segment. Strongly.
CAGR 3.1%
Full segment breakdown across 7 segments available in the complete report.

Regional Architecture and Country Demand Map

The Middle East and Africa leads on extensive Gulf state mature field maintenance programs, with North America close behind on shale well intervention activity. South Asia and Pacific posts the fastest growth as regional production ages. Regional field maturity and well inventory scale shape procurement priorities.

North America

The United States anchors regional demand through its extensive shale well inventory requiring frequent intervention to maintain production rates as unconventional wells decline faster than conventional equivalents. Independent operators represent the largest buyer segment, though major integrated companies are expanding their mature field maintenance programs as well. Canada's oil sands and conventional basins contribute a smaller but steady complementary demand pool. Several brands now offer expedited delivery for emergency replacement requests. These commitments provide suppliers with multi-year production planning visibility ahead of demand. Momentum continues building steadily each year nationwide. This locks in favorable pricing ahead of anticipated logistics cost increases. Procurement teams increasingly favor vendors with proven multi-year track records.
Share: 28% | CAGR: 4.4% (2026 to 2036)

Western Europe

Norway and the United Kingdom anchor regional demand through North Sea mature field maintenance programs tied to declining conventional offshore production requiring sustained intervention investment. Growth trails faster-growing regions since the region's offshore basin maturity means operators increasingly weigh workover economics against field abandonment decisions. Smaller onshore basins contribute minimal complementary demand given limited remaining production. This below-band share reflects declining North Sea conventional production relative to other major basins. Permitting reforms in several countries aim to accelerate future retrofit timelines. Equipment certified under one national standard typically satisfies requirements across the bloc. Momentum continues building steadily each year across the bloc. This variation complicates pan-European marketing but rarely blocks product sales entirely.
Share: 11% | CAGR: 2.7% (2026 to 2036)
Regional intelligence for 5 additional markets available in the complete report: East Asia, South Asia and Pacific, Latin America, Middle East and Africa, Eastern Europe. Contact sales@marketmindsadvisory.com.
workover-rigs-market-country-cagr-analysis-1791020267223

Monetizing Intervention Campaign Efficiency Deeply

Day rate margins on standard mechanical rigs continue compressing under competitive operator tender pressure, pushing contractors toward recurring revenue tied to long-term intervention contracts, performance-based efficiency guarantees, and fleet management services that protect margin more durably than one-time rig rental alone. The levers below concentrate where recurring revenue holds up best over time. Suppliers investing early build durable differentiation.

Long-Term Multi-Well Intervention Service Agreement Programs

Contractors offering long-term agreements that bundle rig availability with guaranteed deployment speed across a multi-well intervention campaign capture recurring revenue that smooths the lumpiness of one-time rig rentals, since operators increasingly value guaranteed campaign scheduling over spot-market rig availability. This locks operators into the contractor's own fleet relationship across the full campaign duration, since switching mid-campaign risks costly scheduling disruption. These agreements carry margins roughly 23 to 30 percentage points above standalone rig rental rates. Smaller independent contractors rarely match this scheduling reliability depth consistently. Few competitors hold comparable depth.
Market Impact: Adds 23 to 30 percentage points of margin

Performance-Based Deployment Efficiency Guarantee Service Programs

Operators increasingly pay for performance guarantee programs that lock in minimum rig-up speed and non-productive time targets backed by contractor-funded remediation if targets are missed, turning what was once a simple day rate transaction into an ongoing performance relationship with predictable renewal economics. Contractors offering this structure report contract renewal rates above 60 percent among operators managing large well inventories, since guaranteed performance reduces campaign cost uncertainty for the operator. Early adopters are locking in multi-year performance service commitments across their fleets. Few competitors can match this operational breadth quickly across large fleet networks.
Market Impact: Achieves above 60 percent annual contract renewal rate

Who Controls the Margin Pool

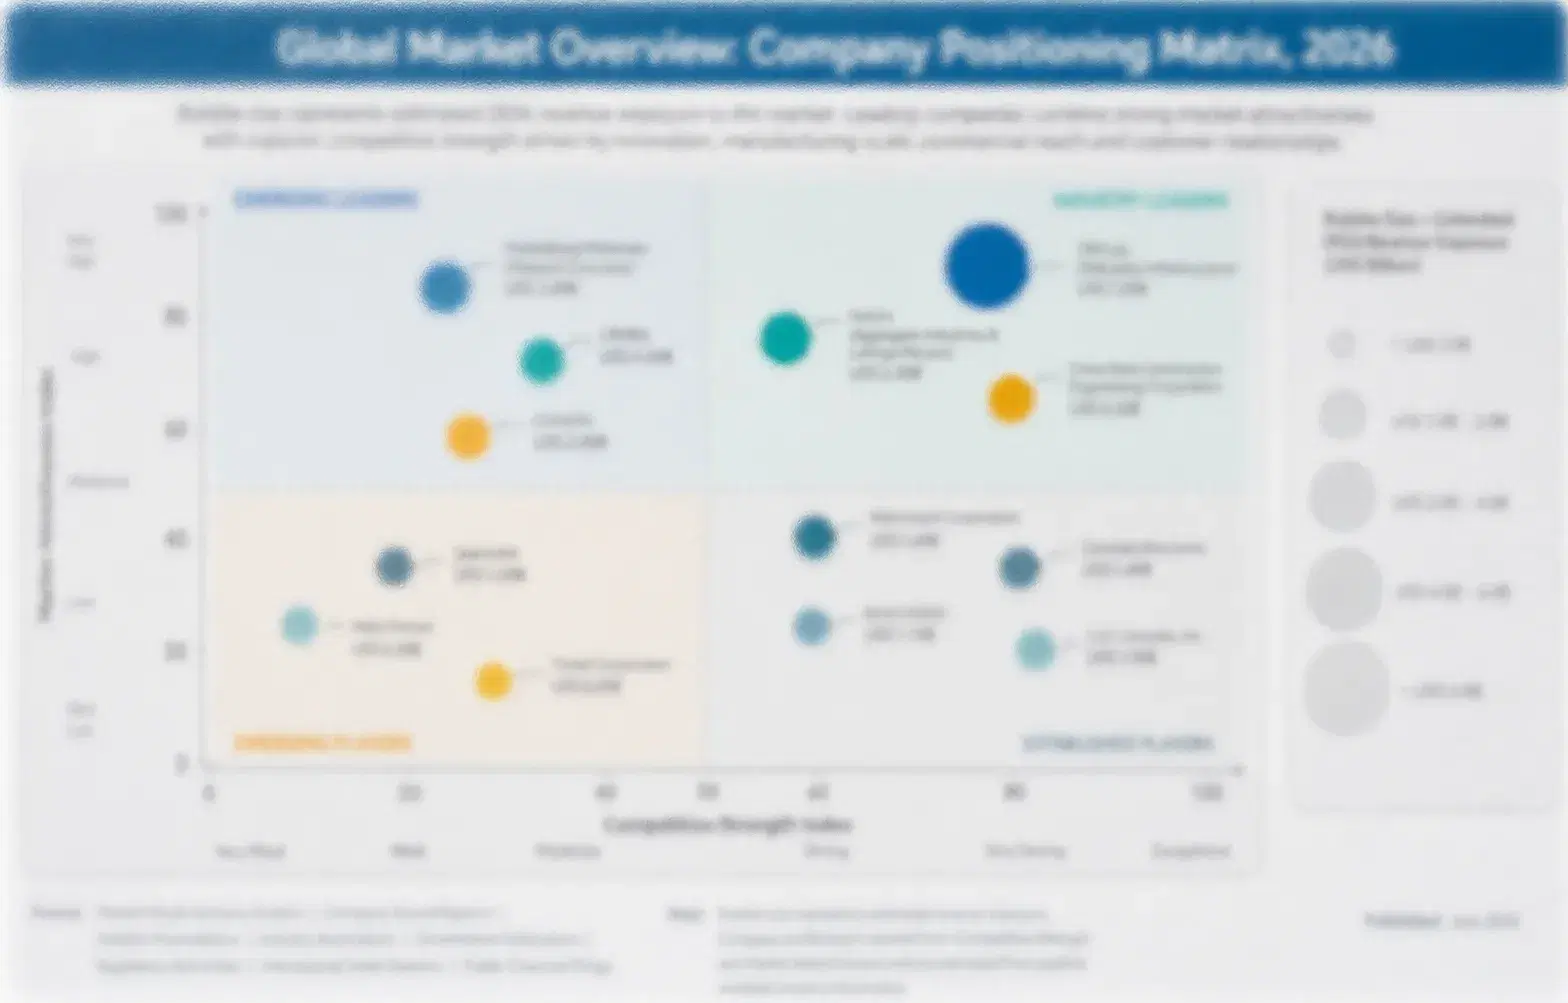
Concentration in workover rigs sits at a fragmented 41 percent across the top five suppliers on a global revenue basis, reflecting a category where regional field relationships and deployment logistics matter more than global manufacturing scale. Halliburton and Schlumberger hold the broadest integrated well intervention service offerings, while Weatherford International carries comparable scale across both mechanical and hydraulic rig lines. The gap between the leading tier and regional challengers remains modest.
Current activity centers on mobile deployment speed and automated handling capability rather than basic rig capacity, which has largely converged across established contractors. Firms increasingly bundle long-term intervention agreements and performance guarantee programs into large campaign bids, since the scheduling and performance relationship now generates a larger share of lifetime contract value than standalone day rate rental alone.

Pressure is building from regional contractors expanding mobile fleet capacity and undercutting established players on price for standard mechanical rig work in price-sensitive basins, though complex intervention and automated handling projects still favor established contractors with proven field track records. Local rig operators are also gaining share in markets favoring customization, suggesting rankings among the second tier shift within the forecast window.
workover-rigs-market-company-positioning-matrix-1791020267487

Competitive Moat and Risk Dimensions

HALLIBURTON

Moat: Broadest Integrated Service Offering

Halliburton's position rests on an integrated well intervention service offering spanning rig deployment, coiled tubing, and wireline operations, letting operators source a complete intervention package from a single qualified contractor without coordinating multiple vendors separately. This integration advantage also reduces coordination overhead for operators managing large multi-vendor campaigns.
HALLIBURTON

Risk: Exposure to Oil Price Cyclicality

Halliburton's revenue concentrates heavily in discretionary intervention spending, leaving it more exposed to oil price downturns than contractors focused on mandatory production-sustaining maintenance work that operators cannot defer indefinitely. A prolonged oil price downturn would weigh disproportionately on discretionary intervention results. Margin pressure intensifies each passing year across cycles.
SCHLUMBERGER

Moat: Deep Mobile Fleet Engineering

Schlumberger built its position on specialized mobile hydraulic rig engineering that delivers faster deployment across large intervention campaigns, a technical depth that commands premium pricing among operators prioritizing campaign efficiency over simple day rate price. This specialization also commands loyalty among operators managing extensive multi-well intervention programs.
SCHLUMBERGER

Risk: Limited Mechanical Product Breadth

Schlumberger's mobile hydraulic focus limits its natural extension into basic mechanical rig segments, where competitors with broader equipment coverage capture price-sensitive customers that Schlumberger's positioning cannot easily reach. Diversifying into mechanical segments would require years of manufacturing investment and testing. This limitation persists across most markets served.

Players Tracked

Prominent Players

Halliburton
Schlumberger
Weatherford International
Basic Energy Services
KCA Deutag

Other Key Players

Nabors Industries
Helmerich and Payne
Patterson-UTI Energy
Superior Energy Services
Key Energy Services
Precision Drilling Corporation
Ensign Energy Services
Trinidad Drilling
Forum Energy Technologies
National Oilwell Varco
Independence Contract Drilling
Pioneer Energy Services
Berry Petroleum Company
Workstrings International
Cactus Wellhead

Recent Developments

NOVEMBER 2025

Halliburton completed an organic capacity expansion at its rig manufacturing facility, adding dedicated production lines for mobile hydraulic units, responding to sustained order growth from operators expanding mature field maintenance programs across multiple basins. The expansion addresses backlog from several recent regional procurement cycles. Deliveries begin soon.
Signal: Signals confidence that mobile hydraulic rig demand will keep expanding faster than conventional mechanical rig replacement cycles.
APRIL 2026

Schlumberger signed a multi-year supply agreement with a major Saudi Arabian national oil company to guarantee workover rig availability across its expanding mature field maintenance program, supporting the company's sustained production strategy amid rising intervention demand. Terms were not fully disclosed to the public. Deliveries begin soon.
Signal: Shows Gulf state operators securing guaranteed rig supply well ahead of anticipated campaign bottlenecks. Peers may follow suit.

Structural Steel and Hydraulic Component Costs

Structural steel for mast and chassis construction represents roughly 34 to 40 percent of cost of goods sold for standard rig units, while hydraulic pumps and cylinders add another 20 to 24 percent for hydraulic configurations. Steel supply concentrates heavily in China and India, while hydraulic components source more broadly across global suppliers, leaving distinct exposure profiles across the two input categories.
Steel prices surged sharply across 2021 and into 2022 as global construction and industrial demand outpaced mill capacity recovery following pandemic-era production curtailments at major steel producers worldwide. The IEA's 2023 critical minerals review noted that downstream equipment manufacturers absorbed significant margin pressure during this period, since many multi-year contractor contracts were priced on fixed terms agreed before the steel price surge materialized. Interoperability testing adds further validation time before deployment approval.

Smaller regional manufacturers without long-term steel hedging programs carried disproportionate exposure during this period, often absorbing cost increases that larger contractors passed through more readily given their stronger operator relationships. Halliburton and Schlumberger negotiate annual volume agreements directly with steel and hydraulic suppliers that smooth exposure across cycles, giving them a durable cost advantage. This gap compounds further over successive volatility episodes industry-wide.
workover-rigs-market-cost-volatility-analysis-1791020267840

Multi-Year Steel and Hydraulic Supply Agreements

Locking in structural steel and hydraulic component volumes through multi-year supply agreements with price escalation clauses shields manufacturers from spot market volatility and lets them quote more stable pricing to operator customers even during broader commodity market disruptions affecting the wider heavy equipment industry significantly. This also shortens delivery timelines during emergency procurement situations.

Alternative Steel Alloy Qualification Program Launch

Several manufacturers are qualifying alternative lightweight alloy formulations for mast and chassis components, reducing exposure to the most constrained steel category while preserving the structural strength specifications required for reliable field operation under continuous intervention loads. This qualification process typically spans twelve to eighteen months before adoption. Vendors view this as a long-term resilience investment worth pursuing.

Portfolio Architecture for Margin Defence

Portfolio economics in workover rigs split across three tiers, with gross margins ranging from the low twenties on basic mechanical units to the high thirties on mobile hydraulic configurations with service agreements attached. The spread between tiers has widened over the past several years as commodity mechanical pricing compresses while hydraulic pricing holds firm on deployment speed advantages. Few contractors successfully compete at both ends of this spectrum simultaneously.
Volume concentrates in basic mechanical categories by unit count, but value concentrates disproportionately in mobile hydraulic units and the service agreements attached to them, creating the familiar tension where contractors must sustain mechanical-tier scale to cover fixed costs while channeling investment toward the higher-margin tiers that actually drive profit growth across the business. This divide has become more pronounced with each successive fleet modernization cycle.

High-value pools concentrate specifically around operators managing large well inventories who value deployment speed and guaranteed scheduling over unit price alone. Contractors positioned to serve these accounts capture disproportionate profitability relative to unit volume, while pure mechanical sellers compete almost entirely on price and face the thinnest margins anywhere across the category. The gap between these two groups continues widening rather than narrowing over time.

Basic mechanical workover rigs sold at high volume into standard conventional well maintenance applications, competing primarily on day rate price with minimal mobility differentiation. Replacement typically follows standard retrofit procurement cycles.
Gross Margin

Mobile hydraulic rigs carrying proven deployment speed performance, commanding premium pricing on campaign scheduling reliability and automated handling capability bundled into the agreement. Buyers increasingly expect this capability as a baseline requirement now.
Gross Margin

Advanced automated hydraulic platforms with embedded performance guarantees and reduced crew requirements, often tied to well integrity compliance mandates and safety standards. Few competitors can match this combination without years of investment.
Gross Margin
workover-rigs-market-portfolio-architecture-1791020268189

High-value Sub-segments and Strategic Watch-out

Automated Mobile Hydraulic Rig Platforms

Automated mobile hydraulic platforms combine premium pricing with the category's fastest adoption curve among operators managing extensive well inventories, positioning this segment as the clearest profit expansion opportunity through 2036 for contractors with existing automation capability. Early movers are locking in multi-year platform sourcing agreements now.

Multi-Well Campaign Service Contracts

Long-term campaign service contracts tied to guaranteed scheduling carry strong margins and steady, operator-driven purchasing cycles, though volume growth stays moderate since adoption depends on operator budget cycles. Operator budget timing heavily influences this segment's near-term trajectory. Early entrants gain lasting integration advantage over time.

Basic Mechanical Rig Equipment

The largest unit volume pool by count, carrying the thinnest margins and facing continuous price pressure from regional commodity contractors, this segment remains essential for absorbing fixed overhead across the business. Few contractors exit this tier without losing meaningful production scale. Capital flows accordingly across the organization structure.

Oil Price Cyclicality Dependency Risk

Sustained low oil prices in key markets threaten to delay the transition toward higher-margin mobile hydraulic systems longer than contractors have planned for, requiring careful capacity allocation decisions. Capital reallocation decisions made now will shape future positioning. Diversification reduces single-market dependency risk over time. Monitoring closely matters.

Well Age Cycles Anchor Recurring Demand

Demand in workover rigs behaves like an annuity tied to well age cycles and basin maturity rather than discretionary capital spending, since operators must maintain production from existing wells for the full economic life of the field regardless of broader oil price conditions. Aging well inventories and sustained capital discipline generate recurring intervention revenue that persists across economic cycles affecting other oilfield equipment categories. This reflects multi-decade asset planning.
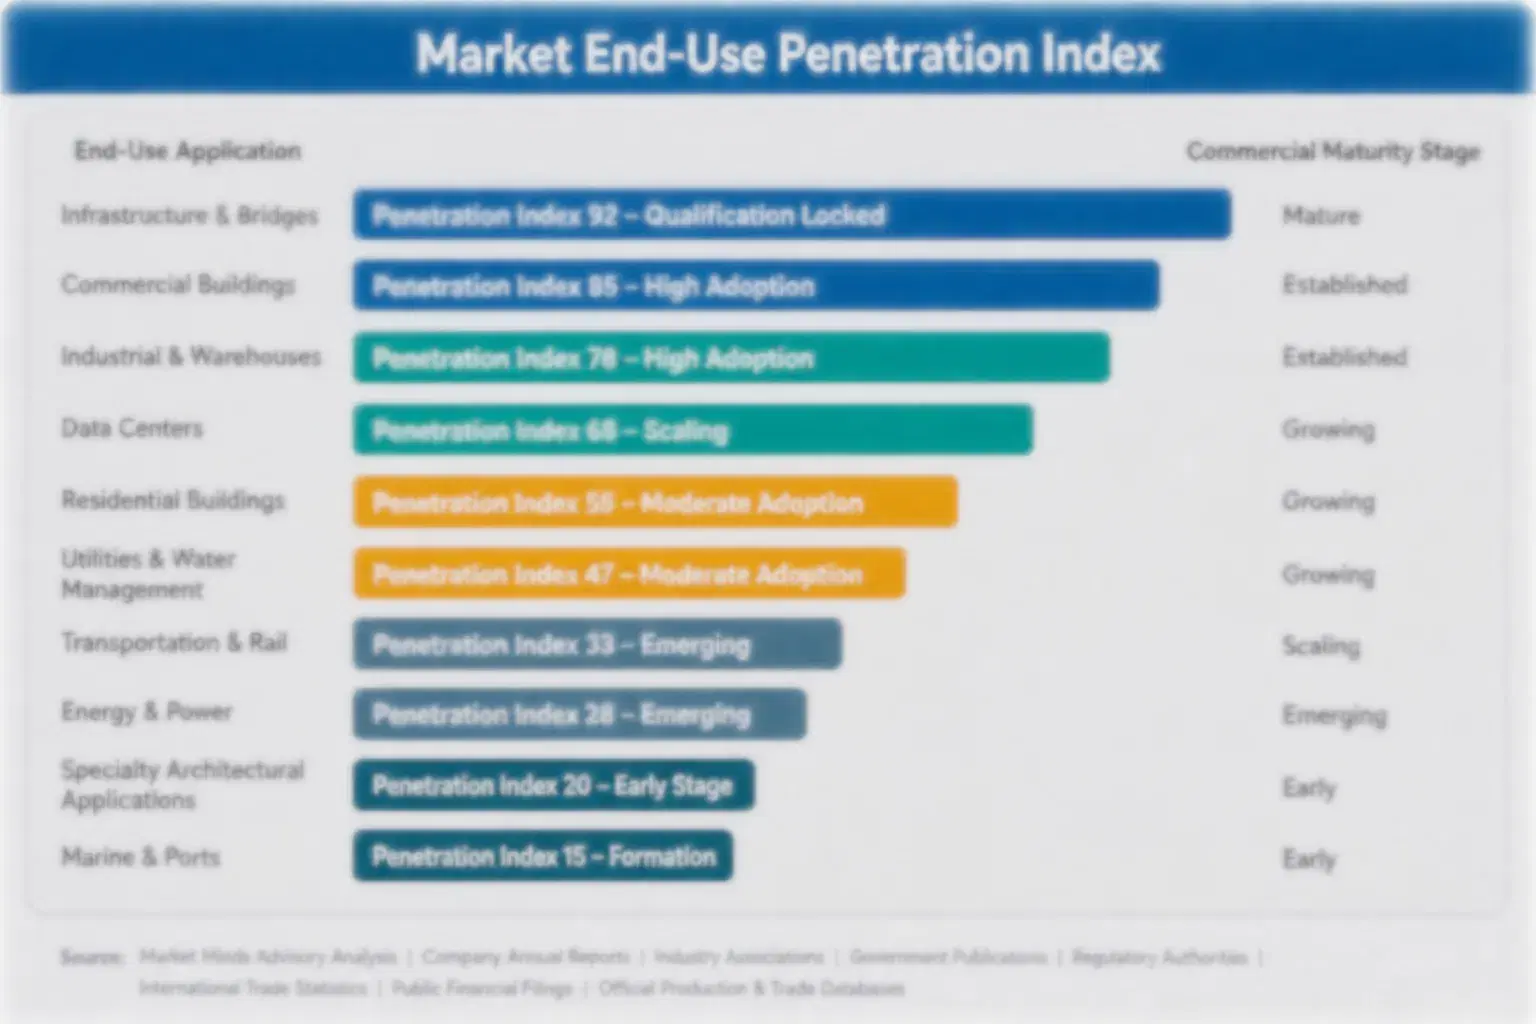
Adoption stickiness and depth vary sharply by end-use vertical. Large national oil companies retain qualified contractor relationships deeply once established, since switching mid-program risks scheduling and field familiarity complications across their extensive well inventories. Smaller independent operators show shallower stickiness, often selecting based on price for individual jobs, while major integrated companies sit between these extremes, favoring suppliers with proven field reliability. Operators value contractors who deliver on aggressive deployment timelines.

Buyer profiles are shifting generationally as procurement consolidates from individual field engineers toward centralized operator asset management teams overseeing fleet-wide intervention planning across entire producing basins simultaneously. This favors contractors offering standardized mobile platforms and guaranteed scheduling capability over smaller specialists who once won business through direct relationships with individual field engineers.
workover-rigs-market-end-use-penetration-index-1791020268579

Where to Commit Capital Next

These are among the four positions where our research anticipates prominent divergence between winners and laggards over the coming forecast period. Each is grounded in the demand model, the regulatory perimeter, and the announced capacity pipeline.
01 / MOBILE HYDRAULIC CAPACITY

Expand mobile capacity ahead of campaign demand

Mobile hydraulic workover rigs are growing at nearly six percent annually, well above the category average, driven by operators prioritizing deployment speed across large well intervention campaigns covering dozens of sites. Contractors that expand qualified mobile fleet capacity now, before the current campaign demand cycle peaks, will capture durable share before regional competitors close the remaining engineering gap. Waiting risks ceding the fastest-growing segment to better-positioned incumbents with longer fleet investment already secured, while also gaining preferred positioning for subsequent multi-year campaign cycles.
02 / CAMPAIGN SERVICE BUILDOUT

Build dedicated scheduling service capability

Long-term intervention agreements and performance guarantee programs reward contractors who demonstrate reliable scheduling capability, commanding margins well above standard day rate rental across the broader category and across most operator account relationships. Building dedicated scheduling capability turns a declining-margin rental category into a durable, high-margin recurring revenue stream that smaller competitors struggle to replicate without comparable fleet scale. Contractors without this capability today are already losing large campaign accounts to better-equipped rivals, since early contracts establish the performance baseline used in future renewal negotiations.
03 / REGIONAL MARKET POSITIONING

Prioritize South Asia and Pacific ahead of saturation

South Asia and Pacific posts the fastest regional CAGR in the category, driven by India's aging onshore production and growing offshore maintenance needs requiring intervention investment across many fields simultaneously. Contractors establishing distribution and engineering infrastructure now, well ahead of broader market awareness, will capture disproportionate share before competitors recognize the full scale of the opportunity. Entering after the growth wave peaks means competing against already-entrenched early movers on distinctly worse commercial terms, since first-mover engineering networks become difficult for later entrants to displace.
04 / DEPLOYMENT SPEED INVESTMENT

Prioritize mobility depth over price competition

Margin data shows certified premium and mobile hydraulic systems carry margins roughly double commodity mechanical units, and that gap has widened rather than closed over the past several years of pricing observation across the category. Contractors chasing unit cost reduction in commodity tiers compete directly against persistently lower-cost regional producers on their single worst competitive terms available anywhere in the category. Investing instead in broader mobility capability protects margin and builds switching costs around proven reliability that compounds over successive purchase and renewal cycles.

Engagement Snapshot From the Field

A live engagement with an industry participant carrying material or product regulatory and market exposure ahead of a defining policy shift, showing how our research translates into a defensible multi-year portfolio strategy.
MARKET MINDS ADVISORY · CLIENT ENGAGEMENT SUMMARY
Workover Rigs Producer Strategic Portfolio Review and Transition Roadmap 2026·Investment Scenario on Workover Rigs Exposure Evaluation 2025-26
CLIENT PROFILE
A regional national oil company managing a mature field intervention program approached MMA to assess whether transitioning its mechanical rig fleet to mobile hydraulic units would reduce campaign costs across its extensive well inventory given persistent capital budget constraints. MMA was engaged directly by the company's well operations division. MMA was engaged directly by the company's well operations leadership team.
STRATEGIC CHALLENGE
The company operated an aging mechanical rig fleet facing rising maintenance costs and slower deployment times that extended intervention campaigns beyond planned schedules. Leadership needed a data-driven case for whether mobile hydraulic investment would justify the transition cost within an acceptable payback period. Leadership also wanted a repeatable framework for evaluating future fleet investment decisions.
MMA APPROACH
MMA conducted a campaign-by-campaign cost analysis comparing mechanical and hydraulic rig deployment across the company's well inventory, combining historical scheduling data with maintenance and mobilization cost records. The engagement produced a phased fleet transition plan prioritizing the highest-impact well clusters first. Findings informed a revised multi-year fleet transition roadmap for operations leadership.
KEY FINDINGS
  1. Four well clusters accounted for a disproportionate share of total campaign delays across the entire intervention program. These clusters represented the clearest near-term transition priority.
  2. Mobile hydraulic deployment on these clusters was projected to reduce campaign duration within the first year of fleet transition. This timeline justified prioritizing these four clusters first.
  3. Mechanical rigs older than fifteen years showed failure rates meaningfully higher than newer hydraulic units across comparable operating conditions. Age-based retirement planning could prevent similar failures proactively.
  4. The prioritized transition plan was projected to reduce total campaign costs by approximately 23 percent (client-reported, unverified by MMA) within three years.
CLIENT PROFILE
A regional national oil company managing a mature field intervention program approached MMA to assess whether transitioning its mechanical rig fleet to mobile hydraulic units would reduce campaign costs across its extensive well inventory given persistent capital budget constraints. MMA was engaged directly by the company's well operations division. MMA was engaged directly by the company's well operations leadership team.
STRATEGIC CHALLENGE
The company operated an aging mechanical rig fleet facing rising maintenance costs and slower deployment times that extended intervention campaigns beyond planned schedules. Leadership needed a data-driven case for whether mobile hydraulic investment would justify the transition cost within an acceptable payback period. Leadership also wanted a repeatable framework for evaluating future fleet investment decisions.
MMA APPROACH
MMA conducted a campaign-by-campaign cost analysis comparing mechanical and hydraulic rig deployment across the company's well inventory, combining historical scheduling data with maintenance and mobilization cost records. The engagement produced a phased fleet transition plan prioritizing the highest-impact well clusters first. Findings informed a revised multi-year fleet transition roadmap for operations leadership.
KEY FINDINGS
  1. Four well clusters accounted for a disproportionate share of total campaign delays across the entire intervention program. These clusters represented the clearest near-term transition priority.
  2. Mobile hydraulic deployment on these clusters was projected to reduce campaign duration within the first year of fleet transition. This timeline justified prioritizing these four clusters first.
  3. Mechanical rigs older than fifteen years showed failure rates meaningfully higher than newer hydraulic units across comparable operating conditions. Age-based retirement planning could prevent similar failures proactively.
  4. The prioritized transition plan was projected to reduce total campaign costs by approximately 23 percent (client-reported, unverified by MMA) within three years.
RECOMMENDED STRATEGY
Phase 1: Phase one: deploy mobile hydraulic rigs on the four highest-impact well clusters within the next two fiscal years. This phase carries the highest near-term operational urgency. Phase 2: Phase two: retire mechanical rigs older than fifteen years across the remaining well inventory on a rolling schedule. This pacing aligns with normal capital budget allocation cycles. Phase 3: Phase three: establish an ongoing campaign performance monitoring program to continuously reprioritize future fleet decisions. This system flags units approaching their typical service life limit.
OUTCOME
The company began phase one hydraulic deployment within the current fiscal year and initiated retirement planning for aging mechanical units (client-reported, unverified by MMA). Well operations leadership adopted the campaign performance framework as a standing annual fleet planning process across the broader well inventory. Leadership credited the approach with accelerating confident decisions.

Frequently Asked Questions

Foundational context covering the market sizes, CAGR, scope, country, region and competition that inform every finding below. This section is provided to cover basics and most often pre-purchase conversations, answered from the MMA Primary Research Dataset.

What is the current size of the Workover Rigs Market?

The global workover rigs market is valued at 4.7 billion dollars in 2025. Demand is sustained by aging well inventories and sustained capital discipline worldwide.

How large will the Workover Rigs Market be by 2036?

The market is projected to reach 7.313 billion dollars by 2036, up from 4.893 billion dollars in 2026. This represents a cumulative increase of 2.42 billion dollars across the forecast decade.

What is the CAGR for the Workover Rigs Market 2026 to 2036?

The market is forecast to grow at a 4.1 percent CAGR between 2026 and 2036. Bull and bear scenarios range between 2.9 and 5.3 percent depending on oil price conditions.

Which segment is growing fastest?

Mobile hydraulic workover rigs lead at a 6.2 percent CAGR, roughly 1.5 times the overall market rate. Faster rig-up and rig-down cycles drive this outperformance.

Who are the major companies in the Workover Rigs Market?

Halliburton, Schlumberger, Weatherford International, Basic Energy Services, and KCA Deutag lead the category, together holding a 41 percent combined share. Combined scale shapes competitive dynamics significantly.

Which country is growing fastest?

Saudi Arabia leads country-level growth at a 5.8 percent CAGR, driven by extensive mature field maintenance programs across its largest oil fields. Growth continues steadily.

Report Segmentation Architecture

The full report scope spans multiple orthogonal segmentation dimensions, with cross-tabulated demand data provided for each dimension pair. Coverage extends further to regional breakdowns, trend trajectories, and the competitive detail needed to support segment-level decision-making.

By Product Type

    By End-Use Industry

      By Commercial Dimension

        By Region

        • North America
        • Western Europe
        • East Asia
        • South Asia and Pacific
        • Latin America
        • Middle East and Africa
        • Eastern Europe

        Scope, Methodology, and Coverage

        Every figure in this report is reproducible from documented input assumptions. The scope below maps the historical period, the forecast horizon, the segmentation dimensions, and the countries covered, alongside the underlying primary and qualitative methodology.
        Historical Period
        2020 to 2025
        Forecast Period
        2026 to 2036
        Base Year
        2025 (USD billions; MMA Primary Research Dataset, October 2026)
        Market Definition
        This report covers mobile and permanent rig equipment used to perform well intervention, workover, and maintenance operations on existing oil and gas wells, including mechanical, hydraulic, and hybrid rig configurations. It excludes drilling rigs used for new well construction, coiled tubing units sold as standalone equipment, and wireline intervention tools sold independently of the rig structure itself.
        Quantitative Units
        USD billions
        Segmentation Dimensions
        Regions Covered
        North America, Western Europe, East Asia, South Asia and Pacific, Latin America, Middle East and Africa, Eastern Europe
        Countries Covered
        Key Companies Profiled
        Halliburton, Schlumberger, Weatherford International, Basic Energy Services, KCA Deutag, Nabors Industries, Helmerich and Payne, Patterson-UTI Energy, Superior Energy Services, Key Energy Services, Precision Drilling Corporation, Ensign Energy Services, Trinidad Drilling, Forum Energy Technologies, National Oilwell Varco, Independence Contract Drilling, Pioneer Energy Services, Berry Petroleum Company, Workstrings International, Cactus Wellhead
        Quantitative Methodology
        Primary survey, n=3,800 respondents, Q4 2025, six countries; demand-side model with trade association cross-validation
        Qualitative Methodology
        47 expert interviews, Q4 2025; applied to validate demand model assumptions, identify emerging dynamics, and assess competitive positioning
        Report Format
        PDF and XLSX data workbook (Word format preview document)
        Publisher
        Market Minds Advisory
        Report Code
        MMA-2026-ENE-331
        Published
        October 2026
        Contact
        sales@marketmindsadvisory.com | www.marketmindsadvisory.com

        Purchase the full Workover Rigs Market Report (2026 to 2036).

        The full report expands every section summarized here into complete analytical depth. It includes the full segmentation model across all six segments, detailed profiles of all twenty tracked competitors, and the complete regional dataset across all seven markets covered in this research program. It also adds extended trend, driver, and restraint coverage well beyond the two visible items shown in each category here, along with full input cost and portfolio tier analysis. Buyers additionally receive the underlying primary survey dataset and full expert interview summary notes.
        Complete six-segment MECE breakdown with margins
        Full twenty-company competitive profile set included
        All seven regional markets with demand mechanisms
        Extended trend, driver, and restraint library
        Primary survey dataset access, n=3,800 respondents
        Expert interview summary notes, 47 interviews

        Built For The People Who Decide

        From boardroom strategy to bench-side execution, this report is read cover-to-cover by leaders shaping the next decade of their industry, turning demand scenarios, market dynamics and valuation benchmarks into decisions.
        CXOs/ Presidents/ VPs/ Managers
        M&A and Corporate Development
        Strategy Teams and R&D Heads
        Procurement and Product Directors
        Regulatory and Compliance Leaders
        Investor Relations and Equity Analysts