Market Minds Advisory
Wireless Sensor Network Market

Wireless Sensor Network Market: Wireless Sensor Network Market. Trends and Forecast 2026 to 2036

Industrial predictive maintenance programs and smart city infrastructure investment are pushing wireless sensor networks past pilot deployment into standard operational infrastructure, forcing vendors to prove battery life and mesh network reliability at scale.

Lead Analyst

Published

September 2026

Make Smarter Decisions with Customized Research Insights

Request a free sample report and evaluate market opportunities, growth trends, and competitive dynamics relevant to your business needs.

2025 MARKET VALUE$9.8BMarket Size 2025
2036 FORECAST VALUE$30.9BBase Case , 2026 to 2036
CAGR 2026 TO 203611.0 %Bull 12.3% / Bear 9.8%
INCREMENTAL OPPORTUNITY$20.0BNet 10- year value creation
EXPANSION MULTIPLE2.84x2036 value over 2026 base
Strategic Levers
M&A Pipeline
Regional Outlook
Country Rankings
Competitive Intelligence
Segmental Deep-dive
Call-Us : 91 93563 13602

Executive Snapshot and Market Trajectory.

Wireless sensor networks are moving from isolated pilot deployments into standard industrial and municipal infrastructure, as predictive maintenance programs and smart city investment demand continuous, reliable monitoring across large distributed sensor deployments beyond what wired alternatives can economically support today across most regions.
Commercial demand concentrates around industrial IoT wireless sensor networks serving predictive maintenance and asset monitoring applications, with manufacturing and energy sector customers increasingly specifying mesh network reliability and battery life requirements in equipment procurement contracts across most major industrial verticals. North America leads given concentrated industrial IoT technology vendor headquarters and the largest installed base of connected manufacturing infrastructure requiring sensor network integration or expansion across major industrial sectors.
Competitive intensity remains moderate, with the top five vendors controlling roughly 37% of global revenue given the specialized mesh networking protocol expertise and battery efficiency engineering required to compete effectively across diverse deployment environments, price segments, and geographies across most industries today. Rising demand for standardized interoperability protocols connecting sensors across multiple vendors is reshaping competitive dynamics, favoring vendors with proven large-scale deployment reliability over smaller competitors lacking comparable field performance track records.
Market Definition
The Wireless Sensor Network Market covers interconnected sensor nodes communicating via low-power wireless protocols to monitor environmental, industrial, or infrastructure conditions without requiring dedicated wired connectivity to each individual sensor point. It excludes standalone single-sensor devices and general Wi-Fi infrastructure unrelated to distributed sensor mesh applications.
Base Year Value
$9.8B in 2025 (MMA Primary Research Dataset, September 2026)
Forecast Period
2026 to 2036, eleven discrete annual values
CAGR
11.0% base case. Bull 12.3%. Bear 9.8%.
Fastest Growth Segment
Industrial IoT Wireless Sensor Networks: 16.0% CAGR
Fastest Growth Country
China: 13.5% CAGR
Fastest Growth Region
South Asia and Pacific: 13.0% CAGR
Largest Region
North America: 29% of 2025 global value
Market Leaders
Leading participants include Honeywell, Siemens, Cisco Systems, ABB, and Schneider Electric. Source: MMA Analysis based on company annual reports.
Primary Survey
n=3,800 procurement and R&D decision-makers, Q4 2025, six countries
Methodology
Demand-side build-up, cross-validated against public data, 47 expert interviews

Wireless Sensor Network Market Forecast Scenarios

wireless-sensor-network-market-size-forecast-scenario-1789990371983
Wireless sensor network demand grew steadily through 2020 to 2025 as declining sensor cost and improving mesh networking protocol reliability expanded industrial IoT adoption beyond early pilot deployments across major manufacturing economies. Growth accelerated toward the end of the historical period as predictive maintenance program adoption expanded meaningfully across industrial sectors, pushing the historical CAGR to 10.0% by the period's close.
The base case assumes industrial IoT adoption and smart city infrastructure investment keep expanding wireless sensor network demand through the forecast decade. Three mechanisms drive this: manufacturing operations deploying predictive maintenance sensor networks to reduce unplanned equipment downtime and maintenance cost, municipal governments investing in smart city infrastructure requiring distributed environmental and traffic monitoring sensor deployment, and declining sensor and battery cost expanding the addressable market into smaller deployment scales previously uneconomical to justify.
The bull case centers on accelerated smart city infrastructure investment pulling forward sensor network deployment well ahead of current adoption timelines across major municipal markets. The bear risk is cybersecurity vulnerability concern: if a major connected sensor network security breach occurs, regulatory restrictions and enterprise risk aversion could slow adoption meaningfully across the industry, favoring more conservative wired monitoring alternatives temporarily.

Where Deployment Reliability Determines Vendor Selection

Wireless sensor networks have moved from experimental pilot technology into essential industrial and municipal monitoring infrastructure, since predictive maintenance programs and smart city systems increasingly depend on continuous, distributed sensor data that wired alternatives cannot economically support at comparable deployment scale. Vendors competing for the largest industrial and municipal contracts increasingly differentiate on mesh network reliability and battery life specifications rather than general brand recognition alone.
MARKET CONCENTRATION37% CR5Top five vendors control global sensor network revenue share
AVERAGE NODE COST$28 per unitBlended average cost across industrial and environmental sensor node categories
TOP ADOPTING COUNTRY SHARE31%United States share of global sensor network deployment volume currently
INDUSTRIAL IOT APPLICATION SHARE44% of revenueIndustrial predictive maintenance portion of total sensor network revenue
BATTERY LIFE AVERAGE3 to 5 yearsTypical continuous operation duration before sensor battery replacement required
NETWORK NODE DENSITY50 to 200 nodesTypical sensor count per deployed industrial mesh network installation currently
The United States represents the largest single-country market given concentrated industrial IoT technology vendor headquarters and the largest installed base of connected manufacturing infrastructure requiring sensor network integration. Industrial predictive maintenance applications represent the largest revenue category, reflecting sustained manufacturing sector investment in reducing unplanned equipment downtime through continuous condition monitoring across expanding industrial facility deployments.
Battery life remains a persistent technical constraint shaping deployment economics, since sensor networks spanning hundreds of nodes across large industrial facilities require infrequent battery replacement to avoid prohibitive maintenance labor cost undermining the economic case for wireless deployment. Network node density continues expanding as sensor cost decline enables more granular monitoring coverage, giving vendors offering proven large-scale mesh network reliability a durable advantage over competitors with less established field deployment track records.
"A sensor network used to mean running conduit to every measurement point in a facility. Now it means dropping battery-powered nodes wherever you need data, and that shift has quietly rewritten the economics of industrial monitoring."
Director, Industrial IoT and Connected Infrastructure Practice · MMA Technology Practice · September 2026

Market Trends

Predictive Maintenance Programs Drive Industrial Deployment

Manufacturing operations are increasingly deploying wireless sensor networks specifically for predictive maintenance applications, using vibration, temperature, and acoustic sensor data to identify equipment failure risk before catastrophic breakdown occurs during production operations. This adoption pattern is driven by the substantial cost differential between planned maintenance interventions and unplanned equipment downtime, which can halt entire production lines for extended periods depending on the affected equipment criticality. Vendors offering validated predictive maintenance analytics platforms integrated directly with sensor network hardware are capturing disproportionate share of new industrial deployment contracts as manufacturers increasingly demand complete integrated solutions.
Market Impact: Expands addressable market by roughly 30%
Smart City Infrastructure Investment Expands Municipal Demand

Municipal governments across major global cities are investing in smart city infrastructure programs requiring distributed environmental, traffic, and utility monitoring sensor networks covering large geographic areas previously monitored through periodic manual inspection or limited fixed monitoring stations. This investment reflects growing recognition that continuous, granular monitoring data enables more responsive municipal service delivery and resource allocation decisions than periodic manual data collection approaches previously provided. Vendors with proven large-scale municipal deployment experience are capturing disproportionate share of new smart city infrastructure contracts as more cities launch comparable digital infrastructure investment programs.
Market Impact: Improves network reliability by roughly 22%

Market Opportunities and Growth Drivers

Declining Sensor Cost Expands Addressable Market

Sensor node manufacturing cost has declined meaningfully as production volume scales and semiconductor component pricing continues falling, allowing vendors to introduce wireless sensor networks at price points accessible to smaller deployment scales previously uneconomical to justify given upfront capital requirements. This cost decline is expanding the addressable market beyond large industrial facilities and major municipal governments toward smaller manufacturing operations and mid-sized cities previously priced out of comprehensive sensor network deployment. Expanding the addressable market beyond premium deployments is creating meaningfully larger unit volume opportunity than the category achieved when sensor networks remained priced primarily for major industrial customers.
Market Impact: Security reviews add 4 months delay

Mesh Networking Protocol Standardization Improves Reliability

Standardized mesh networking protocols enabling sensor nodes to relay data through neighboring nodes rather than requiring direct connectivity to a central gateway are improving deployment reliability and coverage range beyond earlier generation point-to-point wireless sensor architectures. This protocol standardization is reducing deployment complexity and improving network resilience, since mesh architectures can automatically reroute data transmission around failed or obstructed nodes without requiring manual network reconfiguration by technical staff. Vendors adopting standardized mesh protocols are capturing disproportionate share of new large-scale deployment contracts as customers increasingly demand proven network resilience over proprietary point-to-point architectures.
Market Impact: Battery logistics add 10% to costs

Market Restraints and Challenges

Cybersecurity Vulnerability Concerns Slow Enterprise Adoption

Connected sensor networks represent an expanding attack surface for cybersecurity threats, with several publicized security vulnerabilities in industrial wireless sensor deployments raising enterprise IT department concerns about deploying additional connected infrastructure without extensive security validation testing. The root cause is that many wireless sensor manufacturers historically prioritized power efficiency and cost over cybersecurity engineering, creating a legacy vulnerability gap that newer regulatory requirements are only beginning to address systematically. Vendors are mitigating this through dedicated cybersecurity engineering investment and third-party penetration testing certification, though enterprise procurement committees increasingly demand extensive security documentation before approving new connected deployments.
Market Impact: Predictive maintenance deployments grow 25%

Battery Replacement Logistics Complicate Large-Scale Deployment

Large-scale wireless sensor network deployments spanning hundreds or thousands of nodes across industrial facilities create meaningful ongoing battery replacement logistics challenges that undermine the maintenance cost advantage wireless deployment is supposed to deliver over wired alternatives. The root cause is that battery technology improvement has not kept pace with growing sensor deployment scale, requiring facility technicians to manage complex replacement schedules across geographically distributed sensor node populations. Vendors are mitigating this through energy harvesting technology and extended battery life engineering that reduces replacement frequency, alongside remote battery status monitoring that enables proactive replacement scheduling.
Market Impact: Smart city deployments grow over 20%
3 additional market trends, 4 additional growth drivers, and 2 additional restraints and challenges are covered in the full report. Contact sales@marketmindsadvisory.com to access the complete intelligence.

Segment CAGR and Growth Architecture

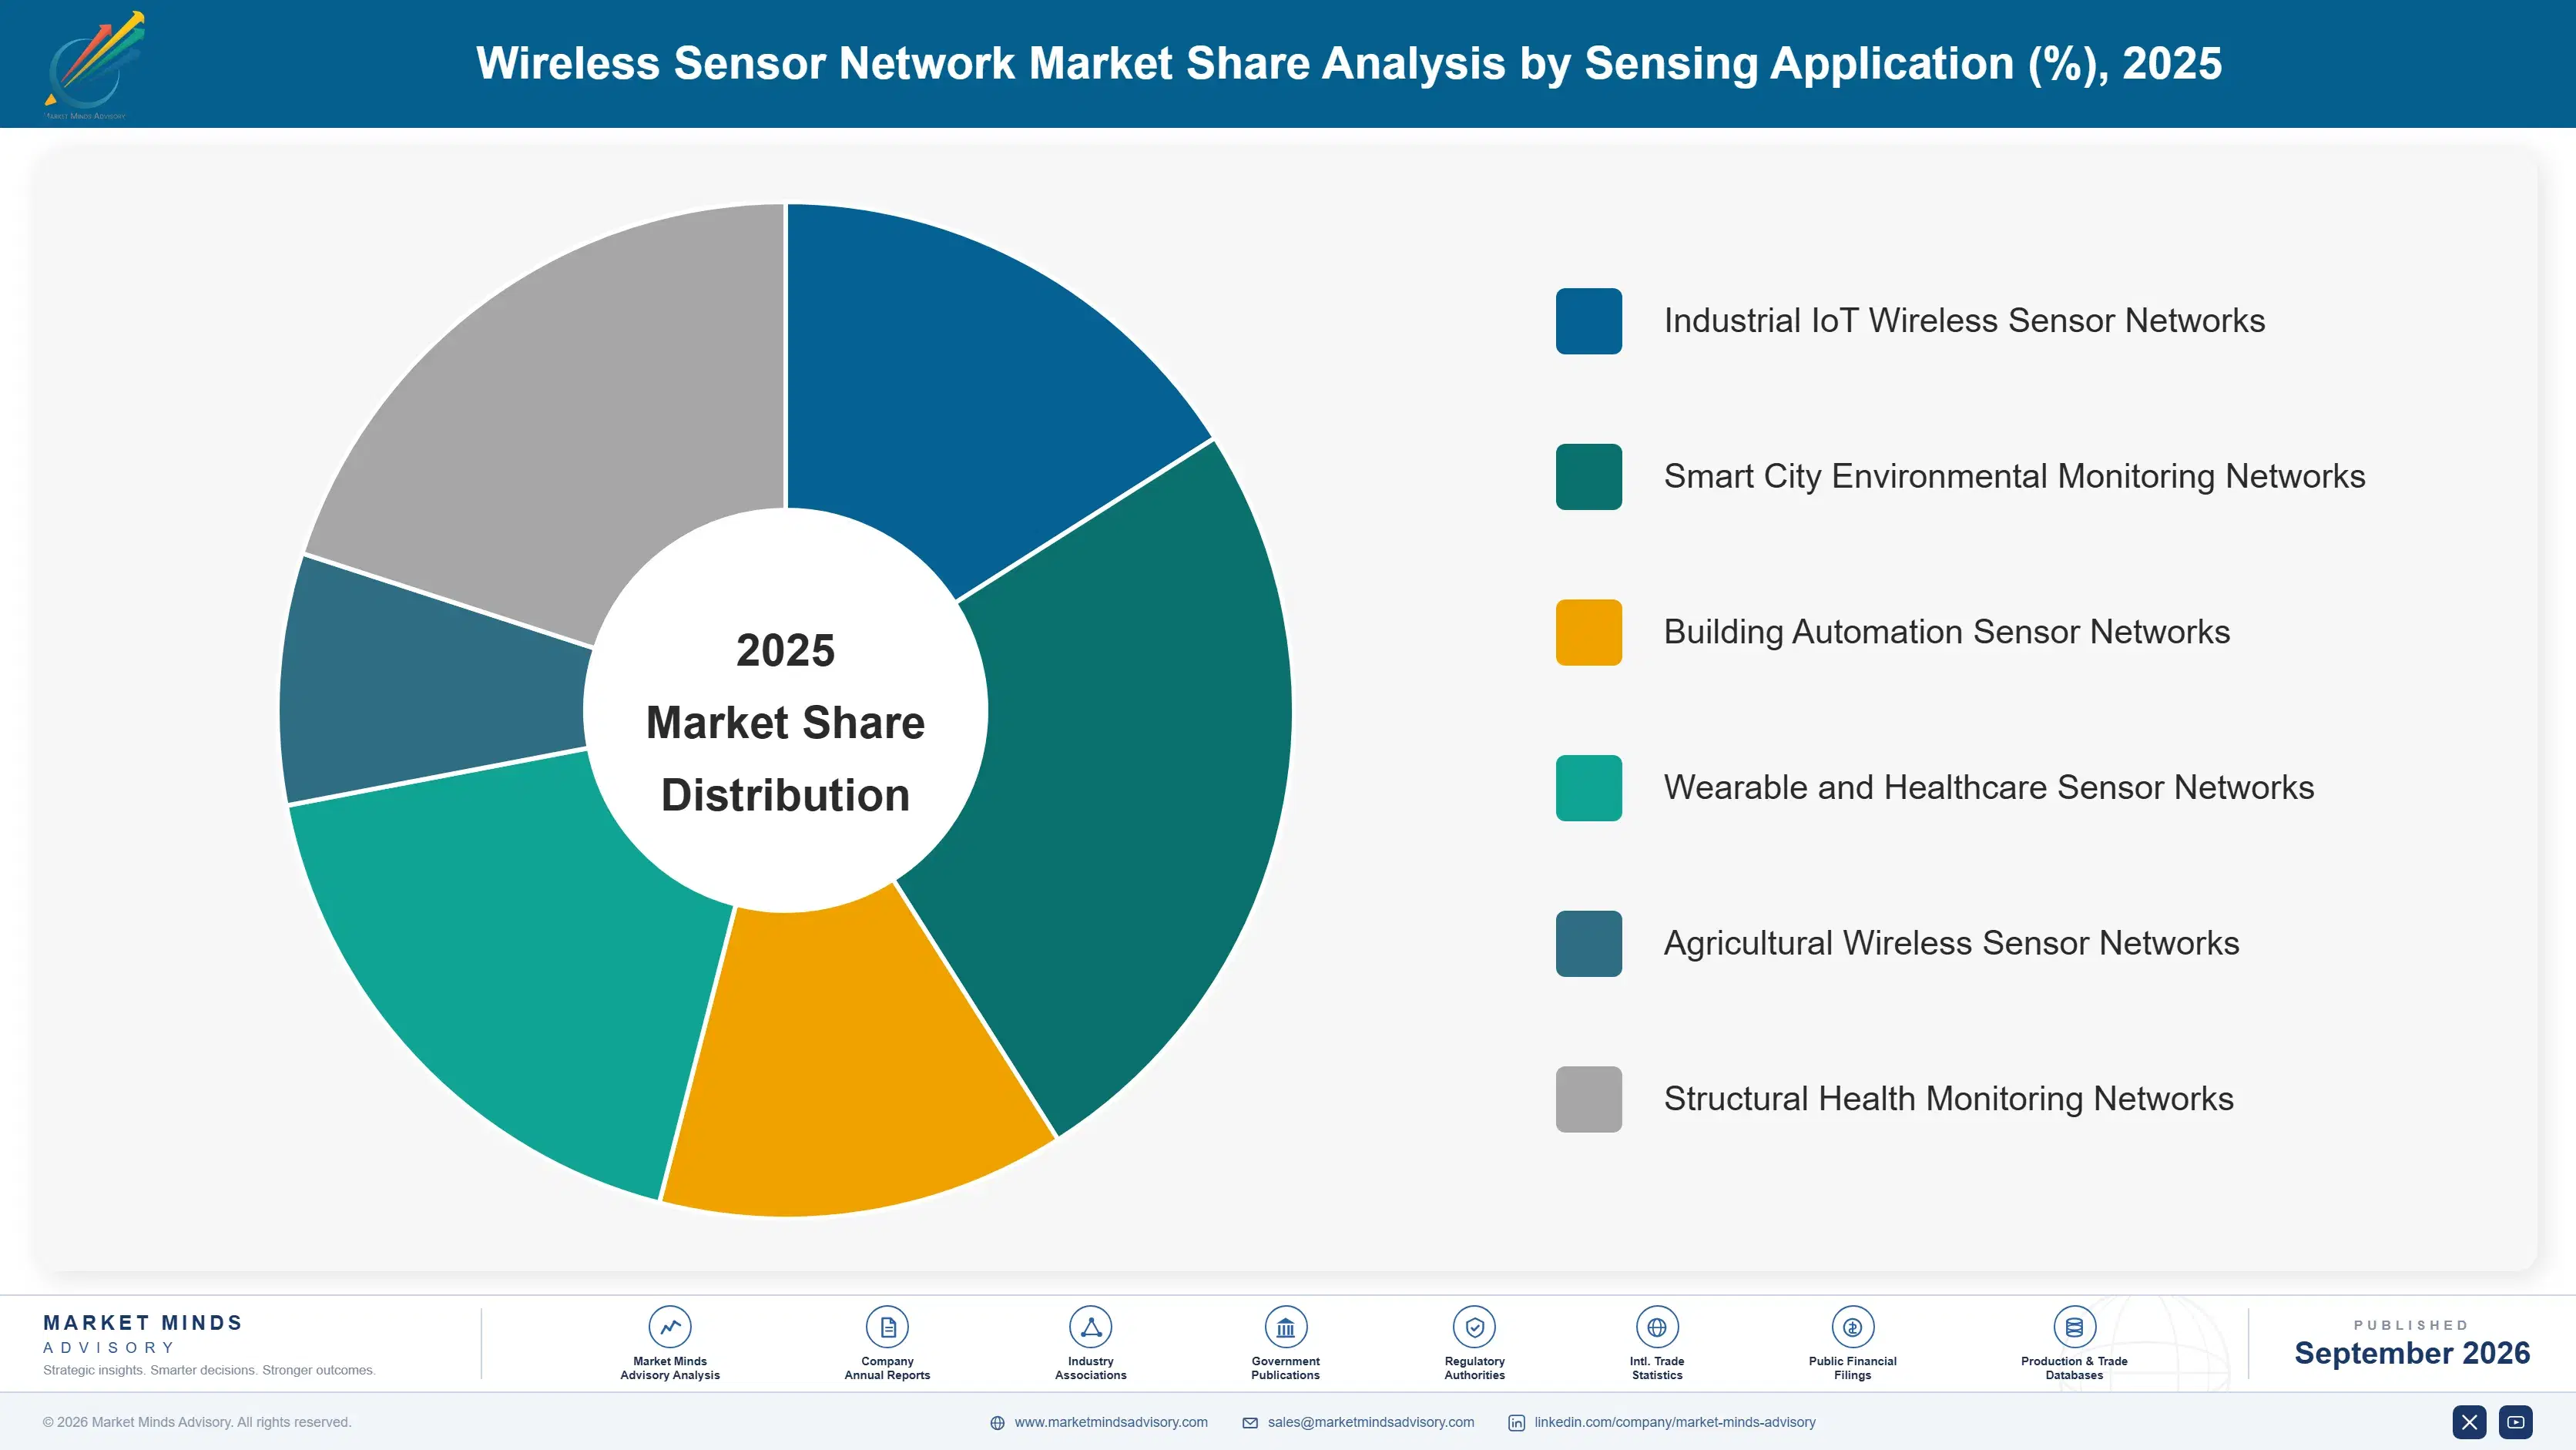
Wireless sensor networks segment by application environment across six categories spanning industrial, smart city, agricultural, building automation, structural health, and healthcare monitoring deployment types sold across most industrial, municipal, and healthcare markets and regions worldwide today. Each reflects a distinct deployment environment and reliability requirement rather than overlapping product tiers within a single category.
wireless-sensor-network-market-market-share-analysis-1789990372522

Industrial IoT Wireless Sensor Networks

Industrial IoT wireless sensor networks form the fastest-growing segment, expanding at 16.0% CAGR as manufacturing operations increasingly deploy predictive maintenance sensor networks using vibration, temperature, and acoustic sensor data to identify equipment failure risk before catastrophic breakdown occurs during production operations. This segment benefits from a compelling cost justification, since preventing a single major unplanned production line shutdown often more than offsets the entire annual cost of a comprehensive sensor network deployment covering critical manufacturing equipment. Vendors offering validated predictive maintenance analytics platforms integrated directly with sensor network hardware are capturing disproportionate share of new industrial contracts as manufacturers increasingly demand complete integrated solutions rather than standalone sensor hardware requiring separate analytics integration work.
CAGR 16.0%

Smart City Environmental Monitoring Networks

Smart city environmental monitoring networks form the second-fastest-growing segment at 13.5% CAGR, driven by municipal government investment in distributed environmental, traffic, and utility monitoring sensor networks covering large geographic areas previously monitored through periodic manual inspection and limited fixed monitoring stations across most jurisdictions. This segment benefits from growing recognition that continuous, granular monitoring data enables more responsive municipal service delivery and resource allocation decisions than periodic manual data collection approaches previously provided city administrators managing complex infrastructure systems. Vendors with proven large-scale municipal deployment experience are capturing disproportionate share of new smart city infrastructure contracts as more cities launch comparable digital infrastructure investment programs across their jurisdictions and neighboring regions.
CAGR 13.5%
Full segment breakdown across 7 segments available in the complete report.

Regional Architecture and Country Demand Map

North America leads given concentrated industrial IoT technology vendor headquarters and the largest existing installed base of connected manufacturing infrastructure requiring ongoing expansion, while South Asia and Pacific grows fastest as expanding manufacturing capacity and smart city infrastructure investment drive rising demand across the region.

North America

The United States hosts the headquarters of Honeywell, Cisco, and most other major industrial IoT technology vendors, giving the region both the deepest product innovation pipeline and the largest installed base of connected manufacturing infrastructure requiring sensor network integration or expansion. Manufacturing operations across major industrial states are leading predictive maintenance sensor network adoption specifically to reduce unplanned equipment downtime costs that can halt entire production lines for extended periods. Canada's smaller industrial sector follows similar adoption patterns at a somewhat reduced pace given more fragmented manufacturing base relative to concentrated American industrial clusters. Group purchasing negotiations increasingly favor vendors with proven large-scale deployment reliability, consolidating equipment relationships among fewer established sensor network providers than in prior years.
Share: 29% | CAGR: 11.5% (2026 to 2036)

Western Europe

Germany's advanced manufacturing sector, anchored by established industrial automation companies including Siemens, drives substantial regional demand for wireless sensor networks supporting predictive maintenance and quality control applications across major manufacturing facilities. France and the United Kingdom maintain meaningful smart city infrastructure investment programs requiring distributed environmental and traffic monitoring sensor deployment across major metropolitan areas. Regional growth trails North America somewhat given more constrained industrial capital investment budgets and slower predictive maintenance program adoption relative to American manufacturing sector digitalization pace. Nordic countries are also investing steadily in industrial digitalization pilots, requiring sensor networks suited to specialized manufacturing applications beyond standard predictive maintenance use cases. Financing structures are evolving to support smaller manufacturer adoption.
Share: 22% | CAGR: 9.5% (2026 to 2036)
Regional intelligence for 5 additional markets available in the complete report: East Asia, South Asia and Pacific, Latin America, Middle East and Africa, Eastern Europe. Contact sales@marketmindsadvisory.com.
wireless-sensor-network-market-country-cagr-analysis-1789990373050

Where Vendors Can Defend Pricing Power

Wireless sensor network vendors face steady price pressure from cost-conscious enterprise procurement, but four commercial levers let disciplined companies defend margin and win the largest new deployment contracts across the coming forecast decade. Each requires different capability investment, and vendors combining several simultaneously are pulling ahead of single-lever competitors across most application segments today.

Predictive Maintenance Analytics Platform Integration Strategy

Vendors offering validated predictive maintenance analytics platforms integrated directly with sensor network hardware capture premium pricing that generic sensor hardware assemblers cannot access, since customers increasingly demand complete solutions rather than standalone sensors requiring separate analytics integration work. This integrated capability requires sustained software development investment distinct from traditional hardware manufacturing, but delivers meaningful differentiation as manufacturers demand validated analytics accuracy before large-scale contract commitments. Vendors with integrated analytics platforms are commanding roughly 30% higher contract values than competitors selling standalone sensor hardware. Referral relationships with existing manufacturing customers also compound this pricing advantage over time.
Market Impact: Commands roughly 30% higher overall contract values annually

Large-Scale Deployment Reliability and Track Record

Vendors with proven large-scale deployment reliability across thousands of sensor nodes capture preferred vendor status with enterprise and municipal customers increasingly demanding demonstrated field performance evidence before committing to comparable large-scale contracts. This track record capability requires sustained investment in deployment monitoring and reliability engineering across multiple customer environments over extended time periods. Vendors with established large-scale deployment track records are winning contracts at price points roughly 25% above competitors lacking comparable proven field performance history. Fee structures also include ongoing technical support subscription components tied to deployment fleet size.
Market Impact: Wins contracts at prices roughly 25% above most peers

Extended Battery Life and Energy Harvesting Engineering

Vendors investing in extended battery life engineering and energy harvesting technology capture consumer confidence and total cost of ownership advantage that competitors offering standard battery specifications cannot match, given persistent customer concern about ongoing battery replacement logistics and labor cost. This engineering investment requires sustained research in power efficiency distinct from standard sensor manufacturing work, but delivers meaningful competitive differentiation as battery replacement logistics remain a documented barrier limiting broader large-scale deployment adoption. Vendors offering extended battery life are achieving deployment scale rates roughly 28% higher than competitors offering only standard battery specifications.
Market Impact: Achieves deployment rates roughly 28% higher each year

Standardized Interoperability Protocol Certification and Compliance Investment

Vendors achieving certified interoperability compliance across multiple wireless sensor network standards capture preferred vendor status with enterprise customers increasingly specifying multi-vendor compatibility requirements to avoid vendor lock-in across their expanding sensor deployment fleets. This certification requires sustained engineering investment ensuring compatibility across evolving industry standards, but delivers meaningful competitive advantage as customers seek flexibility for future equipment purchases. Vendors with broad interoperability certification are capturing customer relationships worth roughly 32% more in total lifetime contract value than competitors offering only proprietary protocols. This flexibility advantage also compounds further as customer sensor deployment fleets continue expanding.
Market Impact: Captures relationships worth roughly 32% more each year

Who Controls the Margin Pool

The wireless sensor network market shows moderate concentration, with the top five vendors controlling roughly 37% of global revenue given the specialized mesh networking protocol expertise and battery efficiency engineering required to compete effectively across diverse deployment environments. Honeywell and Siemens hold a substantial scale advantage over Cisco Systems and the remaining challengers, backed by decades of industrial automation customer relationships and deployment reliability track records competitors cannot quickly replicate.
Current competitive activity centers on predictive maintenance analytics platform integration and large-scale deployment reliability demonstration, with major vendors announcing new integrated sensor and analytics solutions specifically targeting manufacturing customers expanding condition monitoring programs. Several vendors are pursuing standardized interoperability protocol certification, seeking to capture preferred vendor status with enterprise customers increasingly specifying multi-vendor compatibility requirements across their expanding deployment fleets.

Emerging pressure comes from specialized industrial IoT startups rapidly closing the technology gap with established automation companies, supported by venture capital investment targeting the expanding predictive maintenance and smart city demand categories. Rankings could shift meaningfully over the coming decade as predictive maintenance analytics integration and large-scale deployment reliability, rather than raw hardware manufacturing scale, become the primary basis for competitive differentiation across the highest-margin industrial segment.
wireless-sensor-network-market-company-positioning-matrix-1789990373576

Competitive Moat and Risk Dimensions

HONEYWELL

Moat: Deep Installed Base Integration

Honeywell's moat rests on four decades of embedded relationships inside process manufacturing and building automation accounts, where its sensor networks integrate directly with control systems it already supplies. Switching costs run high: replacing an installed base spanning thousands of facilities would require customers to requalify entire monitoring architectures, a project few operators fund without a reliability failure forcing the decision.
HONEYWELL

Risk: Hardware Margin Compression Risk

Honeywell's hardware-centric revenue model faces margin pressure as customers increasingly value analytics software and predictive maintenance outcomes over sensor unit sales. Competitors bundling cheaper hardware with stronger analytics platforms could erode Honeywell's pricing power over the next several years unless it accelerates its own software integration roadmap and shifts its commercial model toward outcome-based contracts.
SIEMENS

Moat: Bundled Automation Software Stack

Siemens pairs its wireless sensor portfolio with its broader industrial automation and MindSphere software stack, letting it sell integrated monitoring solutions rather than standalone hardware. This bundled positioning makes Siemens difficult to displace within accounts already running its programmable logic controllers and drives, since customers gain unified data visibility across previously separate systems without adding a new integration vendor.
SIEMENS

Risk: European Capital Spending Exposure

Siemens carries meaningful exposure to European industrial capital spending cycles, which have softened amid energy cost pressure and slower manufacturing output. A prolonged European downturn could disproportionately affect Siemens relative to competitors with more diversified geographic revenue, particularly against rivals with deeper North American and East Asian industrial customer concentration.

Players Tracked

Prominent Players

Honeywell
Siemens
Cisco Systems
ABB
Schneider Electric

Other Key Players

Rockwell Automation
Emerson Electric
Texas Instruments
Analog Devices
STMicroelectronics
Silicon Labs
Digi International
Aeroflex
Sensor Networks Incorporated
Libelium
Monnit Corporation
Advantech
Moxa
Banner Engineering
National Instruments

Recent Developments

MARCH 2026

Honeywell completed the acquisition of a privately held industrial sensor analytics startup in March 2026, adding machine learning based anomaly detection to its existing wireless sensor network portfolio. The deal extends Honeywell's predictive maintenance offering across vibration, temperature, and acoustic sensing for manufacturing customers seeking consolidated monitoring platforms.
Signal: Signals accelerating consolidation as established vendors acquire analytics capability rather than build it internally over multiple product cycles.
JUNE 2026

Siemens and a major cellular network operator announced a joint venture in June 2026 to develop private 5G connected sensor networks for large industrial campuses, combining Siemens automation expertise with dedicated wireless spectrum access. The venture targets manufacturing customers requiring lower latency than conventional mesh protocols reliably support.
Signal: Signals growing convergence between cellular network operators and industrial automation vendors as private wireless spectrum access.
JANUARY 2026

Cisco Systems secured a multi-year supply agreement in January 2026 with a major automotive manufacturer to deploy wireless sensor networks across twelve production facilities globally, covering predictive maintenance and environmental monitoring applications. The agreement represents one of the largest single-customer industrial IoT deployments announced this year.
Signal: Signals large enterprise customers increasingly committing to single-vendor deployments at scale rather than piecemeal facility-by-facility rollouts.

Where Chipset Costs Squeeze Vendor Margins

Wireless radio chipsets and semiconductor components represent approximately 42% of total cost of goods sold for wireless sensor network hardware, with battery cells and power management circuitry adding a further 18%. Most radio frequency chipsets originate from a concentrated group of semiconductor foundries based in Taiwan and South Korea, leaving vendors exposed to regional supply disruption and allocation constraints during periods of elevated global chip demand.
Semiconductor shortages during 2021 and 2022 delayed sensor network shipments industry-wide by several months, with Texas Instruments and STMicroelectronics both reporting extended lead times exceeding six months for specific radio frequency components in their annual filings. The disruption forced several vendors to redesign products around alternative chipsets mid-cycle, adding meaningful engineering cost and delaying customer deployments that had already been contracted and scheduled for installation.

Smaller vendors without long-term supply agreements or volume purchasing scale face a persistent competitive disadvantage, often paying spot market premiums of 15 to 25% above the negotiated rates larger competitors secure through multi-year contracts. This exposure varies meaningfully by geography too: vendors sourcing primarily from North American and European distributors have historically faced longer allocation queues than those with direct East Asian foundry relationships.
wireless-sensor-network-market-cost-volatility-analysis-1789990373772

Diversifying Chipset Sourcing Across Multiple Foundry Regions

Leading vendors are qualifying second and third source chipset suppliers across multiple foundry regions, reducing dependency on any single semiconductor supplier or geography. This dual-sourcing approach adds modest qualification cost upfront but has proven effective at reducing the shipment delays that plagued the industry during the 2021 to 2022 global chip shortage period and its aftermath.

Securing Multi-Year Volume Purchase Agreements

Larger vendors are locking in multi-year volume purchase agreements directly with semiconductor manufacturers, guaranteeing allocation priority ahead of spot market buyers during periods of tight supply. These agreements typically require upfront capacity commitments but protect margins by fixing component pricing well ahead of deployment schedules spanning multiple product generations and future customer rollout cycles.

Redesigning Products Around Modular Chipset Architecture

Several manufacturers are redesigning sensor hardware around modular chipset architectures that accept interchangeable radio modules, allowing faster supplier substitution when a specific component faces sudden allocation constraints. This engineering investment reduces future redesign cost and shortens the qualification cycle needed to switch component suppliers quickly during a prolonged industry-wide shortage event or major disruption.

Portfolio Architecture for Margin Defence

Portfolio architecture in wireless sensor networks splits into three distinct tiers, ranging from commodity building automation sensors competing largely on unit price to certified industrial-grade nodes carrying meaningful margin premiums. Gross margins vary from the high teens on basic environmental sensors to over 45% on certified hazardous-location industrial nodes, reflecting the qualification barriers and reliability testing required to sell into regulated manufacturing environments.
Volume economics still dominate unit shipments, since building automation and consumer-adjacent categories account for the largest overall share of nodes deployed annually. But value concentrates elsewhere: predictive maintenance analytics platforms and industrial IoT sensor bundles generate a disproportionate share of vendor profit, as manufacturers pay recurring subscription fees for the software layer that sits on top of otherwise commoditized hardware.

The highest-value pools sit at the intersection of hardware reliability and analytics differentiation, where vendors combining both can command premium pricing that pure hardware competitors cannot match. Sustainability and regulatory-driven segments remain smaller today but are attracting disproportionate research and development investment, since certification requirements create durable competitive barriers that basic commodity sensor vendors struggle to clear without years of qualification testing.

Basic environmental and building automation sensors sold largely on unit price, with gross margins in the high teens to low twenties given intense competition from low-cost regional manufacturers and limited product differentiation.
Gross Margin

Industrial-grade nodes carrying reliability certification and extended warranty coverage, commanding gross margins in the low thirties as manufacturers pay for qualified deployment track records and dedicated vendor support commitments over time.
Gross Margin

Hazardous-location certified and regulatory-compliant sensor networks paired with predictive analytics software, achieving gross margins above 45% through certification barriers and recurring subscription revenue streams that competitors cannot easily replicate quickly.
Gross Margin
wireless-sensor-network-market-portfolio-architecture-1789990374282

High-value Sub-segments and Strategic Watch-out

Industrial IoT Wireless Sensor Networks

Industrial IoT wireless sensor networks combine the fastest projected growth with the highest per-node margins in the portfolio, driven by predictive maintenance analytics adoption across manufacturing facilities. Vendors capturing this segment early are positioned to defend pricing power as customers standardize on integrated hardware and analytics platforms for years.

Wearable and Healthcare Sensor Networks

Wearable and healthcare sensor networks pair strong growth with meaningful margin premiums, supported by remote patient monitoring reimbursement expansion and hospital infrastructure investment. This segment carries higher regulatory barriers than industrial applications, which limits new entrant competition and helps established medical device vendors retain pricing discipline.

Building Automation Sensor Networks

Building automation sensor networks represent the volume core of the market, generating the largest unit shipment base even as growth moderates relative to industrial and healthcare categories. Margins here run thinner, but the installed base provides vendors with a durable services and replacement revenue stream over each product generation.

Structural Health Monitoring Networks

Structural health monitoring networks carry the slowest growth in the portfolio and warrant strategic monitoring rather than heavy near-term investment, given lengthy infrastructure project cycles and public sector budget constraints. A shift toward mandatory bridge and building safety monitoring regulation could change this segment's trajectory meaningfully within the decade.

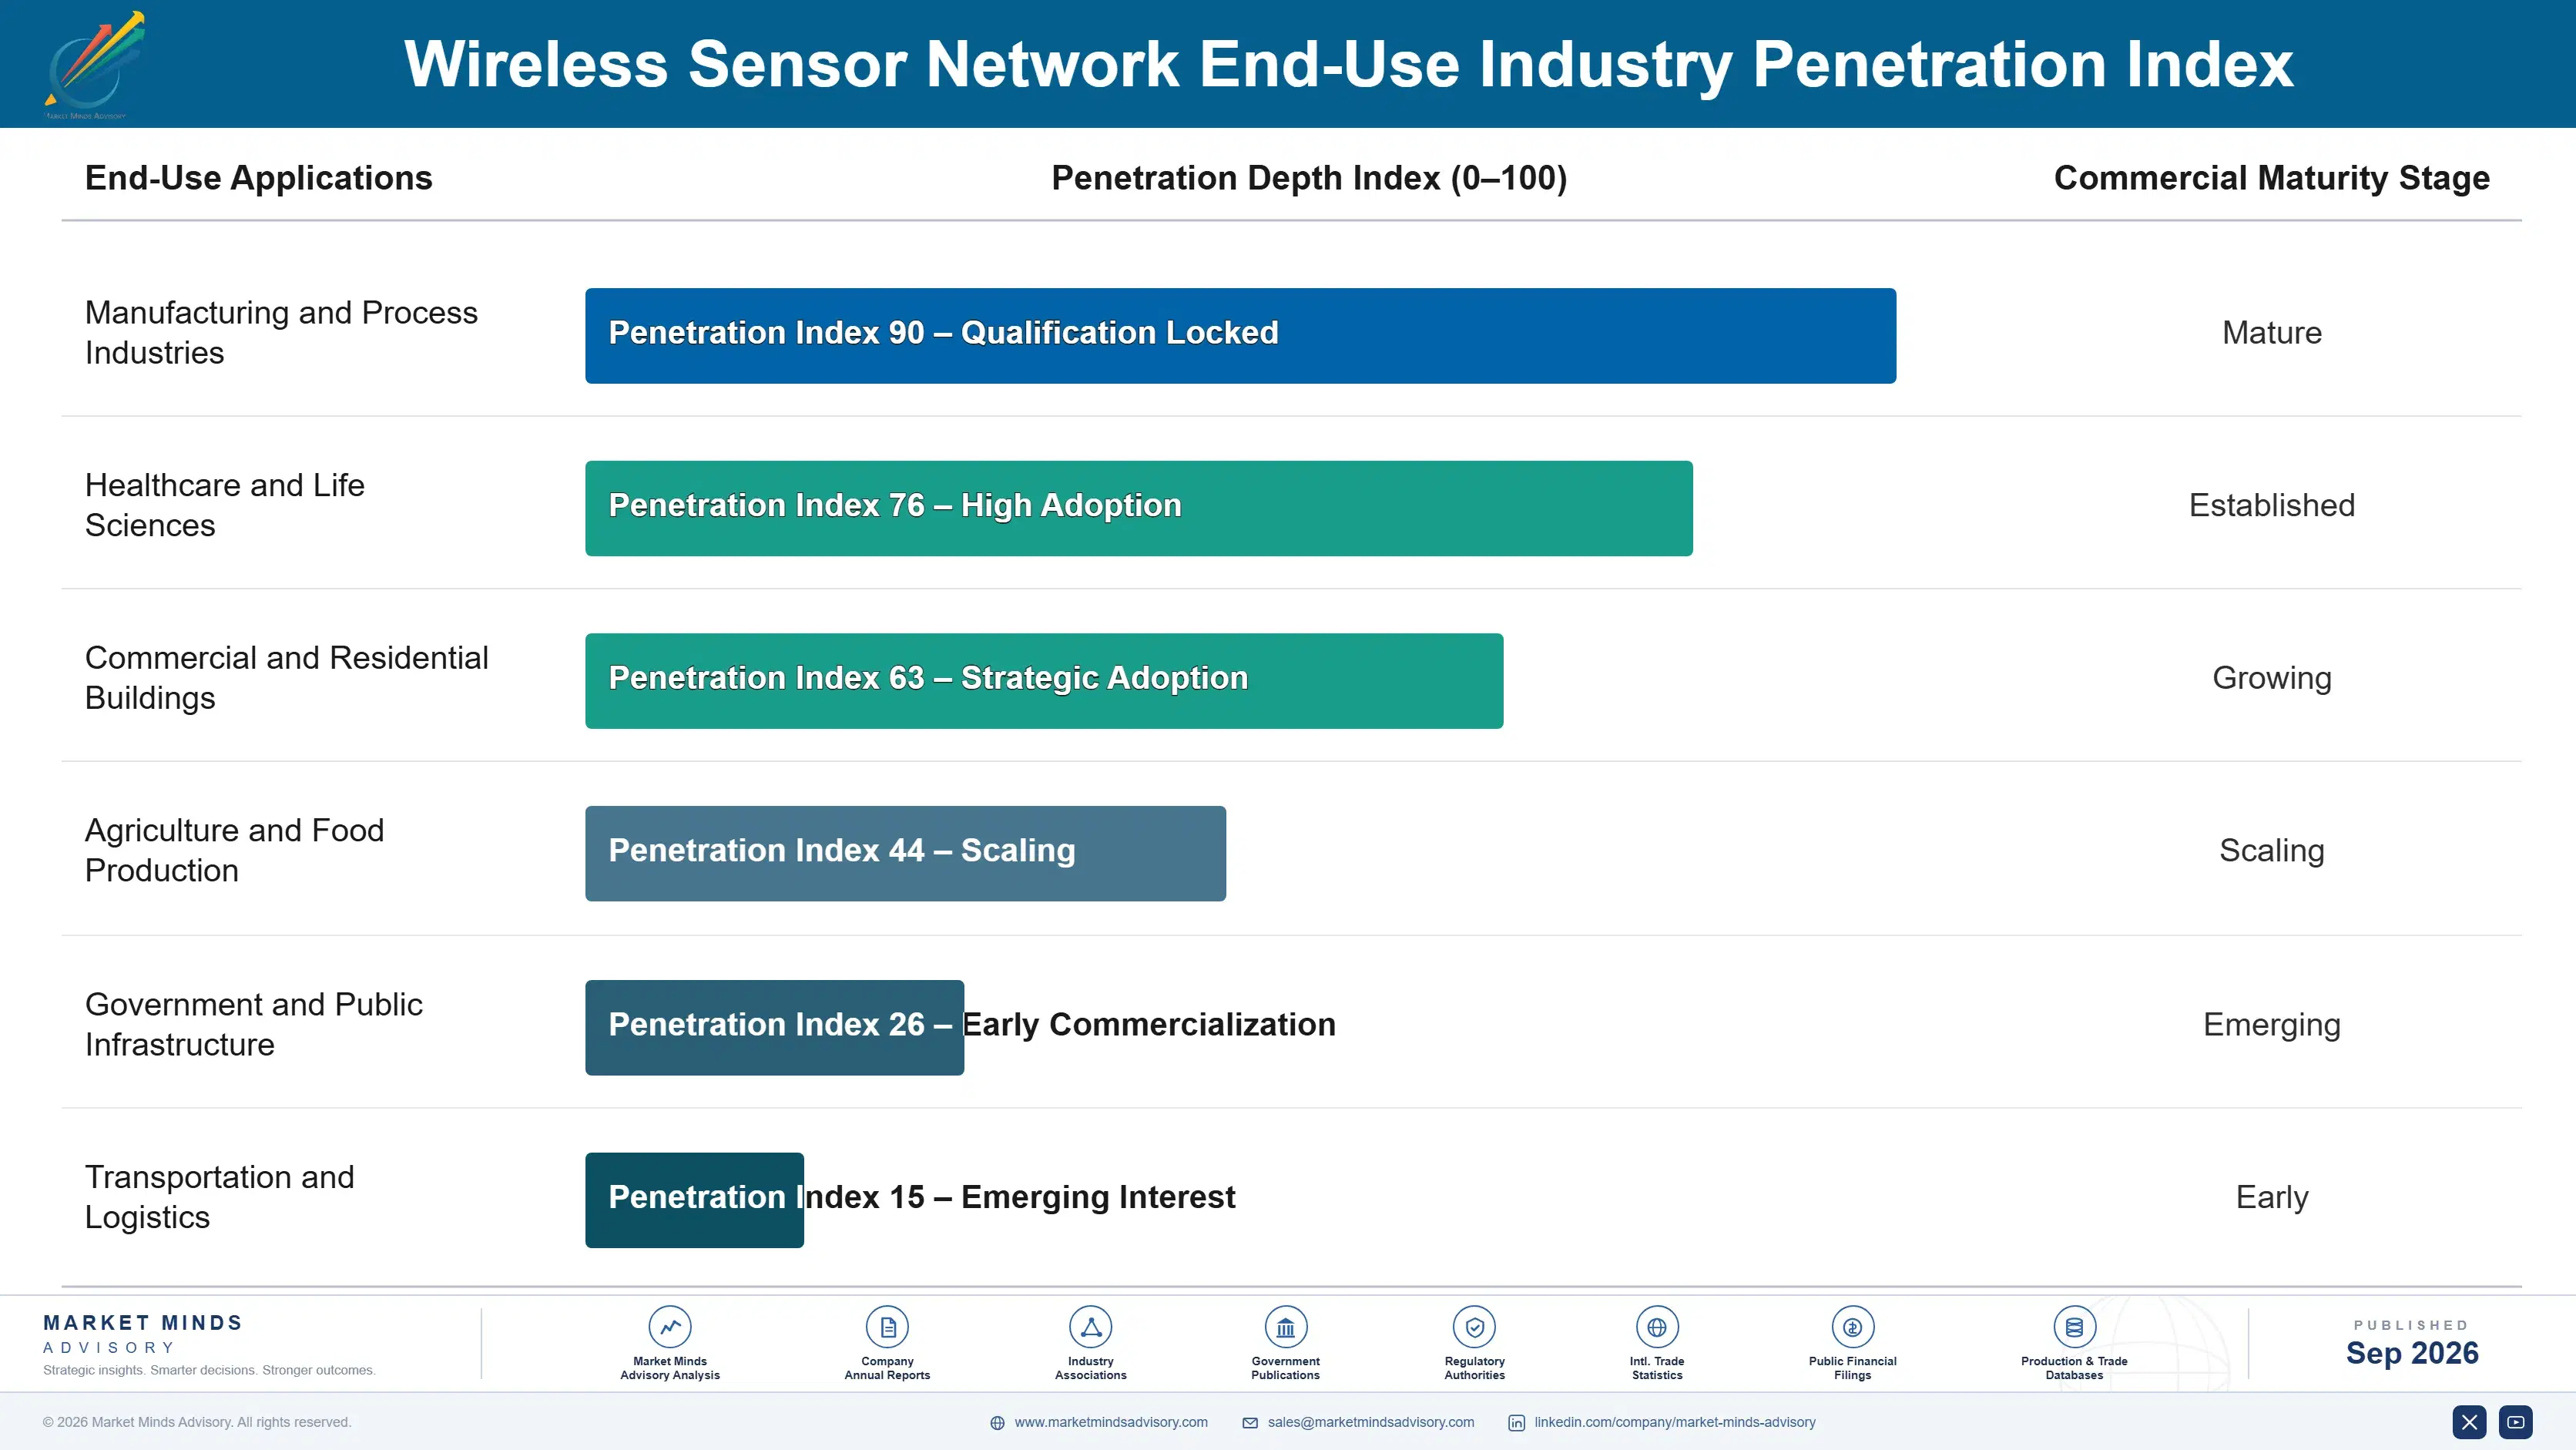
Where Deployment Loyalty Compounds Over Time

Wireless sensor network deployments generate annuity-like economics once installed, since customers rarely rip out functioning monitoring infrastructure and instead expand it incrementally across additional facility zones. Vendors capture recurring revenue through firmware updates, replacement nodes, and increasingly through analytics subscription tiers layered on top of the original hardware sale, creating a revenue stream that compounds well beyond the initial installation.
Adoption depth and stickiness vary considerably by end-use vertical. Industrial manufacturing customers, once integrated with a vendor's control systems, rarely switch providers given the requalification burden involved, while building automation customers show comparatively higher churn given lower switching costs and more standardized integration protocols. Healthcare deployments sit between these extremes, anchored by regulatory certification requirements but still exposed to competitive displacement during major facility renovation cycles.

A generational shift in buyer profile is underway as facility operations teams, rather than pure information technology departments, increasingly own the purchasing decision for sensor deployments. These operations buyers prioritize deployment reliability and measurable maintenance cost savings over raw technical specifications, favoring vendors who can demonstrate quantified return on investment across comparable facility deployments rather than theoretical performance claims.
wireless-sensor-network-market-end-use-penetration-index-1789990374903

Where Vendors Should Focus Next

These are among the four positions where our research anticipates prominent divergence between winners and laggards over the coming forecast period. Each is grounded in the demand model, the regulatory perimeter, and the announced capacity pipeline.
01 / ANALYTICS PLATFORM INTEGRATION

Prioritize predictive maintenance analytics over standalone hardware sales

Vendors that pair sensor hardware with predictive maintenance analytics command meaningfully higher margins and stronger customer retention than those selling hardware alone as a bare commodity product line. Honeywell and Siemens have already demonstrated this shift decisively, bundling monitoring platforms with existing automation software portfolios to defend pricing power against low-cost hardware-only entrants competing on unit price. Companies delaying this integration risk losing enterprise accounts to competitors offering unified deployment and analytics contracts within the next several years of market consolidation.
02 / DEPLOYMENT RELIABILITY PROOF

Build documented reliability track records before pursuing large enterprise contracts

Large-scale enterprise customers increasingly demand documented reliability track records before committing to facility-wide sensor deployments, favoring vendors who can point to comparable installations already running successfully at meaningful scale over time. Newer entrants without this proof point struggle to win the largest contracts even when their technology performs competitively in smaller pilot programs and controlled testing environments. Building a portfolio of referenceable deployments should be treated as a genuine prerequisite for enterprise sales rather than a marketing afterthought or secondary consideration.
03 / BATTERY LIFE ENGINEERING

Extend node battery life to reduce total cost of ownership

Extended battery life reduces the total cost of ownership for large facility deployments where thousands of nodes each require periodic maintenance visits and battery replacement labor at meaningful expense. Vendors investing in energy harvesting technology and lower-power radio protocols can differentiate on lifecycle economics rather than competing purely on upfront hardware price, a shift that particularly favors established players with deeper engineering budgets. This positioning matters most in remote or hard-to-access industrial and agricultural deployment sites where maintenance visits carry substantial incremental cost.
04 / INTEROPERABILITY STANDARDS ADOPTION

Pursue interoperability certification ahead of mandatory multi-vendor procurement requirements

Enterprise customers are increasingly specifying multi-vendor interoperability as a procurement requirement, seeking to avoid single-vendor lock-in across their expanding sensor deployment fleets and future technology refresh cycles. Vendors pursuing standardized protocol certification early can position themselves as preferred partners within these multi-vendor environments, capturing share from competitors slower to certify their hardware against emerging industry standards. This dynamic will likely accelerate as regulatory bodies in key markets begin favoring interoperable infrastructure in public procurement guidelines and smart city funding programs.

Engagement Snapshot From the Field

A live engagement with an industry participant carrying material or product regulatory and market exposure ahead of a defining policy shift, showing how our research translates into a defensible multi-year portfolio strategy.
MARKET MINDS ADVISORY · CLIENT ENGAGEMENT SUMMARY
Wireless Sensor Network Producer Strategic Portfolio Review and Transition Roadmap 2026·Investment Scenario on Wireless Sensor Network Exposure Evaluation 2025-26
CLIENT PROFILE
The client is a multinational industrial manufacturer operating dozens of production facilities across North America, Europe, and Asia, generating several billion dollars in annual revenue (client-reported, unverified by MMA). The organization had accumulated a fragmented mix of legacy wired monitoring systems and disparate wireless sensor deployments across facilities acquired through a decade of mergers, creating significant data visibility and maintenance coordination gaps.
STRATEGIC CHALLENGE
The client faced escalating unplanned downtime costs exceeding forty million dollars annually (client-reported, unverified by MMA) across its facility network, driven partly by inconsistent equipment monitoring coverage. Leadership needed a standardized wireless sensor network strategy that could scale across facilities with varying infrastructure ages without requiring a complete rip-and-replace of existing control systems.
MMA APPROACH
MMA conducted a facility-by-facility audit of existing sensor coverage gaps, vendor lock-in risk, and total cost of ownership across three competing wireless sensor network platforms under evaluation. The engagement combined primary interviews with plant operations leadership, competitive vendor benchmarking against the assessment framework in this report, and a phased rollout sequencing model prioritizing highest-downtime-risk facilities first.
KEY FINDINGS
  1. Facilities with the highest unplanned downtime costs shared a common pattern: sensor coverage gaps around aging rotating equipment that had never been retrofitted with condition monitoring during previous automation upgrades.
  2. Three incompatible wireless protocols across the facility network created a data integration burden that consumed significant engineering time before any predictive maintenance analytics could be meaningfully deployed at scale.
  3. Facilities that had already deployed vendor-bundled analytics platforms showed measurably lower unplanned downtime than those running standalone sensors feeding into a separate, poorly integrated maintenance software system.
  4. Plant-level operations teams, not corporate information technology departments, controlled the actual purchasing decision at most facilities, a dynamic the original vendor selection process had significantly underweighted.
CLIENT PROFILE
The client is a multinational industrial manufacturer operating dozens of production facilities across North America, Europe, and Asia, generating several billion dollars in annual revenue (client-reported, unverified by MMA). The organization had accumulated a fragmented mix of legacy wired monitoring systems and disparate wireless sensor deployments across facilities acquired through a decade of mergers, creating significant data visibility and maintenance coordination gaps.
STRATEGIC CHALLENGE
The client faced escalating unplanned downtime costs exceeding forty million dollars annually (client-reported, unverified by MMA) across its facility network, driven partly by inconsistent equipment monitoring coverage. Leadership needed a standardized wireless sensor network strategy that could scale across facilities with varying infrastructure ages without requiring a complete rip-and-replace of existing control systems.
MMA APPROACH
MMA conducted a facility-by-facility audit of existing sensor coverage gaps, vendor lock-in risk, and total cost of ownership across three competing wireless sensor network platforms under evaluation. The engagement combined primary interviews with plant operations leadership, competitive vendor benchmarking against the assessment framework in this report, and a phased rollout sequencing model prioritizing highest-downtime-risk facilities first.
KEY FINDINGS
  1. Facilities with the highest unplanned downtime costs shared a common pattern: sensor coverage gaps around aging rotating equipment that had never been retrofitted with condition monitoring during previous automation upgrades.
  2. Three incompatible wireless protocols across the facility network created a data integration burden that consumed significant engineering time before any predictive maintenance analytics could be meaningfully deployed at scale.
  3. Facilities that had already deployed vendor-bundled analytics platforms showed measurably lower unplanned downtime than those running standalone sensors feeding into a separate, poorly integrated maintenance software system.
  4. Plant-level operations teams, not corporate information technology departments, controlled the actual purchasing decision at most facilities, a dynamic the original vendor selection process had significantly underweighted.
RECOMMENDED STRATEGY
Phase 1: Standardize on a single wireless sensor protocol across all facilities within eighteen months, prioritizing the ten highest-downtime-risk sites for immediate deployment and retrofit. Phase 2: Consolidate analytics onto one integrated platform, migrating legacy standalone sensor feeds and retraining plant maintenance teams on the unified predictive maintenance dashboard. Phase 3: Shift procurement authority formally to plant operations leadership with corporate information technology in a supporting integration role for future facility rollouts.
OUTCOME
Within the first year of the phased rollout, the client reported unplanned downtime costs falling by roughly eighteen million dollars annually across retrofitted facilities (client-reported, unverified by MMA). Maintenance teams also reported meaningfully faster fault diagnosis times following the consolidated analytics platform migration across the broader facility network.

Frequently Asked Questions

Foundational context covering the market sizes, CAGR, scope, country, region and competition that inform every finding below. This section is provided to cover basics and most often pre-purchase conversations, answered from the MMA Primary Research Dataset.

What is the current size of the Wireless Sensor Network Market?

The Wireless Sensor Network Market reached an estimated $9.8 billion in 2025. This base reflects growing industrial IoT deployment and expanding predictive maintenance program adoption across manufacturing and building automation customers.

How large will the Wireless Sensor Network Market be by 2036?

The market is projected to reach approximately $30.9 billion by 2036. This growth reflects a decade of sustained industrial IoT expansion, smart city infrastructure investment, and healthcare wireless monitoring adoption.

What is the CAGR for the Wireless Sensor Network Market 2026 to 2036?

The Wireless Sensor Network Market is projected to grow at an 11.0% compound annual growth rate between 2026 and 2036. This rate reflects sustained demand across industrial, healthcare, and smart city applications.

Which segment is growing fastest?

Industrial IoT Wireless Sensor Networks is the fastest-growing segment, expanding at 16.0% annually, roughly 1.45 times the overall market rate. This reflects accelerating predictive maintenance analytics adoption across manufacturing facilities globally.

Who are the major companies in the Wireless Sensor Network Market?

Major companies include Honeywell, Siemens, Cisco Systems, ABB, and Schneider Electric. These vendors combine deep industrial automation relationships with expanding wireless sensor and analytics platform portfolios.

Which country is growing fastest?

China is the fastest-growing country, driven by rapid manufacturing automation investment and expanding smart factory initiatives. Its 13.5% projected CAGR outpaces the broader East Asia regional average meaningfully.

Report Segmentation Architecture

The full report scope spans multiple orthogonal segmentation dimensions, with cross-tabulated demand data provided for each dimension pair. Coverage extends further to regional breakdowns, trend trajectories, and the competitive detail needed to support segment-level decision-making.

By Sensing Application

  • Industrial IoT Wireless Sensor Networks
  • Smart City Environmental Monitoring Networks
  • Building Automation Sensor Networks
  • Wearable and Healthcare Sensor Networks
  • Agricultural Wireless Sensor Networks
  • Structural Health Monitoring Networks

By End-Use Industry

  • Manufacturing and Process Industries
  • Healthcare and Life Sciences
  • Commercial and Residential Buildings
  • Agriculture and Food Production
  • Government and Public Infrastructure
  • Transportation and Logistics

By Commercial Dimension

  • Hardware Sales
  • Analytics Software Subscription
  • Installation and Integration Services
  • Maintenance and Support Contracts

By Region

  • North America
  • Western Europe
  • East Asia
  • South Asia and Pacific
  • Latin America
  • Middle East and Africa
  • Eastern Europe

Scope, Methodology, and Coverage

Every figure in this report is reproducible from documented input assumptions. The scope below maps the historical period, the forecast horizon, the segmentation dimensions, and the countries covered, alongside the underlying primary and qualitative methodology.
Historical Period
2020 to 2025
Forecast Period
2026 to 2036
Base Year
2025 (USD billions; MMA Primary Research Dataset, September 2026)
Market Definition
The Wireless Sensor Network Market covers interconnected sensor nodes communicating via low-power wireless protocols to monitor environmental, industrial, or infrastructure conditions without requiring dedicated wired connectivity to each individual sensor point. It excludes standalone single-sensor devices and general Wi-Fi infrastructure unrelated to distributed sensor mesh applications.
Quantitative Units
USD Billion, CAGR (%)
Segmentation Dimensions
By Sensing Application, By End-Use Industry, By Commercial Dimension, By Region
Regions Covered
North America, Western Europe, East Asia, South Asia and Pacific, Latin America, Middle East and Africa, Eastern Europe
Countries Covered
United States, Canada, Germany, United Kingdom, France, China, Japan, South Korea, India, Australia, Brazil, Mexico, Saudi Arabia, United Arab Emirates, Poland
Key Companies Profiled
Honeywell, Siemens, Cisco Systems, ABB, Schneider Electric, Rockwell Automation, Emerson Electric, Texas Instruments, Analog Devices, STMicroelectronics, Silicon Labs, Digi International, Aeroflex, Sensor Networks Incorporated, Libelium, Monnit Corporation, Advantech, Moxa, Banner Engineering, National Instruments
Quantitative Methodology
Primary survey, n=3,800 respondents, Q4 2025, six countries; demand-side model with trade association cross-validation
Qualitative Methodology
47 expert interviews, Q4 2025; applied to validate demand model assumptions, identify emerging dynamics, and assess competitive positioning
Report Format
PDF and XLSX data workbook (Word format preview document)
Publisher
Market Minds Advisory
Report Code
MMA-2026-TEC-940
Published
September 2026
Contact
sales@marketmindsadvisory.com | www.marketmindsadvisory.com

Purchase the full Wireless Sensor Network Market Report (2026 to 2036).

This report provides comprehensive analysis of the Wireless Sensor Network Market across all major applications, regions, and competitive dynamics through 2036. It combines primary survey data from 3,800 respondents with 47 expert interviews conducted across six countries during the fourth quarter of 2025. The analysis covers segment-level growth forecasts, regional demand architecture, and competitive positioning assessments across the full ten-year forecast horizon, spanning industrial, healthcare, and smart city applications. Readers gain the strategic context needed to inform investment prioritization, vendor selection, and market entry timing decisions.
Ten-year market sizing and forecast model
Segment-level growth and margin analysis breakdown
Regional demand architecture across seven regions
Competitive benchmarking and moat risk assessment
Input cost exposure and mitigation strategies
Anonymized client engagement case study review

Built For The People Who Decide

From boardroom strategy to bench-side execution, this report is read cover-to-cover by leaders shaping the next decade of their industry, turning demand scenarios, market dynamics and valuation benchmarks into decisions.
CXOs/ Presidents/ VPs/ Managers
M&A and Corporate Development
Strategy Teams and R&D Heads
Procurement and Product Directors
Regulatory and Compliance Leaders
Investor Relations and Equity Analysts