Market Minds Advisory
Wireless Security Camera Market

Wireless Security Camera Market: Wireless Security Camera Market: Subscription Economics, The Battery Problem and Where Footage Actually Lives

The camera is sold at or below cost and the money is made on cloud storage, which makes the hardware a subscription enrolment device wearing a plastic housing and a lens.

Lead Analyst

Published

September 2026

Make Smarter Decisions with Customized Research Insights

Request a free sample report and evaluate market opportunities, growth trends, and competitive dynamics relevant to your business needs.

2025 MARKET VALUE$9.4BMarket Size 2025
2036 FORECAST VALUE$22.0BBase Case , 2026 to 2036
CAGR 2026 TO 20368.0 %Bull 9.3% / Bear 6.7%
INCREMENTAL OPPORTUNITY$11.8BNet 10- year value creation
EXPANSION MULTIPLE2.16x2036 value over 2026 base
Strategic Levers
M&A Pipeline
Regional Outlook
Country Rankings
Competitive Intelligence
Segmental Deep-dive
Call-Us : 91 93563 13602

Executive Snapshot and Market Trajectory.

Almost nobody in this market sells cameras for a profit. Hardware is priced at or near cost to enrol a household into monthly cloud storage, which is where the entire return lives, and the camera is effectively a signup device with a lens. Seven in ten never enrol.
Local storage and edge processing cameras grow at 12.0%, half again the market rate of 8.0%, as buyers who dislike the subscription and the privacy arrangement find alternatives that work without either. Battery-powered cameras follow at 9.8%. Wired always-on cameras grow slowest at 3.4%, limited by where a household is willing to run cable. Doorbells are the entry format and decide which platform everything else joins.
Batteries are the unglamorous constraint that shapes the whole product. A camera recording continuously drains in days, so battery models record only on motion, which means the footage a customer actually wants is frequently the clip that never triggered. Concentration is high at 51% held by the top five and India grows fastest at 13.4%. Radar presence sensing closes part of that gap, though the underlying energy constraint does not go away at any price.
Market Definition
This market covers consumer and small business wireless security cameras and the services sold with them, spanning battery-powered cameras, wired always-on cameras, doorbell cameras, local storage and edge processing cameras, floodlight and spotlight cameras, and indoor pan and tilt cameras. Sizing is at manufacturer net revenue including subscription services. Professionally monitored alarm systems, commercial video surveillance, body-worn cameras, and dash cameras are excluded.
Base Year Value
$9.4B in 2025 (MMA Primary Research Dataset, September 2026)
Forecast Period
2026 to 2036, eleven discrete annual values
CAGR
8.0% base case. Bull 9.3%. Bear 6.7%.
Fastest Growth Segment
Local Storage And Edge Processing Cameras: 12.0% CAGR
Fastest Growth Country
India: 13.4% CAGR
Fastest Growth Region
South Asia and Pacific: 10.2% CAGR
Largest Region
North America: 32% of 2025 global value
Market Leaders
Amazon, Google, Arlo Technologies, Anker Innovations, Hangzhou Hikvision. Source: MMA Primary Research Dataset, July 2026.
Primary Survey
n=3,800 procurement and R&D decision-makers, Q4 2025, six countries
Methodology
Demand-side build-up, cross-validated against public data, 47 expert interviews

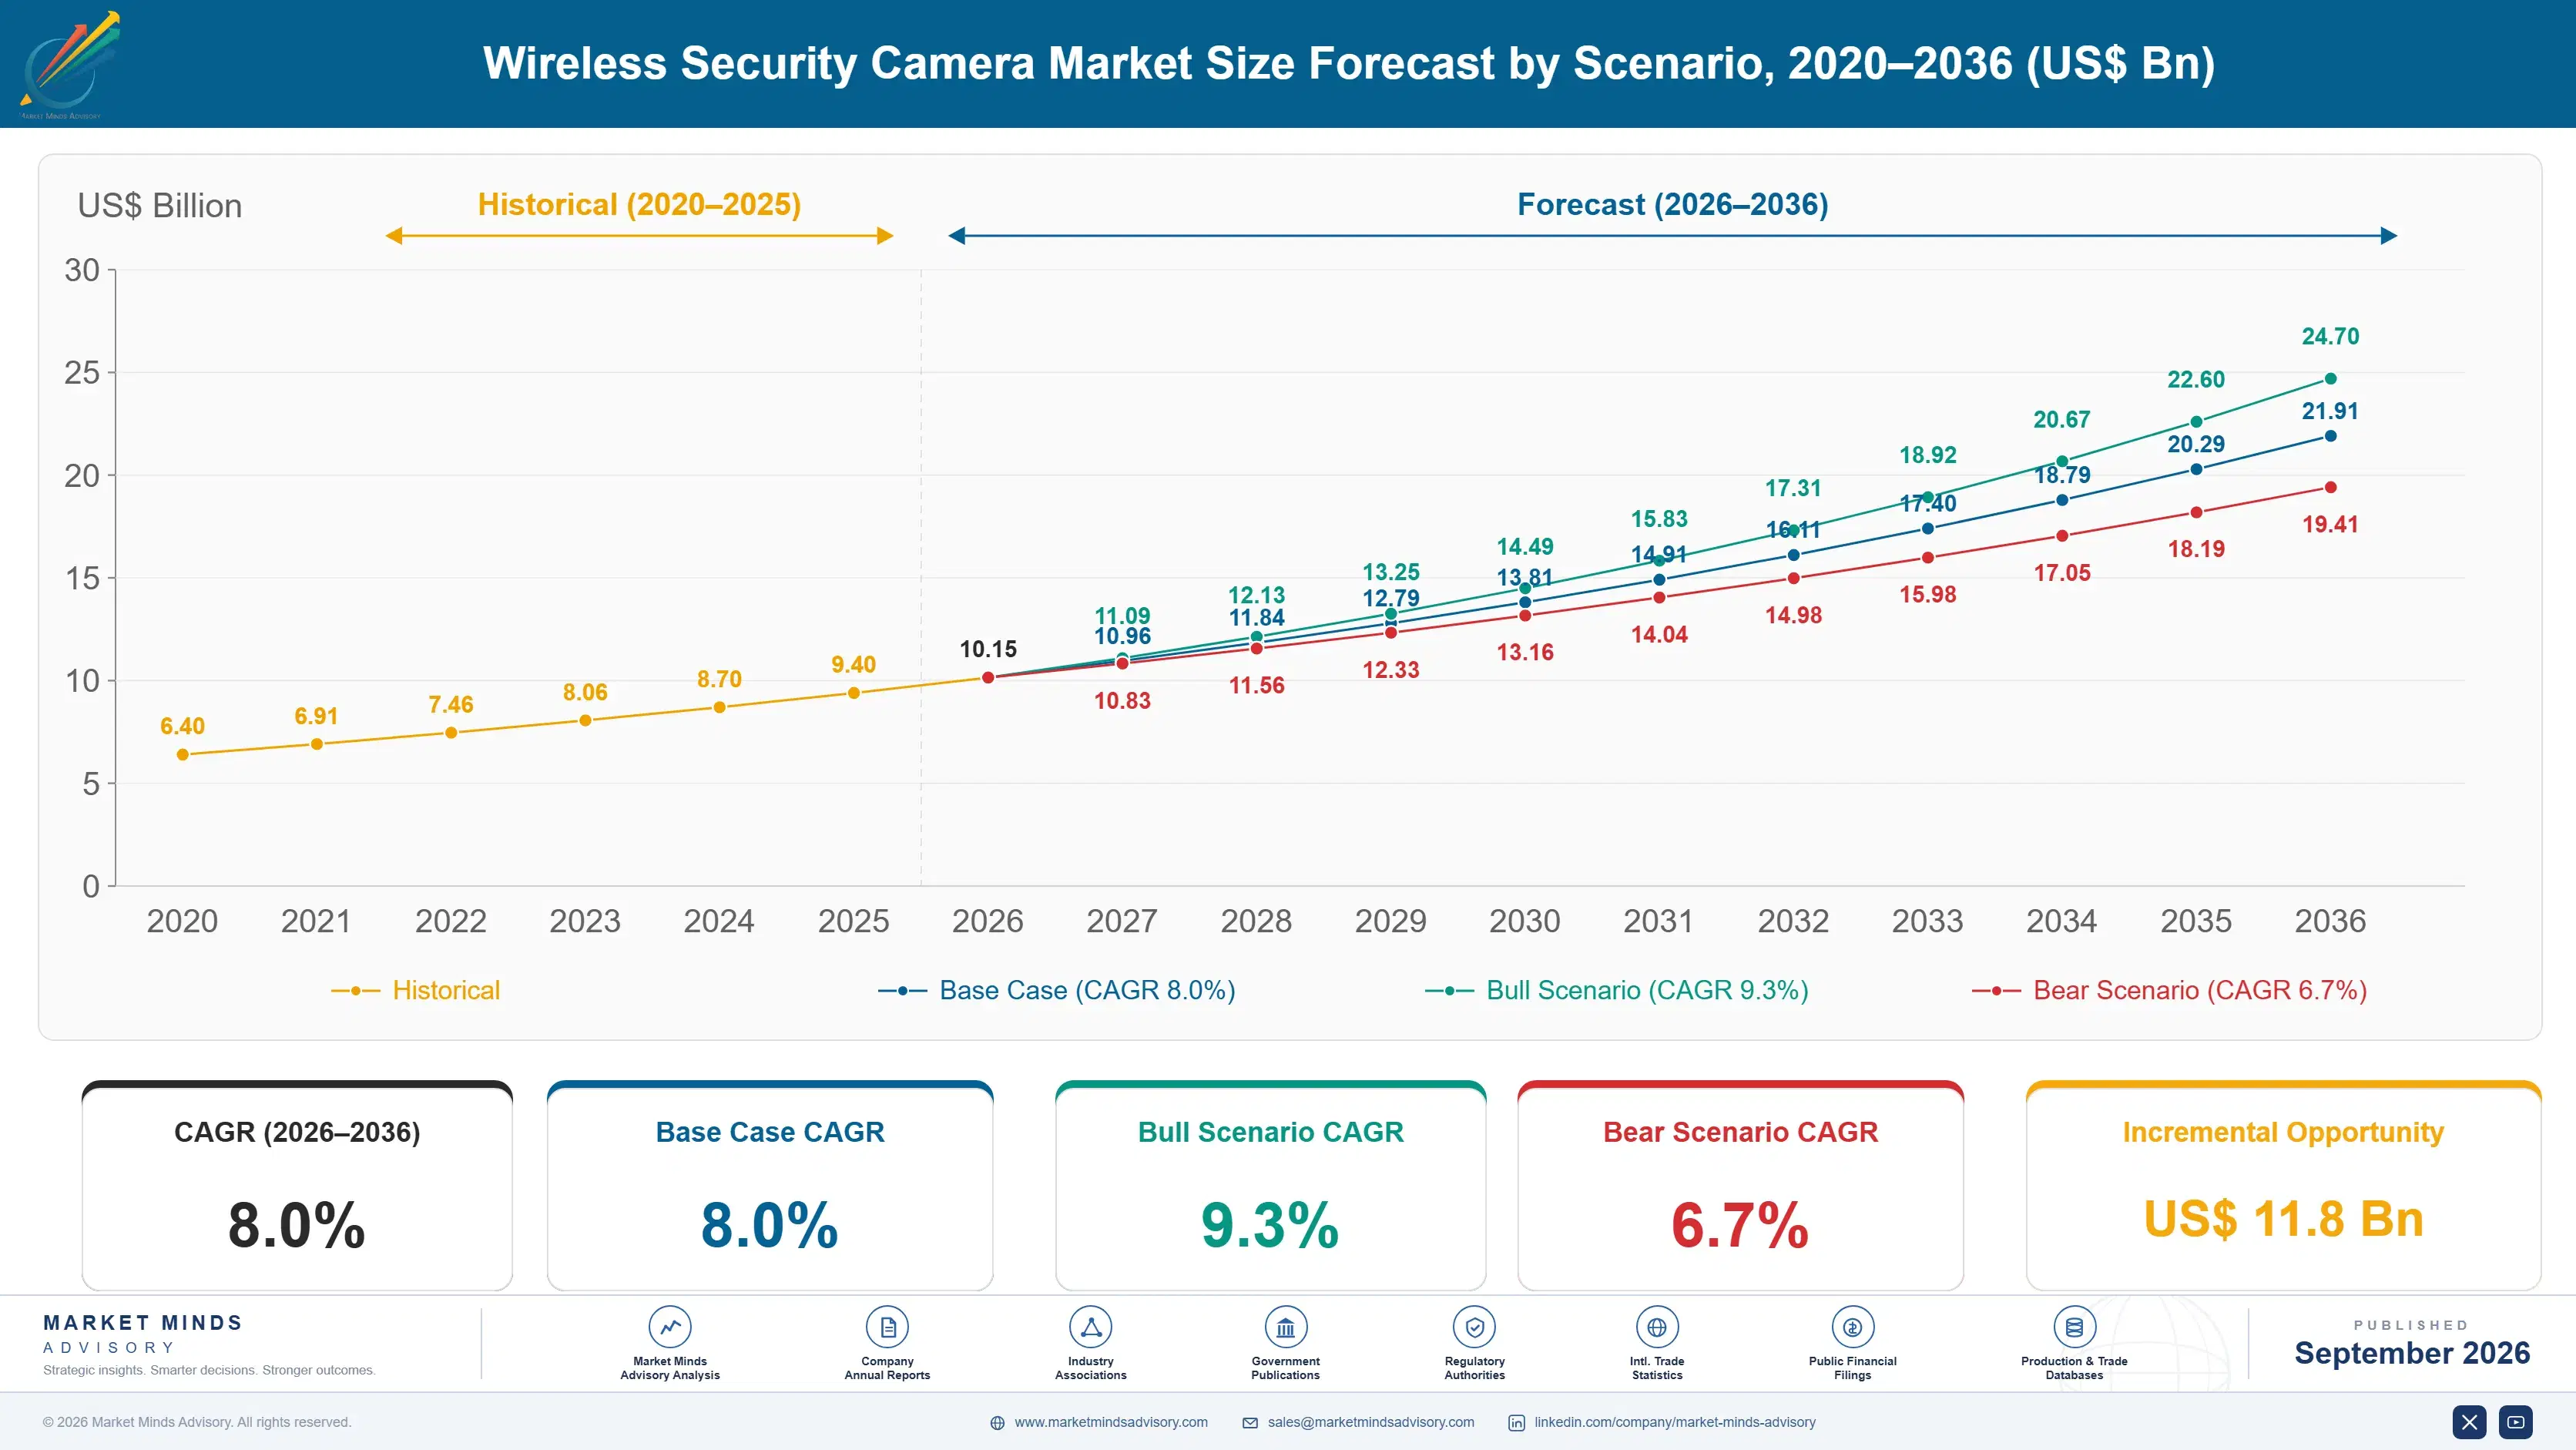
Wireless Security Camera Market Forecast Scenarios

wireless-security-camera-market-size-forecast-scenario-1790024543169
Growth of 6.8% between 2020 and 2025 came from a hardware boom that hid a service transition. Camera unit sales surged through 2020 and 2021 as households spent on home improvement, and manufacturers discounted aggressively to build subscriber bases. Attach rates disappointed almost everywhere, and several participants reset pricing from 2023 onward once it became clear the installed base was not converting at assumed rates.
Three mechanisms carry the base case. Local storage and edge processing grow at 12.0% as buyers reject recurring fees and on-device analysis becomes good enough without a data centre. Indian demand expands at 13.4% on residential construction and a domestic manufacturing base building under production-linked incentives. Subscription pricing is consolidating into household bundles rather than per-camera fees, which changes the economics of multi-camera homes considerably. All three are visible in attach and shipment data already.
The bull case is on-device analysis reaching parity. If edge processing distinguished a person from a cat without cloud inference, the subscription argument weakens sharply and hardware margin has to return. The bear case is a privacy event. A significant breach at a major platform would move buyers toward local storage faster than any roadmap, and incumbents are least prepared.

Where The Money Actually Is

Hardware in this category is a customer acquisition cost dressed as a product. Camera gross margin runs around 9%, which is nominal for consumer electronics, because the unit exists to enrol a household into a monthly plan carrying margin several times higher. Subscription attach sits near 29%, meaning roughly seven in ten installed cameras generate nothing beyond the day they were bought, and that ratio is the central commercial problem. Nothing in a unit sales report distinguishes the two.
TOP FIVE CONCENTRATION51%Combined net revenue share held by the five largest participants
SUBSCRIPTION ATTACH RATE29%Share of installed cameras carrying an active paid plan
AVERAGE CAMERA PRICEUSD 78Weighted manufacturer price across all wireless camera formats
HARDWARE GROSS MARGIN9%Typical margin earned on the camera unit itself
BATTERY RECHARGE INTERVAL3 monthsObserved time between charges under normal household motion
MISSED EVENT RATE17%Portion of relevant events not captured by motion triggering
Battery physics shapes the product more than any design decision. A camera recording continuously would drain in days, so battery models wake on motion, record a clip and sleep again. That creates a gap: the event a customer most wants is frequently the one where motion started outside the detection zone or the wake latency clipped the beginning. Around 17% of relevant events are missed entirely.
Where footage lives has become the actual purchase decision for a growing share of buyers. Local storage and edge processing avoid both the monthly fee and the question of who else can see the recording. That group is growing at half again the rate of the market.
"This industry sells a camera at cost to rent you a hard drive in someone else's building, and it is faintly astonished that customers keep choosing the one with an SD card slot. The subscription was never the product people wanted."
Director, Connected Devices and Home Technology Practice · MMA Technology and Connected Devices Practice · September 2026

Market Trends

Edge Processing Removes The Reason To Subscribe

Local storage and edge processing cameras grow at 12.0% against 8.0% for the market, because on-device chips now handle person, vehicle and package detection that previously required cloud inference. That removes the technical justification for a monthly fee and leaves only the storage argument, which an SD card answers adequately for most households. Subscription attach at around 29% shows how many buyers already declined. Participants built entirely on recurring revenue have no straightforward response to a product that works without it. Selling hardware at real margin is the only answer available to them.
Market Impact: India grows at 13.4% annually
Subscription Pricing Moves To Household Bundles

Per-camera subscription pricing punished exactly the customers worth keeping, since a household with six cameras faced six times the fee for the same service. Platforms have moved toward unlimited-camera household plans, which raises attach rates and lifts revenue per household even at a lower notional price per device. The change also removes a reason for multi-camera buyers to defect to local storage. Attach improvement has been measurable wherever the bundle replaced per-device charging entirely. A household with six cameras was charged six times for the same service, which is the customer a platform should keep.
Market Impact: Doorbell drives 3.1 later cameras

Market Opportunities and Growth Drivers

Indian Residential Construction Meets Domestic Manufacturing Incentives

India grows fastest of any country covered at 13.4%, combining large-scale residential construction with electronics manufacturing expanding under production-linked incentive schemes administered through MeitY. Domestic assembly removes import duty that previously kept camera prices above what most households would pay, and gated residential developments specify camera provision at build rather than leaving it to owners. Local platforms price well below international brands and offer local storage by default, which suits a market resistant to recurring fees. Gated developments specify camera provision at build rather than leaving the decision to individual owners.
Market Impact: Only 29% carry paid plans

Doorbell Format Becomes The Default Entry Product

Doorbell cameras have become the first camera most households buy, because the use case is concrete and the installation replaces something already present rather than adding an object to a wall. That entry position matters commercially far beyond the unit itself, since the doorbell determines which platform a household enrols in and subsequent cameras follow the app rather than the specification. Platforms compete hardest here for exactly that reason, frequently at negative hardware margin on the doorbell specifically. Households whose first camera is a doorbell add roughly three further cameras on average, against under one for every other starting format.
Market Impact: Around 17% of events missed

Market Restraints and Challenges

Seven In Ten Cameras Generate No Recurring Revenue

Subscription attach sits near 29%, which means the majority of installed cameras earn nothing after the sale while having been priced at roughly 9% hardware margin to acquire that household. The root cause is that the value proposition inverted: cloud storage was compelling when on-device processing could not distinguish a person from a shadow, and it no longer is. Commercially it leaves the model exposed. Participants addressing it bundle households rather than devices and add genuine analysis value. Roughly 58% of non-subscribers decline on storage location rather than on price entirely.
Market Impact: Edge grows 4.0 points faster

Motion Triggering Misses The Events That Matter

Battery cameras wake on motion rather than recording continuously, and roughly 17% of relevant events are missed because motion began outside the detection zone or wake latency clipped the start of the clip. The root cause is energy: continuous recording drains a battery in days and no chemistry available at consumer prices changes that. Commercially it produces the complaint that most damages trust. Mitigation runs to radar presence sensing, pre-roll buffering and wired power options for critical positions. Pre-roll buffering catches the approach rather than the movement, which is where the failure actually happens.
Market Impact: Attach improves from 29% base
3 additional market trends, 4 additional growth drivers, and 2 additional restraints and challenges are covered in the full report. Contact sales@marketmindsadvisory.com to access the complete intelligence.

Segment CAGR and Growth Architecture

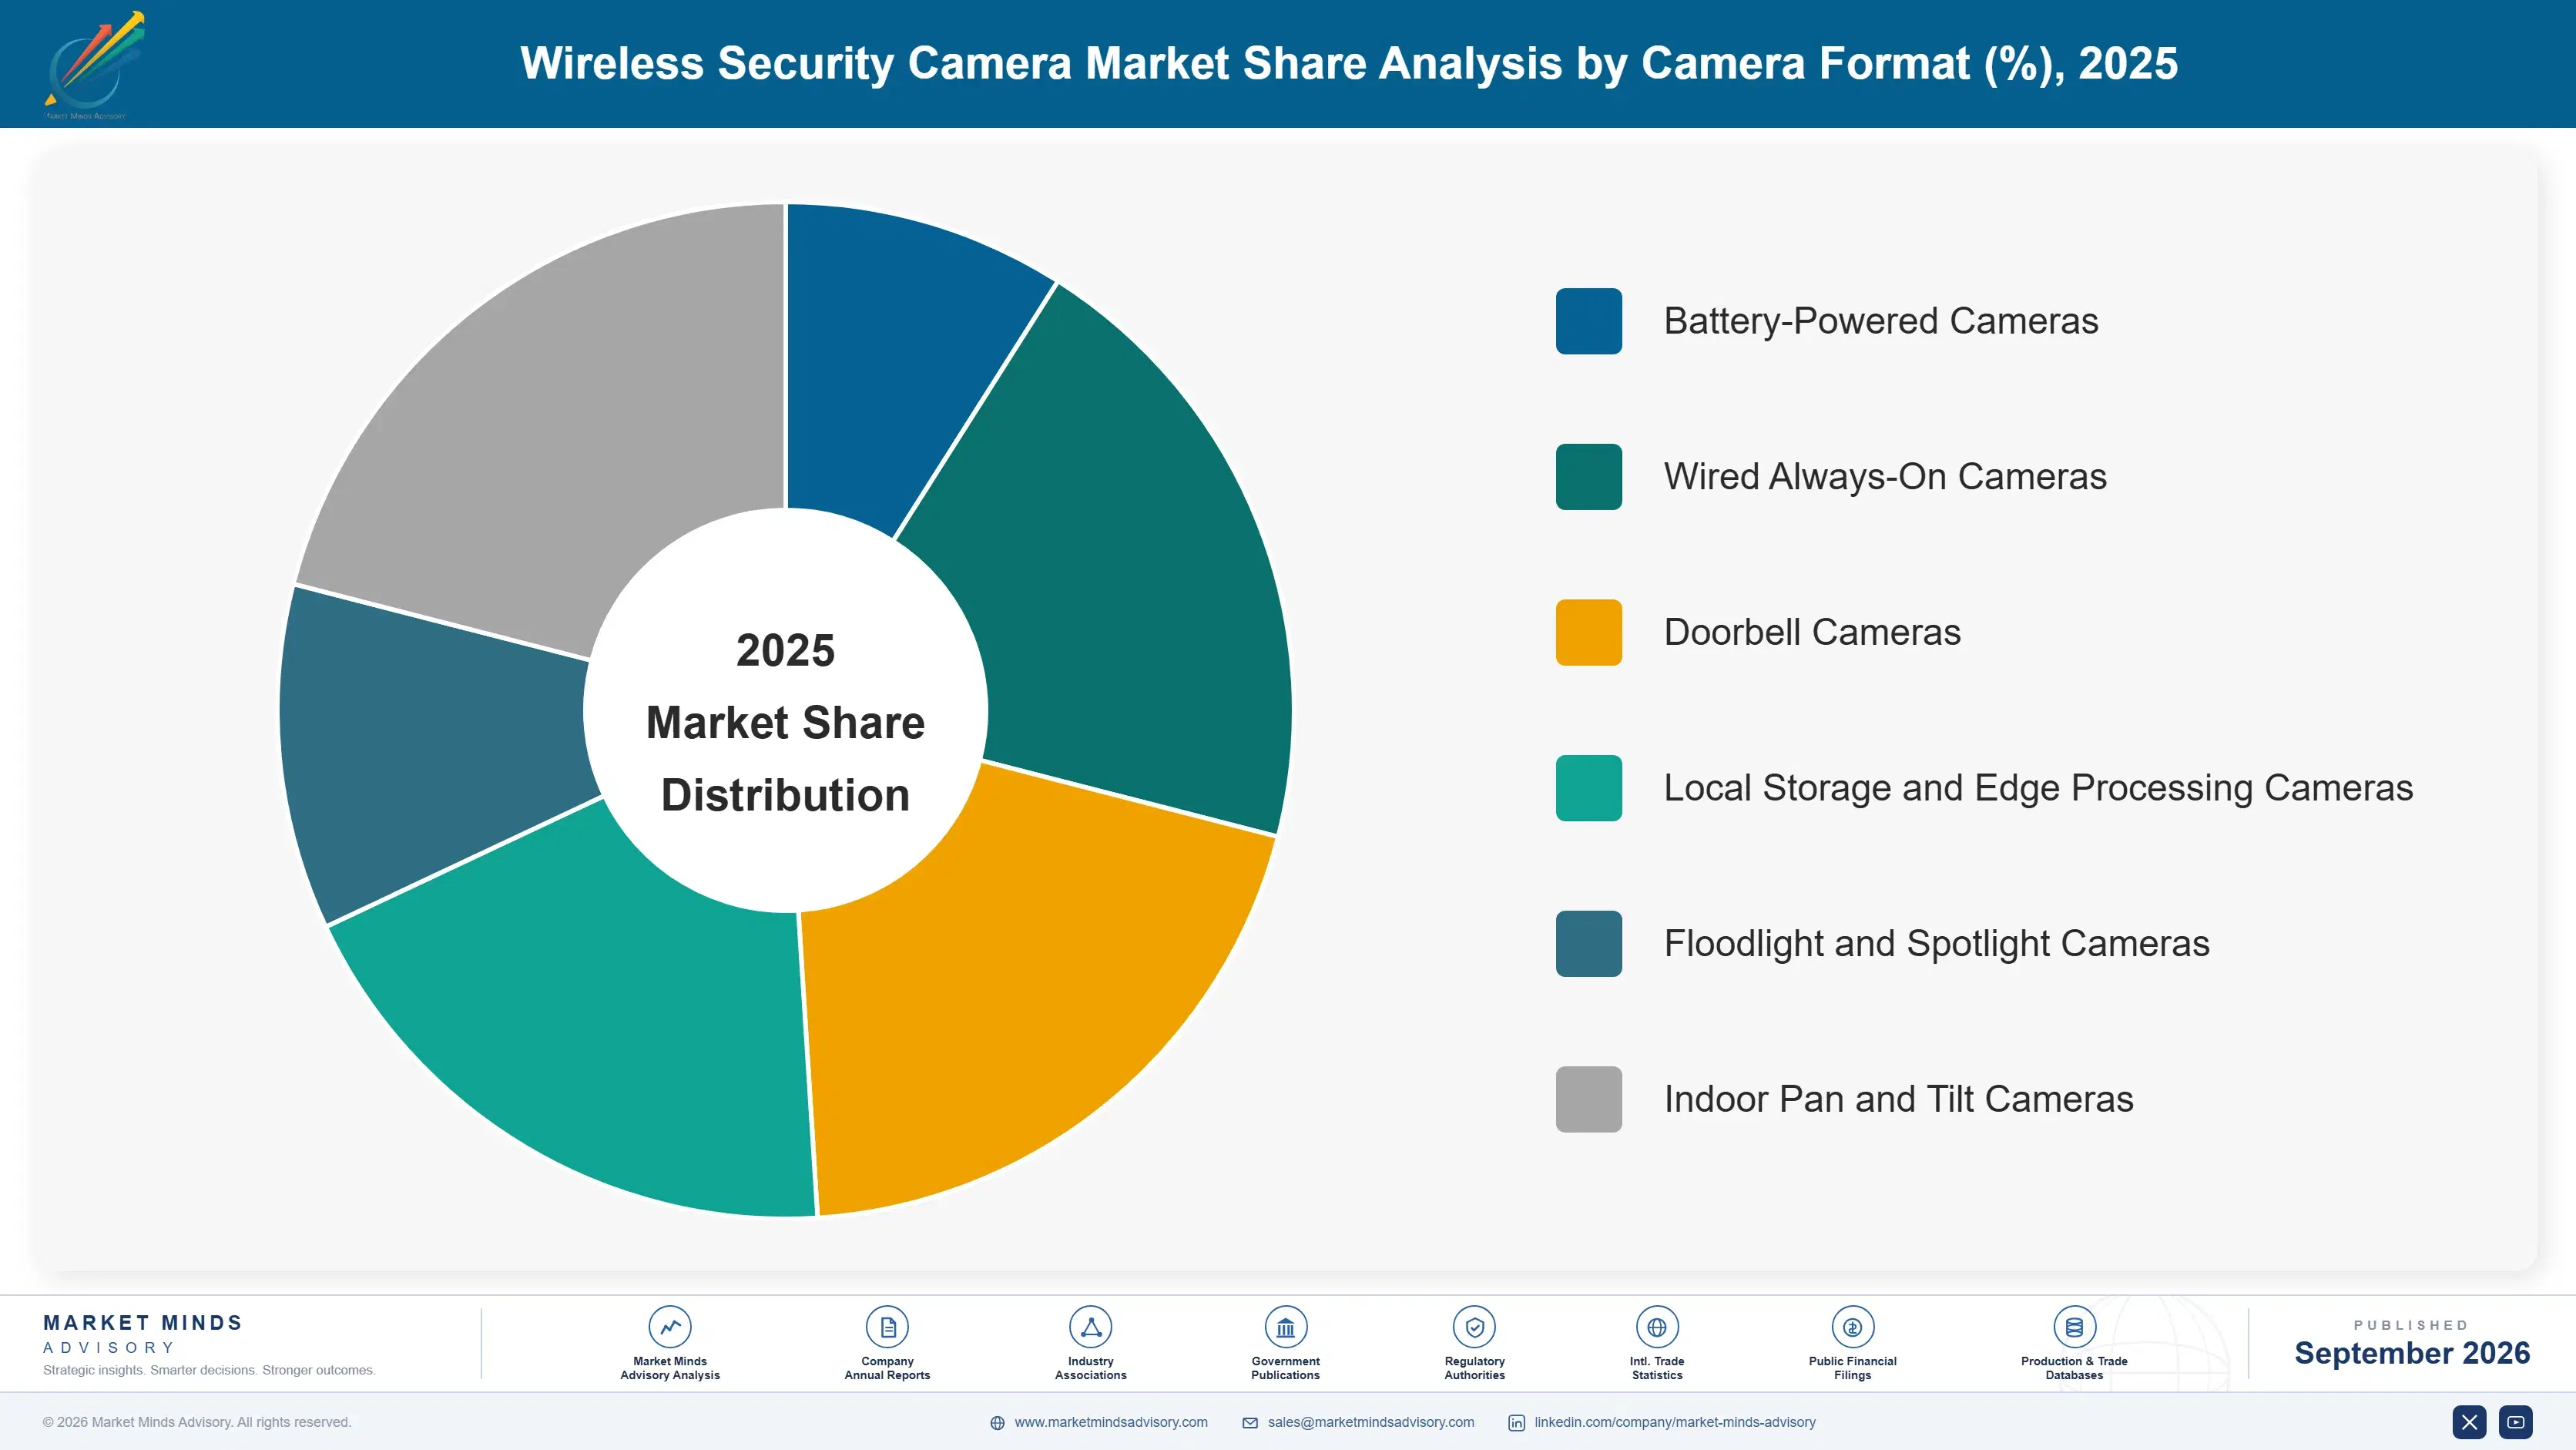
Segmentation follows camera format, the dimension on which power source, storage architecture, subscription attachment and installation constraint all divide together. Six formats are assessed at manufacturer net revenue. Professionally monitored alarms, commercial video surveillance, body-worn cameras and dash cameras sit outside the defined scope throughout this report. Subscription attachment differs by a factor of five across them.
wireless-security-camera-market-market-share-analysis-1790024543729

Local Storage And Edge Processing Cameras

Local storage and edge processing cameras grow at 12.0%, half again the market rate of 8.0%, and they exist because the subscription model gave buyers a reason to look for an alternative. On-device chips now perform the person, vehicle and package detection that once required cloud inference, which removes the technical argument for a monthly fee and leaves only storage, adequately answered by an SD card or a network drive. Subscription attach at around 29% shows how many households already declined. Participants whose economics depend entirely on recurring revenue have no clean answer to hardware that simply works. Hardware here sells at a genuine margin rather than as an enrolment cost.
CAGR 12.0%

Battery-Powered Cameras

Battery-powered cameras grow at 9.8% and dominate unit volume because installation requires no cable, no electrician and no landlord permission, which removes every practical barrier at once. The compromise is recording behaviour: continuous capture would drain a battery within days, so these cameras wake on motion, which is why around 17% of relevant events are missed. Recharge intervals near three months are acceptable to most households and irritating to all of them. Radar presence sensing and pre-roll buffering are closing part of the gap, though neither eliminates the underlying energy constraint. This is also the format sold hardest at promotional pricing, which means it builds installed base and generates very little margin doing it.
CAGR 9.8%
Full segment breakdown across 6 segments available in the complete report.

Regional Architecture and Country Demand Map

Shares record where cameras and subscriptions are sold rather than where hardware is assembled. North America sits above its standard band on subscription attachment and detached housing stock, and Eastern Europe below on a preference for local storage that suppresses service revenue. Each deviation carries a stated reason.

North America

At 32% this sits inside the standard band and carries by far the highest subscription attachment anywhere, which is why platform revenue concentrates here even though unit volumes do not. Detached housing with exterior doors, driveways and package deliveries creates the use cases the category was designed around, and doorbell cameras reached mainstream adoption here first. Amazon and Google hold positions built on existing household accounts rather than on camera specification. Growth of 7.2% reflects a maturing installed base where replacement and additional cameras outweigh first purchases. Per-camera subscription pricing has been abandoned by several platforms here first, because multi-camera households are more common than anywhere else and were defecting to local storage in visible numbers.
Share: 32% | CAGR: 7.2% (2026 to 2036)

East Asia

The 24% position sits at the top of its standard band, carried by Chinese manufacturing and by domestic demand that behaves quite differently from Western markets. Chinese households favour local storage and integrated network video recorders over cloud subscription, which suppresses service revenue relative to unit volume. Hikvision and Dahua hold domestic positions built on scale that no Western participant approaches. Japanese and Korean demand is smaller, apartment-oriented and weighted toward indoor cameras. Growth of 9.0% comes principally from Chinese residential adoption. Network video recorder integration is far more common in Chinese homes than cloud subscription, which means the region contributes far more to unit volume than to service revenue in any global total.
Share: 24% | CAGR: 9.0% (2026 to 2036)
Regional intelligence for 5 additional markets available in the complete report: Western Europe, South Asia and Pacific, Latin America, Middle East and Africa, Eastern Europe. Contact sales@marketmindsadvisory.com.
wireless-security-camera-market-country-cagr-analysis-1790024544252

Four Moves Worth Making Now

These four address a market where hardware earns almost nothing, seven in ten cameras never generate a subscription, and the technical argument for cloud storage has largely dissolved. Each has been executed by at least one participant with measured rather than asserted results. Two of the four are pricing decisions rather than engineering ones.

Replace Per-Camera Fees With Household Plans

Per-camera subscription pricing charges a six-camera household six times for one service, which penalises exactly the customers worth keeping and pushes them toward local storage. Unlimited-camera household plans raise attach from the current 29% base and increase revenue per household even at a lower notional price per device. Participants who switched report subscription revenue per household rising roughly 1.8 times, because more households subscribe and multi-camera owners stop defecting. The households that defect to local storage under per-camera pricing are the ones with the most hardware to lose. Keeping them is worth more than the per-device revenue.
Market Impact: Subscription revenue per household rises roughly 1.8 times

Ship Local Storage As A Standard Option

Around 71% of installed cameras carry no paid plan, and a meaningful share of those buyers actively wanted local storage and bought the cheapest hardware that tolerated it. Including an SD slot or network drive support costs a few dollars of bill of materials and converts a lost customer into a hardware sale with upgrade potential. Participants offering both report total revenue per camera rising roughly 22%, because the hardware sells at a real margin rather than at 9%. Around 58% of non-subscribers decline on where footage is stored rather than on price, which no promotion addresses.
Market Impact: Total revenue per camera rises roughly 22% overall

Add Radar Presence Sensing To Battery Models

Motion triggering misses roughly 17% of relevant events because detection begins too late or outside the zone, and that failure generates the complaint that most damages platform trust. Low-power radar presence sensing with pre-roll buffering catches approach before movement crosses a threshold, at a bill of materials increase near USD 6. Participants who added it report missed event rates falling to around 6%, and support contact volume dropping with them. Missed events produce the complaint that most damages platform trust, and trust is what the whole subscription relationship rests on. Support contact volume falls alongside the failure rate.
Market Impact: Missed event rate falls to around 6% overall

Compete Hardest On The Doorbell Entry Point

The doorbell is the first camera most households buy and it determines which platform every subsequent camera joins, because buyers follow the app rather than comparing specifications again. Winning that position is worth accepting negative hardware margin on the doorbell specifically. Participants prioritising doorbell share report attached camera counts averaging roughly 3.4 additional units per household within two years, which is where the actual return on that concession appears. Buyers do not compare specifications again for camera two or three; they open the app they already have and order. That makes the entry decision the only genuinely contested moment.
Market Impact: Adds roughly 3.4 attached cameras per household overall

Who Controls the Margin Pool

Concentration is high at 51% held by the top five, measured consistently on manufacturer net revenue including subscription rather than on camera units, which would substantially overstate participants selling cheap hardware with no service attachment at all. The leader to challenger gap rests on existing household account relationships rather than on camera engineering, which is widely available through contract manufacture.
Competition runs on three dimensions currently. Platform ownership decides lifetime value, since a household enrols once and adds cameras to whatever app it already uses. Subscription pricing structure decides attach rate, and the shift from per-camera to household bundles is reshaping it. Hardware price decides entry, particularly on doorbells, where participants accept negative margin because the format determines platform selection for everything afterwards.

Pressure is building from two directions and positions will shift on both. Local storage and edge processing participants are growing at half again the market rate by removing the subscription entirely, which is a direct attack on the incumbent revenue model rather than a feature contest. Meanwhile Indian and Chinese manufacturers are reaching Western specifications at prices that make the hardware-as-acquisition-cost strategy considerably harder to sustain.
wireless-security-camera-market-company-positioning-matrix-1790024544772

Competitive Moat and Risk Dimensions

AMAZON

Moat: Existing Household Account Relationships

Millions of households already hold a payment relationship and an app, which makes enrolling a camera subscription a single confirmation rather than a new commercial decision, and that removes most of the friction that competitors have to overcome with pricing or with marketing. Competitors start from nothing.
AMAZON

Risk: Subscription Dependent Revenue Model

A model built on recurring storage revenue is directly exposed to edge processing that performs the same detection on device, and to privacy sentiment that favours footage never leaving a house. Hardware margin near 9% offers no fallback if subscription attach erodes further. There is no fallback position.
ANKER INNOVATIONS

Moat: Local Storage Product Positioning

Building cameras around on-device storage and processing addresses buyers who reject both the monthly fee and the cloud arrangement, which is the fastest-growing part of the market, and it allows hardware to be sold at genuine margin rather than as an enrolment cost. Data location is a product feature here.
ANKER INNOVATIONS

Risk: No Recurring Revenue Stream

Selling hardware at real margin without recurring revenue means the relationship ends at the transaction, and lifetime value depends entirely on the customer buying additional cameras later. Platform competitors can subsidise hardware indefinitely from service income that this model does not generate. That asymmetry favours the incumbents.

Players Tracked

Prominent Players

Amazon
Google
Arlo Technologies
Anker Innovations
Hangzhou Hikvision

Other Key Players

Dahua Technology
TP-Link
Wyze Labs
SimpliSafe
Reolink
Ubiquiti
Aqara
Xiaomi
Swann Communications
Lorex Technology
Netatmo
Bosch Smart Home
CP Plus
Godrej Security Solutions
Imou

Recent Developments

MARCH 2025

Arlo Technologies moves to unlimited-camera household pricing

The company replaced per-device subscription charging with a single household plan covering unlimited cameras, targeting multi-camera owners who had been paying proportionally more for identical service. This was an internal pricing decision with no acquisition, partnership or joint venture behind it. Existing subscribers were migrated automatically.
Signal: Per-camera pricing was penalising the households worth keeping most. Multi-camera households were defecting to local storage in visible numbers.
OCTOBER 2024

Anker Innovations expands local storage range across Europe

The company widened distribution of cameras built around on-device storage and processing across European retail, targeting buyers deterred by recurring fees and data protection concerns. This was organic commercial expansion rather than an acquisition, merger or joint venture arrangement. Cloud subscription remains available as an optional addition.
Signal: Data protection sentiment in Europe is a product argument, not a compliance one. Storage location is now the decision.
JUNE 2025

CP Plus commissions Indian manufacturing capacity expansion

The company added domestic camera assembly capacity in India under production-linked incentive provisions, serving residential construction demand from local rather than imported supply. This was organic capital investment with no joint venture, acquisition or licensing arrangement involved. Imported supply continued during the ramp. Local storage remains the default.
Signal: Domestic assembly removes the duty that kept prices above household budgets. Local assembly is what makes household price points reachable.

What The Unit Costs

Silicon dominates and the rest follows behind it. Image sensor and system-on-chip together run roughly 38% of hardware manufacturing cost, with edge processing capability accounting for a growing share of that. Battery cells take about 14%, housing and optics around 17%, and wireless modules a further 11%. Assembly and packaging absorb the remainder. Cloud storage and inference are a separate operating cost entirely.
Semiconductor supply constraints through 2021 and 2022 raised image sensor and controller costs sharply while shipping from Asian ports climbed in the same window, a movement visible in US Census Bureau trade data for the period. Participants pricing hardware near cost to acquire subscribers absorbed the increase directly against a margin that had no room in it. Several reset hardware pricing upward from 2023 once subscriber conversion disappointed.

Exposure divides by revenue model rather than by company size. Participants selling hardware at near-zero margin to enrol subscribers carry silicon and freight exposure with nothing to absorb it, which makes them unusually sensitive to component cycles. Local storage participants price hardware at genuine margin and absorb movement more comfortably. Indian and Chinese manufacturers producing for domestic demand avoid duty and freight entirely on their largest markets.
wireless-security-camera-market-cost-volatility-analysis-1790024544970

Restore genuine margin on hardware alongside subscription

Pricing a camera at roughly 9% gross margin leaves no capacity to absorb a component cycle, and subscriber conversion at 29% has not justified the subsidy. Restoring hardware margin while offering local storage recovers room without abandoning the service business. The risk is entry price competitiveness against participants still subsidising aggressively. Very few have been willing to test it.

Dual source image sensors before volume commitments

Sensor and controller silicon together approach two fifths of hardware cost and come from a limited supplier base with long qualification cycles. Qualifying a second source before scaling avoids a position where one supplier sets both price and allocation. Qualification takes engineering time well ahead of any commercial need for it. Most participants start far too late.

Assemble regionally in the largest demand markets

Import duty and freight together add meaningfully to landed cost in India and several other markets where domestic assembly incentives now exist. Producing locally removes both and qualifies for incentive schemes. The constraint is that regional volumes must justify tooling and assembly investment before the incentive value is realised. India and China clear that threshold comfortably now.

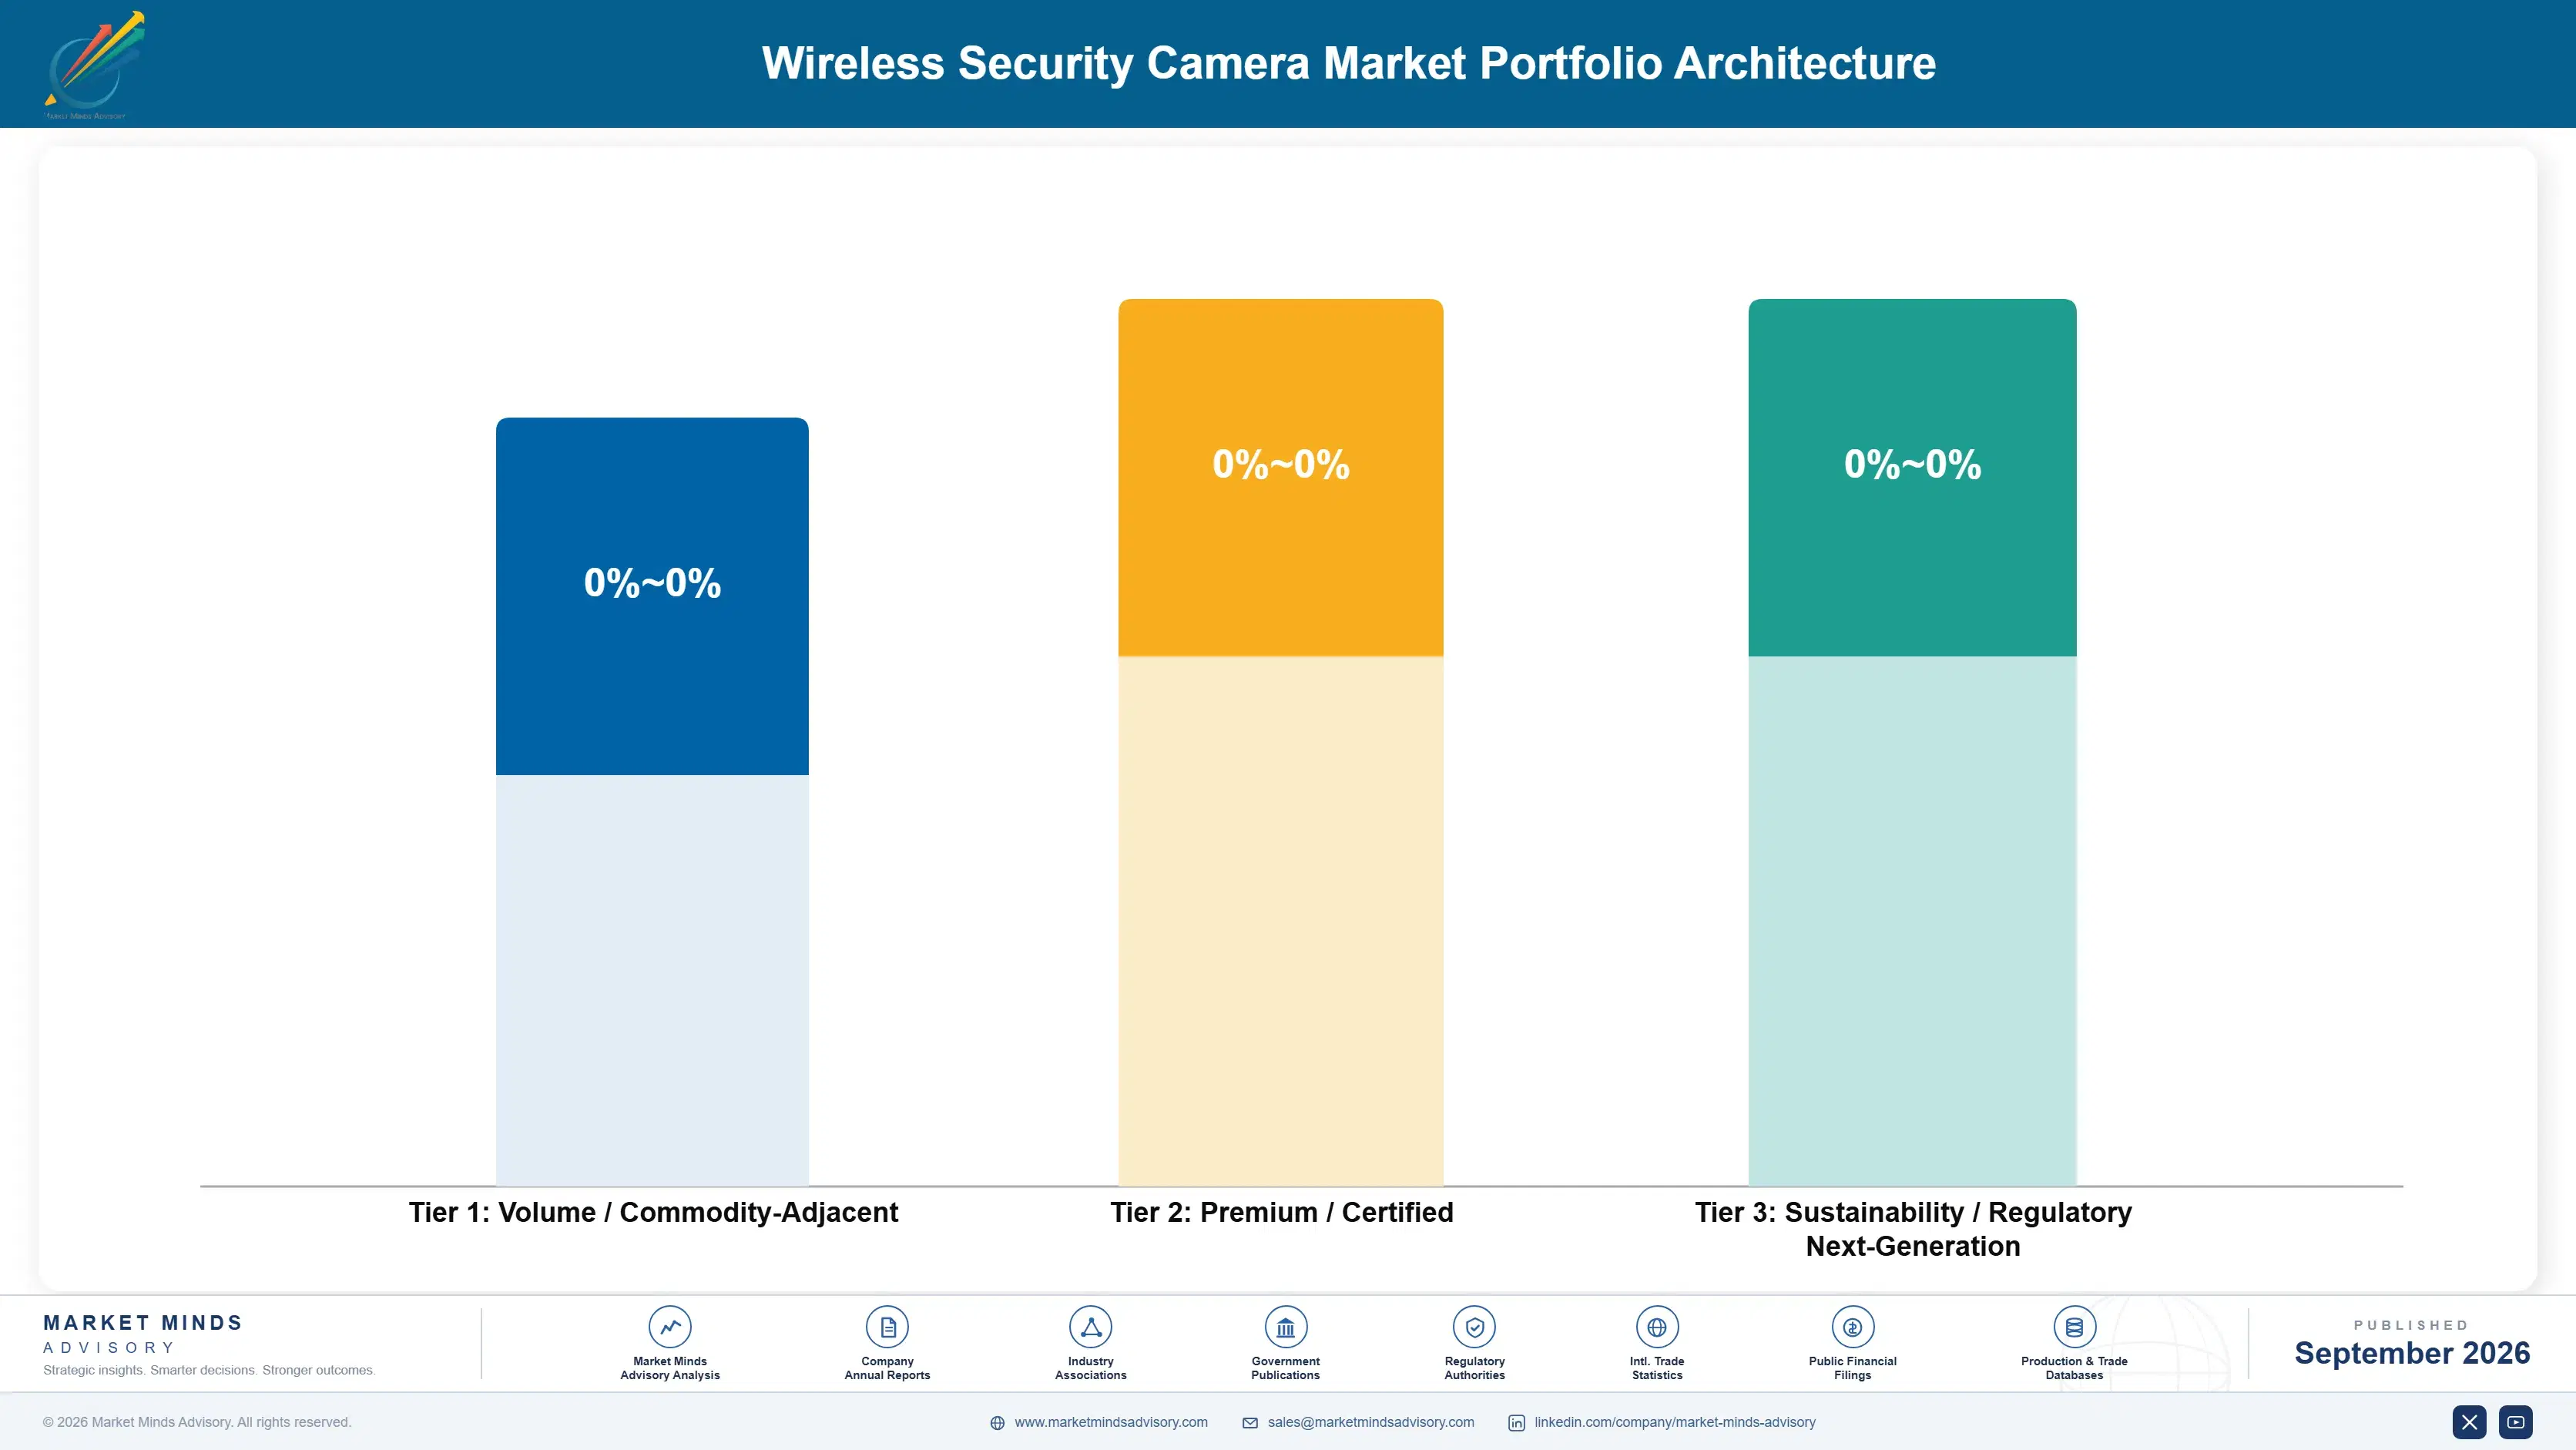
Portfolio Architecture for Margin Defence

Margin architecture divides by whether revenue recurs, and the hardware price list actively misleads on this point. Battery and indoor cameras sold at promotional pricing run at gross margins in the mid single digits to mid teens, deliberately priced as enrolment cost rather than as product, and a household that never subscribes leaves that acquisition spending entirely unrecovered. Nothing in a unit sales report distinguishes the two outcomes.
Local storage cameras, floodlight formats and professional installation channel product hold gross margins in the high twenties to high thirties. The spread reflects how differently subsidised and unsubsidised hardware is priced for identical components. Local storage in particular earns a real margin because its buyer is paying for the device rather than being recruited by it, which is a healthier commercial relationship than the category's dominant model.

The highest-value pool is subscription services and cloud storage, at margins in the high sixties to high seventies. Those revenues recur monthly at minimal incremental cost once infrastructure exists. Subsidised hardware carries unit volume and builds the installed base. Roughly seven in ten of those units generate nothing at all afterwards. Installed base has value and it is not the same thing as revenue.

Volume / Commodity-Adjacent

Battery and indoor cameras at promotional pricing, deliberately sold as enrolment cost rather than product. The eleven point range reflects how aggressively different participants subsidise to win platform position. Seven in ten never recover the subsidy.
Gross Margin: 5 to 16%

Premium / Certified

Local storage cameras, floodlight formats and installation channel product. Local storage earns real margin because its buyer pays for the device rather than being recruited by it. It is a healthier commercial relationship than the dominant model.
Gross Margin: 28 to 38%

Sustainability / Regulatory / Next-Generation

Subscription services and cloud storage, recurring monthly at minimal incremental cost once infrastructure exists. This is the only tier where the category's economics have ever genuinely worked. Edge processing is now attacking that position directly.
Gross Margin: 67 to 78%
wireless-security-camera-market-portfolio-architecture-1790024545472

High-value Sub-segments and Strategic Watch-out

Subscription And Cloud Services

Highest value in the category and increasingly contested, since attach sits near 29% and edge processing removes the technical argument. Household bundle pricing is the only lever that has measurably improved it anywhere. Nothing else in the category earns anything approaching these margins at any scale.
Gross Margin: 68 to 78%

Local Storage And Edge Cameras

High value and fastest growth at 12.0%, earning genuine hardware margin because the buyer is paying for a device rather than being enrolled. The model has no recurring revenue to fall back on. Lifetime value depends entirely on the customer choosing to buy additional cameras later.
Gross Margin: 30 to 38%

Battery-Powered Cameras

Volume core and the format that builds every installed base, sold at enrolment pricing rather than as product. Roughly seven in ten units never generate a subscription and never recover that subsidy. Household bundle pricing is the only lever that has measurably improved that ratio.
Gross Margin: 6 to 16%

Wired Always-On Cameras

Strategic watch-out. Growing slowest at 3.4% and limited by where households will run cable. The twenty point range reflects how differently retail and professional installation channels price identical hardware. Developer specification is where most of the remaining volume actually sits. Retail volume here is small.
Gross Margin: 14 to 34%

How Households Actually Expand

A household enrols once and then adds hardware to whatever app it already has, which makes the first camera disproportionately valuable and every subsequent one close to automatic. That is why doorbells are contested at negative margin: the format that gets bought first determines the platform, and buyers do not re-evaluate specifications for camera two or three. The entry decision is the only genuinely competitive moment in the relationship.
Stickiness varies sharply by subscription status and by camera count. A household paying monthly has switching friction that a non-subscriber does not, since footage history lives on the platform and leaving means losing it. Multi-camera households on per-device pricing are the least sticky of all, because the cost of staying rises with every unit they add. Local storage buyers have no platform attachment whatsoever and none is claimed.

Buyer profiles have shifted toward privacy awareness and away from convenience framing. The cohort buying now asks where footage is stored considerably more often than the 2020 cohort did, and European data protection publicity accelerated that. They also increasingly know that on-device processing exists, which makes the subscription a choice rather than a requirement. Very little of the dominant marketing acknowledges either change.
wireless-security-camera-market-end-use-penetration-index-1790024545964

Where The Model Holds

These are among the four positions where our research anticipates prominent divergence between winners and laggards over the coming forecast period. Each is grounded in the demand model, the regulatory perimeter, and the announced capacity pipeline.
01 / SUBSCRIPTION PRICING STRUCTURE

Charge the household, not the camera

Per-camera subscription pricing charges a six-camera household six times over for one service, which penalises precisely the customers worth keeping and pushes them toward local storage alternatives. Unlimited-camera household plans lift attach from the current 29% base and raise revenue per household even at a lower notional price per single device. Participants who switched report subscription revenue per household rising roughly 1.8 times as multi-camera owners stop defecting entirely, and the defecting households are the ones with the most hardware.
02 / LOCAL STORAGE PROVISION

Sell to the buyer who refuses subscription

Around 71% of installed cameras carry no paid plan at all, and a meaningful share of those buyers actively wanted local storage and bought whatever cheap hardware tolerated an SD card. Including a card slot or network drive support costs a few dollars of bill of materials. Participants offering both report total revenue per camera rising roughly 22%, because hardware then sells at genuine margin rather than at the 9% enrolment price, and roughly 58% of non-subscribers decline on storage location anyway.
03 / PRESENCE SENSING ADDITION

Catch the approach, not the movement

Motion triggering misses roughly 17% of relevant events because detection begins too late or outside the configured zone, and that failure produces the complaint that most damages platform trust with customers. Low-power radar presence sensing with pre-roll buffering catches an approach before movement crosses a threshold, at around USD 6 of additional bill of materials. Participants who added it report missed event rates falling to roughly 6% with support contacts dropping alongside, and trust is what the whole subscription relationship ultimately rests on.
04 / DOORBELL POSITION DEFENCE

The first camera decides the next four

The doorbell is the first camera most households buy and it determines which platform every subsequent camera joins, because buyers follow the app they already have rather than comparing specifications for a second time. Winning that position justifies accepting a negative hardware margin on the doorbell specifically. Participants prioritising doorbell share report roughly 3.4 additional attached cameras per household within two years, which is where the concession is eventually recovered in full, since buyers never compare specifications again for camera two.

Engagement Snapshot From the Field

A live engagement with an industry participant carrying material or product regulatory and market exposure ahead of a defining policy shift, showing how our research translates into a defensible multi-year portfolio strategy.
MARKET MINDS ADVISORY · CLIENT ENGAGEMENT SUMMARY
Wireless Security Camera Producer Strategic Portfolio Review and Transition Roadmap 2026·Investment Scenario on Wireless Security Camera Exposure Evaluation 2025-26
CLIENT PROFILE
A connected home device manufacturer with camera revenue near USD 240 million (client-reported, unverified by MMA), split approximately 82% hardware and 18% subscription. Pricing charged per camera per month. No product in the range supported local storage, and doorbell share sat well below the company's overall camera position in every market served. Radar sensing was absent from the range.
STRATEGIC CHALLENGE
Subscription revenue had grown far slower than the installed base for three years, and management attributed the gap to insufficient marketing of plan benefits. A subscription promotion had been approved. Nobody had examined whether multi-camera households were subscribing at different rates, or why non-subscribers had bought at all. Neither question had been asked internally.
MMA APPROACH
MMA analysed attach rate by camera count per household rather than reporting a single blended figure. Non-subscribing owners were surveyed on why they declined. Missed event complaints were traced to triggering behaviour through device logs, and doorbell purchase sequence was mapped against subsequent camera additions. Findings were reconciled against billing system records.
KEY FINDINGS
  1. Attach rate fell from 41% in single-camera households to 11% in households with four or more, meaning per-device pricing suppressed exactly the highest-value customers.
  2. Some 58% of non-subscribers cited unwillingness to store footage off-site rather than price, which no promotional offer could address at all. regardless of how it was presented.
  3. Device logs showed 19% of user-reported events were absent from recordings entirely, concentrated on battery models with standard motion triggering. rather than on wired always-on models.
  4. Households whose first camera was a doorbell added 3.1 further cameras on average against 0.9 for those starting with any other format.
CLIENT PROFILE
A connected home device manufacturer with camera revenue near USD 240 million (client-reported, unverified by MMA), split approximately 82% hardware and 18% subscription. Pricing charged per camera per month. No product in the range supported local storage, and doorbell share sat well below the company's overall camera position in every market served. Radar sensing was absent from the range.
STRATEGIC CHALLENGE
Subscription revenue had grown far slower than the installed base for three years, and management attributed the gap to insufficient marketing of plan benefits. A subscription promotion had been approved. Nobody had examined whether multi-camera households were subscribing at different rates, or why non-subscribers had bought at all. Neither question had been asked internally.
MMA APPROACH
MMA analysed attach rate by camera count per household rather than reporting a single blended figure. Non-subscribing owners were surveyed on why they declined. Missed event complaints were traced to triggering behaviour through device logs, and doorbell purchase sequence was mapped against subsequent camera additions. Findings were reconciled against billing system records.
KEY FINDINGS
  1. Attach rate fell from 41% in single-camera households to 11% in households with four or more, meaning per-device pricing suppressed exactly the highest-value customers.
  2. Some 58% of non-subscribers cited unwillingness to store footage off-site rather than price, which no promotional offer could address at all. regardless of how it was presented.
  3. Device logs showed 19% of user-reported events were absent from recordings entirely, concentrated on battery models with standard motion triggering. rather than on wired always-on models.
  4. Households whose first camera was a doorbell added 3.1 further cameras on average against 0.9 for those starting with any other format.
RECOMMENDED STRATEGY
Phase 1: Phase one: cancel the promotion and replace per-camera charging with an unlimited household plan immediately. Existing subscribers migrate across automatically at no cost. Phase 2: Phase two: add local storage support across the range and introduce radar presence sensing on battery models. Cloud remains available as an option. Phase 3: Phase three: price the doorbell aggressively to win first-camera position in every served market. Negative hardware margin there is recovered later.
OUTCOME
Subscription revenue per household rose by roughly three quarters within four quarters of the pricing change (client-reported, unverified by MMA). Local storage variants sold at hardware margins well above the subsidised range, and doorbell share gains lifted average cameras per household materially by the second year.

Frequently Asked Questions

Foundational context covering the market sizes, CAGR, scope, country, region and competition that inform every finding below. This section is provided to cover basics and most often pre-purchase conversations, answered from the MMA Primary Research Dataset.

What is the current size of the Wireless Security Camera Market?

The market was valued at USD 9.4 billion in 2025, rising to USD 10.2 billion in 2026. Sizing is at manufacturer net revenue including subscription across six camera formats.

How large will the Wireless Security Camera Market be by 2036?

MMA forecasts USD 22.0 billion by 2036, an increase of USD 11.8 billion over the 2026 base. That represents expansion of 2.16 times across the forecast period.

What is the CAGR for the Wireless Security Camera Market 2026 to 2036?

The base case CAGR is 8.0%, with a bull case of 9.3% and a bear case of 6.7%. Historical growth between 2020 and 2025 ran at 6.8%.

Which segment is growing fastest?

Local storage and edge processing cameras grow at 12.0%, half again the market rate, by removing the subscription argument. Battery-powered cameras follow at 9.8% and wired always-on cameras grow slowest at 3.4%.

Who are the major companies in the Wireless Security Camera Market?

Amazon, Google, Arlo Technologies, Anker Innovations and Hangzhou Hikvision lead on net revenue including subscription, holding a combined 51%. Household account relationships rather than camera engineering separate them.

Which country is growing fastest?

India grows fastest at 13.4%, combining large-scale residential construction with domestic manufacturing expanding under production-linked incentive schemes that remove import duty. Gated developments also specify cameras at build stage.

Report Segmentation Architecture

The full report scope spans multiple orthogonal segmentation dimensions, with cross-tabulated demand data provided for each dimension pair. Coverage extends further to regional breakdowns, trend trajectories, and the competitive detail needed to support segment-level decision-making.

By Camera Format

  • Battery-Powered Cameras
  • Wired Always-On Cameras
  • Doorbell Cameras
  • Local Storage and Edge Processing Cameras
  • Floodlight and Spotlight Cameras
  • Indoor Pan and Tilt Cameras

By End-Use Setting

  • Detached Residential Property
  • Apartment and Multi-Unit Housing
  • Small Business Premises
  • Rental and Tenanted Property
  • Holiday and Second Homes
  • Outbuildings and Yard Perimeters

By Commercial Dimension

  • Consumer Electronics Retail
  • Brand Direct and Online
  • Marketplace and E-Commerce
  • Professional Installation Channel
  • Telecom and Utility Bundling
  • Property Developer Specification

By Region

  • North America
  • East Asia
  • Western Europe
  • South Asia and Pacific
  • Latin America
  • Middle East and Africa
  • Eastern Europe

Scope, Methodology, and Coverage

Every figure in this report is reproducible from documented input assumptions. The scope below maps the historical period, the forecast horizon, the segmentation dimensions, and the countries covered, alongside the underlying primary and qualitative methodology.
Historical Period
2020 to 2025
Forecast Period
2026 to 2036
Base Year
2025 (USD billions; MMA Primary Research Dataset, September 2026)
Market Definition
This market covers consumer and small business wireless security cameras and the services sold with them, spanning battery-powered cameras, wired always-on cameras, doorbell cameras, local storage and edge processing cameras, floodlight and spotlight cameras, and indoor pan and tilt cameras. Sizing is at manufacturer net revenue including subscription services across retail, direct, marketplace, installation, telecom bundling and developer specification channels. Professionally monitored alarm systems, commercial video surveillance, body-worn cameras and dash cameras are excluded throughout.
Quantitative Units
USD billions at manufacturer net revenue including subscription; volume in millions of cameras shipped; attachment in percentage of active plans.
Segmentation Dimensions
Camera format, end-use setting, commercial dimension, and geographic region.
Regions Covered
North America, East Asia, Western Europe, South Asia and Pacific, Latin America, Middle East and Africa, Eastern Europe
Countries Covered
United States, China, India, Germany, Brazil, Saudi Arabia
Key Companies Profiled
Amazon, Google, Arlo Technologies, Anker Innovations, Hangzhou Hikvision, Dahua Technology, TP-Link, Wyze Labs, SimpliSafe, Reolink, Ubiquiti, Aqara, Xiaomi, Swann Communications, Lorex Technology, Netatmo, Bosch Smart Home, CP Plus, Godrej Security Solutions, Imou
Quantitative Methodology
Primary survey, n=3,800 respondents, Q4 2025, six countries; demand-side model with trade association cross-validation
Qualitative Methodology
47 expert interviews, Q4 2025; applied to validate demand model assumptions, identify emerging dynamics, and assess competitive positioning
Report Format
PDF and XLSX data workbook (Word format preview document)
Publisher
Market Minds Advisory
Report Code
MMA-2026-TEC-805
Published
September 2026
Contact
sales@marketmindsadvisory.com | www.marketmindsadvisory.com

Purchase the full Wireless Security Camera Market Report (2026 to 2036).

The full report sizes the wireless security camera market across six camera formats, six end-use settings and six commercial dimensions for all seven global regions through 2036. It analyses subscription attach rate by camera count per household rather than reporting a blended figure that conceals how per-device pricing performs. Non-subscribing owners are surveyed on the reasons they declined rather than assumed to be price sensitive. Missed event rates are traced through device logs against user-reported incidents. Competitive assessment covers 20 participants on a consistent net revenue basis.
Subscription attach analysed by camera count per household
Non-subscriber reasons surveyed rather than assumed
Missed event rates traced through device logs
Doorbell purchase sequence mapped against later additions
Six camera formats sized through 2036
Twenty participants assessed on consistent net revenue

Built For The People Who Decide

From boardroom strategy to bench-side execution, this report is read cover-to-cover by leaders shaping the next decade of their industry, turning demand scenarios, market dynamics and valuation benchmarks into decisions.
CXOs/ Presidents/ VPs/ Managers
M&A and Corporate Development
Strategy Teams and R&D Heads
Procurement and Product Directors
Regulatory and Compliance Leaders
Investor Relations and Equity Analysts