Market Minds Advisory
Wireless Lighting Market

Wireless Lighting Market: Wireless Lighting Market. Building Retrofits Drive a Controls Upgrade Cycle

Commercial building owners are ripping out wired lighting control panels for mesh-networked wireless systems, turning a decades-old retrofit cost problem into a recurring software and sensor revenue opportunity for lighting vendors.

Lead Analyst

Published

September 2026

Make Smarter Decisions with Customized Research Insights

Request a free sample report and evaluate market opportunities, growth trends, and competitive dynamics relevant to your business needs.

2025 MARKET VALUE$9.4BMarket Size 2025
2036 FORECAST VALUE$34.7BBase Case , 2026 to 2036
CAGR 2026 TO 203612.6 %Bull 13.9% / Bear 11.3%
INCREMENTAL OPPORTUNITY$24.1BNet 10- year value creation
EXPANSION MULTIPLE3.28x2036 value over 2026 base
Strategic Levers
M&A Pipeline
Regional Outlook
Country Rankings
Competitive Intelligence
Segmental Deep-dive
Call-Us : 91 93563 13602

Executive Snapshot and Market Trajectory.

Wireless lighting control has become the default choice for commercial retrofit projects, eliminating the conduit and wiring costs that made lighting upgrades prohibitively expensive for older buildings across most commercial real estate portfolios this construction cycle and every renovation cycle that follows across most commercial property types.
Bluetooth Mesh and Zigbee protocols are displacing proprietary wired control systems as building owners prioritize interoperability with broader smart building platforms rather than single-vendor lock-in. Adoption is fastest among commercial office and hospitality properties across East Asia and North America, where energy codes and tenant demand for adaptive lighting are pushing upgrade cycles. Human-centric lighting tied to circadian research is emerging as a distinct premium category drawing new dedicated vendor investment from specialized entrants.
Lighting manufacturers and building automation software vendors are converging on the same commercial accounts, each embedding sensors and analytics that turn fixtures into data collection points for occupancy and energy management. Rising electricity costs are accelerating adoption of adaptive dimming and daylight harvesting controls that reduce consumption without requiring building-wide renovation or extended tenant disruption during ongoing commercial building operations across occupied tenant spaces during normal business hours.
Market Definition
This report defines the Wireless Lighting Market as lighting fixtures, sensors, and control systems using wireless communication protocols to manage illumination without hardwired control circuits, including Bluetooth Mesh, Zigbee, and proprietary RF-based systems. It excludes hardwired DALI and 0-10V lighting controls, standalone LED fixtures without connected control capability, and general building management software unrelated to lighting.
Base Year Value
$9.4B in 2025 (MMA Primary Research Dataset, September 2026)
Forecast Period
2026 to 2036, eleven discrete annual values
CAGR
12.6% base case. Bull 13.9%. Bear 11.3%.
Fastest Growth Segment
Bluetooth Mesh Lighting Control Systems: 18.2% CAGR
Fastest Growth Country
China: 15.6% CAGR
Fastest Growth Region
South Asia and Pacific: 14.6% CAGR
Largest Region
East Asia: 28% of 2025 global value
Market Leaders
Signify, Legrand, Lutron Electronics, Acuity Brands, and Zumtobel Group lead the competitive field. Source: MMA Primary Research Dataset, July 2026.
Primary Survey
n=3,800 procurement and R&D decision-makers, Q4 2025, six countries
Methodology
Demand-side build-up, cross-validated against public data, 47 expert interviews

Wireless Lighting Market Forecast Scenarios

wireless-lighting-market-size-forecast-scenario-1789998961108
Between 2020 and 2025, wireless lighting adoption grew steadily at an 11.6% historical CAGR as commercial retrofit projects proved out mesh networking reliability at scale across diverse building types. Growth was concentrated among large commercial office and retail portfolios, while residential adoption remained limited to premium smart home segments throughout most of the period across nearly every major market.
The base case assumes continued strong growth through 2036 as three mechanisms compound: building energy codes keep tightening and requiring adaptive lighting controls, commercial property owners keep prioritizing tenant amenity differentiation through smart lighting, and interoperable wireless protocols keep lowering integration cost compared to proprietary wired systems. Manufacturer consolidation around unified sensor and control platforms further supports sustained enterprise adoption across most building types worldwide through the middle years of the forecast window.
The bull case centers on accelerated building energy code mandates across major commercial real estate markets globally, which could push growth toward 13.9%. The bear case assumes commercial real estate capital expenditure compression during a macroeconomic downturn delays retrofit projects, pulling growth toward 11.3% as building owners defer lighting upgrades in favor of essential maintenance spending instead.

From Fixture Upgrade to Building Intelligence Layer

Wireless lighting control has moved from a premium new-construction feature into the standard retrofit path for commercial buildings as mesh networking proved reliable enough to replace hardwired control panels at scale across most property types this construction cycle across nearly every commercial real estate segment tracked in this report's full coverage, from offices to hospitality to healthcare.
MARKET CONCENTRATIONCR5: 44%Top five vendors together hold under half of global share
AVERAGE FIXTURE COST$85 per wireless nodeTypical incremental cost per wireless-enabled lighting fixture installed
RETROFIT SHARE58% of installationsShare of installations occurring in existing rather than new buildings
INTEROPERABILITY RATE62% multi-protocol capableShare of new products supporting more than one wireless protocol
DEPLOYMENT CYCLE6 to 10 weeksTypical time from order through full building commissioning completion
ENERGY SAVINGS28 to 35% reportedAverage energy reduction buildings report after adaptive control adoption
Manufacturers are racing to make fixtures interoperable across multiple wireless protocols rather than locking customers into proprietary platforms, a shift driven by building owners wanting flexibility to mix vendors across a single property. Sensor-embedded fixtures are turning lighting infrastructure into a data collection layer for occupancy analytics and energy management systems spanning entire commercial portfolios rather than single isolated buildings under separate management arrangements.
Pricing is shifting from fixture-only sales toward bundled hardware-plus-software subscription models that extend vendor revenue capture well beyond the initial installation. Human-centric lighting tied to circadian rhythm research is emerging as a distinct premium category as workplace wellness programs adopt tunable white light systems that adjust color temperature throughout the day automatically across occupied office space and shared common areas throughout the workday and into evening hours.
"Building owners used to think of lighting as a cost center they replaced every fifteen years. Now it is a sensor network they upgrade every few, and vendors that miss that shift are competing on price alone."
Senior Analyst, Building Technology Practice · MMA Construction and Industrial Equipment Practice · September 2026

Market Trends

Interoperable Protocols Displace Proprietary Control Systems

Bluetooth Mesh and Zigbee certification programs are gaining rapid adoption as building owners refuse to commit to single-vendor proprietary control systems that lock them into one manufacturer for the life of the installation. This shift is forcing established lighting manufacturers to open their platforms to third-party sensors and controls rather than defending closed product lines that once generated predictable service revenue. Several major manufacturers have announced expanded multi-protocol product lines within the past year specifically to address this competitive pressure from interoperability-focused buyers that now dominate most large commercial procurement decisions.
Market Impact: Codes drive 38% of retrofit demand

Sensor-Embedded Fixtures Enable Deep Occupancy Analytics

Lighting fixtures embedding occupancy, temperature, and air quality sensors are transforming lighting infrastructure into a building-wide data collection layer that facility managers use for space utilization and energy optimization decisions. This convergence is pulling lighting manufacturers into direct competition with dedicated building automation software vendors over the same commercial accounts and budget allocation. Several vendors have launched dedicated analytics platforms built specifically around lighting fixture sensor networks this past year targeting large corporate real estate portfolios seeking to consolidate multiple building management tools into a single unified interface for facility teams.
Market Impact: Energy costs cut 28 to 35%

Market Opportunities and Growth Drivers

Building Energy Codes Mandate Adaptive Lighting Controls

Updated commercial building energy codes across major jurisdictions now require adaptive lighting controls including daylight harvesting and occupancy sensing for new construction and major renovations, directly mandating wireless control adoption rather than leaving it optional. California's Title 24 and comparable European Union energy performance directives are setting compliance benchmarks that other jurisdictions increasingly reference when drafting their own updated requirements. Building owners report code compliance as the single most common trigger for wireless lighting retrofit project initiation across most commercial portfolios surveyed for this analysis this year across every major building type.
Market Impact: Interference adds 15% commissioning time

Rising Electricity Costs Reward Adaptive Dimming Systems

Commercial electricity costs climbing across most major markets are pushing building owners toward adaptive dimming and daylight harvesting systems that can reduce lighting energy consumption by 28 to 35% without requiring occupant behavior change or building-wide renovation. Facilities operating on thin operating margins increasingly treat lighting controls as a direct cost-reduction investment with measurable payback periods rather than a comfort amenity. Vendors are responding by marketing energy savings ahead of aesthetic improvements in sales materials targeting cost-conscious commercial property owners facing sustained operating margin pressure across most competitive commercial submarkets.
Market Impact: Security concerns delay 12% of deals

Market Restraints and Challenges

Radio Frequency Interference Complicates Dense Deployments

Large commercial buildings with hundreds or thousands of wireless lighting nodes face radio frequency interference challenges that can degrade mesh network reliability, particularly in structures with substantial concrete and metal construction that reflects or absorbs wireless signals unpredictably. The root cause is the inherent physics limitation of radio propagation through dense building materials at the frequencies most wireless lighting protocols use. The commercial impact includes extended commissioning timelines and occasional coverage gaps. Vendors are mitigating the issue through mesh network redundancy and dedicated site surveys before installation begins on any dense, high-node-count commercial project.
Market Impact: Multi-protocol deployments up 33% yearly

Cybersecurity Vulnerabilities Raise Building Owner Concerns

Connected lighting systems present a potential network attack surface that some building owners remain hesitant to introduce, particularly in facilities handling sensitive data such as financial services and government buildings. The root cause is limited security hardening in early-generation wireless lighting protocols that prioritized ease of installation over strong, layered authentication controls. The commercial impact includes slower adoption among security-conscious institutional buyers. Vendors are mitigating the concern through improved encryption standards and network segmentation capabilities isolating lighting traffic from sensitive corporate systems entirely from unrelated building infrastructure and tenant data networks.
Market Impact: Sensor-enabled fixtures up 29% yearly
3 additional market trends, 4 additional growth drivers, and 3 additional restraints and challenges are covered in the full report. Contact sales@marketmindsadvisory.com to access the complete intelligence.

Segment CAGR and Growth Architecture

The market splits across six categories spanning protocol type, fixture form factor, and control software used across commercial and institutional building portfolios. Bluetooth Mesh lighting control systems and human-centric tunable lighting are growing fastest as commercial buildings prioritize interoperability and occupant wellness over proprietary, single-vendor control architecture that locks facility teams into one manufacturer permanently.
Section default visual

Bluetooth Mesh Lighting Control Systems

Bluetooth Mesh lighting control systems use a self-healing mesh topology that eliminates the single point of failure common in star-topology wireless networks, making them the preferred choice for large commercial deployments spanning thousands of fixtures. Growth is concentrated among office and retail properties across East Asia and North America, where building owners prioritize interoperability with smartphone-based commissioning tools over proprietary vendor lock-in. Vendors compete primarily on mesh network reliability at scale, commissioning simplicity, and certification compatibility across the broader network of Bluetooth Mesh sensors and controls available today across the broader competitive product landscape spanning both established manufacturers and specialized startups entering the certified compatibility marketplace each year seeking a foothold in this fast-growing category.
CAGR 18.2%

Human-Centric Tunable Lighting Systems

Human-centric tunable lighting systems adjust color temperature and intensity throughout the day to mimic natural circadian light patterns, marketed primarily on workplace wellness and productivity benefits rather than energy savings alone. Adoption is accelerating fastest inside corporate headquarters and healthcare facilities where employers and operators actively compete for talent and patient satisfaction through differentiated building amenities. Vendors differentiate on lighting quality metrics, scheduling automation sophistication, and integration depth with existing building management systems that facility teams already operate daily across their broader commercial property portfolios spanning multiple buildings, geographic markets, and distinct corporate real estate divisions operating under a shared parent company brand standard applied consistently across regions and property types alike.
CAGR 15.1%
Full segment breakdown across 7 segments available in the complete report.

Regional Architecture and Country Demand Map

Regional adoption tracks commercial building stock age and manufacturing concentration closely across the seven markets covered here. East Asia and North America lead on absolute spend, while South Asia and Pacific posts the fastest growth as commercial construction expands rapidly across the region's largest urban commercial centers.

East Asia

China's position as the dominant global lighting manufacturing hub gives regional vendors a durable manufacturing cost advantage that supports the region's leading absolute market share worldwide. Massive commercial and residential construction volume across major Chinese cities continues generating the largest single pool of new wireless lighting installations globally. Japan's aging building stock is driving steady retrofit demand as commercial property owners modernize control systems ahead of upcoming energy efficiency mandates. South Korea's smart city initiatives are funding pilot deployments that showcase integrated lighting and sensor networks to prospective commercial buyers across major domestic development zones spanning tier-one and tier-two cities alike across the entire eastern seaboard and rapidly expanding inland provinces.
Share: 28% | CAGR: 13.6% (2026 to 2036)

North America

Large-scale commercial office retrofit activity across the United States and Canada has driven the deepest existing wireless lighting deployment base globally, supported by aggressive building energy code updates across major states. California's Title 24 code has become a de facto national benchmark that manufacturers design products to meet before regional variations are even finalized. Corporate real estate portfolios pursuing sustainability certification are adopting wireless lighting as a visible, quantifiable commitment to measurable energy reduction targets that satisfy investor reporting requirements under increasingly common ESG disclosure frameworks demanded by institutional investors, corporate tenants, municipal regulators, and sustainability rating agencies alike across most major metropolitan office markets and gateway coastal cities with the deepest sustainability commitments.
Share: 26% | CAGR: 13.9% (2026 to 2036)
Regional intelligence for 5 additional markets available in the complete report: Western Europe, South Asia and Pacific, Latin America, Middle East and Africa, Eastern Europe. Contact sales@marketmindsadvisory.com.
wireless-lighting-market-market-share-analysis-1789998961649

Turning Fixtures Into Recurring Revenue Streams

Vendors are expanding revenue beyond one-time fixture sales through analytics subscriptions, commissioning services, and managed lighting-as-a-service arrangements offered directly to commercial building owners. These layered revenue streams generate materially higher lifetime value per building account than standalone fixture sales while deepening customer retention across multi-year contracts rather than a single upfront hardware transaction of any kind.

Expand Occupancy and Space Analytics Subscription Offerings

Vendors bundling occupancy and space utilization analytics alongside core lighting control capture materially higher recurring revenue than fixture-only sales, since analytics subscriptions typically add 20 to 30% on top of base hardware pricing. Facility managers increasingly value space utilization data for real estate planning decisions independent of lighting performance itself, making analytics the fastest-growing revenue category for established lighting vendors. Companies that built analytics expertise in-house are now winning renewal decisions against competitors offering fixtures alone without data services layered on top of the underlying hardware itself, without accompanying interpretation.
Market Impact: Analytics subscriptions add 20 to 30% revenue overall

Offer New Lighting-as-a-Service Financing Arrangements Today

Vendor-provided lighting-as-a-service programs spreading fixture and control costs across multi-year service contracts increase deal conversion among building owners who previously found large upfront capital expenditure prohibitive. These financing arrangements typically increase closed deal volume by 25 to 35% among mid-size commercial properties, expanding the addressable market meaningfully. Vendors with in-house financing capability are outcompeting smaller rivals who must rely on third-party lenders and slower approval processes that discourage price-sensitive property owners from committing to a large upfront capital purchase decision in a single budget cycle without financing support from the vendor directly.
Market Impact: Financing arrangements lift deal volume 25 to 35%

Monetize Aggregated Building Performance Benchmark Data

Vendors are packaging anonymized, aggregated energy and occupancy data across their customer base into benchmark reports sold to real estate investment trusts and facility management firms, generating high-margin revenue independent of individual building subscriptions, at premium pricing roughly 15 to 20% above base platform fees. This revenue stream requires no additional hardware deployment and scales directly with existing sensor network size, making it highly attractive to vendors with the largest installed customer bases already collecting comparable building data across thousands of managed properties spanning multiple building types, regions, and ownership structures.
Market Impact: Benchmark data licensing adds 15 to 20% margin

Extend Commissioning Services Into Ongoing Tuning Contracts

Initial commissioning services are increasingly being converted into ongoing quarterly tuning contracts that keep lighting schedules calibrated against changing occupancy patterns and reduce energy waste by roughly 18% over time. This shift converts a one-time services fee into a recurring revenue stream with gross margins comparable to core hardware sales. Building owners with frequently changing tenant configurations show the highest willingness to pay for ongoing tuning, since static schedules degrade energy performance within months of initial commissioning as tenant configurations shift and occupancy patterns evolve steadily over time each year.
Market Impact: Ongoing tuning contracts cut energy waste by 18%

Who Controls the Margin Pool

The market remains moderately fragmented with a CR5 of 44%, reflecting the diversity of manufacturers spanning traditional lighting companies, building automation specialists, and dedicated wireless protocol vendors. Signify and Legrand lead through broad fixture and controls portfolios, while smaller challengers like Lutron Electronics compete on control precision rather than portfolio breadth. The gap between the top two vendors and the next tier remains moderate on commercial account count.
Current competitive activity centers on multi-protocol interoperability certification and sensor-embedded fixture development, as vendors race to prove compatibility across competing wireless standards rather than defending proprietary systems. Several vendors have announced expanded Bluetooth Mesh product lines within the past year, while others pursue acquisition of specialized sensor startups to accelerate product development timelines across their existing customer base.

Emerging pressure is coming from building automation software vendors expanding into lighting control, threatening to commoditize standalone fixture hardware as a bundled feature within broader smart building platforms. Rankings could shift meaningfully if a major technology company enters the market directly with an integrated building operating system, pressuring established lighting manufacturers to prove differentiated value beyond basic fixture supply.
wireless-lighting-market-country-cagr-analysis-1789998962212

Competitive Moat and Risk Dimensions

SIGNIFY

Moat: Global Fixture Distribution Scale

Signify's extensive global distribution network and broad fixture portfolio give it direct access to commercial accounts across nearly every major market, letting it bundle wireless control capability into existing fixture relationships that smaller specialists cannot easily replicate. This distribution advantage extends well beyond any single product category.
SIGNIFY

Risk: Legacy Portfolio Slows Innovation Pace

Signify's massive legacy fixture portfolio, built around older lighting technology generations, can slow its transition toward newer wireless protocols relative to smaller, more focused competitors unencumbered by extensive existing product lines. Building owners seeking advanced multi-protocol interoperability may evaluate specialized alternatives instead of committing to Signify's broader legacy product portfolio.
LUTRON ELECTRONICS

Moat: Control Precision and Reliability Reputation

Lutron's decades-long reputation for precise dimming control and reliable commissioning gives it privileged access to premium commercial and hospitality accounts where control quality matters more than fixture price. This reputation advantage is difficult for newer entrants to replicate without a comparable multi-decade installed base track record.
LUTRON ELECTRONICS

Risk: Premium Pricing Limits Mid-Market Reach

Lutron's premium pricing structure, calibrated for high-end commercial and residential accounts, limits its competitiveness against lower-cost specialists targeting mid-market buyers with tighter capital budgets and simpler installation requirements that do not need Lutron's full control precision or its associated premium service overhead that typically accompanies its flagship control systems.

Players Tracked

Prominent Players

Signify
Legrand
Lutron Electronics
Acuity Brands
Zumtobel Group

Other Key Players

OSRAM Continental
Eaton (Cooper Lighting)
Hubbell Lighting
GE Current
Wipro Lighting
Helvar
Casambi Technologies
Lightify (Ledvance)
Feit Electric
Fagerhult Group
Schneider Electric Buildings
Cree Lighting
Enlighted
TCP Lighting
iLumisys

Recent Developments

FEBRUARY 2026

Signify acquired a specialized sensor analytics startup to accelerate development of occupancy and space utilization capability integrated directly into its wireless fixture lineup. The acquisition adds proprietary sensor fusion technology and building analytics expertise that strengthens Signify's existing platform offering considerably across its commercial customer base.
Signal: Signals that lighting manufacturers are racing to deepen proprietary sensing technology capability quickly and decisively across product lines.
OCTOBER 2025

Lutron Electronics entered a multi-year supply agreement with a major commercial real estate investment trust to deploy its control platform across member properties as part of a shared portfolio-wide sustainability initiative. The agreement expands Lutron's addressable reach into properties that could not previously justify individual platform costs on their own.
Signal: Shows portfolio-wide purchasing models emerging as a distribution channel reaching smaller, previously underserved commercial buildings nationwide.
JUNE 2025

Acuity Brands expanded manufacturing capacity for its wireless fixture line following sustained demand growth across commercial office and retail retrofit projects in North America and East Asia. The expansion includes new regional distribution centers designed to reduce fixture delivery timelines for commercial customers substantially across mid-size regional dealer networks.
Signal: Reflects sustained enterprise demand growth pulling new capacity investment directly into wireless fixture production lines overall.

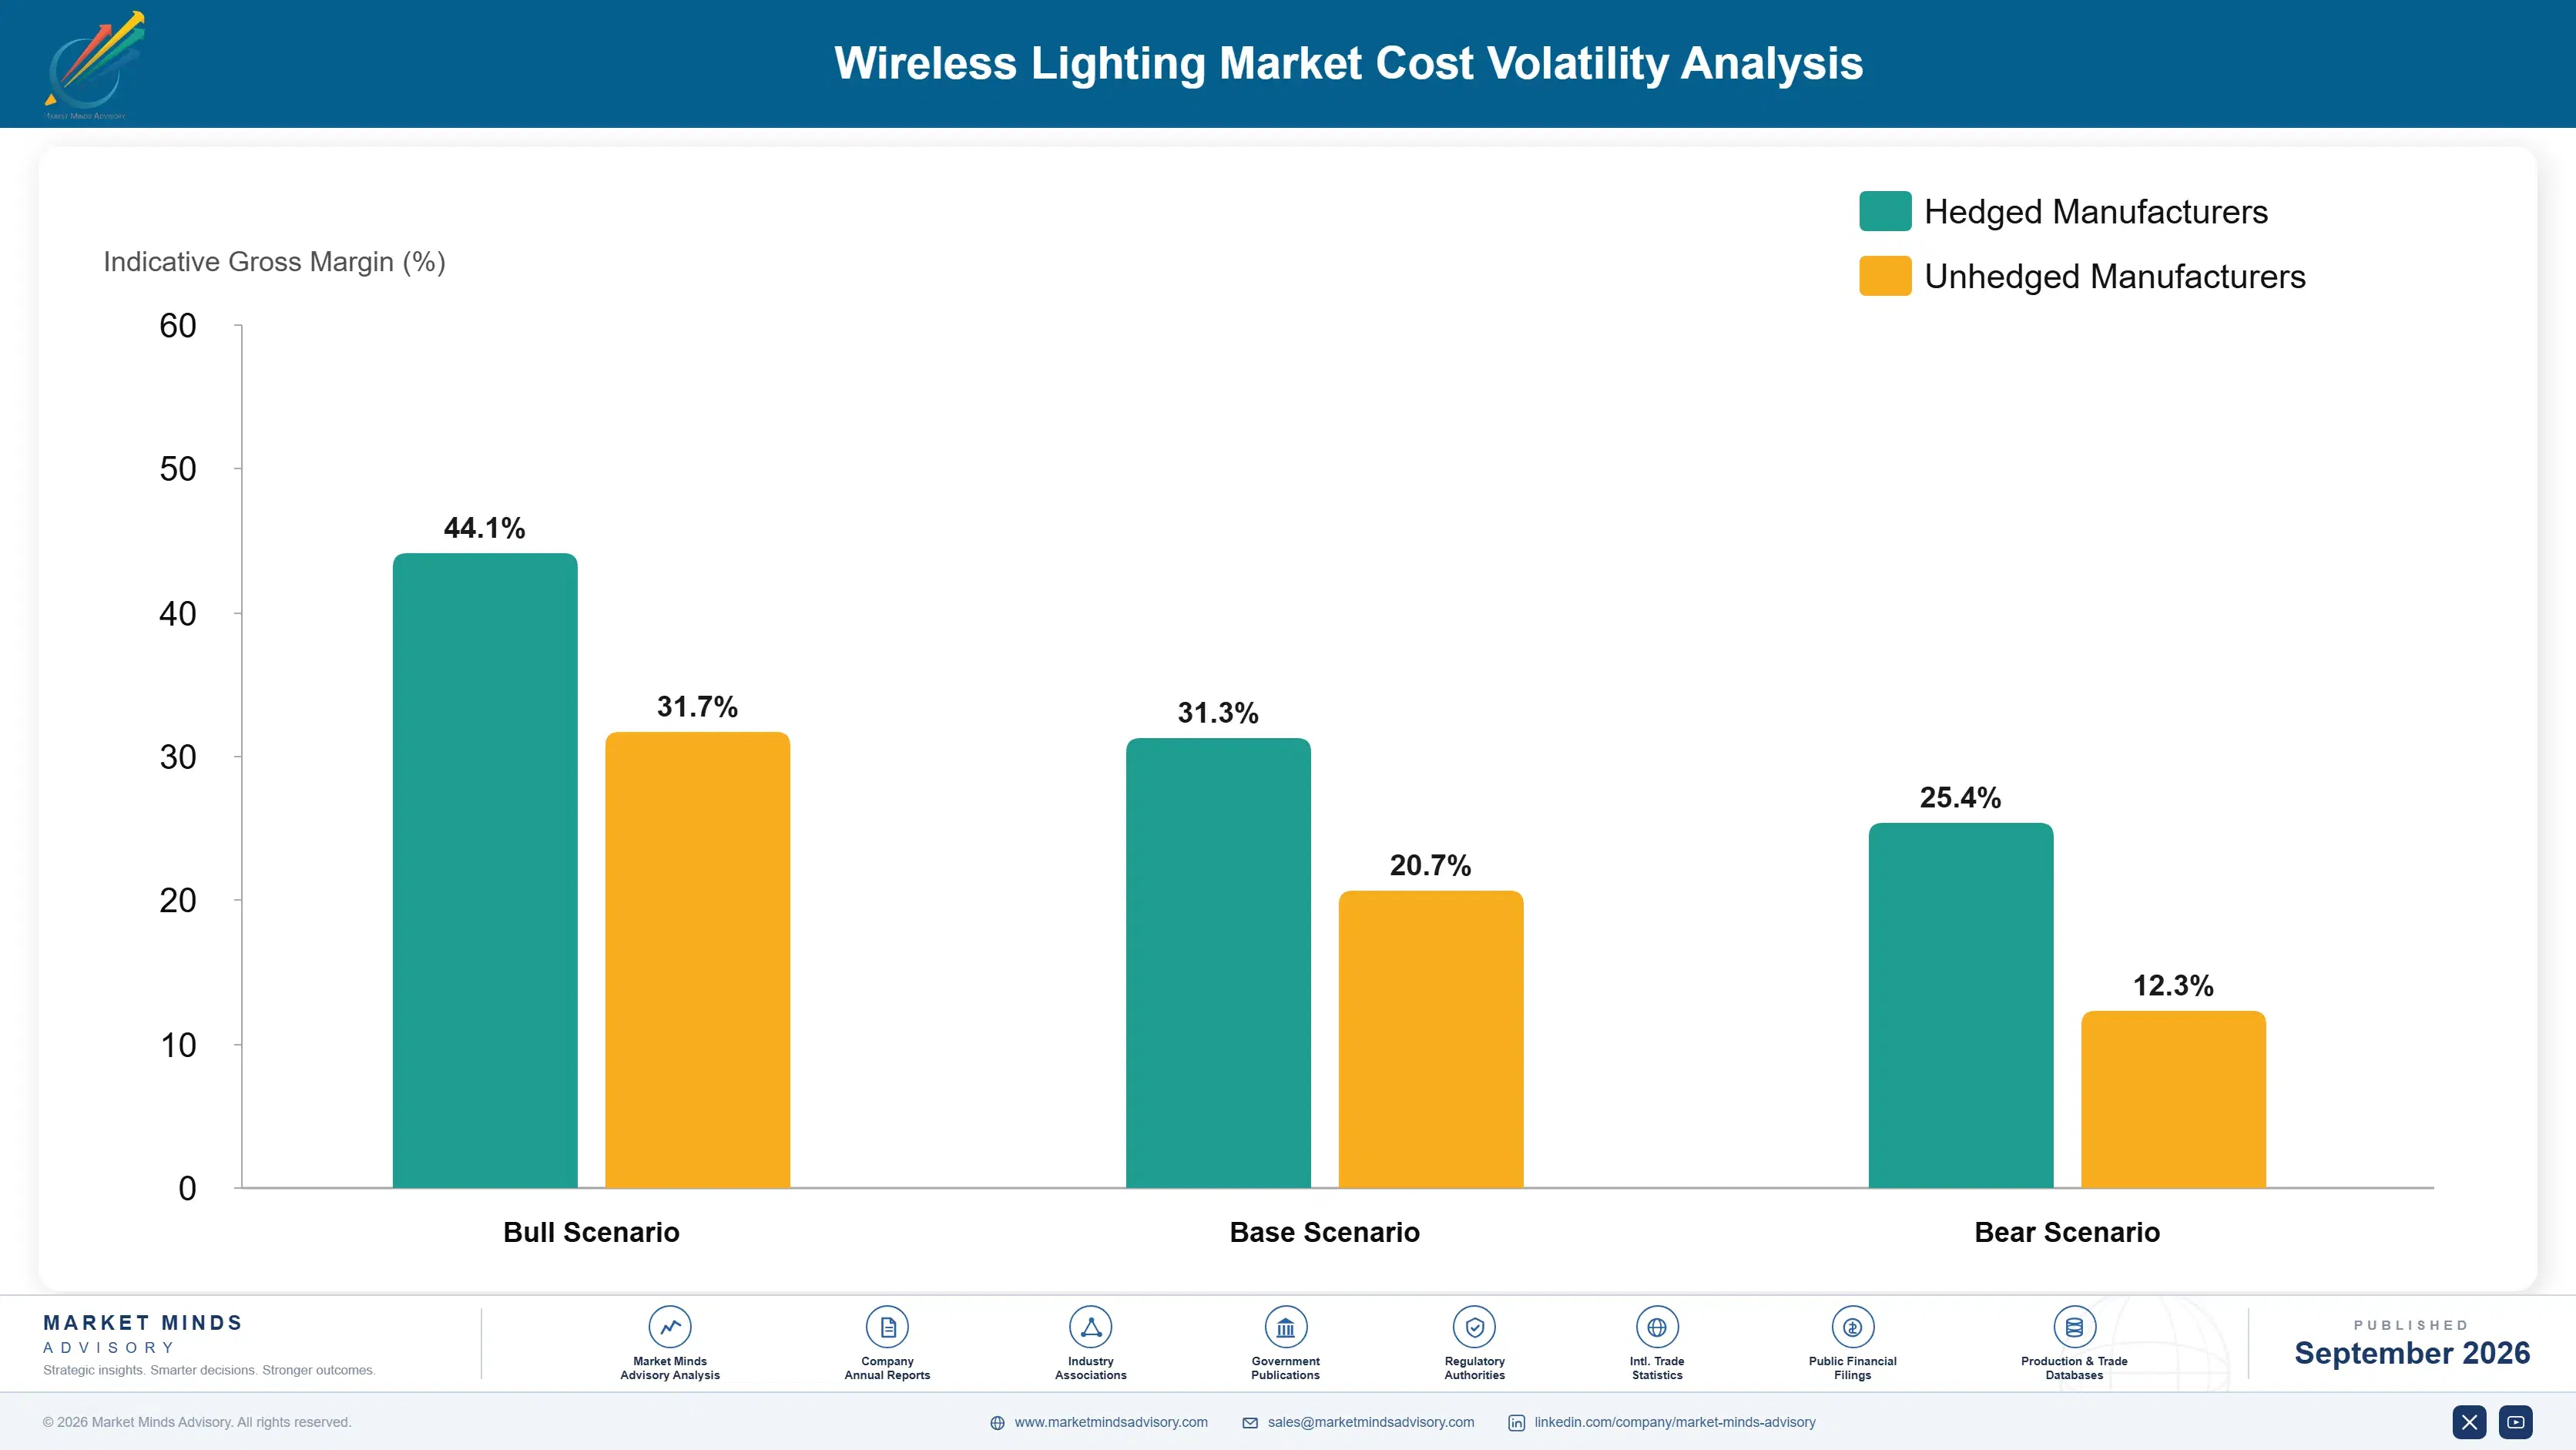
LED Component and Semiconductor Cost Exposure

LED chip and driver components represent roughly 34% of vendor cost of goods sold, sourced primarily from Asian semiconductor manufacturers concentrated in China, Taiwan, and South Korea. Wireless radio modules and control chipsets represent a further 19% of hardware cost, sourced from a smaller group of specialized IoT semiconductor suppliers spread across multiple manufacturing regions.
A 2025 semiconductor supply disruption tied to a major LED driver chip shortage, reported in company annual filings, raised component costs by an estimated 13% for vendors without long-term supply agreements in place. Smaller wireless lighting vendors lacking direct manufacturer relationships absorbed the increase directly, delaying some product shipments during the affected quarter according to disclosed vendor commentary covering the affected reporting period across multiple regional manufacturing sites.

Vendors dependent on spot-market component purchasing face greater cost exposure than those with long-term supply agreements directly with LED and chipset manufacturers, since spot-market dependency removes negotiating leverage during periods of constrained capacity. Larger vendors with dedicated procurement teams and committed volume agreements can absorb these cost shifts more easily than smaller competitors buying components through distributors without any similar long-term arrangements in place.
wireless-lighting-market-company-positioning-matrix-1789998962418

Negotiate Long-Term LED Component Supply Agreements

Larger vendors are securing multi-year supply agreements directly with LED and chipset manufacturers rather than purchasing through distributors, locking in pricing and allocation priority during periods of constrained manufacturing capacity. This approach shields margins from spot-market price volatility that smaller competitors remain exposed to fully during comparable periods of industry-wide capacity tightness that smaller rivals cannot navigate as effectively.

Diversify Component Sourcing Across Multiple Suppliers

Vendors are qualifying multiple LED and chipset suppliers for the same fixture components, reducing single-source dependency risk and improving negotiating leverage during supply disruptions, though it adds testing and qualification overhead that smaller vendors sometimes struggle to absorb given limited engineering resources available across their smaller engineering teams already stretched thin on other priorities.

Redesign Fixtures Around More Available Components

Vendors are redesigning fixture circuit boards to use more widely available LED and chipset families rather than specialized components subject to concentrated manufacturer risk, trading some performance optimization for meaningfully improved supply chain resilience during periods of industry-wide capacity constraint affecting the broader semiconductor industry and its downstream component buyers across every fixture category served.

Portfolio Architecture for Margin Defence

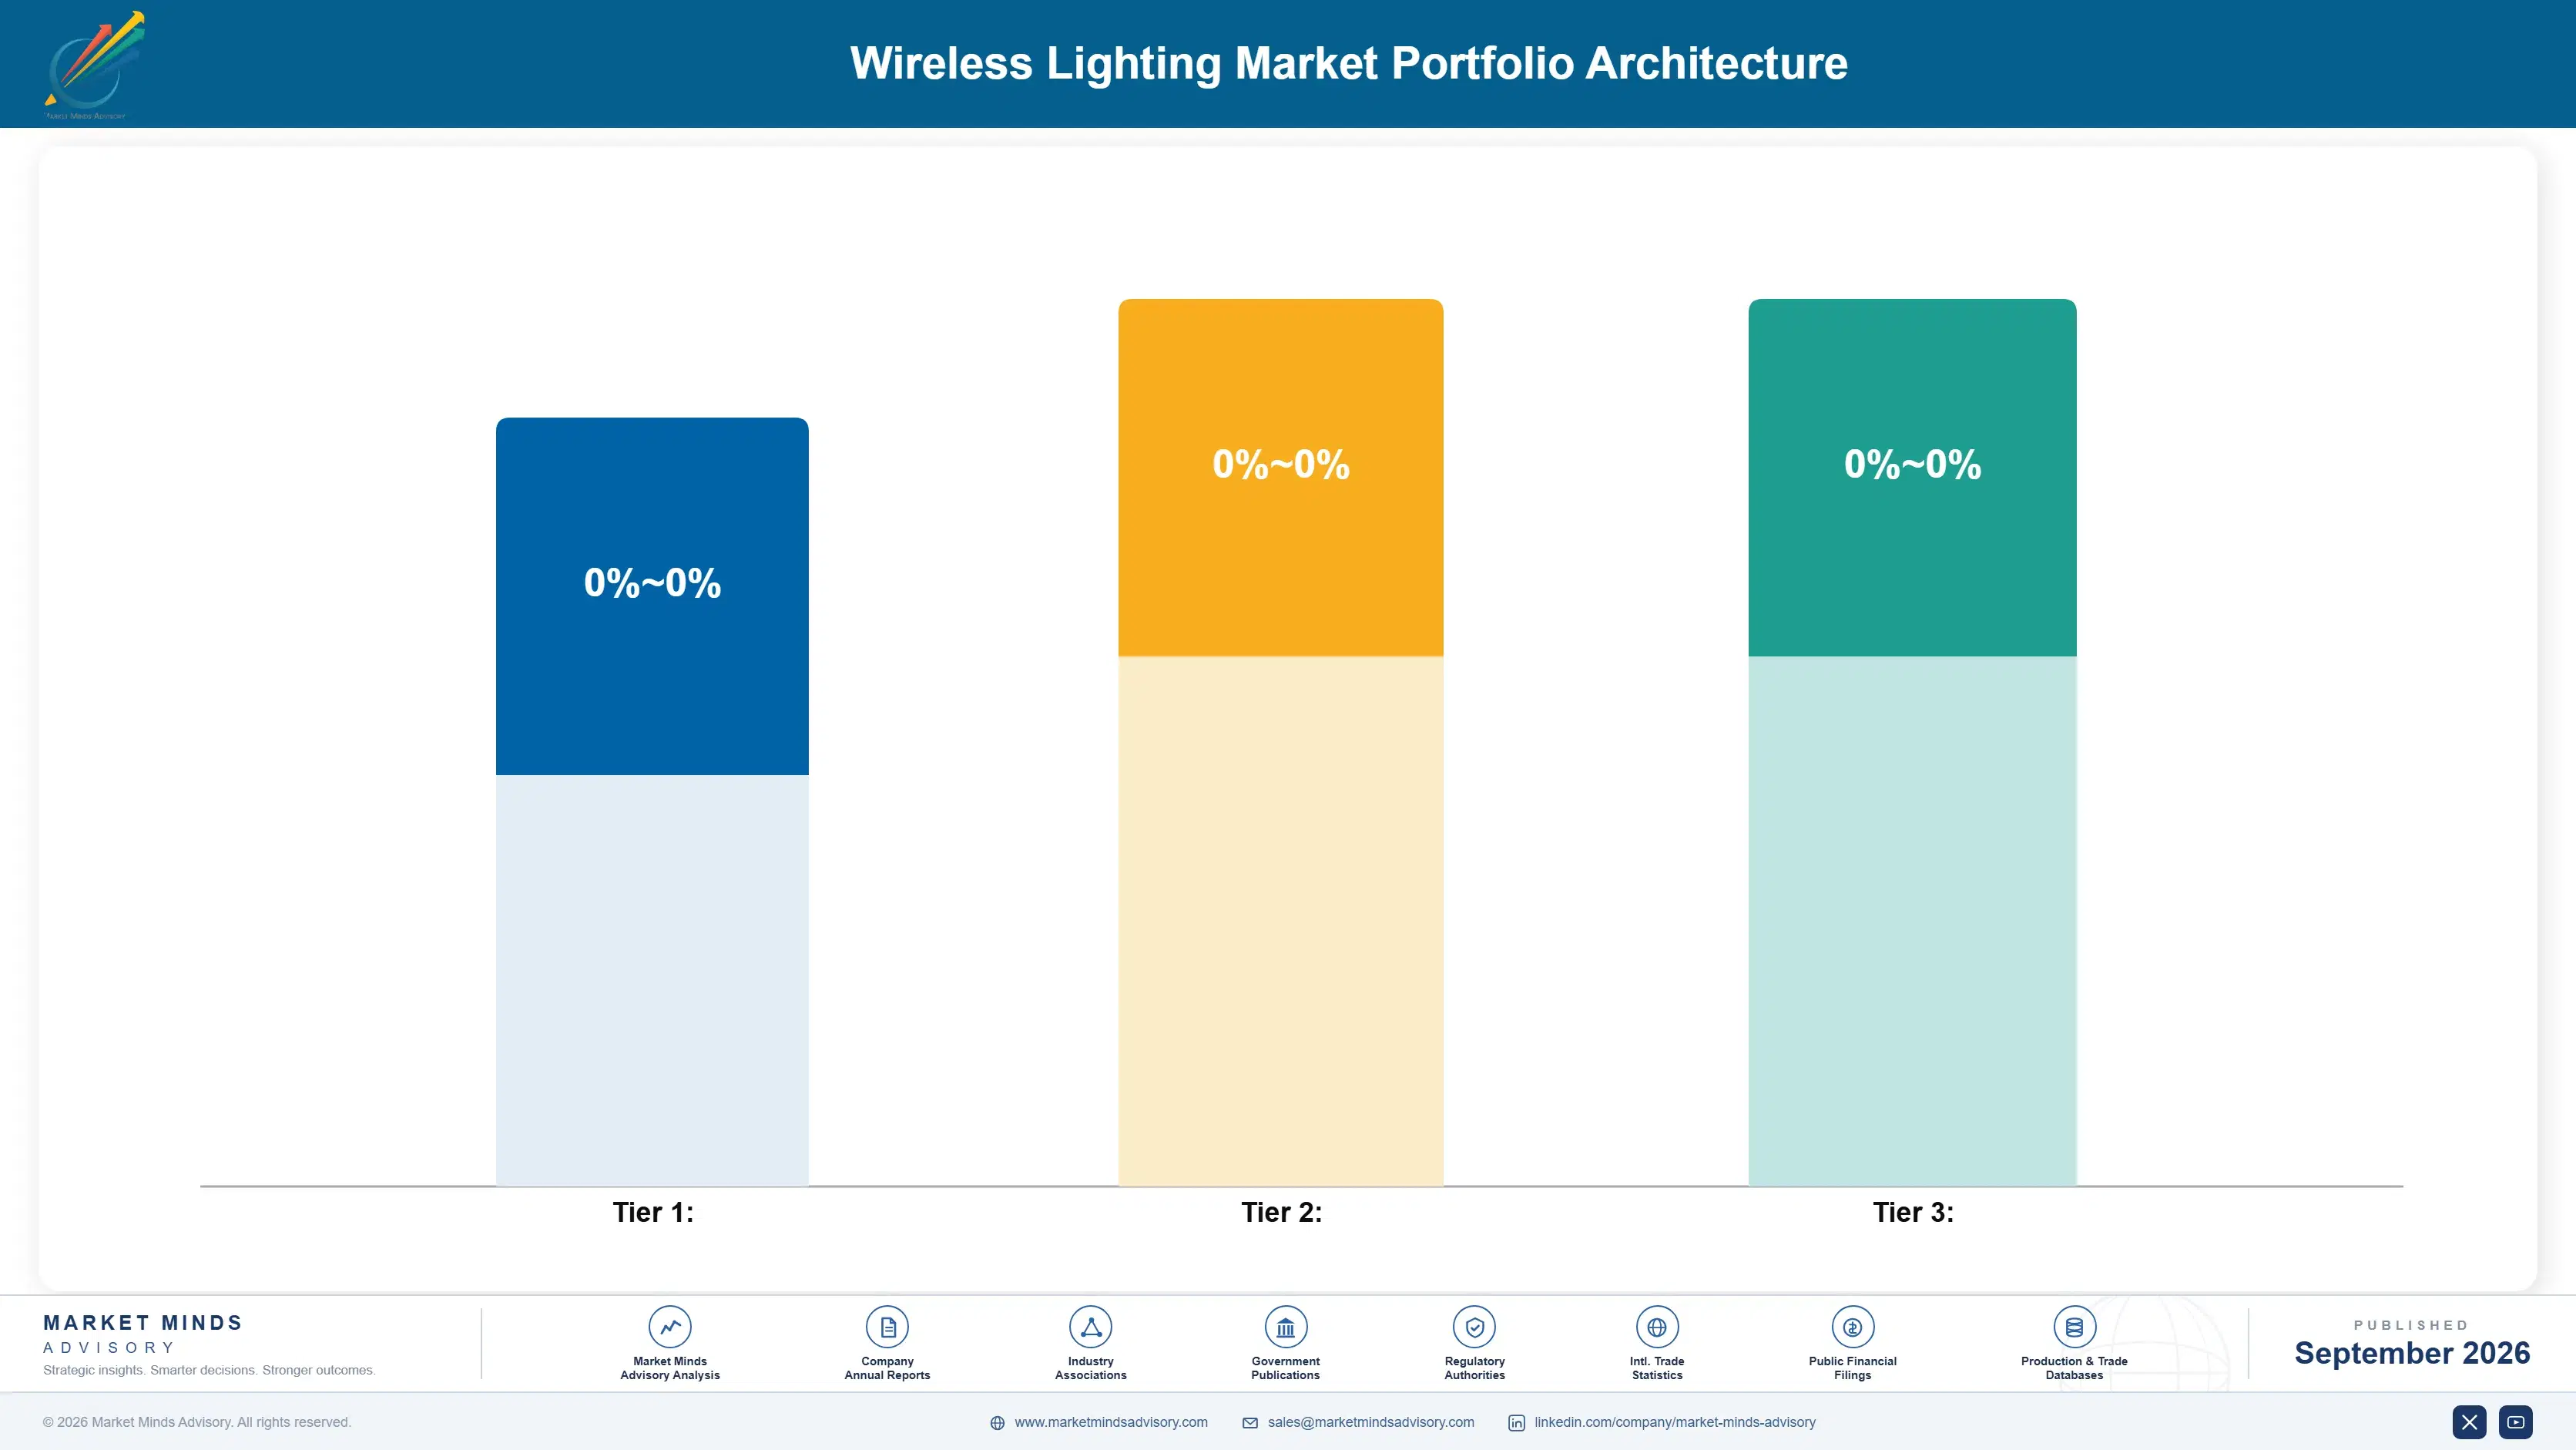
Portfolio economics split across three tiers running from basic commodity wireless fixtures to premium certified control systems and forward-looking human-centric and sustainability-certified platforms. Gross margins widen considerably moving up the tier structure, reflecting the specialized software and sensor integration effort required to build reliable, interoperable control systems that hold up reliably across diverse building environments.
Volume-tier fixtures face persistently lower long-term returns as commoditization pressure intensifies from low-cost Asian manufacturers entering the market aggressively on price alone. Premium control platforms retain pricing power because customers cannot easily replicate proprietary commissioning software and multi-protocol certification built over years of accumulated deployment experience across diverse building types and geographic regions accumulated over many years of continuous refinement.

High-value revenue pools concentrate in enterprise accounts requiring certified interoperability and analytics services layered atop core fixture hardware, where switching costs run highest and renewal rates stay strongest across the customer base. Vendors positioning purely on fixture price compete for shrinking margin in the volume tier, while those investing in certification and proprietary software development capture disproportionate value as the market matures further over the coming decade of continued adoption.

Basic wireless-enabled fixtures competing primarily on price against low-cost manufacturers, with gross margins in the 25 to 35% range across most commodity-tier vendors competing primarily on unit price alone across most markets.
Gross Margin

Multi-protocol certified control systems with proprietary commissioning software and formal interoperability certifications, carrying gross margins between 50 and 60% across the premium vendor segment specifically offering differentiated commissioning tools backed by proprietary certification programs.
Gross Margin

Human-centric and sustainability-certified platforms built for circadian lighting and automated energy compliance reporting, commanding gross margins above 60% given specialized development investment required to build and continuously maintain these specialized compliance capabilities.
Gross Margin
wireless-lighting-market-cost-volatility-analysis-1789998962920

High-value Sub-segments and Strategic Watch-out

Bluetooth Mesh Lighting Control Systems

The highest-value, fastest-growing segment as building owners prioritize interoperability over proprietary lock-in, with margins and growth rates both leading the broader market across nearly every region tracked in this report, a lead vendors expect to persist through most of the forecast window ahead across every commercial building category.

Human-Centric Tunable Lighting Systems

A high-value segment growing steadily as workplace wellness programs adopt circadian lighting, drawing dedicated vendor investment separate from established commodity fixture categories and their existing customer relationships built around lower-margin commodity hardware sales rather than differentiated wellness capability that commands materially higher pricing across most accounts.

Zigbee and Proprietary RF Lighting Controls

The volume core of the market, generating steady revenue from installed base renewals even as growth decelerates relative to newer Bluetooth Mesh and human-centric categories entering the field and capturing an increasing share of new commercial budget allocation away from legacy proprietary control product lines.

Cybersecurity-Hardened Lighting Networks

A strategic watch-out segment as security-conscious institutional buyers demand stronger network isolation, a category still underserved by most mainstream vendors despite growing demand from regulated commercial operations facing tightening data protection scrutiny and evolving network security compliance requirements across financial services, healthcare, and government facilities specifically.

Lighting Controls as a Building Annuity

Wireless lighting platforms generate durable, multi-year revenue because commissioned control systems integrate deeply with building operations and accumulated occupancy data, making replacement costly and operationally disruptive once a system is fully embedded across a commercial property. Renewal rates near 88% reflect this deep integration, since ripping out a control layer risks blind spots during any transition period.
Adoption stickiness varies by end-use vertical: healthcare and financial services buildings show the deepest platform dependence given strict operational continuity requirements, while technology company offices show comparatively higher willingness to switch vendors as newer human-centric capability becomes available in the broader market. Retail and hospitality buyers adopt more cautiously but retain platforms longer once deployed, given the operational complexity of property-wide recommissioning projects across large, multi-tenant properties.

Buyer profiles are shifting generationally as younger facility managers increasingly favor cloud-connected, app-based control platforms over the wall-panel-driven purchasing processes that defined earlier building management generations of technology adoption. Younger operators entering decision-making roles show stronger preference for interoperable, multi-vendor platforms and subscription-based pricing over the long-term proprietary contracts that previously anchored purchasing decisions across most large global commercial organizations today.
Section default visual

Where MMA Sees the Advantage

These are among the four positions where our research anticipates prominent divergence between winners and laggards over the coming forecast period. Each is grounded in the demand model, the regulatory perimeter, and the announced capacity pipeline.
01 / BLUETOOTH MESH PLATFORM INVESTMENT

Prioritize Bluetooth Mesh systems over proprietary wired control

Manufacturers and building owners should direct new lighting budget toward Bluetooth Mesh control systems rather than proprietary wired alternatives, since interoperability is becoming the primary purchasing criterion across most large commercial organizations today. The fastest-growing segment expands at 18.2% CAGR, roughly 1.44 times the overall market rate, concentrated heavily among office and retail properties in East Asia and North America. Vendors slow to make this shift risk falling behind competitors already capturing this growth across every major geography tracked in this analysis.
02 / OCCUPANCY ANALYTICS BUNDLING

Bundle occupancy analytics to capture higher recurring revenue

Vendors should expand occupancy analytics subscription tiers rather than competing purely on fixture pricing, since analytics services add 20 to 30% incremental recurring revenue while addressing facility managers' persistent need for space utilization data. Companies with in-house analytics expertise are already winning renewal decisions against fixture-only competitors. Vendors without comparable analytics capability risk losing accounts to better-resourced rivals over time as facility managers increasingly demand data services layered on top of fixture hardware alone, a preference reshaping renewal negotiations across the industry.
03 / EAST ASIAN MARKET CONCENTRATION

Concentrate expansion investment across East Asia and China specifically

East Asia holds 28% of global market share and remains the largest single region given China's dominant lighting manufacturing base and massive construction volume. Vendors should prioritize localized product development and manufacturing partnership investment there before other regions. Cost economics favor vendors able to price competitively given the region's concentration of domestic component supply chains that international competitors headquartered elsewhere struggle to match on landed cost once shipping costs and tariff exposure across international supply routes are fully factored in.
04 / RADIO INTERFERENCE RISK

Address radio frequency interference before scaling dense deployments

Dense commercial deployments with thousands of wireless nodes face radio frequency interference challenges that threaten to extend commissioning timelines and erode installer confidence if left unaddressed by vendors racing to ship new capability. The root cause is the physics limitation of radio propagation through dense building materials. Vendors investing in mesh redundancy and dedicated site surveys will outcompete rivals dependent on standard, uniform deployment templates that ignore building-specific structural characteristics and construction material variation from one project to the next.

Engagement Snapshot From the Field

A live engagement with an industry participant carrying material or product regulatory and market exposure ahead of a defining policy shift, showing how our research translates into a defensible multi-year portfolio strategy.
MARKET MINDS ADVISORY · CLIENT ENGAGEMENT SUMMARY
Wireless Lighting Producer Strategic Portfolio Review and Transition Roadmap 2026·Investment Scenario on Wireless Lighting Exposure Evaluation 2025-26
CLIENT PROFILE
The client is a multi-national real estate investment trust managing over 150 commercial office properties across a dozen countries, operating a mix of legacy wired lighting control systems installed at varying points over the past two decades. Facing tenant demand for sustainability certification and rising electricity costs across its portfolio, leadership sought an independent assessment of which wireless retrofit approach could deliver measurable energy savings across a diverse building stock.
STRATEGIC CHALLENGE
The trust's asset management teams lacked a consistent framework for evaluating wireless retrofit vendors across properties with widely varying building age, tenant mix, and existing electrical infrastructure, since prior lighting decisions had been made independently by regional property managers. Competing vendor relationships across regions created fragmented product standards and duplicated procurement negotiations across the trust's portfolio.
MMA APPROACH
MMA built a standardized vendor scoring framework evaluating retrofit complexity, multi-protocol interoperability, and total cost of ownership across a representative sample of portfolio properties spanning small, mid-size, and large buildings. The engagement combined vendor proof-of-concept testing across sample floors, tenant satisfaction interviews, and negotiated portfolio-wide pricing modeling across a five-year retrofit horizon.
KEY FINDINGS
  1. Two of five evaluated vendors demonstrated meaningfully broader multi-protocol interoperability, a critical requirement given the portfolio's diverse existing building automation and control systems.
  2. Negotiating portfolio-wide pricing across the full property set rather than individual building agreements reduced projected per-building retrofit cost by an estimated 26%.
  3. Properties adopting recommended wireless systems during pilot testing reported average energy consumption reductions of roughly 30% without any measurable tenant disruption during the trial period.
  4. Older buildings with legacy electrical infrastructure showed the strongest return on investment relative to retrofit cost, reversing the trust's initial assumption favoring newer buildings first.
CLIENT PROFILE
The client is a multi-national real estate investment trust managing over 150 commercial office properties across a dozen countries, operating a mix of legacy wired lighting control systems installed at varying points over the past two decades. Facing tenant demand for sustainability certification and rising electricity costs across its portfolio, leadership sought an independent assessment of which wireless retrofit approach could deliver measurable energy savings across a diverse building stock.
STRATEGIC CHALLENGE
The trust's asset management teams lacked a consistent framework for evaluating wireless retrofit vendors across properties with widely varying building age, tenant mix, and existing electrical infrastructure, since prior lighting decisions had been made independently by regional property managers. Competing vendor relationships across regions created fragmented product standards and duplicated procurement negotiations across the trust's portfolio.
MMA APPROACH
MMA built a standardized vendor scoring framework evaluating retrofit complexity, multi-protocol interoperability, and total cost of ownership across a representative sample of portfolio properties spanning small, mid-size, and large buildings. The engagement combined vendor proof-of-concept testing across sample floors, tenant satisfaction interviews, and negotiated portfolio-wide pricing modeling across a five-year retrofit horizon.
KEY FINDINGS
  1. Two of five evaluated vendors demonstrated meaningfully broader multi-protocol interoperability, a critical requirement given the portfolio's diverse existing building automation and control systems.
  2. Negotiating portfolio-wide pricing across the full property set rather than individual building agreements reduced projected per-building retrofit cost by an estimated 26%.
  3. Properties adopting recommended wireless systems during pilot testing reported average energy consumption reductions of roughly 30% without any measurable tenant disruption during the trial period.
  4. Older buildings with legacy electrical infrastructure showed the strongest return on investment relative to retrofit cost, reversing the trust's initial assumption favoring newer buildings first.
RECOMMENDED STRATEGY
Phase 1: Phase one negotiates a portfolio-wide pricing agreement with the two highest-interoperability vendors, structured to serve properties of every size and age. Phase 2: Phase two sequences building-level rollout starting with properties showing the strongest pilot testing results and tenant enthusiasm for adoption during the initial pilot testing phase. Phase 3: Phase three establishes a standardized vendor evaluation framework for future portfolio-wide retrofit decisions across all regional property teams going forward into future budget cycles.
OUTCOME
The trust approved a portfolio-wide pricing agreement covering its full property set with a projected first-year retrofit spend of approximately $62 million (client-reported, unverified by MMA). Tenant satisfaction surveys credited the standardized framework with resolving prior regional purchasing disputes and accelerating adoption meaningfully faster than the trust's original multi-year rollout timeline.

Frequently Asked Questions

Foundational context covering the market sizes, CAGR, scope, country, region and competition that inform every finding below. This section is provided to cover basics and most often pre-purchase conversations, answered from the MMA Primary Research Dataset.

What is the current size of the Wireless Lighting Market?

The global Wireless Lighting market reached $9.4 billion in 2025. Growth is driven primarily by commercial retrofit demand and increasingly strict building energy codes worldwide.

How large will the Wireless Lighting Market be by 2036?

The market is projected to reach $34.66 billion by 2036. This reflects sustained demand for interoperable, sensor-embedded lighting across commercial building portfolios across the entire world.

What is the CAGR for the Wireless Lighting Market 2026 to 2036?

The market is forecast to grow at a 12.6% CAGR between 2026 and 2036. This accelerates from the 11.6% historical CAGR recorded over 2020 to 2025.

Which segment is growing fastest?

Bluetooth Mesh Lighting Control Systems is the fastest-growing segment, expanding at 18.2% CAGR, roughly 1.44 times the overall market rate. Interoperability demand concentrates growth in this category.

Who are the major companies in the Wireless Lighting Market?

Signify, Legrand, Lutron Electronics, Acuity Brands, and Zumtobel Group lead the competitive landscape, together holding an estimated 44% combined share. Each competes on interoperability and control precision.

Which country is growing fastest?

China is the fastest-growing country market, expanding at 15.6% CAGR. Massive manufacturing scale and construction volume are driving accelerated wireless lighting adoption across the broader country nationwide.

Report Segmentation Architecture

The full report scope spans multiple orthogonal segmentation dimensions, with cross-tabulated demand data provided for each dimension pair. Coverage extends further to regional breakdowns, trend trajectories, and the competitive detail needed to support segment-level decision-making.

By Protocol Type (Bluetooth Mesh, Zigbee, Proprietary RF)

    By End-Use Building Type (Office, Retail, Hospitality, Healthcare)

      By Commercial Dimension (New Construction, Retrofit, Managed Service)

        By Region

        • East Asia
        • North America
        • Western Europe
        • South Asia and Pacific
        • Latin America
        • Middle East and Africa
        • Eastern Europe

        Scope, Methodology, and Coverage

        Every figure in this report is reproducible from documented input assumptions. The scope below maps the historical period, the forecast horizon, the segmentation dimensions, and the countries covered, alongside the underlying primary and qualitative methodology.
        Historical Period
        2020 to 2025
        Forecast Period
        2026 to 2036
        Base Year
        2025 (USD billions; MMA Primary Research Dataset, September 2026)
        Market Definition
        This report defines the Wireless Lighting Market as lighting fixtures, sensors, and control systems using wireless communication protocols to manage illumination without hardwired control circuits, including Bluetooth Mesh, Zigbee, and proprietary RF-based systems. It excludes hardwired DALI and 0-10V lighting controls, standalone LED fixtures without connected control capability, and general building management software unrelated to lighting.
        Quantitative Units
        USD billions, market share percentages, CAGR percentages
        Segmentation Dimensions
        Protocol type, end-use building type, commercial dimension, region
        Regions Covered
        East Asia, North America, Western Europe, South Asia and Pacific, Latin America, Middle East and Africa, Eastern Europe
        Countries Covered
        United States, China, Germany, Japan, India, United Kingdom, Brazil, United Arab Emirates, and 22 additional markets
        Key Companies Profiled
        Signify, Legrand, Lutron Electronics, Acuity Brands, Zumtobel Group, and 15 additional participants
        Quantitative Methodology
        Primary survey, n=3,800 respondents, Q4 2025, six countries; demand-side model with trade association cross-validation
        Qualitative Methodology
        47 expert interviews, Q4 2025; applied to validate demand model assumptions, identify emerging dynamics, and assess competitive positioning
        Report Format
        PDF and XLSX data workbook (Word format preview document)
        Publisher
        Market Minds Advisory
        Report Code
        MMA-2026-CON-233
        Published
        September 2026
        Contact
        sales@marketmindsadvisory.com | www.marketmindsadvisory.com

        Purchase the full Wireless Lighting Market Report (2026 to 2036).

        This report examines the global wireless lighting market across Bluetooth Mesh, Zigbee, and human-centric categories through the year 2036, covering both established commercial buyers and emerging mid-market segments. It quantifies demand shifts driven by building energy codes and interoperability standards. Profiles of five leading vendors sit alongside fifteen additional participants, assessed on a common concentration and capability basis across the competitive landscape. Regional adoption patterns are detailed across all seven geographies in the underlying dataset. Coverage also includes forecast scenarios, cost exposure, and portfolio margin economics across three equipment tiers.
        Ten-year demand forecast by protocol category
        Vendor interoperability and pricing benchmarking analysis
        Regional adoption pattern analysis across seven geographies
        Semiconductor cost exposure and mitigation pathway assessment
        Portfolio margin economics across three product tiers
        Competitive positioning and moat durability assessment

        Built For The People Who Decide

        From boardroom strategy to bench-side execution, this report is read cover-to-cover by leaders shaping the next decade of their industry, turning demand scenarios, market dynamics and valuation benchmarks into decisions.
        CXOs/ Presidents/ VPs/ Managers
        M&A and Corporate Development
        Strategy Teams and R&D Heads
        Procurement and Product Directors
        Regulatory and Compliance Leaders
        Investor Relations and Equity Analysts