Market Minds Advisory
Wired Interface Market

Wired Interface Market: Wired Interface Market: Standards Body Politics, IP Licensing Economics and Connectors Nobody Can Replace 2026 to 2036

Interface standards get decided in committees several years before anybody sells a chip, and the companies sitting inside those rooms write specifications that their own silicon already happens to meet.

Lead Analyst

Published

September 2026

Make Smarter Decisions with Customized Research Insights

Request a free sample report and evaluate market opportunities, growth trends, and competitive dynamics relevant to your business needs.

2025 MARKET VALUE$9.4BMarket Size 2025
2036 FORECAST VALUE$29.2BBase Case , 2026 to 2036
CAGR 2026 TO 203610.9 %Bull 12.2% / Bear 9.7%
INCREMENTAL OPPORTUNITY$18.8BNet 10- year value creation
EXPANSION MULTIPLE2.81x2036 value over 2026 base
Strategic Levers
M&A Pipeline
Regional Outlook
Country Rankings
Competitive Intelligence
Segmental Deep-dive
Call-Us : 91 93563 13602

Executive Snapshot and Market Trajectory.

Interface standards get decided in committees years before anybody sells a chip, and the companies sitting in those rooms write specifications their own silicon already meets. That is the competition in this market, not the silicon itself. Specifications lead volume silicon by roughly four years.
The market reaches USD 10.4 billion in 2026 and USD 29.2 billion by 2036, a 2.81 times expansion at 10.9% annually. High speed serial interfaces for accelerator interconnect grow at 16.4%, half again the market rate of 10.9%, because moving data between processors now costs more time than computing on it. East Asia holds 38% of consumption on device manufacturing concentration. Committee position rather than silicon decides this.
Five participants hold 67% of interface revenue, high for a component category, because standards participation rather than manufacturing capability determines who supplies anything. Broadcom, Synopsys, Cadence Design Systems, Texas Instruments and Amphenol lead. Committee position years ahead of a specification decides most competitive outcomes here. Around 46% of implementations now arrive as licensed intellectual property integrated into custom silicon rather than bought as discrete devices, which changes the economics of this business entirely.
Market Definition
This report covers wired interface products: the silicon, intellectual property and physical components implementing wired data connections between and within electronic systems. It spans high speed serial interfaces for accelerator interconnect, interface intellectual property licensed for integration into custom silicon, standalone interface and bridge controllers, connectors and cable assemblies implementing interface standards, retimers and signal conditioning devices, and compliance test and validation equipment. It excludes wireless interfaces, optical transceivers sold as complete modules, network switching silicon, printed circuit board fabrication, and complete cable infrastructure installation.
Base Year Value
$9.4B in 2025 (MMA Primary Research Dataset, September 2026)
Forecast Period
2026 to 2036, eleven discrete annual values
CAGR
10.9% base case. Bull 12.2%. Bear 9.7%.
Fastest Growth Segment
High Speed Serial Interfaces For Accelerator Interconnect: 16.4% CAGR
Fastest Growth Country
India: 17.9% CAGR
Fastest Growth Region
South Asia and Pacific: 13.1% CAGR
Largest Region
East Asia: 38% of 2025 global value
Market Leaders
Broadcom, Synopsys, Cadence Design Systems, Texas Instruments and Amphenol lead on wired interface silicon, intellectual property and component revenue. Source: MMA Analysis.
Primary Survey
n=3,800 procurement and R&D decision-makers, Q4 2025, six countries
Methodology
Demand-side build-up, cross-validated against public data, 47 expert interviews

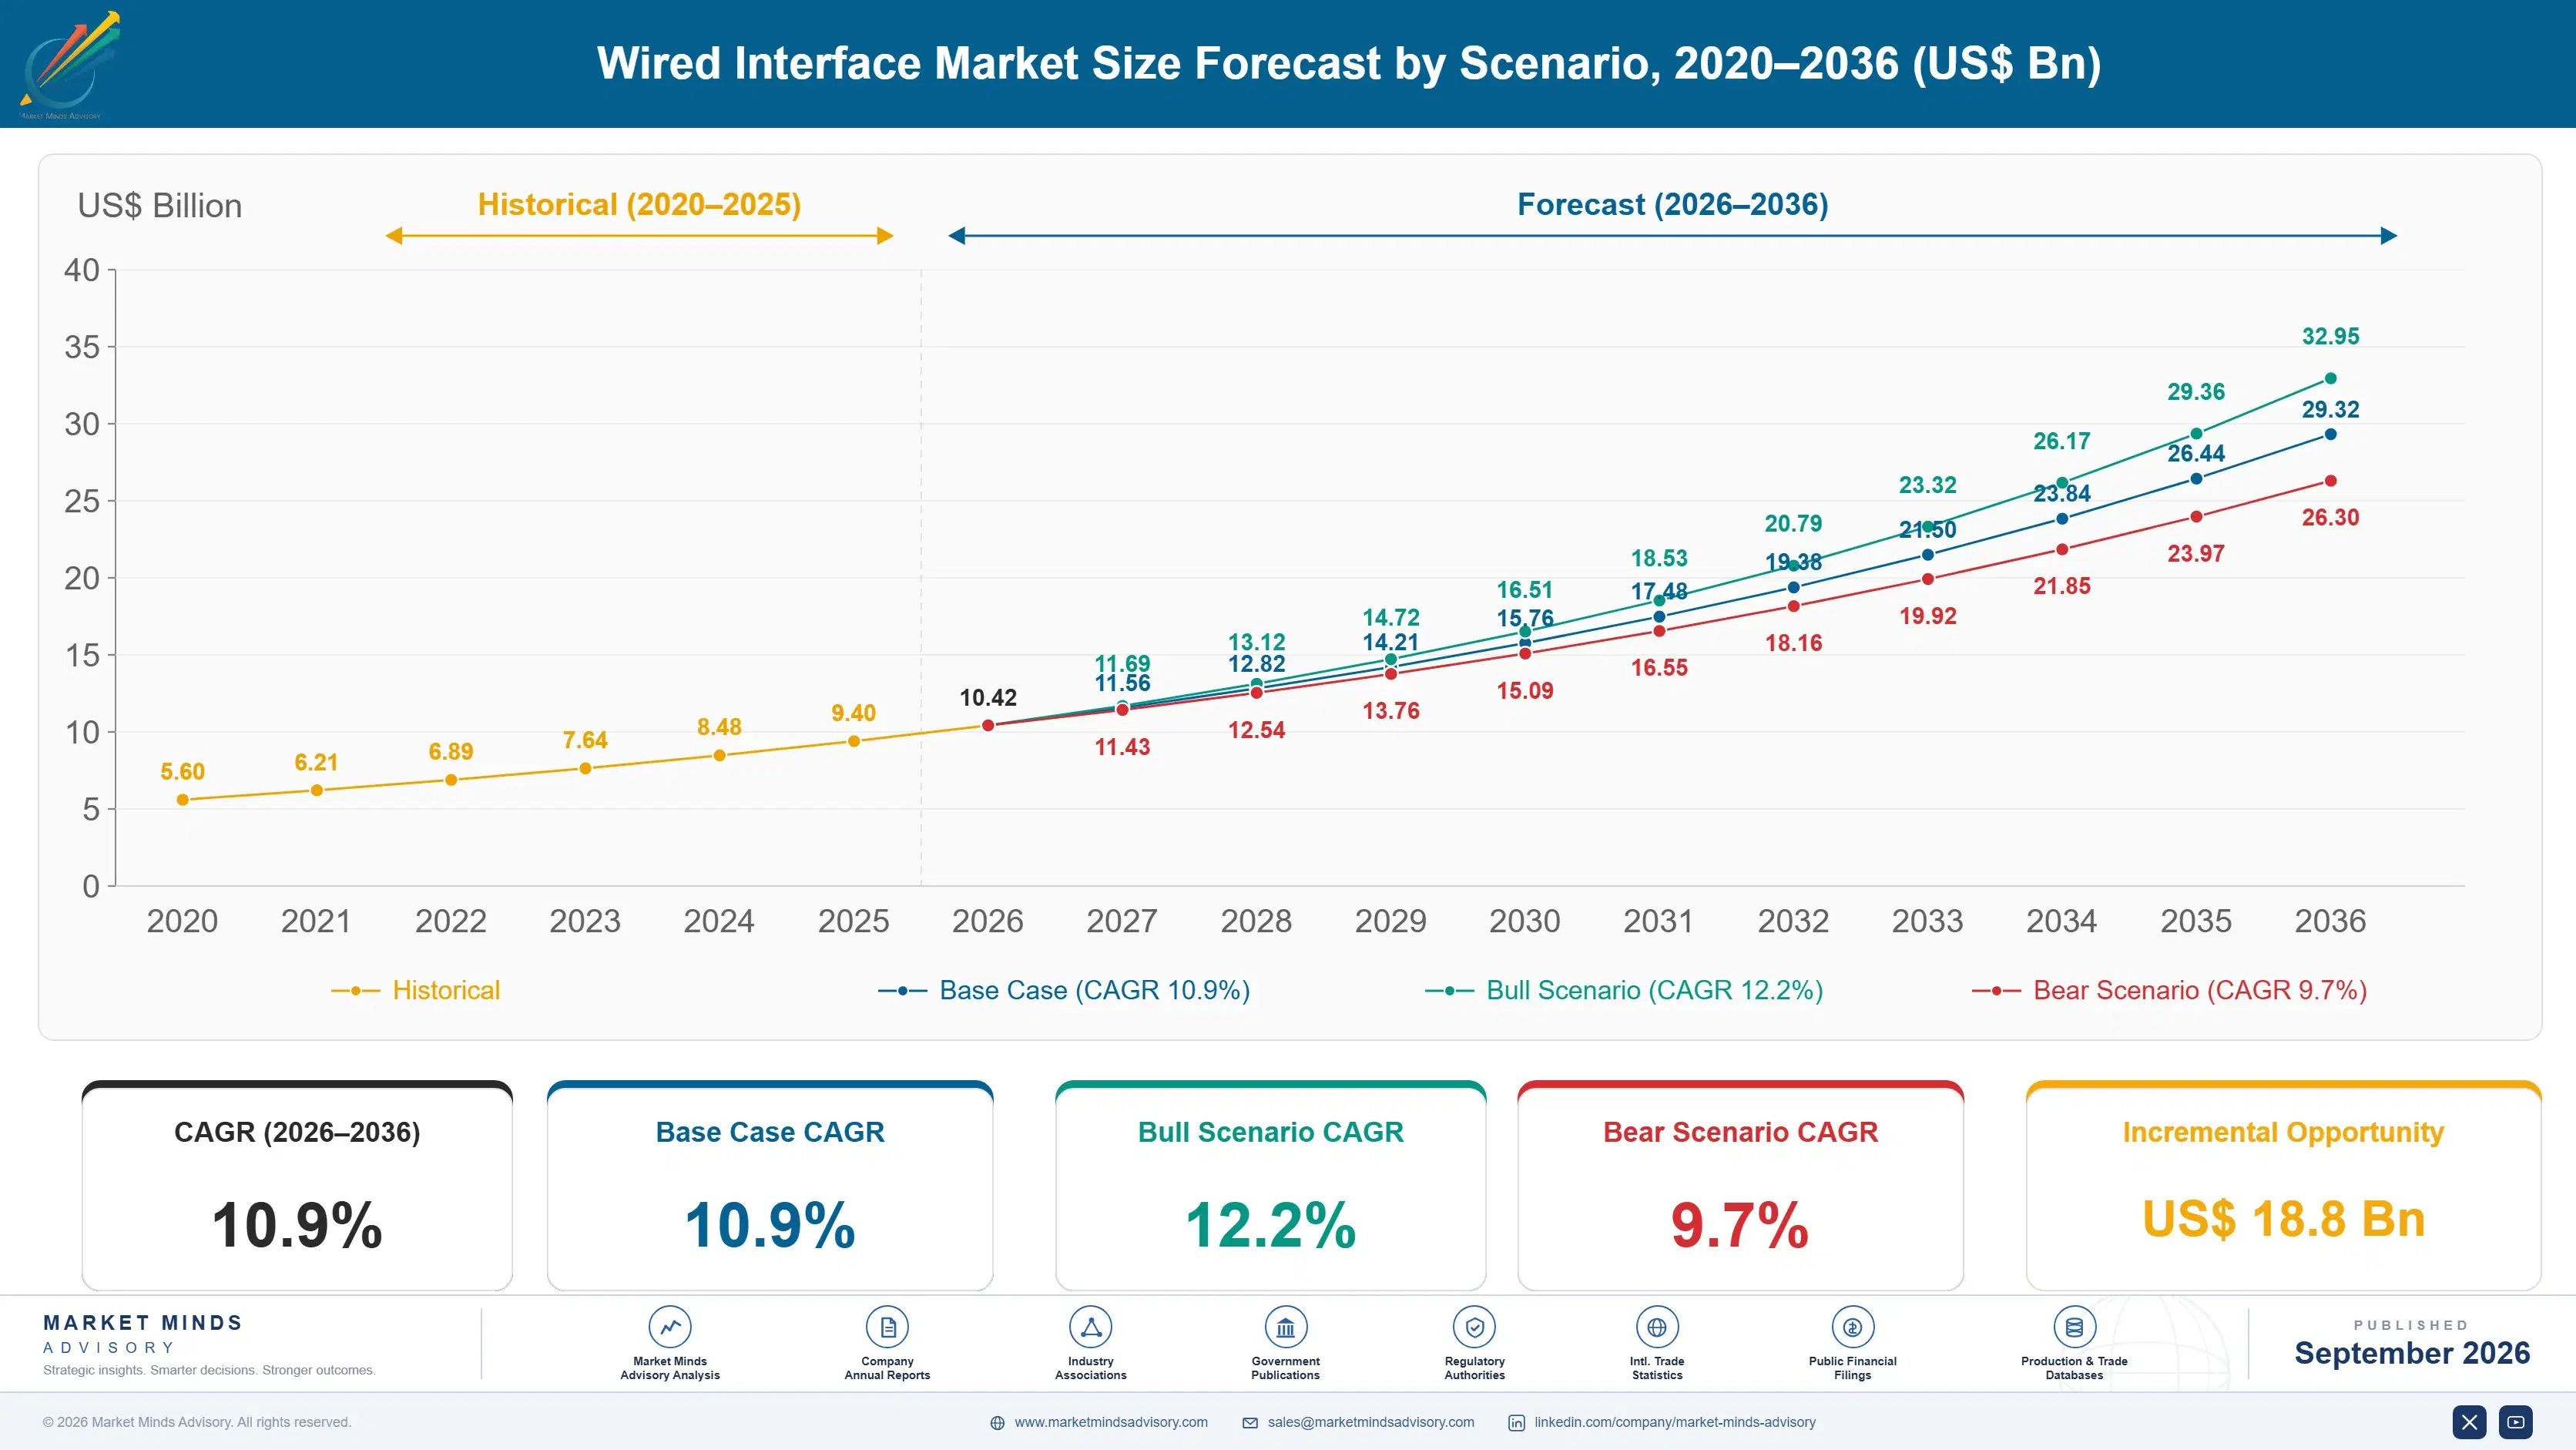
Wired Interface Market Forecast Scenarios

wired-interface-market-size-forecast-scenario-1790002951205
Between 2020 and 2025 the category compounded at 9.6%, and the interesting change was where the money moved. Interface implementation shifted from discrete controllers toward licensed intellectual property integrated into custom silicon, because system designers building their own chips needed the interface without wanting to design it. Component volume kept growing while the value increasingly sat in the licence rather than in the part.
The base case holds 10.9% on three mechanisms. Accelerator interconnect keeps demanding higher serial rates because moving data between processors now costs more time than computing on it. Custom silicon programmes keep licensing interface intellectual property rather than designing it, which converts a component sale into a royalty stream. And specification generations keep arriving faster than the previous ones fully deployed, which compresses the return period on every design. Those mechanisms run independently.
The bull case at 12.2% assumes accelerator cluster scale keeps rising, since interconnect requirements scale faster than compute in these architectures. The bear case at 9.7% is specification consolidation, where the industry settles on fewer competing standards and the licensing revenue currently spread across parallel specifications concentrates into far fewer hands than participate today. Licensing revenue would concentrate rather than disappear.

Committees Decide Before Silicon

The commercial contest happens four years before anybody buys anything. Standards committees agree specifications roughly four years ahead of volume silicon, and the participants writing those specifications describe capabilities their own designs already demonstrate. A company outside the room implements what somebody else decided, late, and competes on price. That is why five participants hold 67% of a category whose underlying engineering is documented publicly.
TOP FIVE CONCENTRATION67%High, reflecting standards participation rather than manufacturing capability
SPECIFICATION LEAD TIME4 yearsFrom standards committee agreement to volume shipping silicon
LICENSED IP SHARE46%Interface implementations licensed rather than bought as discrete devices
GENERATION OVERLAP3Interface generations shipping simultaneously across active product designs
COMPLIANCE TEST COSTUSD 340,000Typical validation programme cost per interface implementation before shipping
ACCELERATOR INTERCONNECT SHARE31%Interface revenue attributable to processor interconnect rather than peripheral connection
The money moved from parts into licences. Around 46% of interface implementations are now licensed intellectual property integrated into custom silicon rather than bought as discrete devices, because system designers building their own chips need the interface without wanting to design it. That converts a component sale into a royalty stream with entirely different economics, and it explains why design tool companies appear among the leaders in a components market.
Interconnect displaced peripheral connection as the growth driver. Around 31% of interface revenue now comes from processor interconnect rather than from connecting peripherals, because moving data between accelerators costs more time than computing on it in modern architectures. High speed serial interfaces for accelerator interconnect grow at 16.4% against 10.9% for the market, and requirements scale faster than compute does.
"People think this is a silicon business. It is a committee business with a silicon output. I have watched a specification get written around one company's existing implementation and then watched everybody else spend three years catching up to a document that was never neutral."
Director, Semiconductor Interfaces and Connectivity Practice · MMA Technology Practice · September 2026

Market Trends

Standards Participation Decides Supply Before Silicon Exists

Standards committees agree interface specifications roughly four years ahead of volume shipping silicon, and participants writing those documents describe capabilities their own designs already demonstrate. A company outside the room implements somebody else's decision late and competes on price rather than on position. Five participants hold 67% of a category whose engineering is publicly documented, which tells you where the actual barrier sits and why it is difficult for anybody to cross. The position also compounds, since shipping silicon first at one generation strengthens the case a company makes when the next specification round opens four years later.
Market Impact: Interconnect drives 31% of revenue

Licensed Intellectual Property Displaced Discrete Devices

Around 46% of interface implementations are now licensed intellectual property integrated into custom silicon rather than bought as discrete controllers, because system designers building their own chips need the interface without wanting to design it themselves. That converts a component sale into a royalty stream with entirely different margin economics and renewal behaviour. It also explains why design tool companies appear among the leaders in what everybody still describes as a components market. Royalty relationships renew across chip generations where component supply gets re-tendered on every single product cycle. Margins differ entirely.
Market Impact: India compounds at 17.9% yearly

Market Opportunities and Growth Drivers

Accelerator Interconnect Overtook Peripheral Connection Demand

Around 31% of interface revenue now comes from processor interconnect rather than from connecting peripherals, because moving data between accelerators costs more time than computing on it across modern cluster architectures. Interconnect requirements scale faster than compute does, which makes this the one interface application where demand grows with cluster size rather than with unit shipments. High speed serial interfaces for accelerator interconnect grow at 16.4% against 10.9% for the market. Suppliers forecasting from unit volumes are modelling entirely the wrong variable for this segment. Cluster growth drives it. Shipments matter less.
Market Impact: Validation costs USD 340,000

Custom Silicon Programmes Expand Licensing Opportunity

India compounds at 17.9%, ahead of every other market, as design centres building custom silicon for system companies expand faster than anywhere else, and every one of those programmes licenses interface intellectual property rather than designing it. Licensed implementations already account for 46% of the total. Those relationships also renew across successive chip generations, which makes them considerably more durable than any component supply arrangement in this category. Licensed cores also carry pre-validated compliance, which removes a validation programme costing around USD 340,000 that the customer would otherwise fund alone.
Market Impact: Some 3 generations ship together

Market Restraints and Challenges

Compliance Validation Costs Deter Smaller Implementers

A validation programme costs around USD 340,000 per interface implementation before anything ships, and that expense falls equally on a small design and a large one. The root cause is that interoperability testing requires equipment, laboratory time and specification expertise regardless of volume. Commercially this excludes smaller participants from newer generations. Mitigation runs through licensed intellectual property carrying pre-validated compliance, through shared test facilities, and through phased validation across generations. Licensing is what makes newer generations reachable for anybody without the scale to fund validation independently. Scale decides who bothers.
Market Impact: Specifications lead silicon 4 years

Generation Overlap Fragments Engineering And Inventory

Three interface generations ship simultaneously across active designs, because specifications arrive faster than previous ones fully deploy and systems have long lives. The root cause is that specification cadence is set by committee ambition rather than by deployment reality. Commercially this fragments engineering effort and inventory across parallel products. Mitigation runs through backward compatible implementations, through licensed cores supporting multiple generations, and through disciplined product range consolidation at each transition. Licensed cores supporting several generations from one integration are the cleanest answer available to a customer facing this. Ranges fragment otherwise.
Market Impact: Licensing covers 46% of implementations
3 additional market trends, 4 additional growth drivers, and 2 additional restraints and challenges are covered in the full report. Contact sales@marketmindsadvisory.com to access the complete intelligence.

Segment CAGR and Growth Architecture

Segmentation follows product form and revenue model, since each carries quite different margin economics, standards dependency and customer relationship behaviour. Six classes cover the market: high speed serial interfaces for accelerator interconnect, interface intellectual property licensing, retimers and signal conditioning devices, standalone interface and bridge controllers, connectors and cable assemblies, and compliance test and validation equipment.
wired-interface-market-market-share-analysis-1790002952306

High Speed Serial Interfaces For Accelerator Interconnect

High speed serial interfaces for accelerator interconnect grow at 16.4%, half again the market rate of 10.9%, because moving data between processors now costs more time than computing on it across modern cluster architectures. Around 31% of interface revenue already comes from interconnect rather than peripheral connection. Requirements here scale with cluster size rather than with unit shipments, which is a fundamentally different demand mechanism from the rest of this market and one that compounds as clusters grow rather than as devices sell. Physical layer analog engineering is the constraint on who can enter it. Compute growth alone does not describe this segment, and suppliers modelling from device shipments consistently underestimate what cluster expansion produces.
CAGR 16.4%

Interface Intellectual Property Licensing

Interface intellectual property licensing compounds at 14.1% because around 46% of implementations are now licensed into custom silicon rather than bought as discrete devices, and system companies designing their own chips need the interface without wanting to build it. Royalty economics differ entirely from component margins and the relationships renew across successive chip generations. Licensed cores also carry pre-validated compliance, which removes a validation programme costing around USD 340,000 that a smaller implementer would otherwise have to fund alone. That validation saving converts programmes which would otherwise have licensed from somebody else entirely, and it matters more to smaller implementers than any technical difference does. Breadth across generations decides. Breadth wins.
CAGR 14.1%
Full segment breakdown across 6 segments available in the complete report.

Regional Architecture and Country Demand Map

East Asia holds 38% of consumption, far above the usual band, because device manufacturing, system assembly and semiconductor packaging all concentrate there and interfaces are consumed where products are built. North America follows at 27% on design and licensing. India compounds fastest at 17.9% on custom silicon design growth.

East Asia

East Asia takes 38% of interface consumption, far above the 30% band ceiling, because device manufacturing, system assembly and semiconductor packaging all concentrate here and interfaces are consumed where products are physically built rather than where they are designed. Taiwanese and South Korean manufacturers integrate interface silicon and licensed cores at volumes no other region approaches. Standards participation by regional companies has grown considerably but still trails their manufacturing weight. Growth at 11.9% runs above the global rate on manufacturing volume. Regional participation in standards bodies is growing but still lags the manufacturing weight considerably. Interfaces are consumed where products are physically built rather than where the specifications defining them were originally agreed.
Share: 38% | CAGR: 11.9% (2026 to 2036)

North America

North America accounts for 27% of consumption value, where standards participation, interface intellectual property development and accelerator architecture decisions all concentrate regardless of where the silicon is eventually manufactured. Broadcom, Synopsys, Cadence Design Systems and Texas Instruments all operate from here, and committee positions established in this region shape specifications the whole industry implements. Growth at 11.4% sits above the global rate on accelerator interconnect and licensing rather than on any manufacturing activity. Committee positions established here shape specifications the whole industry implements four years later, which is a form of influence that consumption figures do not capture at all. Manufacturing happens elsewhere entirely. Influence considerably exceeds consumption. Design decisions travel outward.
Share: 27% | CAGR: 11.4% (2026 to 2036)
Regional intelligence for 5 additional markets available in the complete report: Western Europe, South Asia and Pacific, Latin America, Middle East and Africa, Eastern Europe. Contact sales@marketmindsadvisory.com.
wired-interface-market-country-cagr-analysis-1790002953367

Where Interface Position Is Won

Committee participation decides supply years before silicon ships, licensing displaced components as the revenue model, and validation cost excludes anybody without scale. The four levers below follow those conditions rather than any argument about signal integrity, which is documented publicly and understood by everybody. Position beats implementation here. Signal integrity is documented publicly and understood by everybody involved.

Sit In The Committee Four Years Early

Standards committees agree specifications roughly 4 years ahead of volume silicon, and participants write documents describing capabilities their own designs already demonstrate. A company outside the room implements somebody else's decision late and competes on price with nothing else to offer. Committee participation costs engineering time over years and it is the only route to a position that engineering quality alone has never once produced in this market. Shipping first at one generation strengthens the case at the next. Engineering quality alone never produced it. Years of engineering time buy it.
Market Impact: Specifications now lead silicon a full 4 years

Convert Component Sales Into Licensed Royalties

Around 46% of implementations are now licensed intellectual property integrated into custom silicon rather than bought as discrete devices, and that converts a component sale into a royalty stream renewing across chip generations. System companies designing their own silicon need the interface without wanting to build it. Suppliers holding only discrete devices are selling into the shrinking half of this market on considerably worse margin economics than licensors enjoy. Royalties renew where component supply is re-tendered. Device-only suppliers face worse economics on the same development. The shrinking half is the wrong half.
Market Impact: Licensing now covers a full 46% of implementations

Bundle Pre-Validated Compliance With The Core

A validation programme costs around USD 340,000 per implementation before anything ships, and that expense falls equally on a small design and a large one regardless of eventual volume. Licensed cores carrying pre-validated compliance remove it entirely for the customer. That is worth more to a smaller implementer than any technical advantage, and it is the argument that converts custom silicon programmes which would otherwise have licensed from somebody else. Smaller implementers weigh it above performance. Programmes convert on that alone. Volume does not reduce that cost at all. Scale offers no relief.
Market Impact: Validation now costs USD 340,000 for each design

Follow Cluster Scale Rather Than Unit Shipments

Around 31% of interface revenue now comes from accelerator interconnect, where requirements scale with cluster size rather than with device shipments. That is a fundamentally different demand mechanism from the rest of this market and it compounds as clusters grow. Suppliers forecasting from unit volumes are modelling the wrong variable entirely for the fastest growing segment, and their capacity planning reflects a market that stopped being the main one. Capacity planned against unit shipments serves a market that has already moved. Cluster size is the variable. Forecasts miss the mechanism.
Market Impact: Interconnect now drives a full 31% of revenue

Who Controls the Margin Pool

Five participants hold 67% of wired interface revenue, high for a component category, because standards committee participation rather than manufacturing capability determines who supplies anything at each generation. Broadcom, Synopsys, Cadence Design Systems, Texas Instruments and Amphenol lead. All participants are assessed on wired interface silicon, intellectual property and component revenue rather than on broader semiconductor, design tool or connector businesses they also operate. Concentration has held across generations because committee position compounds rather than resetting each time.
Competition runs on committee position and licensing breadth far more than on implementation quality, which is publicly documented and broadly matched. The second dimension is compliance validation capability, because a programme costing around USD 340,000 falls equally on small and large implementations and licensed cores carrying pre-validated compliance remove it from the customer entirely.

Pressure is emerging from system companies developing interface capability internally for their own silicon, which removes the licence rather than competing for it. Rankings shift where accelerator clusters scale and where custom silicon programmes expand, particularly across India, Taiwan and North America at present. Licensors carry the most exposure to that internalisation, since it removes royalties permanently.
wired-interface-market-company-positioning-matrix-1790002954239

Competitive Moat and Risk Dimensions

BROADCOM

Moat: Committee Position Depth

Broadcom holds participation across the standards bodies writing interface specifications roughly four years ahead of volume silicon, and those documents describe capabilities its designs already demonstrate. Competitors implement decisions taken without them and arrive late to every generation. That position produces itself: shipping silicon at a new generation first strengthens the case for the next specification round.
BROADCOM

Risk: Internal Silicon Displacement

System companies developing interface capability internally for their own custom silicon remove the purchase entirely rather than competing on price or specification. Those companies are also increasingly present in the same standards committees. Committee position defends against competitors and does not defend against a customer that decides to build the interface itself and stops buying anything.
SYNOPSYS

Moat: Licensed Core Breadth

Synopsys licenses interface intellectual property across the generations and standards that custom silicon programmes need, and around 46% of implementations now arrive this way rather than as discrete devices. Licensed cores carry pre-validated compliance that removes a validation programme costing around USD 340,000. Competitors licensing narrower portfolios force a customer to assemble interfaces from several vendors.
SYNOPSYS

Risk: Customer Internalisation Pressure

The same system companies licensing cores are building internal interface teams, and each generation they internalise removes royalty revenue permanently rather than competitively. Portfolio breadth slows that decision without preventing it. Licensing revenue depends on customers preferring not to build something they are increasingly capable of building themselves at scale.

Players Tracked

Prominent Players

Broadcom
Synopsys
Cadence Design Systems
Texas Instruments
Amphenol

Other Key Players

Marvell Technology
Astera Labs
Rambus
Alphawave Semi
Credo Technology
Molex
TE Connectivity
Microchip Technology
Analog Devices
Renesas Electronics
Parade Technologies
Diodes Incorporated
Silicon Labs
Lattice Semiconductor
Keysight Technologies

Recent Developments

MARCH 2025

Accelerator Interconnect Requirements Reshape Specification Priorities

Standards bodies prioritised accelerator interconnect requirements over peripheral connection in specification work, a technical governance development rather than any corporate transaction. Around 31% of interface revenue now comes from interconnect, and requirements there scale with cluster size rather than with the device shipments that historically drove this category.
Signal: Committee priorities now follow whoever brings the largest deployment volumes to the discussion table each round.
SEPTEMBER 2024

System Companies Build Internal Interface Design Teams

Several large system companies expanded internal interface design capability for their own custom silicon, a capability development rather than any acquisition. Licensed intellectual property accounts for around 46% of implementations, and every generation a customer internalises removes royalty revenue permanently rather than transferring it to a competitor.
Signal: Internalisation removes the licence entirely rather than merely moving it across to some other rival supplier.
JUNE 2025

Indian Design Centres Expand Custom Silicon Interface Licensing

Indian semiconductor design centres expanded custom silicon programmes licensing interface intellectual property rather than developing it internally, a demand development rather than any corporate event. India compounds at 17.9%, and those licensing relationships renew across successive chip generations rather than being negotiated once and re-tendered.
Signal: Licensing relationships renew across generations where discrete component supply gets re-tendered on every single product cycle.

What Interfaces Cost To Supply

Research and development absorbs roughly 34% of cost in this category, weighted toward physical layer design that requires specialist analog and mixed signal engineers in short supply. Standards participation and compliance validation take around 14%, and that spending recurs with every generation. Silicon fabrication and packaging absorb about 27% for device suppliers, with sales and support taking the remaining balance.
Specialist analog and mixed signal engineering salaries rose sharply through 2023 and 2024 as accelerator interconnect demand pulled the same scarce talent that automotive and industrial interface work also required. Broadcom Annual Report 2024 and Synopsys Annual Report 2024 both record engineering talent and standards participation among principal operating variables. Licensors spread that development cost across many customers where device suppliers amortise it across their own volume only.

The competitive disadvantage mechanism is amortisation base rather than engineering cost. A licensor recovers physical layer development across every customer implementing the core, while a device supplier recovers it only across units it ships itself. Exposure concentrates among smaller device suppliers, since they carry the same generation development cost as licensors without either the customer breadth or the royalty stream to spread it over.
wired-interface-market-cost-volatility-analysis-1790002954536

Recover Development Across Licensees Rather Than Units

Research and development absorbs roughly 34% of cost and physical layer work must be done once per generation whatever the eventual volume turns out to be. Licensing that work to many customers recovers it across a far wider base than shipping devices allows. Device-only suppliers carry generation costs they increasingly cannot amortise. The base is what matters.

Amortise Standards Participation Across Multiple Specifications

Standards participation and compliance validation absorb around 14% of cost and recur with every generation across every specification a supplier follows. Engineers participating across several related committees spread that cost while widening the position it buys. The alternative is participating narrowly, which costs almost as much per specification and produces a much thinner competitive position.

Develop Analog Engineers Rather Than Bidding For Them

Specialist analog and mixed signal engineering salaries rose sharply as accelerator interconnect demand pulled the same scarce talent automotive and industrial work required. Graduate development programmes cost less per engineer and produce staff who know the products from the outset. The payback runs over years, which is exactly why competitors under quarterly pressure keep bidding for experienced hires instead.

Portfolio Architecture for Margin Defence

Margin architecture separates on revenue model rather than on technical difficulty. Connectors and cable assemblies earn least, since they are manufactured products competing on cost against numerous capable suppliers. Standalone controllers and test equipment sit above on specification depth. Interface intellectual property licensing, accelerator interconnect silicon and retimers earn most, because each combines standards position with either royalty economics or scarce analog capability.
The volume versus premium tension runs between device supply and licensing, which reward opposite investments entirely. Devices require fabrication commitments, inventory and channel coverage at component margins. Licensing requires portfolio breadth and standards participation at royalty margins with no manufacturing at all. Participants holding both frequently find the device business subsidising development that the licensing business monetises far more effectively.

High-value pools concentrate in licensing and in accelerator interconnect, and neither is reached through manufacturing capability. Licensing requires portfolio breadth across generations that took years to assemble. Interconnect requires physical layer analog engineering the talent market cannot supply quickly. Both explain why five participants hold 67% while the connector and cable half of this market fragments across many suppliers competing on cost.

Volume / Commodity-Adjacent

Connectors and cable assemblies implementing interface standards, manufactured products competing largely on cost against numerous capable suppliers worldwide. The twelve point spread separates suppliers with high volume automated assembly from those producing at scales where labour content remains significant.
Gross Margin: 26% to 38%

Premium / Certified

Standalone interface and bridge controllers and compliance test and validation equipment, where specification depth and validation credibility determine selection rather than any unit price comparison. The thirteen point spread tracks how much generation development each supplier amortises across shipped volume.
Gross Margin: 46% to 59%

Sustainability / Regulatory / Next-Generation

Interface intellectual property licensing, accelerator interconnect silicon and retimers and signal conditioning, each combining standards position with royalty economics or scarce analog capability. The sixteen point spread reflects portfolio breadth across generations and depth of physical layer engineering.
Gross Margin: 68% to 84%
wired-interface-market-portfolio-architecture-1790002955088

High-value Sub-segments and Strategic Watch-out

High Speed Serial Interfaces For Accelerator Interconnect

Grows at 16.4% because moving data between processors costs more time than computing on it in cluster architectures. The sixteen point spread reflects analog engineering depth. Requirements scale with cluster size rather than with any device shipment volume. Cluster scale is the demand driver. Analog talent is scarce.
Gross Margin: 68% to 84%

Interface Intellectual Property Licensing

Grows at 14.1% because around 46% of implementations now arrive as licensed cores in custom silicon. The sixteen point spread reflects portfolio breadth. Relationships renew across chip generations rather than being re-tendered every single time. Pre-validated compliance closes deals. Royalties renew across generations rather than resetting.
Gross Margin: 68% to 84%

Retimers And Signal Conditioning Devices

Grows at 15.2% as serial rates rise beyond what channels carry without conditioning across longer board and cable runs. The sixteen point spread reflects physical layer capability. Analog talent scarcity constrains how quickly anybody can enter this segment. Serial rates keep rising steadily. Channels need conditioning.
Gross Margin: 68% to 84%

Connectors And Cable Assemblies

Grows at 6.8%, slowest of the six classes, as manufactured product competing on cost against numerous capable suppliers everywhere. The twelve point spread reflects assembly automation. Standards compliance is necessary here but confers no differentiation whatsoever. Cost is the entire argument. Compliance confers nothing. Automation decides margin.
Gross Margin: 26% to 38%

Why Committees Hold Position

The annuity here is the specification rather than any customer relationship. A company inside the committee when a generation is written ships silicon meeting it first, which strengthens its position when the next generation is discussed roughly four years later. That loop compounds across generations and cannot be entered from outside by building better hardware. Competitors implementing published documents are permanently one cycle behind the people who wrote them.
Depth varies by revenue model. A licensed core integrated into a customer's custom silicon renews across successive chip generations, because redesigning the interface at every generation costs more than the royalty does. A discrete device gets re-tendered each product cycle against every competitor with a comparable part. The same interface technology therefore produces entirely different customer durability depending on how it was sold.

The buyer has changed as silicon design spread. A system designer selecting components evaluated specification support, price and availability against a board design. A custom silicon team evaluates which licensed core carries pre-validated compliance and covers the generations its roadmap needs. An accelerator architect evaluates whether interconnect scales with cluster size. Only the first buyer was ever really buying a component at all.
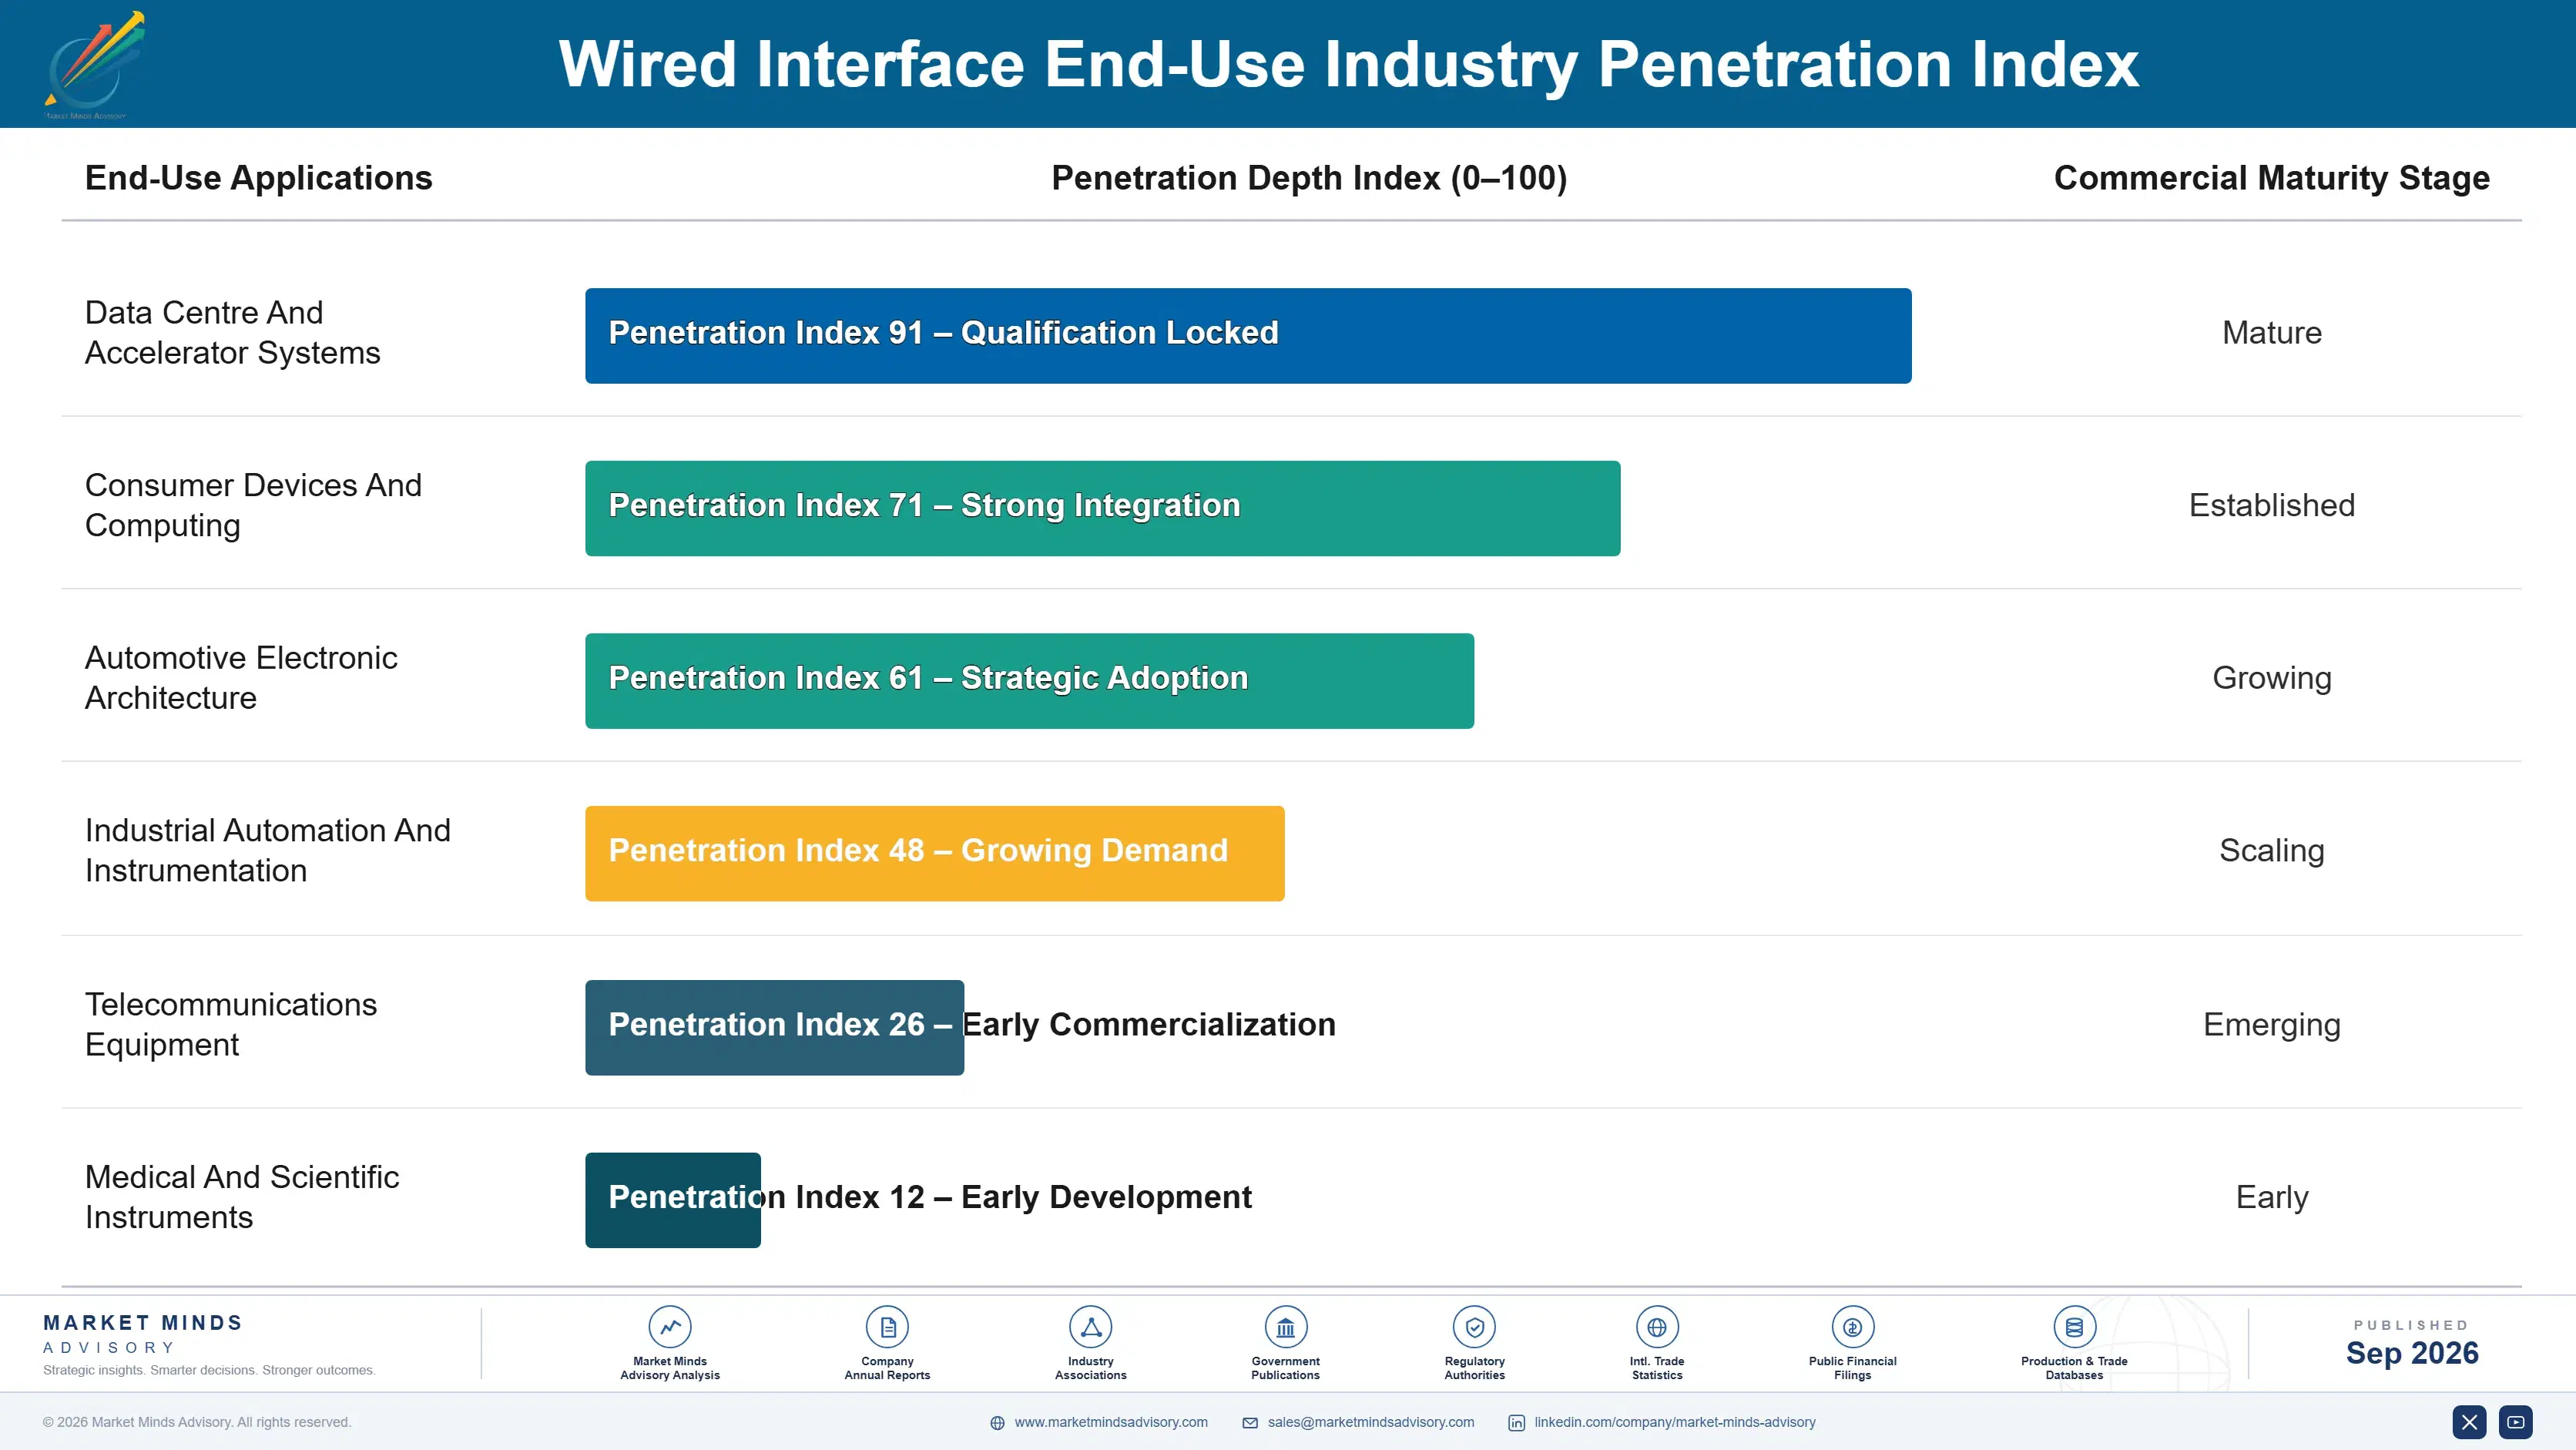
wired-interface-market-end-use-penetration-index-1790002955599

What Wins Interface Business

These are among the four positions where our research anticipates prominent divergence between winners and laggards over the coming forecast period. Each is grounded in the demand model, the regulatory perimeter, and the announced capacity pipeline.
01 / COMMITTEE INVESTMENT PRIORITY

Buy A Seat, Not A Better Implementation

Standards committees agree interface specifications roughly four years ahead of volume shipping silicon, and the participants writing those documents describe capabilities their own designs already demonstrate in the laboratory. A company outside the room implements somebody else's decision late and competes on price with nothing else left to offer. Committee participation costs engineering time across years and remains the only route to a position engineering quality alone never produces for anybody arriving later to a committee already sitting and already writing.
02 / REVENUE MODEL CONVERSION

License The Core, Do Not Ship Parts

Around 46% of interface implementations now arrive as licensed intellectual property integrated into custom silicon rather than bought as discrete controller devices from a catalogue. That converts a component sale into a royalty stream renewing across successive chip generations rather than being re-tendered each product cycle. Suppliers holding only discrete devices are selling into the shrinking half of this market on materially worse margin economics than licensors enjoy across the same generation development cost for every generation they build at every node.
03 / VALIDATION BUNDLING PRACTICE

Absorb The Compliance Programme For Them

A compliance validation programme costs around USD 340,000 per interface implementation before anything ships, and that expense falls equally on a small design and a very large one. Licensed cores carrying pre-validated compliance remove it from the customer entirely and without negotiation. That is worth considerably more to a smaller implementer than any technical advantage, and it converts programmes that would otherwise have licensed elsewhere without any negotiation at all or additional commercial concession from the supplier at any stage of negotiation.
04 / CLUSTER DEMAND MODELLING

Forecast Clusters, Not Unit Volumes

Around 31% of interface revenue now comes from accelerator interconnect, where requirements scale with cluster size rather than with the device shipments that drove this category historically. That is a fundamentally different demand mechanism and it compounds as clusters grow rather than as products sell. Suppliers forecasting from unit volumes are modelling the wrong variable for the fastest growing segment and planning capacity against a market that has already moved without noticing the shift in their own demand models until it is late.

Engagement Snapshot From the Field

A live engagement with an industry participant carrying material or product regulatory and market exposure ahead of a defining policy shift, showing how our research translates into a defensible multi-year portfolio strategy.
MARKET MINDS ADVISORY · CLIENT ENGAGEMENT SUMMARY
Wired Interface Producer Strategic Portfolio Review and Transition Roadmap 2026·Investment Scenario on Wired Interface Exposure Evaluation 2025-26
CLIENT PROFILE
An interface silicon supplier with strong discrete controller products losing design wins to licensed cores it did not offer, while its own generation development costs kept rising. Management attributed the losses to pricing from larger competitors and had approved further cost reduction, without establishing whether the customers were buying components at all any more. Nobody had checked where the designs went.
STRATEGIC CHALLENGE
Product wanted investment in the next controller generation to hold specification parity. Sales wanted price reductions to defend design wins. Nobody had examined whether lost designs went to competing devices or to licensed cores, and the next generation development commitment was due within the quarter at substantial cost. Both proposals assumed the losses were competitive rather than a revenue model problem.
MMA APPROACH
MMA traced lost design wins to establish whether they went to competing discrete devices or to licensed intellectual property integrated into custom silicon. We compared generation development cost against the amortisation base each revenue model provides. Work drew on 47 expert interviews conducted in Q4 2025 with system designers, custom silicon teams and interface suppliers.
KEY FINDINGS
  1. Around 71% of lost design wins went to licensed cores rather than to competing discrete devices, which price reduction could not have addressed at all.
  2. Generation development cost was the same whether the output shipped as devices or licensed cores, but the amortisation base differed by an order of magnitude.
  3. The company held no standards committee position at the generation being written, which meant it would arrive late again (client-reported, unverified by MMA).
  4. Customers licensing cores valued the pre-validated compliance worth around USD 340,000 considerably more highly than any device performance difference the company could offer.
CLIENT PROFILE
An interface silicon supplier with strong discrete controller products losing design wins to licensed cores it did not offer, while its own generation development costs kept rising. Management attributed the losses to pricing from larger competitors and had approved further cost reduction, without establishing whether the customers were buying components at all any more. Nobody had checked where the designs went.
STRATEGIC CHALLENGE
Product wanted investment in the next controller generation to hold specification parity. Sales wanted price reductions to defend design wins. Nobody had examined whether lost designs went to competing devices or to licensed cores, and the next generation development commitment was due within the quarter at substantial cost. Both proposals assumed the losses were competitive rather than a revenue model problem.
MMA APPROACH
MMA traced lost design wins to establish whether they went to competing discrete devices or to licensed intellectual property integrated into custom silicon. We compared generation development cost against the amortisation base each revenue model provides. Work drew on 47 expert interviews conducted in Q4 2025 with system designers, custom silicon teams and interface suppliers.
KEY FINDINGS
  1. Around 71% of lost design wins went to licensed cores rather than to competing discrete devices, which price reduction could not have addressed at all.
  2. Generation development cost was the same whether the output shipped as devices or licensed cores, but the amortisation base differed by an order of magnitude.
  3. The company held no standards committee position at the generation being written, which meant it would arrive late again (client-reported, unverified by MMA).
  4. Customers licensing cores valued the pre-validated compliance worth around USD 340,000 considerably more highly than any device performance difference the company could offer.
RECOMMENDED STRATEGY
Phase 1: Phase one: stop the price reduction programme, since roughly 71% of lost designs went to licensed cores rather than to competing devices. Phase 2: Phase two: license the next generation as intellectual property alongside devices, recovering development cost across customers rather than across shipped units. Phase 3: Phase three: fund standards committee participation immediately, since arriving late to every generation is the underlying cause of the losses.
OUTCOME
The supplier launched its next generation as licensed intellectual property alongside devices and funded committee participation (client-reported, unverified by MMA). Development cost recovered across a far wider base, and design wins improved once pre-validated compliance was offered. Committee position is now funded as a standing commitment, which is the change that outlasted the engagement.

Frequently Asked Questions

Foundational context covering the market sizes, CAGR, scope, country, region and competition that inform every finding below. This section is provided to cover basics and most often pre-purchase conversations, answered from the MMA Primary Research Dataset.

What is the current size of the Wired Interface Market?

Global value reaches USD 10.4 billion in 2026, measured as interface silicon, intellectual property and component revenue. The 2025 base was USD 9.4 billion on the same basis.

How large will the Wired Interface Market be by 2036?

The market reaches USD 29.2 billion by 2036, an increase of USD 18.8 billion across the forecast period. That represents 2.81 times expansion from the 2026 base.

What is the CAGR for the Wired Interface Market 2026 to 2036?

The base case runs at 10.9% annually, with a bull case at 12.2% if accelerator cluster scale keeps rising and a bear case at 9.7% if the industry consolidates onto fewer standards.

Which segment is growing fastest?

High speed serial interfaces for accelerator interconnect grow at 16.4%, half again the market rate of 10.9%. Moving data between processors costs more time than computing on it.

Who are the major companies in the Wired Interface Market?

Broadcom, Synopsys, Cadence Design Systems, Texas Instruments and Amphenol lead on interface revenue, holding 67% between them. Astera Labs and Rambus hold smaller positions in the category.

Which country is growing fastest?

India leads at 17.9%, as custom silicon design centres expand faster than anywhere else and every programme licenses interface intellectual property. Taiwan and Vietnam follow.

Report Segmentation Architecture

The full report scope spans multiple orthogonal segmentation dimensions, with cross-tabulated demand data provided for each dimension pair. Coverage extends further to regional breakdowns, trend trajectories, and the competitive detail needed to support segment-level decision-making.

By Product Form And Revenue Model

  • High Speed Serial Interfaces For Accelerator Interconnect
  • Interface Intellectual Property Licensing
  • Retimers And Signal Conditioning Devices
  • Standalone Interface And Bridge Controllers
  • Compliance Test And Validation Equipment
  • Connectors And Cable Assemblies

By End-Use Industry

  • Data Centre And Accelerator Systems
  • Consumer Devices And Computing
  • Automotive Electronic Architecture
  • Industrial Automation And Instrumentation
  • Telecommunications Equipment
  • Medical And Scientific Instruments

By Commercial Dimension

  • Intellectual Property Licensing And Royalty
  • Direct Component Supply
  • Original Equipment Manufacturer Design Win
  • Electronic Component Distribution
  • Foundry Partner Programme Qualification
  • Contract Manufacturer Procurement

By Region

  • North America
  • Western Europe
  • East Asia
  • South Asia and Pacific
  • Latin America
  • Middle East and Africa
  • Eastern Europe

Scope, Methodology, and Coverage

Every figure in this report is reproducible from documented input assumptions. The scope below maps the historical period, the forecast horizon, the segmentation dimensions, and the countries covered, alongside the underlying primary and qualitative methodology.
Historical Period
2020 to 2025
Forecast Period
2026 to 2036
Base Year
2025 (USD billions; MMA Primary Research Dataset, September 2026)
Market Definition
This report covers wired interface products: the silicon, intellectual property and physical components implementing wired data connections between and within electronic systems, spanning high speed serial interfaces for accelerator interconnect, interface intellectual property licensing, standalone interface and bridge controllers, connectors and cable assemblies, retimers and signal conditioning devices, and compliance test equipment. It excludes wireless interfaces, complete optical transceiver modules, network switching silicon, circuit board fabrication, and cable infrastructure installation.
Quantitative Units
USD millions, interface silicon, intellectual property and component revenue; devices shipped and cores licensed; specification lead times in years; licensed share of implementations; compliance validation cost per implementation; interface generations shipping concurrently.
Segmentation Dimensions
Product form and revenue model; end-use industry; commercial supply route; geography across seven regions.
Regions Covered
North America, Western Europe, East Asia, South Asia and Pacific, Latin America, Middle East and Africa, Eastern Europe
Countries Covered
Taiwan, China, South Korea, Japan, Singapore, Malaysia, India, Vietnam, United States, Canada, Germany, France, Netherlands, United Kingdom, Italy, Poland, Czechia, Brazil, Mexico, Israel.
Key Companies Profiled
Broadcom, Synopsys, Cadence Design Systems, Texas Instruments, Amphenol, Marvell Technology, Astera Labs, Rambus, Alphawave Semi, Credo Technology, Molex, TE Connectivity, Microchip Technology, Parade Technologies, Keysight Technologies.
Quantitative Methodology
Primary survey, n=3,800 respondents, Q4 2025, six countries; demand-side model with trade association cross-validation
Qualitative Methodology
47 expert interviews, Q4 2025; applied to validate demand model assumptions, identify emerging dynamics, and assess competitive positioning
Report Format
PDF and XLSX data workbook (Word format preview document)
Publisher
Market Minds Advisory
Report Code
MMA-2026-TEC-211
Published
September 2026
Contact
sales@marketmindsadvisory.com | www.marketmindsadvisory.com

Purchase the full Wired Interface Market Report (2026 to 2036).

This report sizes the global wired interface market from 2026 to 2036 across six product forms, six industries and seven regions. It explains why standards committees agreeing specifications around four years ahead of volume silicon make committee participation rather than engineering quality the decisive competitive asset. Licensed intellectual property reaching around 46% of implementations is analysed as the revenue model shift redefining this category. Accelerator interconnect at around 31% of revenue is examined as demand scaling with cluster size rather than unit shipments. Regional analysis explains why East Asia holds 38% of consumption.
Six product forms sized through to 2036
Standards lead times quantified against competitive position
Licensing displacement analysed against discrete device supply
Twenty named participants assessed on interface revenue
Four revenue levers with quantified commercial impact
Anonymised supplier revenue model engagement documented in full

Built For The People Who Decide

From boardroom strategy to bench-side execution, this report is read cover-to-cover by leaders shaping the next decade of their industry, turning demand scenarios, market dynamics and valuation benchmarks into decisions.
CXOs/ Presidents/ VPs/ Managers
M&A and Corporate Development
Strategy Teams and R&D Heads
Procurement and Product Directors
Regulatory and Compliance Leaders
Investor Relations and Equity Analysts