Market Minds Advisory
Wind Power Forecasting System Market

Wind Power Forecasting System Market: Wind Power Forecasting System Market: The Imbalance Price Sets The Value

A better forecast is worth exactly what the imbalance price says it is worth. In markets with weak penalties, accuracy that nobody pays for is simply an expensive engineering hobby and nothing more.

Lead Analyst

Published

September 2026

Make Smarter Decisions with Customized Research Insights

Request a free sample report and evaluate market opportunities, growth trends, and competitive dynamics relevant to your business needs.

2025 MARKET VALUE$1.3BMarket Size 2025
2036 FORECAST VALUE$4.3BBase Case , 2026 to 2036
CAGR 2026 TO 203611.6 %Bull 12.8% / Bear 10.4%
INCREMENTAL OPPORTUNITY$2.9BNet 10- year value creation
EXPANSION MULTIPLE3.00x2036 value over 2026 base
Strategic Levers
M&A Pipeline
Regional Outlook
Country Rankings
Competitive Intelligence
Segmental Deep-dive
Call-Us : 91 93563 13602

Executive Snapshot and Market Trajectory.

This market is sized by market design rather than by installed capacity, which is why the map looks strange. A percentage point of forecast accuracy is worth USD 2.40 a megawatt hour where imbalance penalties bite and almost nothing where they do not bite at all.
Nowcasting and sub-hourly forecasting grows at 17.4%, half again the market rate of 11.6%, because settlement periods shortened to fifteen minutes and batteries arrived to arbitrage the gap, which moved the money from weather models to observation. East Asia holds 27% of demand, narrowly ahead of Western Europe, on the world's largest wind fleet and grid codes that impose forecast accuracy requirements with penalties attached. Europe leads on penalty severity rather than on capacity.
Concentration is low at 36% of capacity under contract and the reason is genuinely unusual. Sophisticated buyers deliberately purchase from 3.4 vendors on average and blend the outputs, because a diverse ensemble beats any single forecast. That means the commercial objective is not to be the most accurate provider. It is to be usefully different from the others. Almost every vendor in this market still sells on accuracy alone.
Market Definition
The wind power forecasting system market covers software, data services and platforms that predict the electrical output of wind generation assets across operational horizons, spanning nowcasting and sub-hourly forecasting, intraday forecasting, day-ahead forecasting, short-term horizons of two to seven days, seasonal and long-range forecasting, and ramp event and extreme weather alerting. Scope covers subscription, licence and service revenue for operational forecasting. Excluded are wind resource assessment for project development, meteorological measurement hardware and lidar equipment, general numerical weather prediction services sold outside power markets, energy trading platforms, and turbine control systems.
Base Year Value
$1.3B in 2025 (MMA Primary Research Dataset, September 2026)
Forecast Period
2026 to 2036, eleven discrete annual values
CAGR
11.6% base case. Bull 12.8%. Bear 10.4%.
Fastest Growth Segment
Nowcasting and Sub-Hourly Forecasting: 17.4% CAGR
Fastest Growth Country
India: 13.8% CAGR
Fastest Growth Region
South Asia and Pacific: 13.8% CAGR
Largest Region
East Asia: 27% of 2025 global value
Market Leaders
Vaisala, DNV, UL Solutions, Enfor and Meteologica. Source: MMA Analysis, July 2026.
Primary Survey
n=3,800 procurement and R&D decision-makers, Q4 2025, six countries
Methodology
Demand-side build-up, cross-validated against public data, 47 expert interviews

Wind Power Forecasting System Market Forecast Scenarios

wind-power-forecasting-system-market-size-forecast-scenario-1788234759657
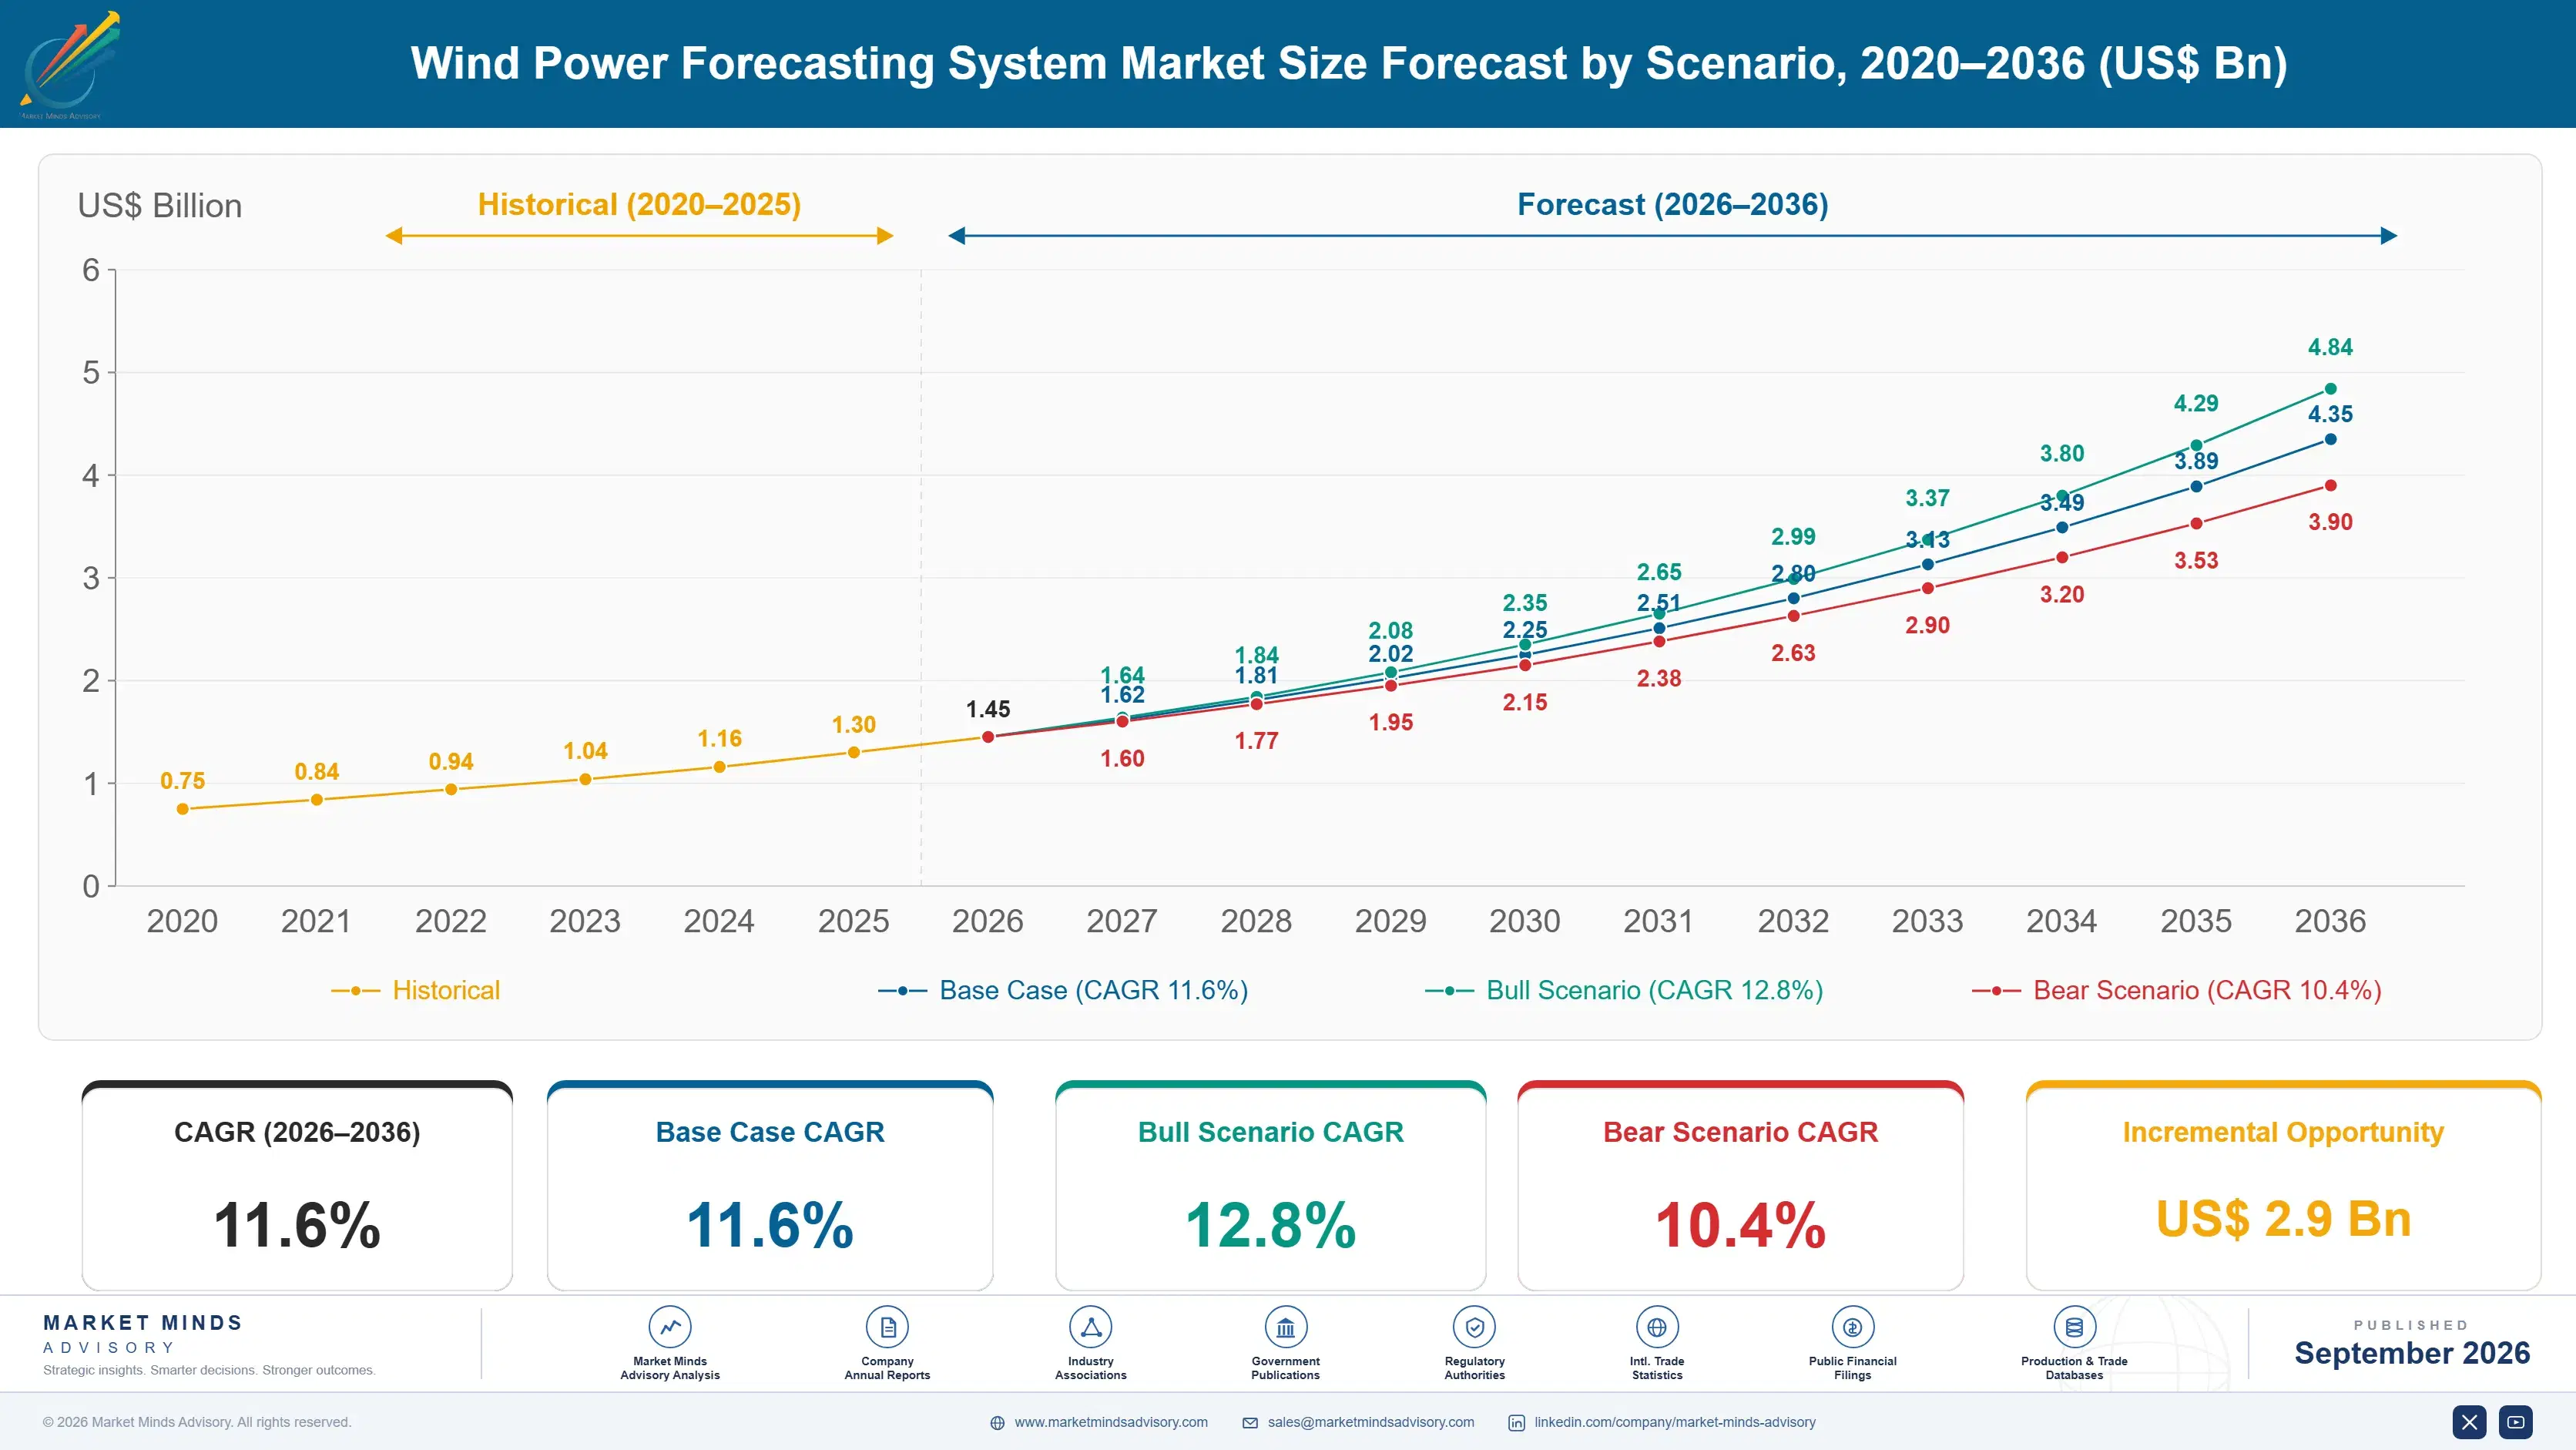
Between 2020 and 2025 the sector compounded at 10.2% and the growth tracked market rule changes far more closely than it tracked turbine installation. Every jurisdiction shortening its settlement period or stiffening imbalance penalties produced a step change in demand within two quarters, while those adding capacity without changing rules produced almost nothing. The pattern was consistent enough that vendors began reading regulatory dockets.
The 11.6% base case rests on three mechanisms. Settlement periods keep shortening toward fifteen minutes across European and Asian markets, which moves value toward horizons that weather models cannot serve. Battery storage co-located with wind creates a direct trading use for sub-hourly forecasts that did not previously exist. And grid codes in China and India now impose forecast accuracy obligations with financial consequences attached. None of the three depends on wind capacity growing.
The bull case at 12.8% turns on imbalance penalties tightening across more markets, which would raise what a percentage point of accuracy is worth everywhere it happened. The bear case at 10.4% is capability moving inside: large utilities and traders with data science teams increasingly build forecasting internally, and every one that does removes a customer permanently rather than switching between vendors.

Accuracy Is Not The Product

The commercial logic of this market is inverted from how it is sold. Sophisticated buyers purchase from an average of 3.4 vendors and blend the outputs, because an ensemble of independent forecasts consistently beats the best individual member of it. A vendor whose model closely resembles the market leader adds nothing to that blend regardless of its accuracy. Being usefully different is worth more than being marginally better.
TOP FIVE CONCENTRATION36%Share of capacity under forecast contract held by five
DAY-AHEAD FORECAST ERROR6.8%Mean absolute error against installed capacity at that horizon
IMBALANCE COST PER ERRORUSD 2.40Settlement penalty per megawatt hour of forecast deviation
FORECASTS BLENDED3.4 vendorsNumber of independent providers a sophisticated trader combines
NOWCAST HORIZON LIMIT6 hoursPoint beyond which weather models outperform observation based methods
CONTRACT RENEWAL RATE84%Portion of forecast agreements renewed at the annual term
What a forecast is worth follows the imbalance price and nothing else. In a market settling deviations at around USD 2.40 per megawatt hour, a percentage point of improvement across a large fleet justifies a subscription without argument. In a market where deviation costs little, the same improvement is worth almost nothing and the forecast is bought for compliance instead. Market design sizes this business, not turbines.
The horizon carrying the value has moved decisively. Day-ahead forecasting built on numerical weather prediction is close to a commodity, with several vendors performing within a point of each other. Below six hours, weather models lose to methods built on live turbine data, satellite imagery and upstream observation, and that is where shortened settlement periods and co-located batteries have pushed the money.
"Every vendor pitch in this business opens with an accuracy chart and the buyer is running four forecasts through a blend anyway. The right question is what your model does that the others do not, and almost nobody can answer it."
Director, Power Market Analytics Practice · MMA Technology Practice · September 2026

Market Trends

Shorter settlement periods moved value below six hours

European and Asian markets have shortened imbalance settlement toward fifteen minute periods, which makes a deviation over a short window financially consequential in a way an hourly average never was. Numerical weather prediction cannot resolve that horizon usefully, so value moved to methods built on live turbine data, satellite imagery and upstream sensing that were previously academic curiosities. Nowcasting grows at 17.4% against a market rate of 11.6% for that reason alone. Vendors built entirely around weather modelling are watching the growth go somewhere their core capability does not reach.
Market Impact: Mandates forecasts across 2 markets
Buyers blend vendors rather than choosing one

Sophisticated traders and utilities purchase forecasts from an average of 3.4 independent providers and combine them, because ensemble methods reliably outperform any single member and the diversity between models matters more than the quality of the best one. That inverts the sales argument completely: a vendor whose approach resembles the incumbent adds no value to the blend however accurate it is, while a genuinely different method earns a place even at lower standalone accuracy. Almost every vendor still leads with a comparative accuracy chart that the buyer will never use that way.
Market Impact: Acts on 40 minute warnings

Market Opportunities and Growth Drivers

Grid codes now mandate forecast accuracy with penalties

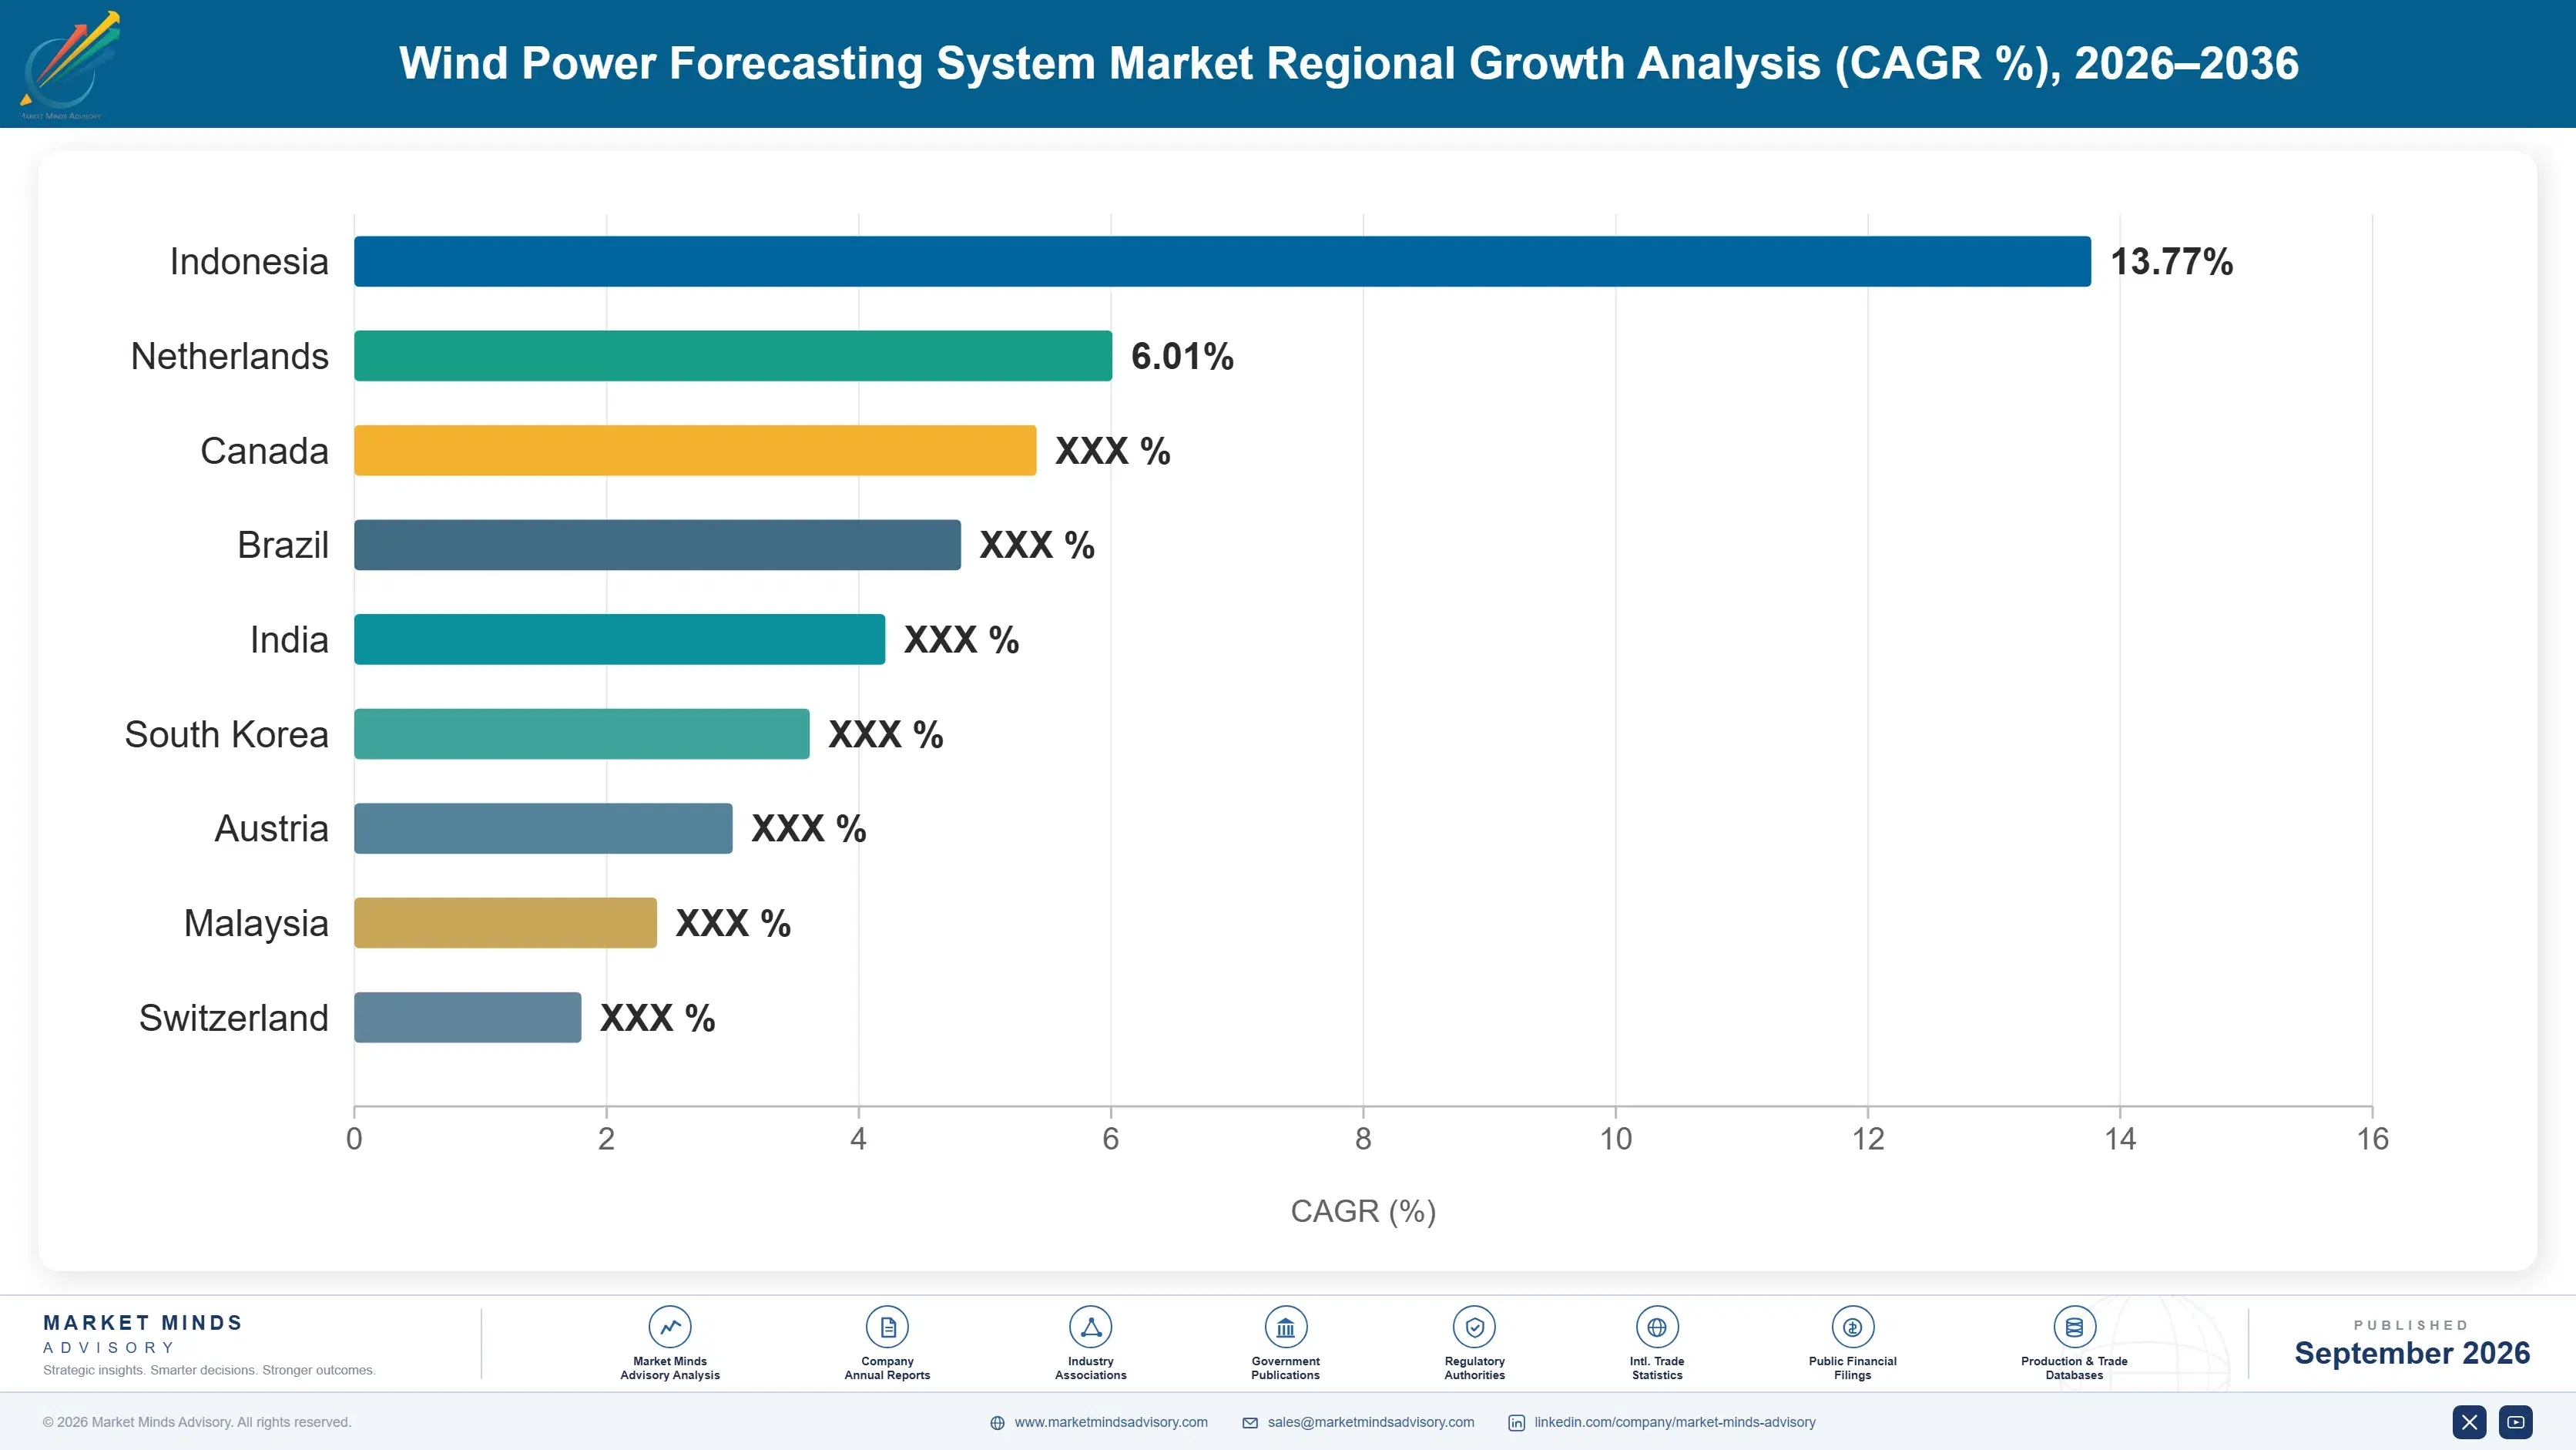
Chinese and Indian grid rules require wind farms to submit forecasts and assess them against realised output, with financial consequences for exceeding permitted error, which converts forecasting from a trading optimisation into a compliance obligation that every operator must purchase. That distinction matters enormously, because a compliance purchase is made regardless of whether the operator trades at all or believes in the value. East Asia takes 27% of demand and India grows at 13.8%, the fastest of any country covered, substantially on this mechanism rather than on any commercial calculation.
Market Impact: Depends on 1 competitor's permission

Co-located batteries created a sub-hourly trading use

Storage placed alongside wind generation turns a forecast into a dispatch instruction, because knowing that output will fall in forty minutes is directly actionable when a battery can cover the gap and capture the price. That use did not exist when wind farms could only produce whatever the wind allowed. It also raises the value of the specific horizons that were previously least commercially interesting. Every hybrid project commissioned adds a customer with a genuine willingness to pay for sub-hourly accuracy rather than for a day-ahead number. That is a genuinely new kind of buyer.
Market Impact: Removes customers permanently, not 1 renewal

Market Restraints and Challenges

Vendors do not own the data they most need

The live turbine data that makes sub-hourly forecasting work belongs to the asset owner or, increasingly, to the turbine manufacturer whose service agreement governs access, and manufacturers with their own forecasting products have limited what independents receive. The root cause is that whoever holds the operational data controls the most valuable input, and that party is often a competitor. Commercial impact is that the fastest growing segment depends on permission. Participants are responding with owner-side data agreements, independent measurement, satellite and reanalysis substitutes, and contractual data access clauses negotiated at project financing.
Market Impact: Values 15 minute settlement periods

Large buyers keep building the capability internally

Utilities and trading houses with data science teams increasingly build forecasting in house, reasoning that the models are published, the data is theirs and the cost is a few salaries against a subscription across a large fleet. The root cause is that this is software rather than hardware, so nothing physically prevents a competent buyer from replicating it. Commercial impact is permanent customer loss rather than competitive switching. Mitigation runs through ensemble diversity that internal teams cannot self-supply, proprietary observation networks, regulatory reporting services and pricing that undercuts the internal build case.
Market Impact: Buys from 3.4 vendors on average
3 additional market trends, 4 additional growth drivers, and 2 additional restraints and challenges are covered in the full report. Contact sales@marketmindsadvisory.com to access the complete intelligence.

Segment CAGR and Growth Architecture

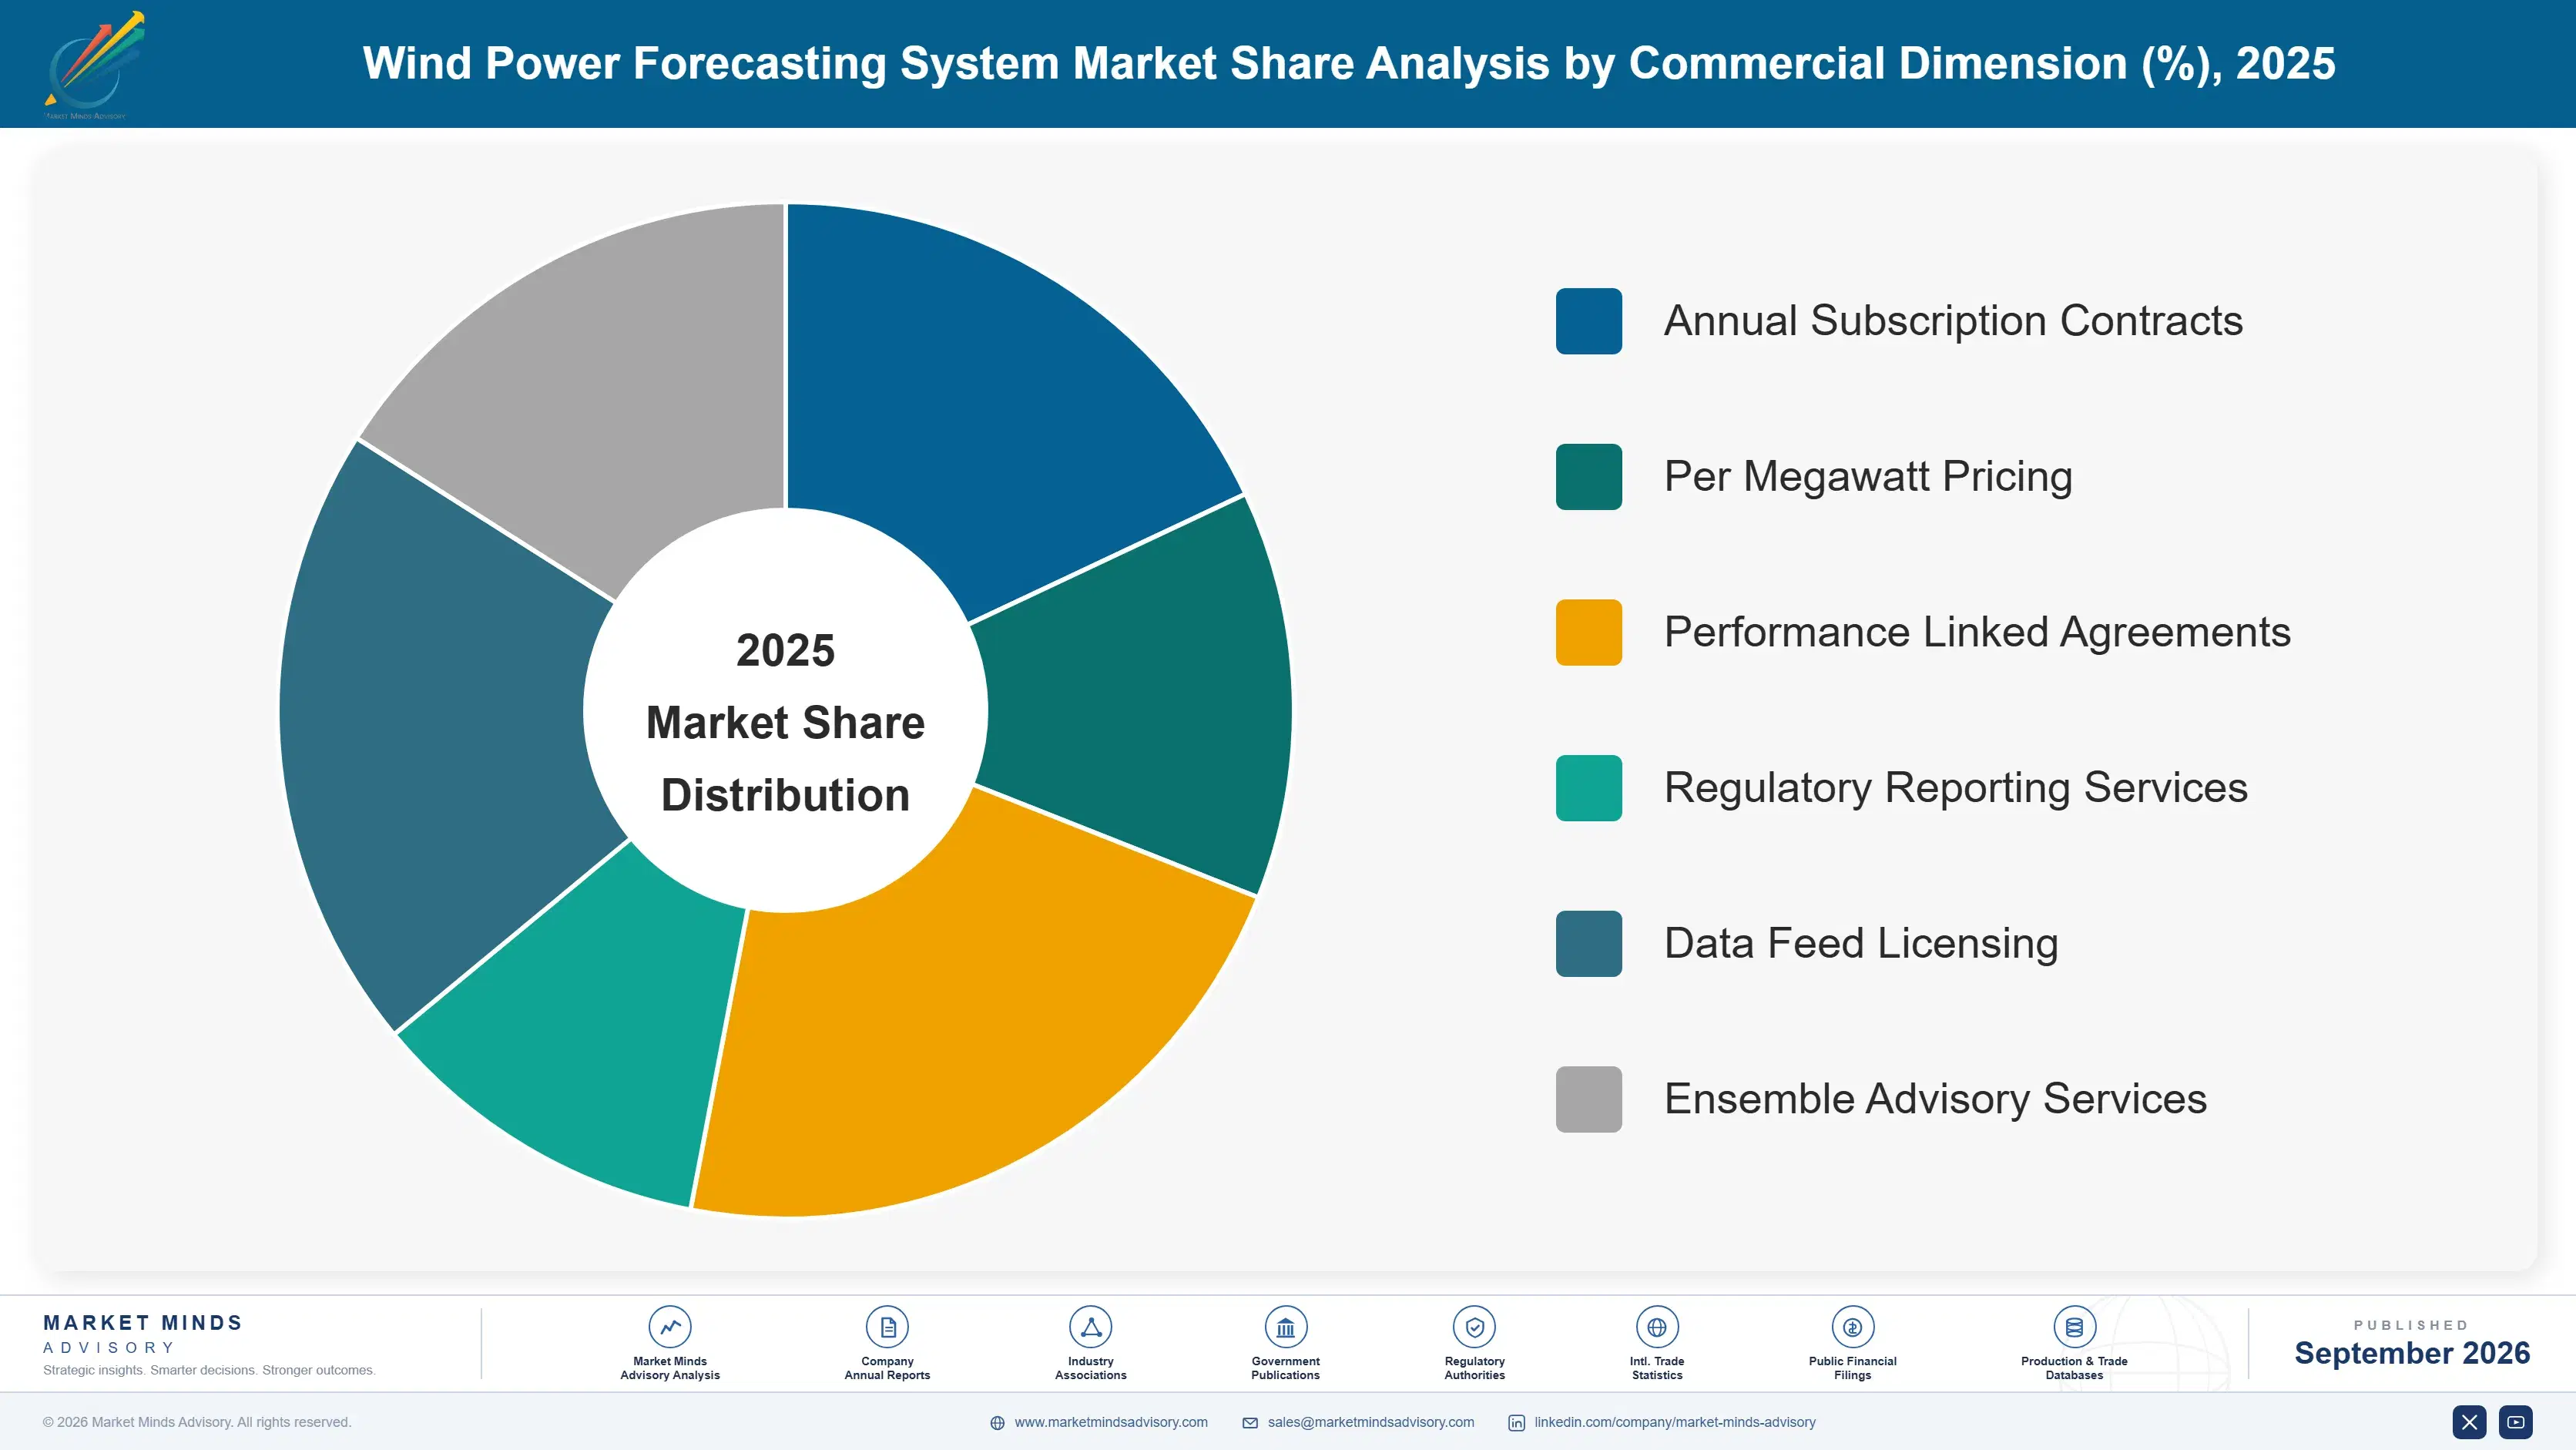
Segmentation follows forecast horizon, the dimension on which method, data requirement and commercial value all move together. Day-ahead and multi-day forecasting carry the installed base at commodity pricing that several vendors match. Nowcasting and intraday carry the growth, because shortened settlement and co-located storage both put money on exactly those windows. The money moved and the vendors mostly did not.
wind-power-forecasting-system-market-market-share-analysis-1788234760241

Nowcasting and Sub-Hourly Forecasting

Nowcasting and sub-hourly forecasting grows at 17.4%, half again the market rate of 11.6%, and it runs on entirely different machinery from the rest of this category. Below roughly six hours, numerical weather prediction adds little, and the useful signal comes from live turbine output, satellite imagery, upstream met masts and increasingly from neighbouring wind farms treated as sensors. That data belongs to asset owners and turbine manufacturers rather than to forecast vendors, which makes access the binding constraint rather than modelling capability. Shortened settlement periods and co-located batteries both put real money on this horizon within the past few years, and the vendors built around weather modelling have found their core capability does not reach it.
CAGR 17.4%

Intraday Forecasting

Intraday forecasting across six to twenty-four hours at 13.6% sits where weather models and observation-based methods both contribute, which makes it the horizon where ensemble blending delivers the most benefit and where buyers most obviously purchase from several vendors at once. Intraday markets have deepened considerably as more variable generation entered systems, and traders now adjust positions repeatedly through a delivery day rather than settling a day-ahead schedule and accepting whatever follows. The commercial position here is more defensible than day-ahead because the methods genuinely differ between providers, and less defensible than nowcasting because no vendor controls a scarce data input. Buyers here run several vendors at once, which makes decorrelation worth more than accuracy.
CAGR 13.6%
Full segment breakdown across 6 segments available in the complete report.

Regional Architecture and Country Demand Map

East Asia takes 27% on the largest wind fleet plus grid codes mandating forecast accuracy. Western Europe follows at 26% on the severest imbalance penalties anywhere. India grows fastest. Almost nothing about this map follows installed capacity, which is the single most common error made in sizing it.

East Asia

Capacity and compulsion arrive together here, which no other region combines. China operates the largest wind fleet in the world by a wide margin, and provincial grid rules require operators to submit forecasts and be assessed against realised output with financial consequences for excessive error, which makes purchase a compliance matter rather than a commercial calculation. Curtailment management in the northern and western provinces depends directly on those forecasts being usable. Domestic vendors serve most of that demand and international providers reach it mainly through partnerships. Japanese and Korean demand is smaller, offshore-weighted and priced considerably higher per megawatt under contract. Compliance demand behaves nothing like commercial demand, and vendors treating the two the same misjudge both.
Share: 27% | CAGR: 12.4% (2026 to 2036)

Western Europe

Penalty severity rather than fleet size explains a 26% share sitting just behind East Asia on less than half the capacity. Imbalance settlement across European markets is genuinely expensive, settlement periods have shortened toward fifteen minutes, and intraday trading is deep enough that a better forecast converts directly into a position adjusted at a better price. That combination makes buyers here the most sophisticated anywhere, routinely blending several vendors and measuring each one continuously. North Sea offshore assets add high value forecasting where a single farm represents enormous capacity. Growth at 10.0% is the slowest of the seven regions on a mature base rather than weak demand. These are the most demanding customers in the category by a wide margin.
Share: 26% | CAGR: 10.0% (2026 to 2036)
Regional intelligence for 5 additional markets available in the complete report: North America, South Asia and Pacific, Latin America, Middle East and Africa, Eastern Europe. Contact sales@marketmindsadvisory.com.
wind-power-forecasting-system-market-country-cagr-analysis-1788234760764

Four Moves On How Buyers Buy

None of these four is about improving accuracy, which is the thing almost every vendor spends its budget on. Each addresses how the purchase is actually made: blended across several providers, priced against an imbalance rule, and increasingly compared against building the same thing internally. All four are commercial decisions, and this sector is staffed almost entirely with scientists.

Sell difference to the blend, not accuracy

Sophisticated buyers run forecasts from 3.4 vendors on average and combine them, so a model closely resembling the incumbent adds nothing to that ensemble no matter how accurate it is standalone. Demonstrating decorrelation from the market leaders, and quantifying the improvement a buyer's blend gains by adding you, is a completely different pitch from a comparative accuracy chart. It requires knowing what the competition produces, which is obtainable. Almost every vendor still opens with the accuracy chart the buyer will never use that way. It describes something the buyer will simply never do.
Market Impact: Wins a place among the buyer's 3.4 vendors

Price against the imbalance rule locally

A percentage point of accuracy is worth around USD 2.40 per megawatt hour of deviation where penalties bite and close to nothing where they do not, yet most vendors price a subscription per megawatt under contract on the same basis everywhere. Pricing against locally avoided imbalance cost captures far more in severe markets and wins volume in weak ones that flat pricing loses. It requires modelling each market's settlement rules, which is a week of work per jurisdiction. Very few vendors have done it. It is the cheapest repricing available anywhere here.
Market Impact: Captures USD 2.40 for every megawatt hour deviation

Secure turbine data access at financing

Nowcasting grows at 17.4% and depends on live turbine output that belongs to the asset owner or the turbine manufacturer, and manufacturers with competing forecasting products have restricted what independents receive. The moment to fix that is at project financing, when data access clauses can be written into service agreements before anybody is competing over them. Owners will sign readily because it costs them nothing then. Vendors negotiating for data access after commissioning are negotiating with a party that has every reason to refuse. Timing is the whole lever here.
Market Impact: Protects a segment now growing at 17.4% annually

Undercut the internal build case deliberately

Large utilities and traders build forecasting internally because the models are published, the data is theirs and a few salaries look cheaper than a subscription across a large fleet. Every one that does is lost permanently rather than temporarily. Pricing that sits visibly below a 2 person data science team, combined with ensemble diversity an internal team cannot supply itself, changes that calculation before it is made. It costs margin on the largest accounts and protects the whole relationship, which almost nobody models properly. Almost nobody models that trade properly.
Market Impact: Defeats a 2 person internal build case outright

Who Controls the Margin Pool

CR5 stands at 36% of wind capacity under forecast contract, which is the only comparable basis since forecasting revenue sits inside far larger measurement, consulting and software businesses for most participants. Concentration is low for a software category, and the reason is that buyers deliberately spread purchases across several vendors to build an ensemble rather than consolidating onto the best one. That is a genuinely unusual buying behaviour.
Competition runs on model diversity, data access and market rule knowledge. Diversity decides whether a vendor earns a place in a buyer's blend at all. Data access decides who can serve the sub-hourly horizon where value has moved. Rule knowledge decides pricing, since the same forecast is worth very different amounts in different jurisdictions. Standalone accuracy decides considerably less than every vendor's marketing implies.

Rankings will move as turbine manufacturers use data access to advantage their own forecasting products, which is a competitive weapon independents cannot answer technically. Nowcasting grows at 17.4% and depends entirely on that data. The pressure comes from a supply chain position rather than from any modelling advance, and the response has to be contractual rather than scientific. Very few independents have started that work.
wind-power-forecasting-system-market-company-positioning-matrix-1788234761292

Competitive Moat and Risk Dimensions

VAISALA

Moat: Observation network and measurement heritage

Ownership of measurement infrastructure and long meteorological data records gives the group observational inputs that pure software vendors must buy or approximate, which matters most at the short horizons where value has moved. That data is proprietary and cumulative rather than purchasable. A software-only competitor can match the modelling and cannot match the observation behind it.
VAISALA

Risk: Turbine data access controlled elsewhere

The live turbine output that drives sub-hourly forecasting sits with asset owners and turbine manufacturers, and manufacturers with competing products have restricted independent access. Meteorological observation partly substitutes and does not fully replace it. Being excellent at weather while a competitor holds the operational data is a genuine exposure at exactly the horizon growing fastest.
ENFOR

Moat: Specialist focus on power forecasting

A business built entirely around forecasting for power markets rather than as an adjunct to consulting or measurement gives the company methods tuned to settlement rules and trading behaviour rather than to meteorological accuracy alone. Buyers who blend vendors value that difference specifically. Specialisation is the product here, and diversified competitors find it difficult to replicate without reorganising around it.
ENFOR

Risk: Scale limits against internal teams

Competing against a large utility's internal data science team means competing against a cost base measured in salaries rather than in subscriptions, and a specialist without diversified revenue has limited room to price against that. The largest and most attractive accounts are exactly the ones most able to build internally. Winning them requires giving away margin the business needs.

Players Tracked

Prominent Players

Vaisala
DNV
UL Solutions
Enfor
Meteologica

Other Key Players

DTN
GE Vernova
Siemens Gamesa Renewable Energy
Vestas
Nordex
Enel Green Power
Iberdrola
EDF Renewables
IBM
Google
Amazon Web Services
Schneider Electric
Hitachi Energy
ABB
Tomorrow.io

Recent Developments

JANUARY 2025

European markets completed shift to fifteen minute settlement

Additional European markets completed the transition to fifteen minute imbalance settlement periods, making short duration deviation financially consequential in markets where hourly averaging had previously absorbed all of it. Demand for sub-hourly forecasting then rose sharply across every affected market within two quarters of the change taking effect.
Signal: A settlement period change created more demand here than several years of capacity growth ever had.
MAY 2025

Turbine manufacturer restricted third-party operational data access

A turbine manufacturer tightened operational data access terms in its service agreements while marketing its own forecasting product to the same asset owners. Independent forecasting vendors serving those fleets abruptly lost access to the live output data that their own sub-hourly methods depended on entirely.
Signal: Whoever holds the operational data can decide who competes, which is not a modelling problem at all.
SEPTEMBER 2025

Indian deviation settlement charges tightened for wind generators

Indian regulators tightened deviation settlement charges applying to wind generators, narrowing the permitted error bands and raising the cost of exceeding any of them. Operators who had previously treated forecasting as optional found it converted into direct cost avoidance, and procurement across the whole sector rose quickly.
Signal: A regulator narrowed the permitted error band and created an entire market in a single order.

Data, Compute And Modellers

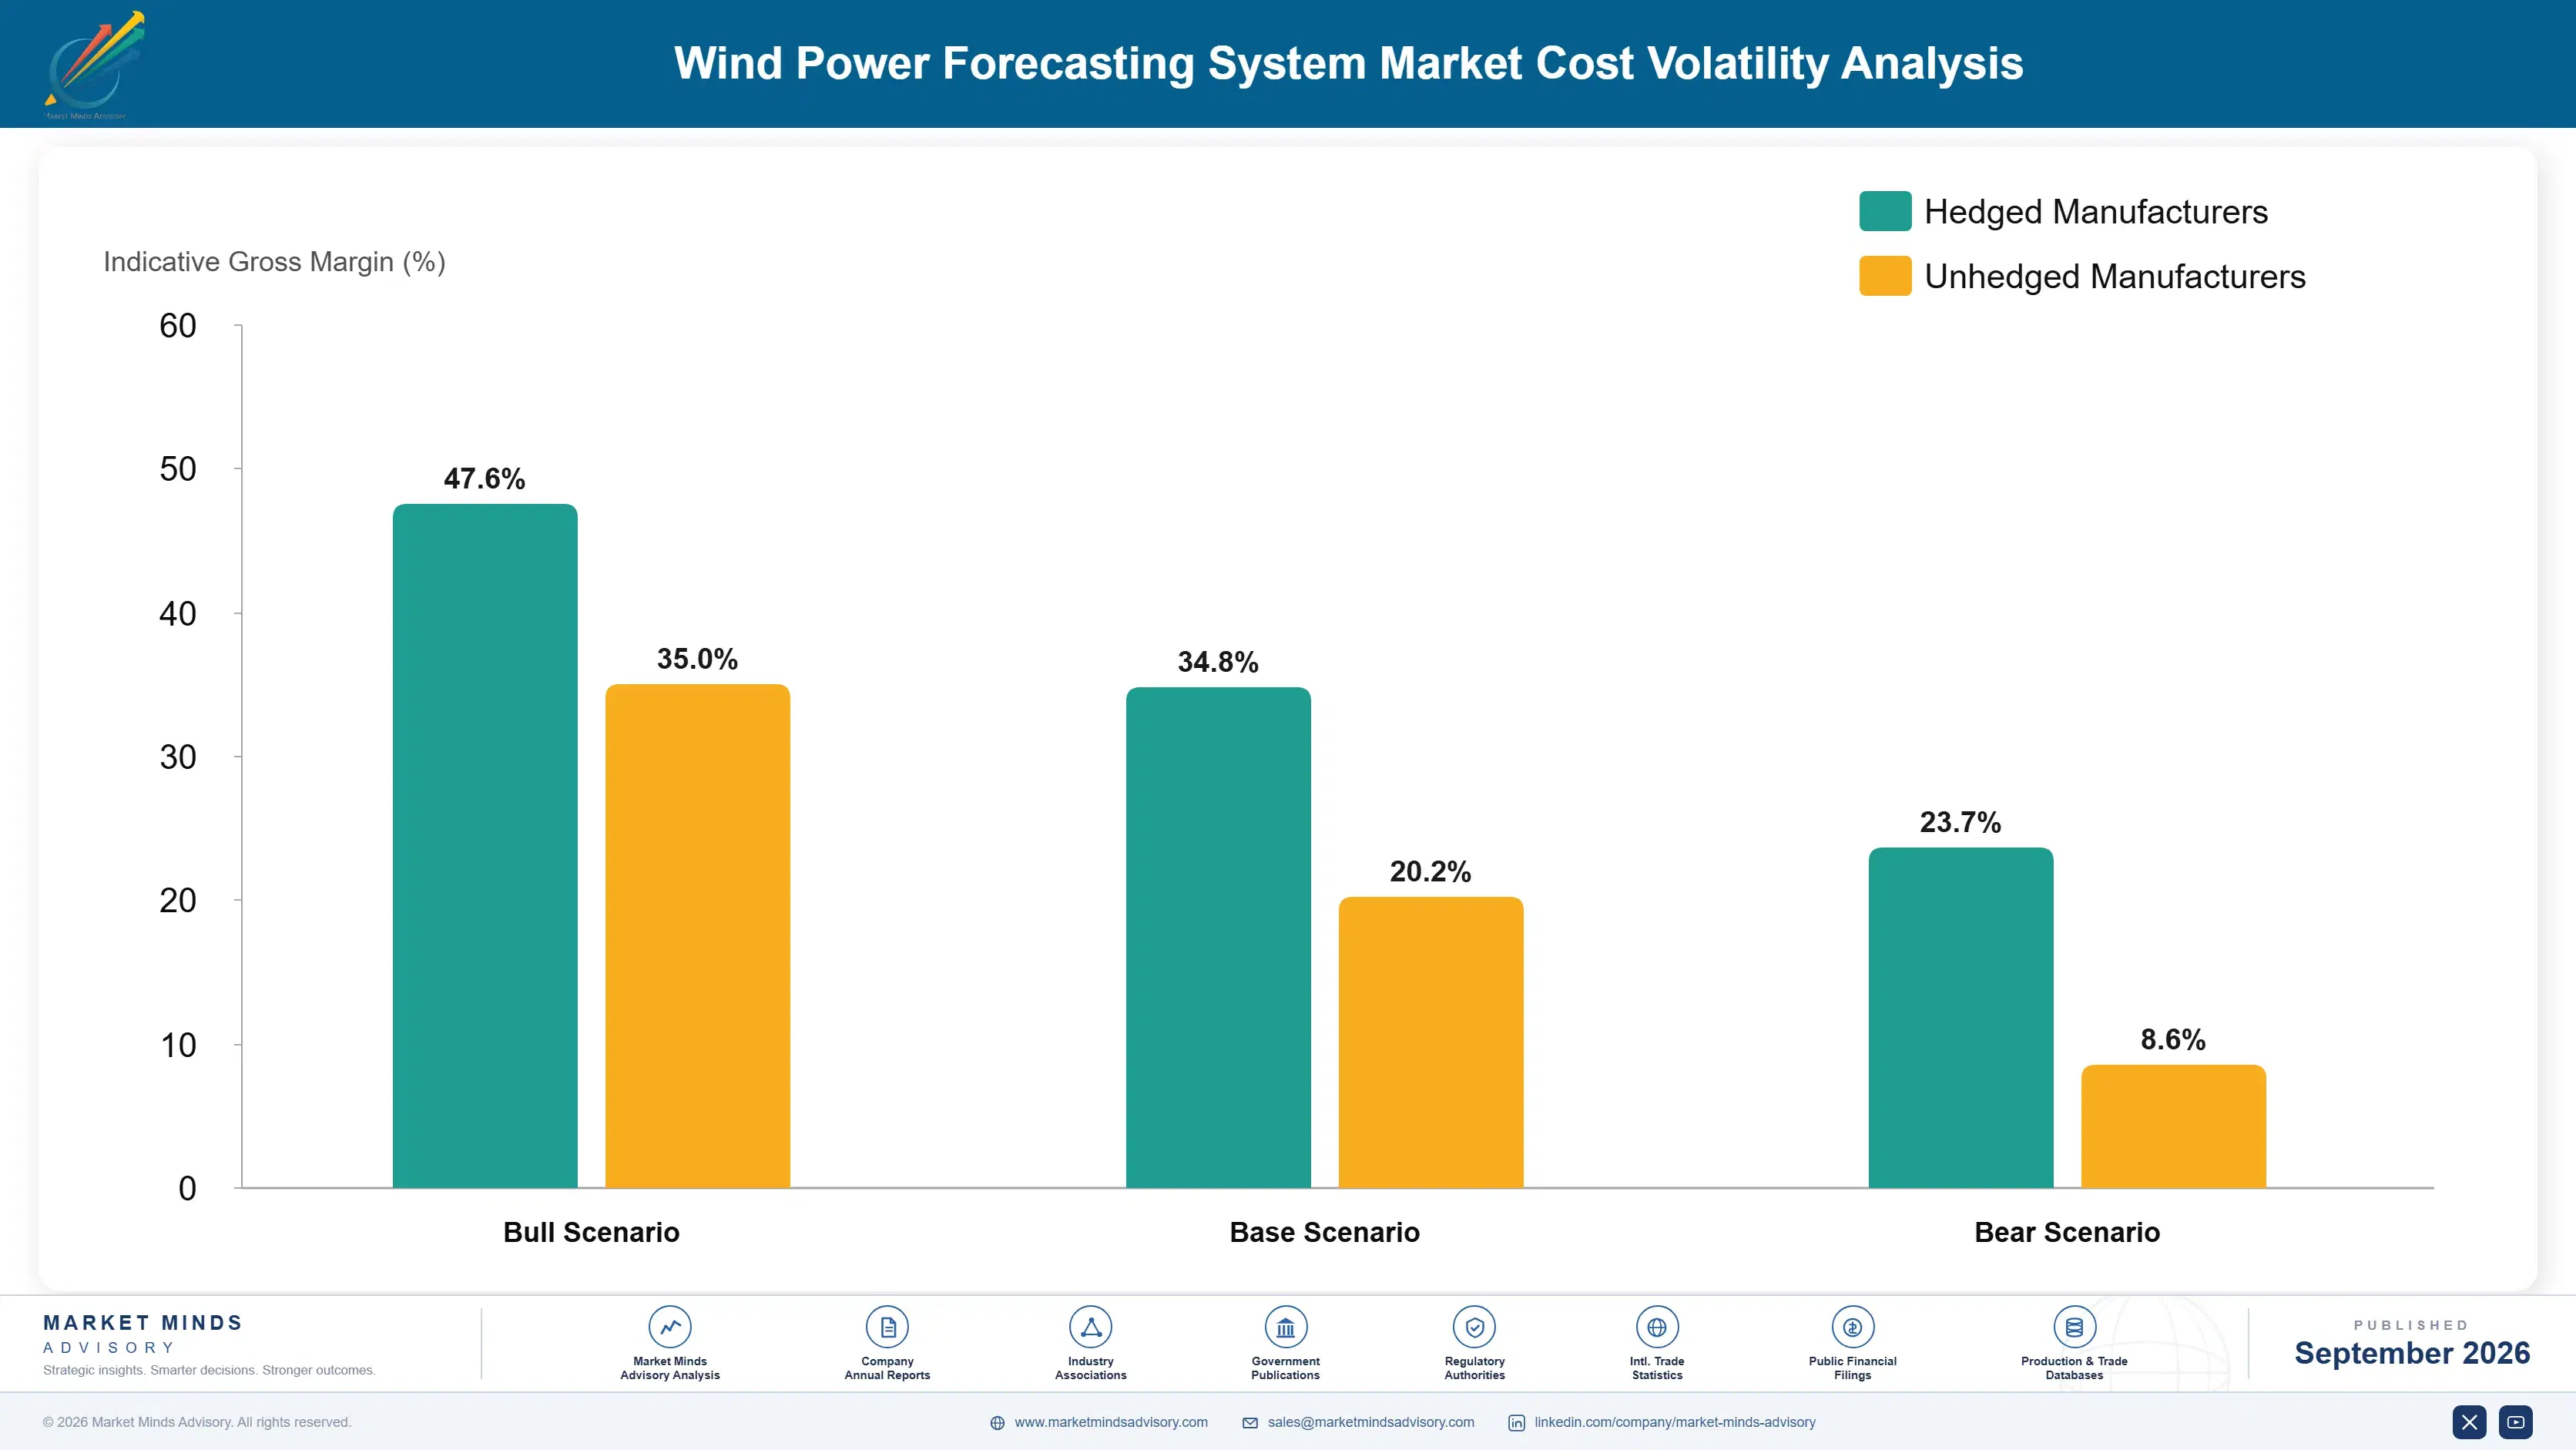
Scientific and engineering salaries account for roughly 46% of delivered cost, numerical weather prediction data licensing around 17%, and compute for model running a further 15%. Observation data purchase and satellite feeds make up most of the remainder. The cost base is people and data rather than infrastructure, which means it scales badly with customer count and very well with capacity under contract from existing customers.
Compute pricing through the recent period behaved differently from expectations across this sector. Demand for accelerated computing from artificial intelligence development pushed availability and pricing in ways meteorological workloads had never faced, while US Bureau of Labor Statistics wage data recorded parallel movement in scientific salaries. Vendors with reserved capacity and stable teams absorbed it. Those scaling into growth faced both lines moving at once.

The disadvantage falls on customer count rather than on efficiency. A vendor serving many small operators runs the same models and carries far higher support and onboarding cost per megawatt under contract than one serving a handful of large fleets. Neither position is wrong and they demand entirely different cost structures. Most have accumulated the first while budgeting as though they built the second.
wind-power-forecasting-system-market-cost-volatility-analysis-1788234761488

Reserve compute capacity ahead of model expansion

Compute is 15% of cost and its availability now competes with artificial intelligence workloads that meteorological modelling never previously contended with. Reserved capacity agreements cost a commitment against spot flexibility and remove a supply risk that has already delayed model upgrades at several vendors. The commitment is easier to justify than an outage during a settlement period is to explain.

License weather data across the whole customer base

Numerical weather prediction licensing is 17% of cost and is frequently purchased per product or per region rather than negotiated once across everything a vendor runs. Consolidated licensing at enterprise terms reduces a line most vendors treat as fixed. It is straightforward procurement work that a scientific organisation tends not to prioritise until somebody looks at the invoices properly.

Automate onboarding before growing customer count

Support and onboarding cost scales with the number of operators served rather than with megawatts under contract, so a vendor winning many small customers accumulates cost faster than revenue. Self-service onboarding, automated data connection and standardised reporting cost engineering time once. Building them after the support organisation has grown is far harder than building them before it does.

Portfolio Architecture for Margin Defence

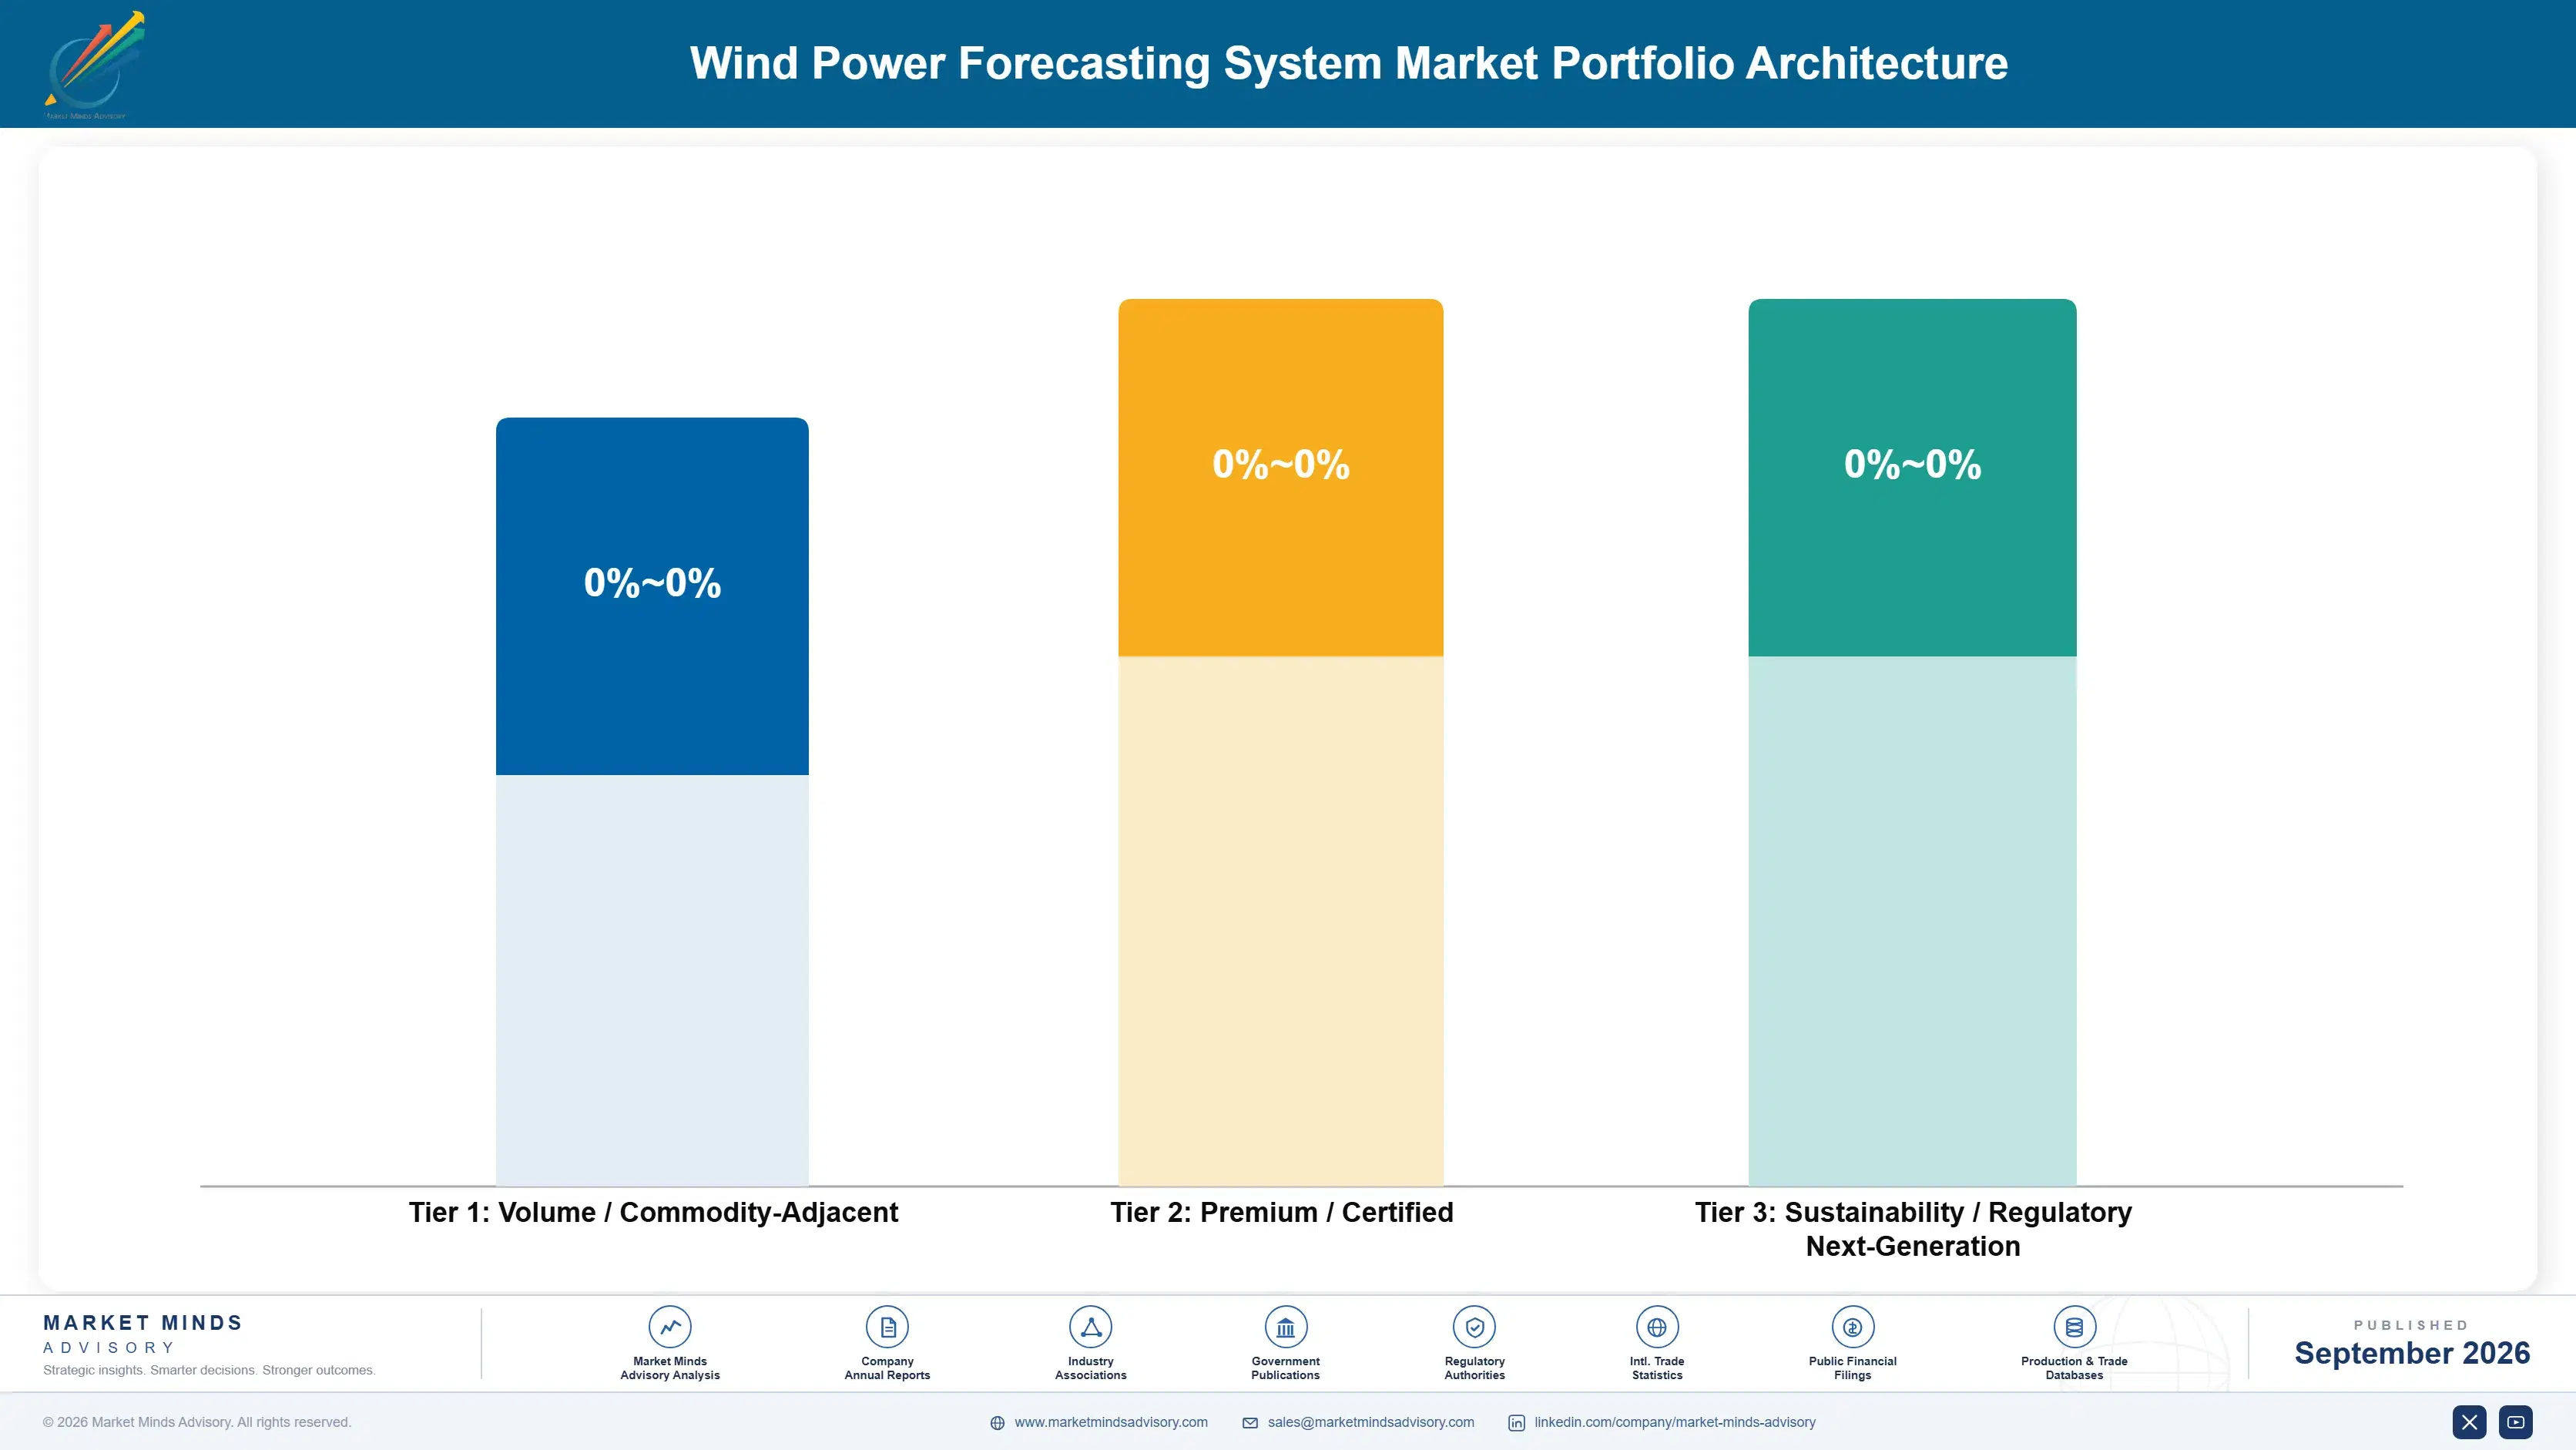
Margin here follows market design rather than model quality, which is uncomfortable for a business full of scientists. The same forecast sold into a market with severe imbalance penalties earns several times what it earns in a market where deviation costs little, on identical delivery cost. Participants pricing by jurisdiction rather than by megawatt under contract run a completely different business from those with one global rate card.
Volume and premium pull against each other through the ensemble rather than the product line. Day-ahead forecasting is close to a commodity and it is how most vendors enter an account, and that entry is what earns consideration when the buyer adds a sub-hourly product later. Refusing the commodity horizon saves margin and removes the route into accounts that only ever buy nowcasting from vendors they already run.

High-value pools sit in nowcasting, in regulatory reporting services and in ensemble consulting almost nobody offers. The third is genuinely unclaimed: buyers running 3.4 forecasts need help weighting and combining them, and the vendor that advises on the blend rather than merely supplying a member of it occupies a position of considerable influence over what gets bought.

Volume / Commodity-Adjacent

Day-ahead and multi-day forecasting built on numerical weather prediction, where several vendors perform within a point of each other. Buyers treat it as a commodity and price accordingly. The 9 point spread reflects whether weather data is licensed at enterprise or per-product terms.
Gross Margin: 44 to 53%

Premium / Certified

Intraday forecasting and ramp alerting where method diversity genuinely differs between providers and buyers pay for a distinct contribution to their blend. Differentiation rather than accuracy supports the price. The 9 point spread reflects the severity of imbalance penalties in the served market.
Gross Margin: 56 to 65%

Sustainability / Regulatory / Next-Generation

Nowcasting on proprietary observation, regulatory compliance reporting and ensemble weighting advisory sold to buyers running several vendors. Margins are high because data access and independence are both scarce. The 18 point spread separates forecast delivery from advisory and reporting services entirely.
Gross Margin: 62 to 80%
wind-power-forecasting-system-market-portfolio-architecture-1788234761988

High-value Sub-segments and Strategic Watch-out

Nowcasting and Sub-Hourly Forecasting

High value and high growth at 17.4%. Shortened settlement and co-located batteries put real money on this horizon, and access to live turbine data rather than modelling skill is what constrains supply. The 8 point spread reflects whether the vendor holds contractual data access or relies on substitutes.
Gross Margin: 66 to 74%

Intraday Forecasting

High value with strong growth at 13.6%. Methods genuinely differ between competing providers at this particular horizon, which is exactly why buyers blending several vendors will pay properly for a distinct contribution. The 8 point spread reflects imbalance penalty severity in the market being served.
Gross Margin: 58 to 66%

Day-Ahead Forecasting

The volume core. It earns modestly and it is how nearly every vendor first enters an account, before selling anything at the horizons that actually pay. The 8 point spread reflects weather data licensing terms, which decide these economics considerably more than modelling ever does.
Gross Margin: 42 to 50%

Seasonal and Long-Range Forecasting

The strategic watch-out. Skill at these horizons is genuinely limited by atmospheric predictability rather than by modelling effort, and buyers across the sector increasingly understand that. The 26 point spread separates financial and hedging applications that pay well from operational planning uses that barely pay at all.
Gross Margin: 34 to 60%

Annual Terms, Blended Purchases

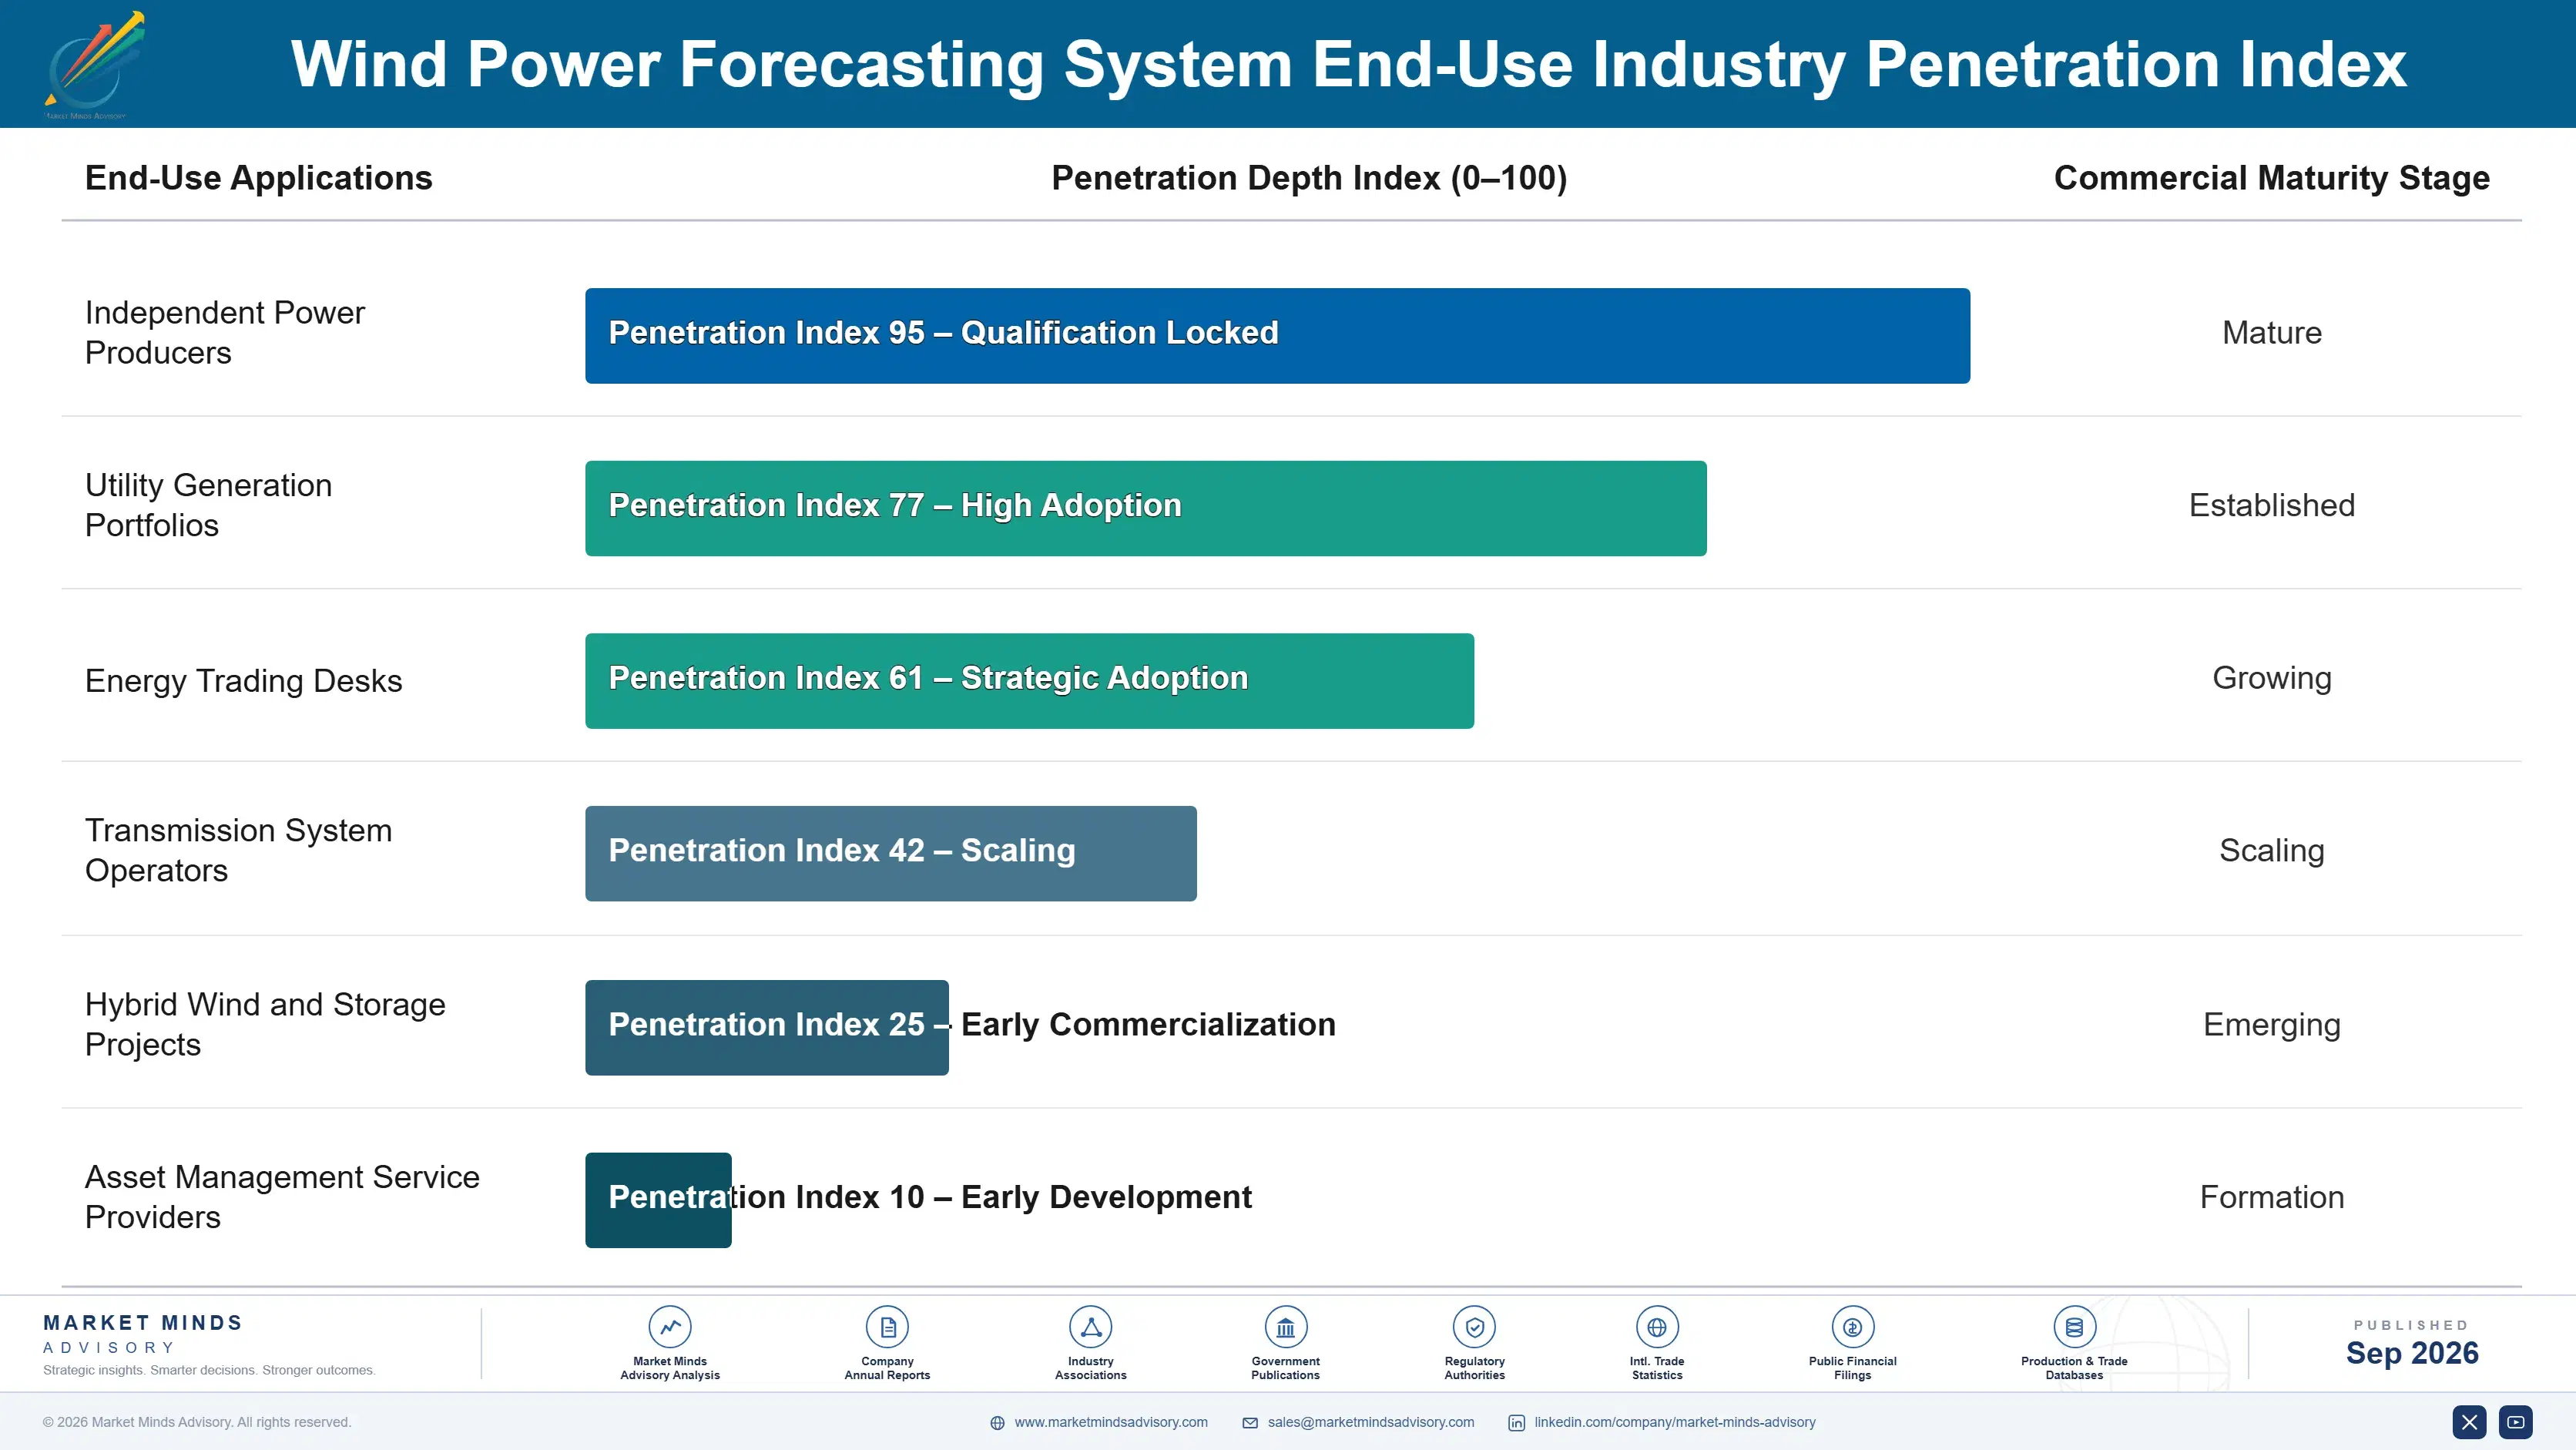
The annuity here is annual and unusually stable at 84% renewal, and the reason is that the forecast feeds a trading or dispatch process that runs every day without pause. Removing a vendor means rebuilding a blend, revalidating weights and explaining a change to a risk committee, which nobody does casually. The revenue is recurring, predictable and quietly vulnerable to the buyer deciding to build the whole thing internally.
Stickiness varies enormously by whether the buyer blends. A single-vendor buyer is genuinely at risk at every renewal and knows it. A buyer running 3.4 vendors in an ensemble rarely removes one, because each contributes decorrelated error and dropping any member measurably degrades the combination. Being inside a blend is therefore far safer than being somebody's sole provider, which is the opposite of conventional commercial wisdom.

Buyer profiles have shifted from asset operations toward trading desks and increasingly toward internal data science teams, and vendors have not entirely adjusted. An operations manager asked about availability and reporting. A trader asks about error distribution during ramp events and correlation with other providers. A data scientist asks why the vendor should exist at all, which is a considerably harder conversation to open.
wind-power-forecasting-system-market-end-use-penetration-index-1788234762475

How To Sell A Forecast

These are among the four positions where our research anticipates prominent divergence between winners and laggards over the coming forecast period. Each is grounded in the demand model, the regulatory perimeter, and the announced capacity pipeline.
01 / ENSEMBLE POSITION SELLING

Prove you are different, not better

Sophisticated buyers run forecasts from an average of 3.4 independent vendors and combine them, which means a model closely resembling the market incumbent contributes nothing to that ensemble regardless of how accurate it is on its own. Demonstrating decorrelation from the leaders, and quantifying what a buyer's existing blend gains by adding you specifically, is a completely different proposition from the comparative accuracy chart nearly everybody still opens with. That accuracy chart describes something the buyer is never actually going to do.
02 / JURISDICTIONAL RULE PRICING

Charge what the settlement rules make it worth

A percentage point of forecast accuracy is worth around USD 2.40 per megawatt hour of deviation in markets with severe imbalance penalties and close to nothing in markets without them, yet most vendors price per megawatt under contract on essentially the same basis everywhere they operate. Pricing against locally avoided imbalance cost captures far more value in the severe markets and wins volume in weak ones that flat pricing loses entirely. Modelling each market's settlement rules is roughly a week of work per jurisdiction.
03 / TURBINE DATA ACCESS

Write the data clause before commissioning

Nowcasting grows at 17.4% and depends entirely on live turbine output that belongs to the asset owner or to the turbine manufacturer, and manufacturers marketing competing forecasting products have already restricted what independent vendors receive from their fleets. The moment to secure access is at project financing, when data clauses go into service agreements before anybody is competing over them and owners will sign without hesitation. Negotiating afterwards means negotiating with a party that holds every possible reason to refuse.
04 / INTERNAL BUILD DEFENCE

Price below the team they would hire

Large utilities and trading houses build forecasting internally because the published models, their own data and a few data science salaries look cheaper than a subscription priced across a substantial fleet. Every buyer that makes that decision is lost permanently rather than temporarily, which is entirely different from losing a renewal to a competitor. Pricing visibly below a two person team, combined with ensemble diversity no internal group can supply itself, changes the calculation before anybody in procurement has run it.

Engagement Snapshot From the Field

A live engagement with an industry participant carrying material or product regulatory and market exposure ahead of a defining policy shift, showing how our research translates into a defensible multi-year portfolio strategy.
MARKET MINDS ADVISORY · CLIENT ENGAGEMENT SUMMARY
Wind Power Forecasting System Producer Strategic Portfolio Review and Transition Roadmap 2026·Investment Scenario on Wind Power Forecasting System Exposure Evaluation 2025-26
CLIENT PROFILE
A European wind power forecasting vendor serving operators and traders across six markets, with annual recurring revenue in the low tens of millions of euros and forecast accuracy independently benchmarked among the best available (client-reported, unverified by MMA). Win rates in competitive evaluations were nonetheless falling year on year. Management could not explain the gap.
STRATEGIC CHALLENGE
The client won accuracy benchmarks and lost contracts, frequently to vendors whose published error statistics were visibly worse. Management had responded by investing further in model development, which improved the benchmarks again and changed nothing commercially. They needed to understand what buyers were actually evaluating when they chose. Something else was clearly being evaluated.
MMA APPROACH
MMA reconstructed every competitive evaluation across three years, examining what the buyer purchased afterwards and how the client's forecast correlated with the vendors that won. Forty-seven expert interviews with traders, asset operators, system operators and competing vendors established how forecasts were actually selected, weighted and combined in practice. The pattern was consistent.
KEY FINDINGS
  1. Some 78% of buyers ran ensembles from multiple vendors, and the client's model correlated closely with the two largest incumbents already in most blends.
  2. Vendors winning against the client had visibly worse standalone accuracy and used methods decorrelated from the incumbents, which improved the buyer's combination.
  3. The client applied one price per megawatt across all 6 markets, despite imbalance penalties differing by a factor of roughly 5 between them.
  4. Three accounts lost in the period had built forecasting internally rather than switching vendor, and none of them had been approached with a price defence.
CLIENT PROFILE
A European wind power forecasting vendor serving operators and traders across six markets, with annual recurring revenue in the low tens of millions of euros and forecast accuracy independently benchmarked among the best available (client-reported, unverified by MMA). Win rates in competitive evaluations were nonetheless falling year on year. Management could not explain the gap.
STRATEGIC CHALLENGE
The client won accuracy benchmarks and lost contracts, frequently to vendors whose published error statistics were visibly worse. Management had responded by investing further in model development, which improved the benchmarks again and changed nothing commercially. They needed to understand what buyers were actually evaluating when they chose. Something else was clearly being evaluated.
MMA APPROACH
MMA reconstructed every competitive evaluation across three years, examining what the buyer purchased afterwards and how the client's forecast correlated with the vendors that won. Forty-seven expert interviews with traders, asset operators, system operators and competing vendors established how forecasts were actually selected, weighted and combined in practice. The pattern was consistent.
KEY FINDINGS
  1. Some 78% of buyers ran ensembles from multiple vendors, and the client's model correlated closely with the two largest incumbents already in most blends.
  2. Vendors winning against the client had visibly worse standalone accuracy and used methods decorrelated from the incumbents, which improved the buyer's combination.
  3. The client applied one price per megawatt across all 6 markets, despite imbalance penalties differing by a factor of roughly 5 between them.
  4. Three accounts lost in the period had built forecasting internally rather than switching vendor, and none of them had been approached with a price defence.
RECOMMENDED STRATEGY
Phase 1: Phase one: measure and publish correlation against the major incumbents, and sell the client's contribution to a blend rather than its standalone accuracy. Phase 2: Phase two: reprice each of the 6 markets against locally avoided imbalance cost, rather than applying a single rate everywhere. Phase 3: Phase three: identify accounts capable of building internally and price defensively against a two person team before the evaluation begins.
OUTCOME
Within five quarters win rates recovered above their previous level and revenue per megawatt rose in the three severe imbalance markets (client-reported, unverified by MMA). Model development spending was reduced. No further accounts were lost to internal build during the period. Correlation reporting is now published with every proposal the client submits.

Frequently Asked Questions

Foundational context covering the market sizes, CAGR, scope, country, region and competition that inform every finding below. This section is provided to cover basics and most often pre-purchase conversations, answered from the MMA Primary Research Dataset.

What is the current size of the Wind Power Forecasting System Market?

The global wind power forecasting system market was valued at USD 1.3 billion in 2025, covering software and services predicting wind generation output across operational horizons. The 2026 figure reaches USD 1.45 billion.

How large will the Wind Power Forecasting System Market be by 2036?

MMA forecasts USD 4.35 billion by 2036, an increase of USD 2.90 billion over the 2026 base. That represents an expansion multiple of 3.00 times across the forecast period.

What is the CAGR for the Wind Power Forecasting System Market 2026 to 2036?

The base case compound annual growth rate is 11.6%, with a bull case at 12.8% and a bear case at 10.4%. Historical growth between 2020 and 2025 ran at 10.2%.

Which segment is growing fastest?

Nowcasting and sub-hourly forecasting grows at 17.4%, half again the market rate of 11.6%, because settlement periods shortened and co-located batteries arrived. Intraday follows at 13.6%.

Who are the major companies in the Wind Power Forecasting System Market?

Vaisala, DNV, UL Solutions, Enfor and Meteologica lead on capacity under forecast contract, with combined CR5 of 36%. Concentration is low because buyers deliberately blend several vendors.

Which country is growing fastest?

India grows fastest at 13.8%, where deviation settlement charges make forecasting a direct cost avoidance measure for every wind operator. South Asia and Pacific leads regionally at 13.8%.

Report Segmentation Architecture

The full report scope spans multiple orthogonal segmentation dimensions, with cross-tabulated demand data provided for each dimension pair. Coverage extends further to regional breakdowns, trend trajectories, and the competitive detail needed to support segment-level decision-making.

By Forecast Horizon

  • Nowcasting and Sub-Hourly Forecasting
  • Intraday Forecasting
  • Day-Ahead Forecasting
  • Short-Term Two to Seven Day Horizons
  • Seasonal and Long-Range Forecasting
  • Ramp Event and Extreme Weather Alerting

By End-Use Industry

  • Independent Power Producers
  • Utility Generation Portfolios
  • Energy Trading Desks
  • Transmission System Operators
  • Hybrid Wind and Storage Projects
  • Asset Management Service Providers

By Commercial Dimension

  • Annual Subscription Contracts
  • Per Megawatt Pricing
  • Performance Linked Agreements
  • Regulatory Reporting Services
  • Data Feed Licensing
  • Ensemble Advisory Services

By Region

  • North America
  • Western Europe
  • East Asia
  • South Asia and Pacific
  • Latin America
  • Middle East and Africa
  • Eastern Europe

Scope, Methodology, and Coverage

Every figure in this report is reproducible from documented input assumptions. The scope below maps the historical period, the forecast horizon, the segmentation dimensions, and the countries covered, alongside the underlying primary and qualitative methodology.
Historical Period
2020 to 2025
Forecast Period
2026 to 2036
Base Year
2025 (USD billions; MMA Primary Research Dataset, September 2026)
Market Definition
The wind power forecasting system market covers software, data services and platforms that predict the electrical output of wind generation assets across operational horizons, spanning nowcasting and sub-hourly forecasting, intraday forecasting, day-ahead forecasting, short-term horizons of two to seven days, seasonal and long-range forecasting, and ramp event and extreme weather alerting. Scope covers subscription, licence and service revenue for operational forecasting. Excluded are wind resource assessment for project development, meteorological measurement hardware and lidar equipment, general numerical weather prediction services sold outside power markets, energy trading platforms, and turbine control systems.
Quantitative Units
USD billion, 2025 base year, 2026 to 2036 forecast period
Segmentation Dimensions
Forecast horizon, buyer type, commercial model, region
Regions Covered
North America, Western Europe, East Asia, South Asia and Pacific, Latin America, Middle East and Africa, Eastern Europe
Countries Covered
United States, Canada, Germany, United Kingdom, Spain, Denmark, Netherlands, Poland, China, Japan, South Korea, India, Australia, Brazil, Chile, Egypt, Morocco, South Africa
Key Companies Profiled
20 companies across forecasting specialists, turbine manufacturers and technology providers
Quantitative Methodology
Primary survey, n=3,800 respondents, Q4 2025, six countries; demand-side model with trade association cross-validation
Qualitative Methodology
47 expert interviews, Q4 2025; applied to validate demand model assumptions, identify emerging dynamics, and assess competitive positioning
Report Format
PDF and XLSX data workbook (Word format preview document)
Publisher
Market Minds Advisory
Report Code
MMA-2026-TEC-571
Published
September 2026
Contact
sales@marketmindsadvisory.com | www.marketmindsadvisory.com

Purchase the full Wind Power Forecasting System Market Report (2026 to 2036).

The full MMA report on the wind power forecasting system market runs to detailed horizon and regional models across the 2026 to 2036 forecast period, with pricing benchmarks separated by market design and imbalance penalty severity. It profiles 20 companies on a consistent capacity under contract basis, covering forecasting specialists, turbine manufacturers and technology providers. Ensemble purchasing behaviour is analysed alongside the settlement rules that determine what accuracy is actually worth. Regional chapters cover the seven MMA regions with country-level detail on the eighteen markets surveyed. Primary research draws on a quantitative survey of 3,800 respondents across six countries and 47 expert interviews conducted in Q4 2025.
Pricing benchmarks by market design and imbalance penalty severity
Ensemble purchasing behaviour analysed across buyer types and regions
Forecast error benchmarks compared across horizons and vendor methods
Twenty company profiles on consistent capacity under contract basis
Turbine data access terms mapped by manufacturer and service agreement
Seven regional chapters with eighteen country detail tables

Built For The People Who Decide

From boardroom strategy to bench-side execution, this report is read cover-to-cover by leaders shaping the next decade of their industry, turning demand scenarios, market dynamics and valuation benchmarks into decisions.
CXOs/ Presidents/ VPs/ Managers
M&A and Corporate Development
Strategy Teams and R&D Heads
Procurement and Product Directors
Regulatory and Compliance Leaders
Investor Relations and Equity Analysts