

Market Minds Advisory
Welding Materials Market

Welding Materials Market: Sold By The Kilogram, Consumed By The Hour

Filler metal is about a tenth of what a welded joint costs and welder time is roughly three quarters of it, yet purchase orders are still written and won on price per kilogram.

Lead Analyst

Published

September 2026

Make Smarter Decisions with Customized Research Insights

Request a free sample report and evaluate market opportunities, growth trends, and competitive dynamics relevant to your business needs.

2025 MARKET VALUE$15.8BMarket Size 2025
2036 FORECAST VALUE$25.4BBase Case , 2026 to 2036
CAGR 2026 TO 20364.4 %Bull 5.6% / Bear 3.2%
INCREMENTAL OPPORTUNITY$8.9BNet 10- year value creation
EXPANSION MULTIPLE1.54x2036 value over 2026 base
Strategic Levers
M&A Pipeline
Regional Outlook
Country Rankings
Competitive Intelligence
Segmental Deep-dive
Call-Us : 91 93563 13602

Executive Snapshot and Market Trajectory

Filler metal is roughly 12% of what a welded joint costs and welder time accounts for about 74%. A wire priced a quarter higher that deposits a third faster is dramatically cheaper per metre, and the purchase order still says price per kilogram. That gap defines the category.
The binding constraint is people rather than steel. Median welder age across industrialised countries sits near 54 and replacement is not happening at anything like the rate required, which is why consumables letting fewer welders lay more metal keep taking share. Flux-cored wire grows fastest at 6.6%, half again the market rate, and covered electrodes grow at 1.8%. Nothing about that demographic reverses within the forecast period.
Approvals are what protect margin. Pressure vessel, offshore, nuclear and hydrogen service grades require qualification running around three years per grade per plant, which no competitor shortcuts with price. China dominates production and consumption on shipbuilding and construction volume, holding 34% of demand. India grows fastest at 7.8% on yard and infrastructure capacity. Suppliers without an approval portfolio compete permanently on kilogram price against Asian producers who set the cost structure.
Market Definition
Consumable materials used to make welded and brazed joints, covering covered electrodes, solid wire, flux-cored wire, submerged arc wire and flux, tungsten inert gas rods and filler metals, and brazing and hardfacing alloys. Measured at manufacturer selling value. Welding power sources, torches, robots and automation equipment, shielding and industrial gases, and personal protective equipment are excluded from scope.
Base Year Value
$15.8B in 2025 (MMA Primary Research Dataset, August 2026)
Forecast Period
2026 to 2036, eleven discrete annual values
CAGR
4.4% base case. Bull 5.6%. Bear 3.2%.
Fastest Growth Segment
Flux-Cored Wire: 6.6% CAGR
Fastest Growth Country
India: 7.8% CAGR
Fastest Growth Region
South Asia and Pacific: 6.6% CAGR
Largest Region
East Asia: 34% of 2025 global value
Market Leaders
Lincoln Electric, ESAB, Kobe Steel, Illinois Tool Works, voestalpine Bohler Welding. Source: MMA Primary Research Dataset, July 2026.
Primary Survey
n=3,800 procurement and R&D decision-makers, Q4 2025, six countries
Methodology
Demand-side build-up, cross-validated against public data, 47 expert interviews

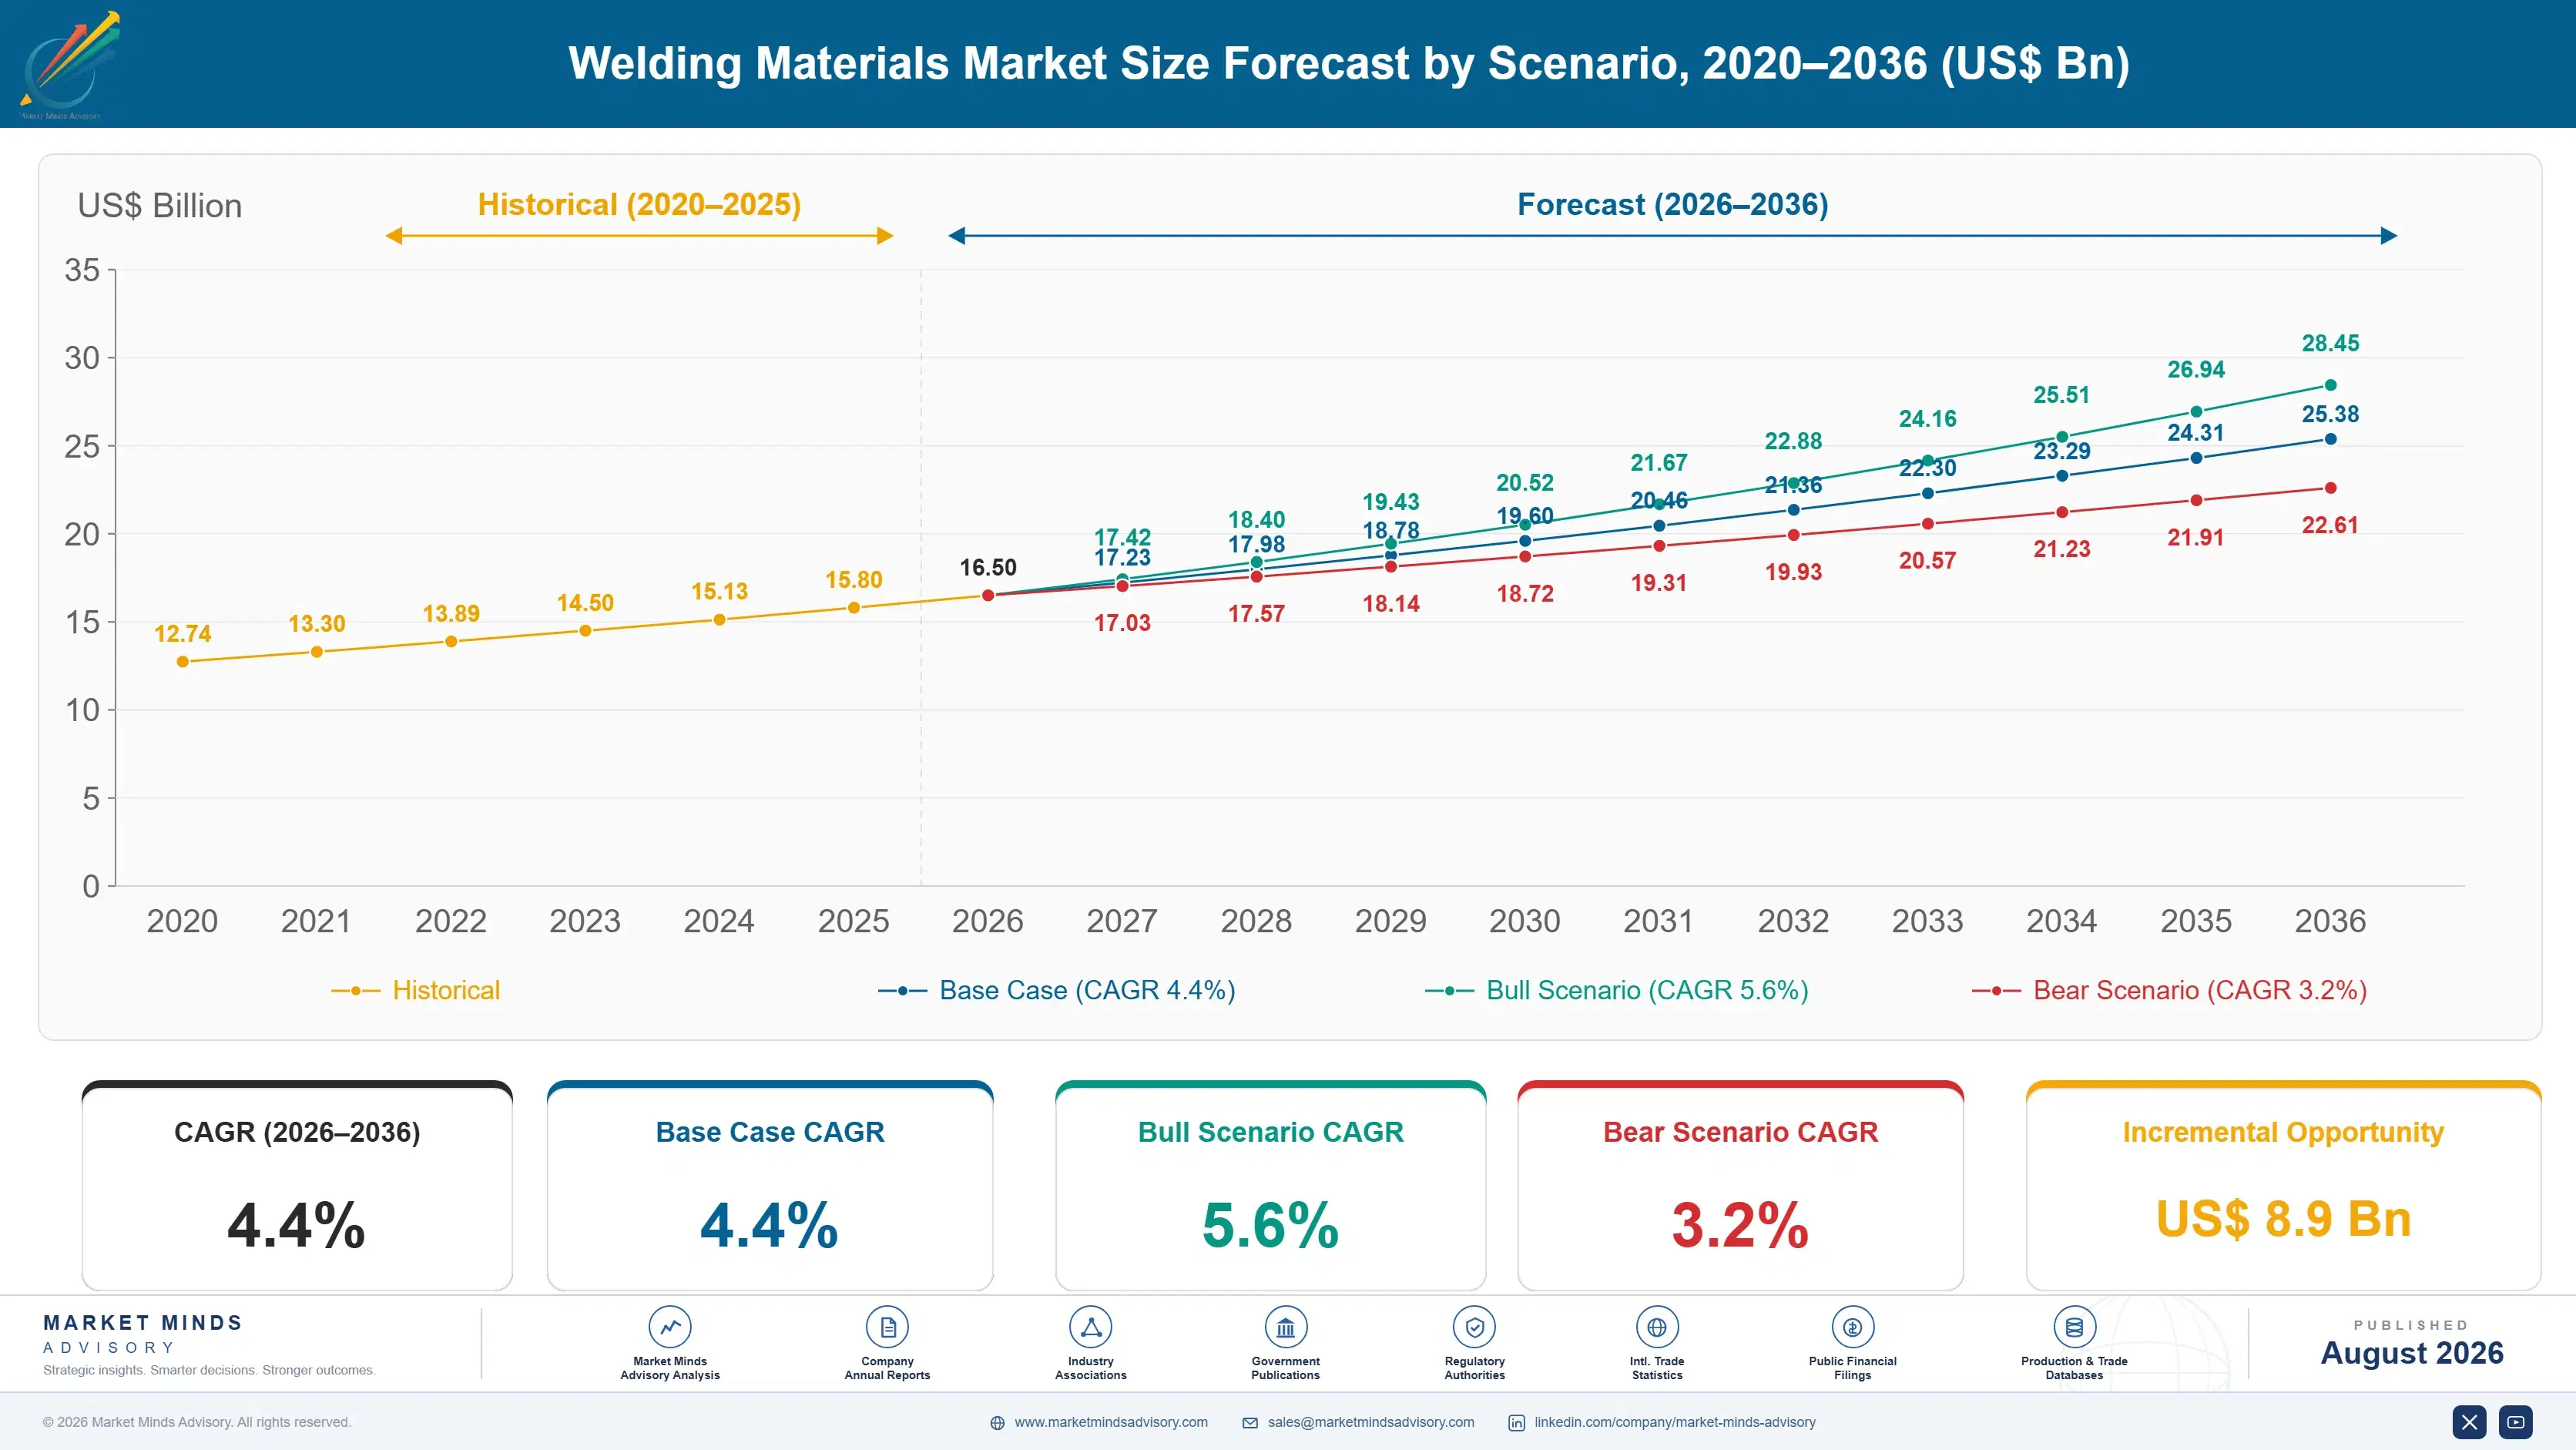
Welding Materials Market Forecast Scenarios

welding-materials-market-size-forecast-scenario-1787664903530
The five years to 2025 tracked heavy fabrication activity and an alloy cost disruption that reset stainless and nickel bearing pricing for two seasons. Chinese shipbuilding and construction carried volume while Western fabrication grew slowly against a shrinking welder workforce. The 3.4% historical rate mixes genuine Asian tonnage growth with Western value growth that came largely from alloy pass through rather than from any increase in metal actually deposited.
The 4.4% base case rests on three mechanisms. Process substitution continues as flux-cored and submerged arc consumables take share from covered electrodes at 6.6% and 5.2% respectively, driven by deposition rate rather than by joint quality. Indian shipbuilding, infrastructure and manufacturing capacity expands at 7.8%. And hydrogen and offshore wind fabrication creates demand for approved grades that carry considerably better margin than general purpose wire. None of the three is metallurgical.
The 5.6% bull case turns on hydrogen pipeline and storage construction reaching commitment at scale, since those grades require qualification few suppliers hold and command pricing general fabrication never will. The 3.2% bear case is alloy cost: nickel, chromium and molybdenum move violently and fabricators defer discretionary work when consumable pricing jumps, which delays tonnage rather than removing it.

The Cheapest Line On The Most Expensive Job

The arithmetic of a welded joint is well known and almost never used in purchasing. Filler metal is roughly 12% of the cost and welder time is about 74%, so a consumable priced a quarter higher that deposits a third faster produces a materially cheaper joint. Purchase orders are written in dollars per kilogram, and that is the number distributors quote, buyers compare and sales teams discount.
TOP FIVE CONCENTRATION36%Combined production capacity held by the leading suppliers
CONSUMABLE COST SHARE12%Filler metal as proportion of total welded joint cost
LABOUR COST SHARE74%Welder time as proportion of the same joint cost
MEDIAN WELDER AGE54 yearsTypical age across welding workforces in industrialised countries
GRADE APPROVAL TIMELINE3 yearsTypical qualification period per grade per production plant
STEEL INPUT COST SHARE58%Rod, strip and alloy against total goods cost
What is genuinely changing the category is demographic rather than technical. Median welder age across industrialised countries sits near 54, apprenticeship intake has not replaced retirement for two decades, and fabricators are managing a shrinking pool of skilled hands. Consumables that let fewer welders deposit more metal per shift therefore take share regardless of price per kilogram, which is why flux-cored wire grows at 6.6% while covered electrodes grow at 1.8%.
Margin sits in approvals rather than in metallurgy. Grades for pressure vessels, offshore structures, nuclear service and now hydrogen pipelines require qualification taking around three years per grade per production plant, and a fabricator working to code cannot substitute an unapproved product whatever it costs. That is the only part of this market where price per kilogram stops being the conversation entirely.
"Every fabricator knows the wire is the cheapest thing in the shop and buys it as though it were the most expensive. The consumable line is visible and the arc-on time is not, so the visible number gets managed."
Director, Industrial Materials and Fabrication Practice · MMA Chemicals and Materials Practice · August 2026

Market Trends

Wire Processes Displace Covered Electrodes Across Fabrication

Flux-cored and solid wire deposit metal considerably faster than covered electrodes and require no stub loss or rod changing, which converts directly into welder hours saved on jobs where labour is roughly 74% of joint cost. Flux-cored wire grows at 6.6% against a market rate of 4.4%, the fastest consumable in the category, while covered electrodes grow at 1.8% and survive mainly in maintenance, remote repair and site work where equipment portability decides. Every new fabrication shop specifies wire, and the substitution runs one direction only. No shop that converted has ever gone back.
Market Impact: Median welder age reaches 54 years

Approved Grades Separate Margin From General Purpose Wire

Consumables for pressure vessels, offshore structures, nuclear service and hydrogen pipework require qualification running around three years per grade per production plant, covering mechanical testing, impact properties and third party witness. A fabricator working to code cannot substitute an unapproved product at any discount, which removes price from the conversation entirely. Hydrogen service grades are the newest and least contested of these positions, since embrittlement behaviour demands properties that general purpose wire does not deliver. Suppliers without approval portfolios compete permanently on kilogram pricing instead. Price simply stops being the conversation in that tier.
Market Impact: India grows at 7.8% annually

Market Opportunities and Growth Drivers

Welder Scarcity Forces Deposition Rate Into Purchasing

Median welder age across industrialised countries sits near 54 and apprenticeship intake has not matched retirement for two decades, which leaves fabricators managing a shrinking pool of skilled hands rather than a shortage of steel or orders. Consumables letting fewer welders deposit more metal per shift take share on that basis regardless of kilogram price. Robotic and mechanised welding cells consume solid and flux-cored wire almost exclusively and never covered electrodes, which reinforces the same substitution from a completely different direction entirely. The scarce input here is a person rather than a material.
Market Impact: Consumable is 12% of joint cost

Indian Fabrication Capacity Expands Across Yards And Sites

Indian shipbuilding, infrastructure construction and manufacturing capacity have expanded together, with new yards, refinery projects and production incentive backed factories all creating welding demand simultaneously. India grows at 7.8%, faster than any market covered. Domestic producers including Ador Welding and D&H Secheron hold strong distribution positions while international suppliers compete on approved grades for pressure and offshore work. Cost sensitivity keeps covered electrodes more relevant here than in mature markets, though new fabrication shops specify wire from the outset just as elsewhere. Approved grades are the practical route in for any importer.
Market Impact: Alloy carries 58% of goods cost

Market Restraints and Challenges

Kilogram Pricing Defeats Total Cost Argument Repeatedly

Filler metal is around 12% of welded joint cost and welder time is about 74%, yet purchase orders, distributor quotes and buyer comparisons are all written in dollars per kilogram. The root cause is that consumable spend is visible on an invoice while arc-on time is buried in labour hours nobody attributes to a specific wire. Commercially this caps realisable price across general fabrication. Suppliers respond with deposition trials, cost per metre calculators and welder training support, which convinces engineers more readily than it convinces procurement. Engineers agree and buyers still sign.
Market Impact: Fastest consumable growing at 6.6%

Alloy Cost Volatility Transmits Directly Into Selling Price

Steel rod, strip and alloying elements account for roughly 58% of finished goods cost, and nickel, chromium and molybdenum can move violently within a single quarter. The root cause is that stainless and nickel bearing consumables carry exposure to metals traded on markets with no relationship to fabrication demand. Commercially this forces frequent price revisions that damage distributor relationships and delay fabricator ordering. Producers respond with alloy surcharge mechanisms, indexed contracts and inventory positioning, which manage the timing without removing the exposure. Distributor relationships absorb most of the damage from that.
Market Impact: Qualification runs about 3 years
3 additional market trends, 4 additional growth drivers, and 2 additional restraints and challenges are covered in the full report. Contact sales@marketmindsadvisory.com to access the complete intelligence.

Segment CAGR and Growth Architecture

Segmentation follows consumable type, since the consumable determines the welding process, the deposition rate achievable, which approvals apply and what manufacturing capability a supplier needs. Six types cover the category as traded. Growth tracks welder productivity rather than joint quality, which is not how the industry describes itself. Welder productivity is the actual variable here.
welding-materials-market-market-share-analysis-1787664904153

Flux-Cored Wire

Tubular wire containing flux, combining continuous feeding with slag protection that permits outdoor and positional work where solid wire struggles with wind and gas coverage. At 6.6% this is the fastest growing consumable, half again the market rate of 4.4%, and deposition rate rather than weld quality explains the position. Flux-cored deposits metal considerably faster than covered electrodes with no stub loss or rod changing, which converts directly into welder hours saved where labour is about 74% of joint cost. Shipbuilding, offshore structures and heavy fabrication have moved decisively toward it and none of them are moving back. Deposition rate rather than metallurgy is what moved an entire industry across.
CAGR 6.6%

TIG Rods and Filler Metals

Cut length filler rods for tungsten inert gas welding, used where joint quality, appearance and control matter more than deposition speed, principally in stainless, aluminium, titanium and nickel alloy work. Growth of 5.8% is second fastest in the category and it comes from application mix rather than from any productivity argument. Aerospace, semiconductor fabrication, pharmaceutical pipework and hydrogen service all specify tungsten inert gas processes and all are expanding. This is also the segment where approvals bite hardest, since these applications work to codes that make an unapproved consumable simply unusable at any price. Volume here is small relative to wire processes and margin per tonne runs considerably higher throughout.
CAGR 5.8%
Full segment breakdown across 6 segments available in the complete report.

Regional Architecture and Country Demand Map

East Asia holds 34%, above the standard band, because China alone produces and consumes an outsized share of global welding consumables on shipbuilding and construction volume. North America and Western Europe follow at 22% and 18%. India grows fastest at 7.8%. Approvals rather than tonnage carry margin.

North America

Energy, pipeline and heavy equipment fabrication carry this 22% share, alongside a substantial maintenance and repair business that keeps covered electrodes relevant longer than in most mature markets. The welder shortage is more acute here than almost anywhere, with median age near 54 and apprenticeship intake well below retirement, which pushes fabricators toward higher deposition consumables regardless of kilogram price. Approved grades for pressure and pipeline service command genuine premiums. Reshoring investment has added fabrication capacity in several states. Growth of 3.4% reflects productivity substitution rather than any expansion in tonnage welded. Productivity substitution rather than tonnage growth is what carries value across this region. Nothing here is growing by volume.
Share: 22% | CAGR: 3.4% (2026 to 2036)

Western Europe

Offshore wind, shipbuilding and precision machinery fabrication anchor this 18% share, with approvals culture running deeper here than in any other region. Classification society and pressure equipment directive requirements make grade qualification a routine cost of doing business rather than a differentiator, which raises the barrier for entrants and protects incumbents considerably. German, Italian and Nordic fabricators specify heavily on approvals rather than on price. Energy cost has weighed on regional steel and consumable production economics. Growth of 2.8% is the lowest of the seven regions and reflects mature fabrication with limited new capacity. Approvals here are a cost of entry rather than a differentiator, which quietly protects incumbents. Entry is slow here.
Share: 18% | CAGR: 2.8% (2026 to 2036)
Regional intelligence for 5 additional markets available in the complete report: East Asia, South Asia and Pacific, Latin America, Middle East and Africa, Eastern Europe. Contact sales@marketmindsadvisory.com.
welding-materials-market-country-cagr-analysis-1787664904785

Where This Category Still Earns

Nothing here is won on metallurgy alone, because the specifications are public and Asian producers make general purpose wire at scale. Value accrues to whoever shifts the conversation off kilogram price, whoever designs for a shrinking welder pool, whoever holds approvals, and whoever reaches fabrication capacity as it builds. Four routes carry weight. Metallurgy is not the variable.

Sell Deposition Rate Not Price Per Kilogram

Filler metal is roughly 12% of welded joint cost and welder time is about 74%, so a wire priced a quarter higher that deposits a third faster produces a cheaper joint by a wide margin. Purchase orders are written in dollars per kilogram because consumable spend appears on an invoice while arc-on time disappears into labour hours nobody attributes. Suppliers running deposition trials and cost per metre analysis reach the welding engineer rather than the buyer, and that is a different conversation with a different result. The engineer owns the labour budget.
Market Impact: Addresses the 74% labour share of joint cost

Build Grades For Fewer And Older Welders

Median welder age across industrialised countries sits near 54 and intake has not matched retirement for two decades, which makes the skilled hand the scarce input rather than steel or orders. Consumables that are forgiving of technique, run in more positions and suit mechanised deposition take share on that basis alone. Flux-cored wire grows at 6.6% against a market rate of 4.4% for exactly this reason. Robotic cells consume wire exclusively and never covered electrodes, which points the same direction from a different starting place. Demographics rather than any technology shift drive this one.
Market Impact: Serves a welding workforce averaging 54 years old

Hold Approvals Competitors Need Years To Obtain

Pressure vessel, offshore, nuclear and hydrogen service grades require qualification running around three years per grade per production plant, covering mechanical testing, impact properties and third party witness. A fabricator working to code cannot substitute an unapproved consumable at any discount whatsoever, which removes price from the conversation completely. Hydrogen service grades are the newest and least contested position available, since embrittlement behaviour demands properties general purpose wire does not deliver. Suppliers without approval portfolios compete permanently on kilogram price instead. Programmes run roughly 3 years per grade per plant and cannot be shortened with money.
Market Impact: Approvals take about 3 years for each grade

Follow Fabrication Capacity Into Indian Yards

Indian shipbuilding, infrastructure construction and production incentive backed manufacturing have expanded together, creating welding demand from several directions simultaneously, and India grows at 7.8% as a result. Domestic producers hold distribution and price position that importers cannot match on general purpose consumables. The route in is approved grades for pressure, offshore and shipbuilding work where domestic approval portfolios remain thinner. Arriving as a yard qualifies its welding procedures is worth considerably more than arriving afterwards with a cheaper quote. Domestic approval portfolios remain thinner than international ones, which is the gap worth entering through.
Market Impact: Captures the 7.8% Indian growth rate through 2036

Who Controls the Margin Pool

Concentration is moderate and split sharply by product tier. The top five hold 36% of production capacity, the basis applied consistently throughout this section, with the remainder divided between large Chinese producers supplying general purpose consumables at volume and regional specialists holding approvals in particular codes. Lincoln Electric leads on breadth across consumables and equipment together, and the gap reflects distribution reach and approval portfolio depth rather than metallurgy.
Competition runs on three fronts. Global producers compete on approval portfolios and technical service into code governed fabrication, which is where price stops being the deciding factor. Asian volume producers compete on cost in general purpose wire and electrodes, a contest decided before any technical discussion. And regional specialists compete on local distribution, delivery reliability and relationships with fabricators who order weekly.

Rankings will move with hydrogen and offshore approval positions rather than with capacity investment, since those grades require qualification that takes years and cannot be compressed by spending more. The other pressure point is alloy cost pass through, which favours producers with surcharge mechanisms and indexed contracts over those repricing manually into distributor relationships that resent it.
welding-materials-market-company-positioning-matrix-1787664905363

Competitive Moat and Risk Dimensions

LINCOLN ELECTRIC

Moat: Consumables And Equipment Together

Supplying welding power sources, automation and consumables as one offer creates positions inside fabrication shops that a consumable only competitor cannot reach, since equipment installed determines which consumables run through it for years afterwards. Approval portfolio depth across pressure and pipeline codes reinforces that on the technical side considerably.
LINCOLN ELECTRIC

Risk: Mature Market Weighting

Revenue concentrates in North American and European fabrication where tonnage welded is growing slowly and the welder workforce is shrinking, while the volume growth sits in Asian markets served largely by domestic producers on cost. Productivity substitution supports value without adding the tonnage that would justify significant capacity investment.
ESAB

Moat: Approval Portfolio Breadth

Grade approvals held across classification societies, pressure equipment codes and national standards represent years of qualification work per grade per plant that competitors cannot compress with capital. Offshore and shipbuilding positions in particular depend on approvals that a fabricator cannot substitute around whatever price a competitor offers instead.
ESAB

Risk: Alloy Cost Exposure

Stainless and nickel bearing consumables carry direct exposure to metals that move violently on markets unrelated to fabrication demand, and repricing into distributor relationships repeatedly damages them. Producers without well established surcharge mechanisms absorb the timing difference between input cost movement and price realisation into margin.

Players Tracked

Prominent Players

Lincoln Electric
ESAB
Kobe Steel
Illinois Tool Works
voestalpine Bohler Welding

Other Key Players

Air Liquide Welding
Nippon Steel Welding and Engineering
Kiswel
Hyundai Welding
Tianjin Bridge Welding Materials
Atlantic China Welding Consumables
Gedik Welding
Ador Welding
D&H Secheron Electrodes
Sidergas
Magmaweld
Zhejiang Kingstone Welding
Huatong Welding
Metrode Products
Harris Products Group

Recent Developments

FEBRUARY 2025

Producer qualifies consumable grade for hydrogen pipeline service

A consumables producer completed qualification of a filler metal grade for hydrogen pipeline service, covering embrittlement behaviour and mechanical properties under hydrogen exposure. Grade approval runs around three years per plant, and hydrogen service remains the least contested approval position available in the category today.
Signal: Approvals cannot be compressed with capital, which is precisely what makes them worth holding for as long as possible
MAY 2025

Shipyard converts structural welding from electrodes to flux-cored

A shipyard converted structural welding from covered electrodes to flux-cored wire across its main fabrication halls, citing deposition rate and welder availability rather than joint quality. Labour accounts for roughly 74% of welded joint cost, which is what makes the substitution arithmetic work so decisively.
Signal: Substitution runs one direction only and no yard that converted has ever gone back to covered electrodes
SEPTEMBER 2025

Indian yard expansion qualifies welding procedures with new suppliers

An Indian shipyard expansion qualified welding procedures alongside consumable suppliers as it commissioned additional capacity, fixing supply relationships before production began. India grows at 7.8% annually, faster than any market covered in this report. Qualification fixes the consumable classification and frequently the brand before any production begins at all.
Signal: Arriving during procedure qualification is worth far more than arriving later with a cheaper quote once volume begins

What Filler Metal Costs To Make

Steel rod, strip and alloying elements account for 58% of finished goods cost, with energy, flux minerals, copper coating and drawing consumables carrying most of the remainder. Nickel, chromium and molybdenum drive alloy exposure on stainless grades, and those metals trade on markets with no relationship to fabrication demand. Steel rod supply is regional and reliable, while alloy supply concentrates in a few countries.
The last alloy disruption showed how violently that transmits. Nickel pricing moved to levels that briefly disrupted orderly trading, and producer annual reports across the welding and stainless sectors documented surcharge introductions, order suspensions and margin compression. IEA data recorded the European energy costs that compounded it for producers running drawing and annealing operations. Fabricators deferred discretionary work rather than absorbing consumable prices that had moved within a single quarter.

Exposure divides by product mix and by contract mechanism rather than by scale. Producers weighted toward stainless and nickel bearing consumables carry alloy risk that carbon steel wire producers largely avoid, and those with established surcharge formulas pass movements through while those repricing manually absorb the lag. Distributors resent frequent repricing, which makes the mechanism a relationship question as much as a financial one.
welding-materials-market-cost-volatility-analysis-1787664905573

Establish surcharge formulas before the next alloy disruption

Producers with established alloy surcharge mechanisms passed the last disruption through while those repricing manually absorbed the lag and damaged distributor relationships doing it. A formula agreed in calm conditions is accepted as arithmetic, and the same adjustment imposed during a spike is received as opportunism. Introducing the mechanism when nobody needs it is the whole point of the exercise.

Weight the portfolio toward approved grades over general wire

Approved grades for pressure, offshore and hydrogen service carry pricing that general purpose wire never will, because a fabricator working to code cannot substitute around them at any discount. Qualification takes around three years per grade per plant, which is why the position holds. Producers competing only in general purpose consumables face Asian cost structures they cannot match.

Hold alloy inventory positions ahead of committed contracts

Stainless and nickel bearing consumables carry exposure to metals that can move violently within a single quarter, against contracts frequently priced weeks or months earlier than delivery. Matching alloy inventory to committed order books converts a market exposure into a working capital decision. The cost is capital tied up in metal, which is considerably cheaper than absorbing a spike unhedged.

Portfolio Architecture for Margin Defence

Margin architecture divides on whether a code governs the joint. General purpose carbon steel wire and electrodes earn least, competing against Asian producers on kilogram price with no technical argument available. Approved grades for pressure, offshore and classification society work earn considerably better, because qualification takes years and a fabricator cannot substitute around it. Hydrogen and specialty service grades earn best, being newest and least contested.
The tension runs between tonnage and qualification. General purpose consumables carry the volume that loads a plant, funds distribution and keeps a supplier present in fabrication shops week to week. Approved grades carry margin on far smaller tonnage and require qualification investment per grade per plant. A producer needs both, and the general purpose half is measured against cost structures that Asian volume producers set.

High value pools concentrate in code governed approvals and in consumables that suit a shrinking welder workforce, neither of which is a capacity position. Everything selling general purpose wire competes on a number that appears on an invoice while the labour it could save does not. The businesses worth building are those where the customer cannot substitute and the productivity argument reaches somebody who owns the labour budget.

General Purpose Carbon Steel Consumables

Standard carbon steel wire and electrodes sold through industrial distribution on kilogram price against Asian volume producers. No technical differentiation is available and the contest is settled before any engineer becomes involved in it.
Gross Margin: 14-18%

Code Approved Fabrication Grades

Grades approved to pressure equipment, classification society and national codes for structural, offshore and pressure vessel service. Qualification takes years per grade per plant, which prevents substitution and protects realised pricing considerably.
Gross Margin: 28-33%

Hydrogen And Specialty Service Grades

Consumables qualified for hydrogen service, nuclear application and demanding alloy work where embrittlement and property requirements exclude general purpose wire. The range is wide because hydrogen qualification remains scarce and pricing has not yet settled anywhere.
Gross Margin: 36-44%
welding-materials-market-portfolio-architecture-1787664906115

High-value Sub-segments and Strategic Watch-out

Flux-Cored Wire

Fastest growing consumable at 6.6% on deposition rate rather than joint quality, since labour is roughly 74% of welded joint cost and welders are scarce. Shipbuilding, offshore and heavy fabrication have converted decisively and none of them are converting back. No fabricator is converting back anywhere.
Gross Margin: 22-26%

TIG Rods and Filler Metals

Second fastest at 5.8% on application mix, since aerospace, semiconductor, pharmaceutical pipework and hydrogen service all specify the process. This is where approvals bite hardest, which is what keeps margin above the category average consistently. Volume is small and margin per tonne is considerably higher than elsewhere.
Gross Margin: 30-36%

Solid Wire

Growing at 4.6% and carrying the largest tonnage in the category, which makes it the volume core rather than the growth story. Robotic and mechanised cells consume it heavily, and competition against Asian producers on kilogram price remains direct. Kilogram price decides most of this volume.
Gross Margin: 16-20%

Covered Electrodes

Growing at only 1.8% and surviving in maintenance, remote repair and site work where equipment portability outweighs deposition rate entirely. Every new fabrication shop specifies wire instead, and no development effort is changing that trajectory anywhere. Portability is the only remaining argument left for this consumable anywhere.
Gross Margin: 12-16%

How Consumable Demand Locks In

Welding consumable demand is written into a document before any metal is ordered. A fabricator qualifies welding procedures against a specific consumable classification and frequently a specific brand, and requalifying to change supplier costs testing, witness time and schedule that nobody spends without a reason. That makes procedure qualification the moment the commercial relationship forms, and everything afterwards is repeat ordering against a specification already fixed.
Stickiness therefore depends on the code governing the work. Pressure vessel, offshore and nuclear fabricators change consumable suppliers rarely because the approval and requalification burden is real and documented. General structural and repair work changes on price at any time, since nothing prevents it. Robotic cells sit in between, where parameter development around a particular wire creates practical switching friction even when no code requires it.

The buyer is shifting from procurement toward the welding engineer where labour scarcity has become acute. A shop losing skilled hands faster than it can hire them starts asking what deposits fastest rather than what costs least per kilogram, which is a question procurement was never structured to answer. That shift is uneven and slow, and it is the only route by which this category escapes kilogram pricing.
welding-materials-market-end-use-penetration-index-1787664906642

Where Welding Materials Reward Focus

These are among the four positions where our research anticipates prominent divergence between winners and laggards over the coming forecast period. Each is grounded in the demand model, the regulatory perimeter, and the announced capacity pipeline.
01 / DEPOSITION RATE SELLING

The cheapest wire makes the most expensive joint

Filler metal accounts for roughly 12% of welded joint cost while welder time accounts for about 74%, which means a wire priced a quarter higher that deposits a third faster produces a cheaper joint by a wide margin. Purchase orders are written in dollars per kilogram because consumable spend appears on an invoice and arc-on time disappears into labour hours nobody attributes to a wire. Suppliers running deposition trials reach the welding engineer rather than the buyer comparing quotes on price alone.
02 / WELDER SCARCITY DESIGN

The scarce input is the person, not the steel

Median welder age across industrialised countries sits near 54 and apprenticeship intake has not matched retirement for two decades, which makes the skilled hand the constraint rather than orders or raw material. Consumables forgiving of technique, capable in more positions and suited to mechanised deposition take share on that basis regardless of kilogram pricing. Flux-cored wire grows at 6.6% against a market rate of 4.4%, and robotic cells consume wire exclusively while never touching a covered electrode at any point.
03 / APPROVAL PORTFOLIO DEPTH

Years of qualification cannot be bought quickly

Grades for pressure vessels, offshore structures, nuclear service and hydrogen pipework require qualification running around three years per grade per production plant, covering mechanical testing, impact properties and third party witness throughout. A fabricator working to code cannot substitute an unapproved consumable at any discount whatsoever, which removes price from the conversation entirely. Hydrogen service is the newest and least contested of these positions, since embrittlement behaviour excludes general purpose wire completely, and very few suppliers hold that qualification yet.
04 / FABRICATION CAPACITY TIMING

Arrive while procedures are being qualified

A fabricator qualifies welding procedures against a specific consumable classification and frequently a specific brand, after which changing supplier costs testing, witness time and schedule nobody spends without a compelling reason to do so. India grows at 7.8%, faster than any market covered, as shipbuilding, infrastructure and incentive backed manufacturing capacity expand together. Arriving while a yard is qualifying its procedures is worth considerably more than arriving afterwards holding a cheaper quote that nobody there has any reason to evaluate.

Engagement Snapshot From the Field

A live engagement with an industry participant carrying material or product regulatory and market exposure ahead of a defining policy shift, showing how our research translates into a defensible multi-year portfolio strategy.
MARKET MINDS ADVISORY · CLIENT ENGAGEMENT SUMMARY
Welding Materials Producer Strategic Portfolio Review and Transition Roadmap 2026·Investment Scenario on Welding Materials Exposure Evaluation 2025-26
CLIENT PROFILE
A welding consumables producer supplying carbon steel wire and electrodes to industrial distributors across Western Europe and Latin America. Annual revenue was approximately 310 million dollars (client-reported, unverified by MMA), predominantly general purpose consumables sold on kilogram pricing. The approval portfolio covered basic structural codes and no pressure, offshore or hydrogen service grades at all.
STRATEGIC CHALLENGE
General purpose margins had compressed for five consecutive years against Asian imports, and management was weighing capacity expansion to defend volume against distributor pressure. Fabricator customers increasingly asked for approved grades the company could not supply and bought them elsewhere. Nobody had measured what those approval gaps cost across the rest of the relationship.
MMA APPROACH
MMA traced approval driven enquiries to their eventual suppliers and measured the subsequent purchasing behaviour of those accounts. Approval programme entry was costed per grade per plant against expansion of general purpose capacity. Forty-seven expert interviews with fabricators, welding engineers and distributors established how consumable decisions are genuinely made, alongside quantitative survey work across six countries.
KEY FINDINGS
  1. Accounts sourcing approved grades elsewhere moved roughly 35% of their general purpose volume to the same supplier within three years, so each approval gap cost far more than the enquiry.
  2. Welding engineers rather than procurement decided the consumable in 6 of every 10 code governed jobs, and the client's sales approach reached procurement almost exclusively.
  3. Approval programmes were costed at roughly 3 years per grade per plant, against gross margin per tonne running about 2 times general purpose consumables.
  4. General purpose capacity expansion returned below the client's hurdle rate in 5 of the 6 demand scenarios modelled, including the most favourable pricing case.
CLIENT PROFILE
A welding consumables producer supplying carbon steel wire and electrodes to industrial distributors across Western Europe and Latin America. Annual revenue was approximately 310 million dollars (client-reported, unverified by MMA), predominantly general purpose consumables sold on kilogram pricing. The approval portfolio covered basic structural codes and no pressure, offshore or hydrogen service grades at all.
STRATEGIC CHALLENGE
General purpose margins had compressed for five consecutive years against Asian imports, and management was weighing capacity expansion to defend volume against distributor pressure. Fabricator customers increasingly asked for approved grades the company could not supply and bought them elsewhere. Nobody had measured what those approval gaps cost across the rest of the relationship.
MMA APPROACH
MMA traced approval driven enquiries to their eventual suppliers and measured the subsequent purchasing behaviour of those accounts. Approval programme entry was costed per grade per plant against expansion of general purpose capacity. Forty-seven expert interviews with fabricators, welding engineers and distributors established how consumable decisions are genuinely made, alongside quantitative survey work across six countries.
KEY FINDINGS
  1. Accounts sourcing approved grades elsewhere moved roughly 35% of their general purpose volume to the same supplier within three years, so each approval gap cost far more than the enquiry.
  2. Welding engineers rather than procurement decided the consumable in 6 of every 10 code governed jobs, and the client's sales approach reached procurement almost exclusively.
  3. Approval programmes were costed at roughly 3 years per grade per plant, against gross margin per tonne running about 2 times general purpose consumables.
  4. General purpose capacity expansion returned below the client's hurdle rate in 5 of the 6 demand scenarios modelled, including the most favourable pricing case.
RECOMMENDED STRATEGY
Phase 1: Phase one: cancel general purpose capacity expansion, which cleared the hurdle rate in only 1 of 6 demand scenarios modelled including favourable pricing. Phase 2: Phase two: begin approval programmes at roughly 3 years per grade, targeting margin per tonne around 2 times general purpose consumables. Phase 3: Phase three: redirect technical selling toward welding engineers, who decide the consumable in 6 of 10 code governed fabrication jobs.
OUTCOME
The client cancelled the capacity expansion and began pressure and offshore approval programmes, with the first grades qualifying inside the projected timeline. Accounts that had been sourcing approved product elsewhere consolidated purchasing once the gap closed, and general purpose volume stabilised as part of a broader supply relationship (client-reported, unverified by MMA).

Frequently Asked Questions

Foundational context covering the market sizes, CAGR, scope, country, region and competition that inform every finding below. This section is provided to cover basics and most often pre-purchase conversations, answered from the MMA Primary Research Dataset.

What is the current size of the Welding Materials Market?

The market was valued at 15.8 billion dollars in 2025, covering electrodes, wires, fluxes, filler metals and brazing alloys sold worldwide. It reaches an estimated 16.50 billion dollars during 2026.

How large will the Welding Materials Market be by 2036?

MMA forecasts 25.38 billion dollars by 2036, an increase of 8.88 billion dollars over the 2026 base. That represents an expansion multiple of 1.54 times across the forecast period.

What is the CAGR for the Welding Materials Market 2026 to 2036?

The base case compound annual growth rate is 4.4%, with a bull case of 5.6% and a bear case of 3.2%. Hydrogen fabrication demand and alloy cost volatility separate those two scenarios.

Which segment is growing fastest?

Flux-cored wire grows at 6.6%, half again the market rate of 4.4%, on deposition rate rather than joint quality. Tungsten inert gas rods and filler metals follow at 5.8%.

Who are the major companies in the Welding Materials Market?

Lincoln Electric, ESAB, Kobe Steel, Illinois Tool Works and voestalpine Bohler Welding lead on production capacity worldwide. Together they account for 36% of the global market.

Which country is growing fastest?

India grows fastest at 7.8%, as shipbuilding, infrastructure construction and incentive backed manufacturing capacity expand together and create welding demand from several directions at once.

Report Segmentation Architecture

The full report scope spans multiple orthogonal segmentation dimensions, with cross-tabulated demand data provided for each dimension pair. Coverage extends further to regional breakdowns, trend trajectories, and the competitive detail needed to support segment-level decision-making.

By Consumable Type

  • Covered Electrodes
  • Solid Wire
  • Flux-Cored Wire
  • Submerged Arc Wire and Flux
  • TIG Rods and Filler Metals
  • Brazing and Hardfacing Alloys

By End-Use Industry

  • Shipbuilding and Offshore
  • Construction and Infrastructure
  • Energy and Pipeline
  • Automotive and Transport
  • Heavy Machinery Manufacturing
  • Repair and Maintenance

By Commercial Dimension

  • Industrial Distributor Supply
  • Direct Fabricator Contract
  • Gas Distributor Bundled Supply
  • Original Equipment Approved Supply
  • Export and Trading
  • Retail and Small Workshop

By Region

  • North America
  • Western Europe
  • East Asia
  • South Asia and Pacific
  • Latin America
  • Middle East and Africa
  • Eastern Europe

Scope, Methodology, and Coverage

Every figure in this report is reproducible from documented input assumptions. The scope below maps the historical period, the forecast horizon, the segmentation dimensions, and the countries covered, alongside the underlying primary and qualitative methodology.
Historical Period
2020 to 2025
Forecast Period
2026 to 2036
Base Year
2025 (USD billions; MMA Primary Research Dataset, August 2026)
Market Definition
Consumable materials used to make welded and brazed joints worldwide, covering covered electrodes, solid wire, flux-cored wire, submerged arc wire and flux, tungsten inert gas rods and filler metals, and brazing and hardfacing alloys across carbon steel, stainless, aluminium and nickel alloy grades, measured at manufacturer selling value. Welding power sources, torches, robots and automation equipment, shielding and industrial gases, welding fume extraction, and personal protective equipment are excluded from scope entirely.
Quantitative Units
USD billions (manufacturer selling value); tonnes; USD per tonne by consumable type
Segmentation Dimensions
Consumable type; end-use industry; commercial dimension; region
Regions Covered
North America, Western Europe, East Asia, South Asia and Pacific, Latin America, Middle East and Africa, Eastern Europe
Countries Covered
United States, Canada, Mexico, United Kingdom, Germany, Italy, France, Spain, Sweden, Netherlands, China, Japan, South Korea, Taiwan, India, Australia, Indonesia, Brazil, Chile, Saudi Arabia, South Africa, Poland
Key Companies Profiled
Lincoln Electric, ESAB, Kobe Steel, Illinois Tool Works, voestalpine Bohler Welding, Air Liquide Welding, Nippon Steel Welding and Engineering, Kiswel, Hyundai Welding, Tianjin Bridge Welding Materials, Atlantic China Welding Consumables, Gedik Welding, Ador Welding, D&H Secheron Electrodes, Sidergas, Magmaweld, Zhejiang Kingstone Welding, Huatong Welding, Metrode Products, Harris Products Group
Quantitative Methodology
Primary survey, n=3,800 respondents, Q4 2025, six countries; demand-side model with trade association cross-validation
Qualitative Methodology
47 expert interviews, Q4 2025; applied to validate demand model assumptions, identify emerging dynamics, and assess competitive positioning
Report Format
PDF and XLSX data workbook (Word format preview document)
Publisher
Market Minds Advisory
Report Code
MMA-2026-CHM-153
Published
August 2026
Contact
sales@marketmindsadvisory.com | www.marketmindsadvisory.com

Purchase the full Welding Materials Market Report (2026 to 2036).

The full report treats welding consumables as a category sold on kilogram price while its economic value sits in welder hours, and follows what that mismatch costs suppliers and fabricators alike. It sizes all six consumable types independently through 2036, models process substitution against welder workforce demographics by region, and maps approval portfolios across pressure, offshore, nuclear and hydrogen service codes. Regional chapters cover all seven regions, with Chinese production and consumption scale assessed separately from Western approval driven demand. Competitive profiling covers 20 participants on one consistent capacity measure.
Six consumable types sized independently through 2036
Process substitution modelled against welder workforce demographics
Approval portfolios mapped across pressure, offshore and hydrogen codes
Joint cost structure quantified against consumable price per kilogram
Alloy cost pass through assessed by contract mechanism type
Twenty participants profiled on one consistent capacity measure

Built For The People Who Decide

From boardroom strategy to bench-side execution, this report is read cover-to-cover by leaders shaping the next decade of their industry, turning demand scenarios, market dynamics and valuation benchmarks into decisions.
CXOs/ Presidents/ VPs/ Managers
M&A and Corporate Development
Strategy Teams and R&D Heads
Procurement and Product Directors
Regulatory and Compliance Leaders
Investor Relations and Equity Analysts