Market Minds Advisory
Weight Loss and Obesity Management Market

Weight Loss and Obesity Management Market: GLP-1 Therapy and the Chronic Disease Reframing Shift

GLP-1 receptor agonist therapies reframing obesity as a chronic metabolic disease rather than a lifestyle condition are displacing bariatric surgery and behavioral programs as first-line treatment, forcing legacy device and program manufacturers to defend market position against pharmaceutical incumbents capturing disproportionate spend.

Lead Analyst

Alice Ballenger

Published

September 2026

Make Smarter Decisions with Customized Research Insights

Request a free sample report and evaluate market opportunities, growth trends, and competitive dynamics relevant to your business needs.

2025 MARKET VALUE$52.0BMarket Size 2025
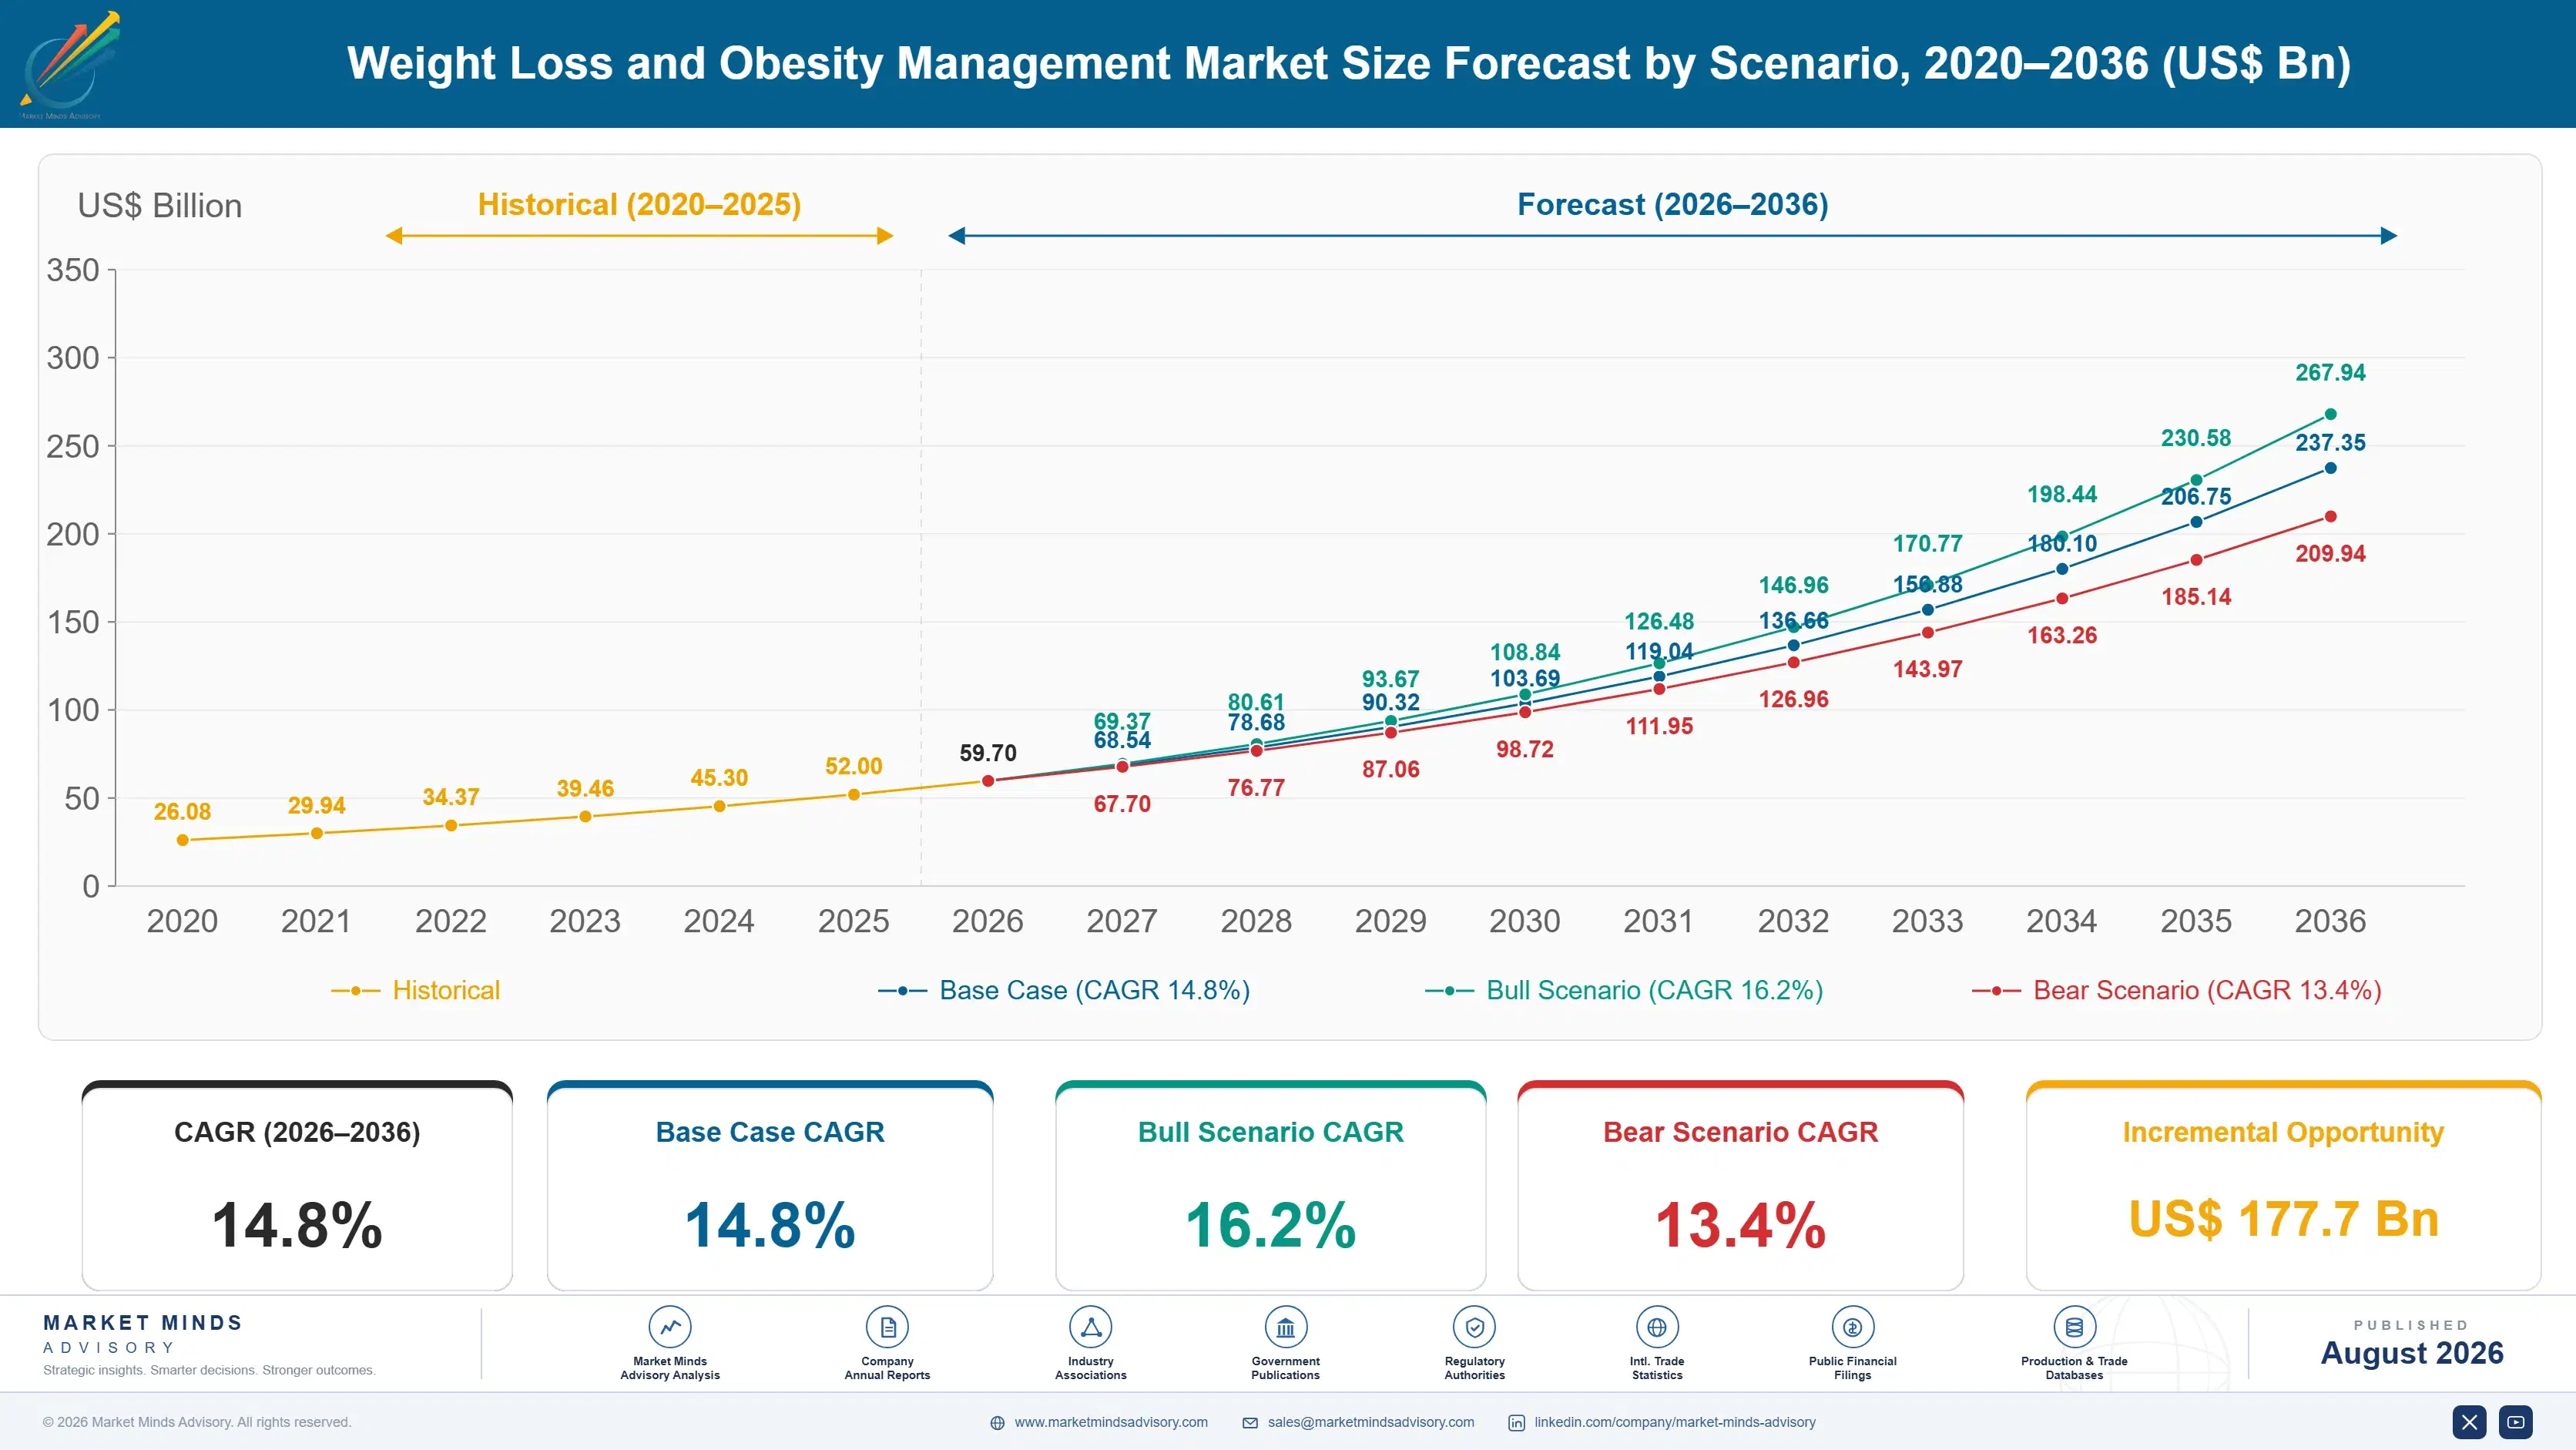
2036 FORECAST VALUE$237.3BBase Case , 2026 to 2036
CAGR 2026 TO 203614.8 %Bull 16.2% / Bear 13.4%
INCREMENTAL OPPORTUNITY$177.7BNet 10- year value creation
EXPANSION MULTIPLE3.98x2036 value over 2026 base
Strategic Levers
M&A Pipeline
Regional Outlook
Country Rankings
Competitive Intelligence
Segmental Deep-dive
Call-Us : 91 93563 13602

Executive Snapshot and Market Trajectory

GLP-1 receptor agonist therapies reframing obesity as a chronic metabolic disease are displacing bariatric surgery and behavioral programs as first-line treatment, and payers increasingly structure coverage decisions around long-term adherence economics rather than upfront procedure cost alone this benefit cycle. Bundled adherence support increasingly factors into that calculus.
Type 2 diabetes comorbid patients drive much of current treatment volume, but GLP-1 receptor agonist therapies are pulling share fastest as expanded label indications broaden the eligible patient population. North America holds the deepest treatment volume base on insurance coverage depth and prescriber density, while China's manufacturing scale-up is closing the adoption gap from a smaller starting point. Manufacturers with strong East Asian distribution keep capturing disproportionate incremental volume growth.
Five manufacturers hold roughly seventy-eight percent of category revenue, leaving little room for challengers without differentiated formulation or delivery mechanism advantages. Widening comparative data on adherence and weight-loss durability and a growing body of payer coverage literature are reshaping which therapies prescribers default to across both diabetes-comorbid and standalone obesity treatment nationwide this decade. Manufacturers watch this shift closely nationwide. Payer benefit design decisions continue shifting accordingly this cycle across most major reimbursement markets nationwide.
Market Definition
This market covers pharmaceutical therapies, surgical devices, and structured programs used to treat obesity and support sustained weight loss, including GLP-1 receptor agonists, bariatric surgical devices, and digital weight management platforms. It excludes general fitness equipment, cosmetic body contouring procedures, and unregulated dietary supplements without clinical weight management indications.
Base Year Value
$52.0B in 2025 (MMA Primary Research Dataset, August 2026)
Forecast Period
2026 to 2036, eleven discrete annual values
CAGR
14.8% base case. Bull 16.2%. Bear 13.4%.
Fastest Growth Segment
GLP-1 Receptor Agonist Therapies: 21.5% CAGR
Fastest Growth Country
China: 19.8% CAGR
Fastest Growth Region
South Asia and Pacific: 16.8% CAGR
Largest Region
North America: 32% of 2025 global value
Market Leaders
Novo Nordisk, Eli Lilly, Boehringer Ingelheim, Pfizer, Amgen. Source: MMA Analysis based on company annual reports.
Primary Survey
n=3,800 procurement and R&D decision-makers, Q4 2025, six countries
Methodology
Demand-side build-up, cross-validated against public data, 47 expert interviews

Weight Loss and Obesity Management Market Forecast Scenarios

weight-loss-and-obesity-management-market-size-forecast-scenario-1787309924034
Category revenue grew explosively across 2020 to 2025 as GLP-1 receptor agonist therapies moved from diabetes-specific use into standalone obesity indications with rapidly expanding payer coverage. Growth accelerated meaningfully following major label expansions and manufacturing capacity increases, resuming an even steeper trajectory through the remainder of the historical period into 2025. Diabetes-comorbid patients led this early adoption before standalone obesity coverage expanded.
The base case assumes continued high double-digit growth in GLP-1 adoption, expanding payer coverage across employer and government health programs, and steady manufacturing capacity growth easing the supply constraints that limited access during the historical period. Prescriber capacity, payer coverage documentation requirements, and manufacturing scale-up timelines remain the binding constraints on faster diffusion across price-sensitive patient populations. Manufacturing capacity investments continue expanding to reach previously underserved patient segments gradually. Larger manufacturers scale production faster than smaller emerging competitors.
The bull case rests on expanding oral GLP-1 formulations pulling forward adoption industry-wide and accelerating access beyond injectable-tolerant patient populations. The bear case centers on payer coverage retrenchment amid aggregate cost concerns, which could compress reimbursement rates and depress category growth through the middle of the forecast period nationwide. Manufacturers are watching both scenarios closely as coverage policy evolves nationwide.

Chronic Disease Reframing as the Defining Commercial Dynamic

Obesity management sits at the intersection of chronic disease pharmacology and payer benefit design, and the category's growth increasingly tracks which manufacturers can prove sustained adherence and long-term weight-loss durability rather than short-term efficacy data alone. Procurement criteria are shifting accordingly at major employer and government payers this benefit cycle. Manufacturers who can demonstrate that durability fastest win at the point of formulary committee selection each cy
MARKET CONCENTRATION (CR5)78%top five holders control most global category revenue
AVERAGE ANNUAL THERAPY COST$11,800typical GLP-1 treatment cost per patient annually
LEADING COUNTRY SHARE29%United States dominates global category revenue by far
GLP-1 ATTACH RATE44%diagnosed obesity patients now receiving pharmacotherapy treatment
TREATMENT DISCONTINUATION RATE38%one-year cumulative rate of therapy discontinuation reported
INSURANCE COVERAGE REVENUE SHARE52%portion of category revenue tied to formal payer coverage
Commercially, the category behaves like a chronic therapy annuity rather than an episodic treatment: patients require ongoing pharmacotherapy to maintain weight loss, and discontinuation typically reverses clinical benefit, which sustains manufacturer revenue well past the initial prescription across a multi-year treatment relationship. Adherence support programs increasingly drive blended margin more than list pricing alone. Manufacturers with strong adherence support infrastructure are outperforming pure pharmacology competitors on blended margin.
The next decade will be shaped by oral GLP-1 formulations becoming widely available, expanding payer coverage beyond diabetes-comorbid populations alone, and employer and government benefit committees demanding demonstrated total cost of care reduction before approving broad formulary coverage. Manufacturers investing early in expanded real-world outcomes data stand to capture disproportionate long-term share. Manufacturers who fund comparative outcomes studies stand to capture disproportionate formulary share nationwide.
"Obesity used to be treated as a willpower problem billed to the patient. Now it is billed to the payer as a chronic disease, and that single reclassification is what turned this into the fastest-growing category in pharma."
Director, Healthcare Technology Practice · MMA Healthcare Practice ·

Market Trends

Oral GLP-1 Formulations Expand Patient Access Beyond Injectables

Oral GLP-1 formulations entering late-stage trials and early commercial launch are displacing injectable-only access, letting patients who are needle-averse or lack cold chain storage capability access the same underlying pharmacology through a daily pill format. Early comparative data shows meaningfully higher treatment initiation rates when oral formulations are offered alongside injectable options at the point of prescribing. Two of the five leading manufacturers now have oral GLP-1 candidates in late-stage trials, and three smaller competitors have announced oral programs entering pivotal studies in 2026 targeting expanded patient access. Payers increasingly treat oral capability as a differentiator, not a niche option.
Market Impact: Adds 8.4 million newly covered pati
Payer Coverage Expands Beyond Diabetes-Comorbid Populations

Payer coverage for GLP-1 obesity indications is expanding beyond diabetes-comorbid populations as employers and government health programs recognize total cost of care reduction from obesity-related comorbidity prevention. Seven major national and regional payers have expanded standalone obesity coverage criteria since 2023, meaningfully broadening the addressable patient population beyond diabetes-linked prescribing pathways. Employer benefit consultants have updated plan design guidance to reference obesity pharmacotherapy explicitly as a cost-effective covered benefit for an expanding range of employer health plans this forecast period. Manufacturers with the deepest payer relationships are capturing this incremental coverage expansion fastest across major employer markets.
Market Impact: Expands supply capacity by 65%

Market Opportunities and Growth Drivers

Rising Obesity-Linked Comorbidity Costs Drive Payer Coverage

Rising documented healthcare costs linked to untreated obesity, including cardiovascular disease and diabetes complications, continue driving payer willingness to cover GLP-1 pharmacotherapy as a cost-avoidance measure rather than a discretionary benefit. Several large employer health plans report meaningfully lower aggregate healthcare spend among covered GLP-1 populations over multi-year tracking periods compared with untreated comorbid populations. This cost-avoidance evidence is pulling incremental coverage decisions toward manufacturers with the strongest real-world outcomes data, reinforcing incumbent advantage among the two largest manufacturers with the deepest payer relationships. Manufacturers with the deepest payer distribution are capturing this incremental coverage fastest across major employer markets.
Market Impact: Discontinuation drives 22% wasted s

Manufacturing Capacity Expansion Eases Historical Supply Constraints

Continued manufacturing capacity investment by the leading GLP-1 manufacturers is easing the supply constraints that limited patient access during the historical period, expanding the addressable prescribing base beyond previously rationed allocation. Several large manufacturing facility expansions completed since 2023 have meaningfully increased global production capacity for injectable and emerging oral formulations. This capacity-driven access expansion is pulling incremental prescribing volume toward manufacturers with the most reliable supply chains, reinforcing incumbent advantage among the largest existing suppliers nationwide. Manufacturers positioned early in this capacity race stand to gain disproportionate long-term formulary share across major payer networks nationwide.
Market Impact: Delays access by 4 to 6 months

Market Restraints and Challenges

High Discontinuation Rates Undercut Long-Term Value

Roughly thirty-eight percent of patients discontinue GLP-1 therapy within the first year, largely due to gastrointestinal side effects, injection burden, and out-of-pocket cost, undermining the long-term cost-effectiveness argument manufacturers use with payers. The root cause is a combination of tolerability challenges early in treatment and cost-sharing structures that leave meaningful out-of-pocket exposure even for covered patients. The commercial impact shows up in payer skepticism toward long-term budget projections, since discontinuation followed by weight regain often triggers treatment restart and duplicated spend. Manufacturers are mitigating this through improved formulation tolerability and expanded patient support programs addressing cost and adherence barriers.
Market Impact: Adds 44% GLP-1 attach rate

Manufacturing Capacity Constraints Limit Near-Term Access

Despite ongoing capacity expansion, manufacturing constraints have periodically limited patient access to preferred formulations, forcing prescribers to substitute among available options or delay treatment initiation. The root cause is the complex, capital-intensive nature of peptide manufacturing, which cannot scale as quickly as demand has grown across newly covered patient populations. The commercial impact falls hardest on smaller markets and newly launched geographies, which report longer waitlists and delayed formulary access than established markets with prioritized allocation. Manufacturers are mitigating this through expanded contract manufacturing partnerships and phased geographic rollout prioritization.
Market Impact: Expands covered population by 28%
4 additional market trends, 3 additional growth drivers, and 3 additional restraints and challenges are covered in the full report. Contact sales@marketmindsadvisory.com to access the complete intelligence.

Segment CAGR and Growth Architecture

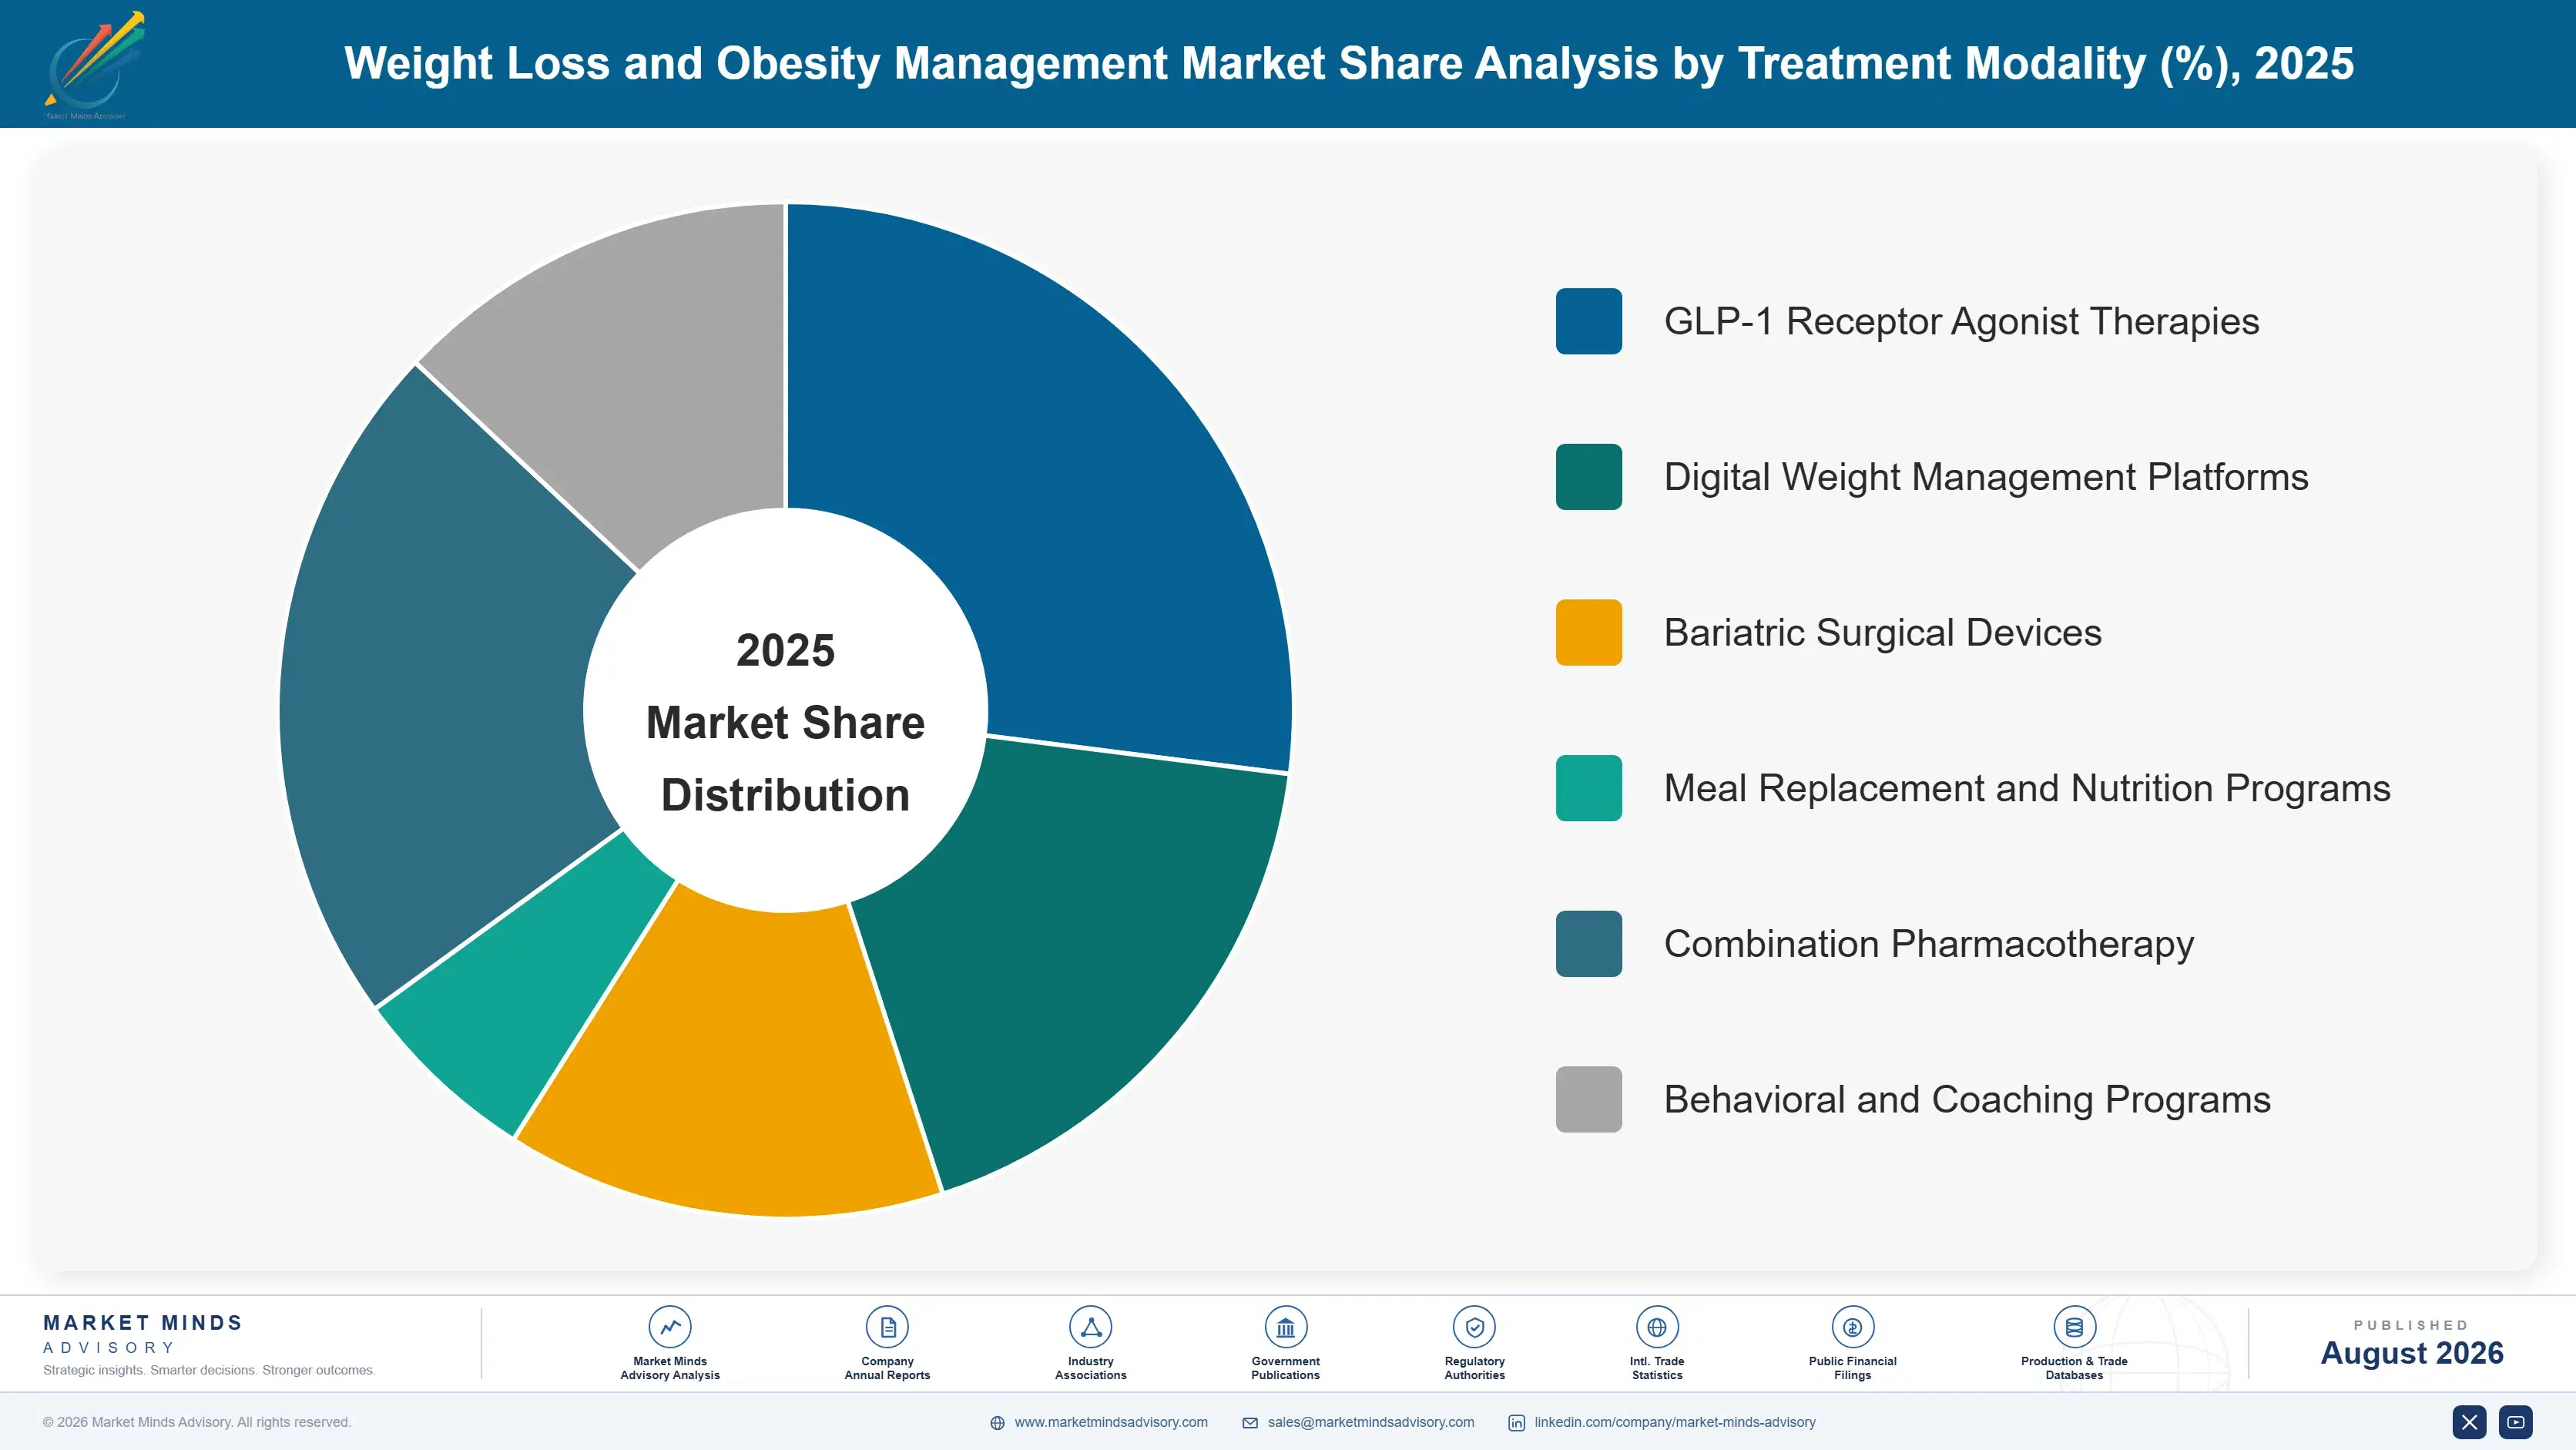
The market segments by treatment modality, the classification prescribers and payers actually use when selecting among competing obesity treatment pathways. GLP-1 receptor agonist therapies lead all categories on growth as expanded label indications earn broader prescriber and payer preference across most treatment settings this forecast cycle. Digital weight management platforms remain the established complement to pharmacotherapy adherence support.
weight-loss-and-obesity-management-market-market-share-analysis-1787309924575

GLP-1 Receptor Agonist Therapies

GLP-1 receptor agonist therapies mimic the natural incretin hormone response to reduce appetite and slow gastric emptying, delivering sustained weight loss substantially exceeding what behavioral and dietary interventions typically achieve on their own. Growing at 21.5% annually, roughly 1.5 times the overall market rate, this segment is pulling share from every other treatment category as comparative data documents durable weight-loss maintenance with continued therapy adherence. Two of the five leading manufacturers now dominate the injectable market, and three smaller competitors have oral formulations entering pivotal trials in 2026. Payers increasingly specify GLP-1 coverage as a baseline formulary requirement. Payers in select markets are also beginning to recognize this durability advantage in coverage policy decisions nationwide.
CAGR 21.5%

Digital Weight Management Platforms

Digital weight management platforms combine app-based tracking, virtual coaching, and telehealth prescribing access to support patients through both behavioral change and pharmacotherapy management from a single integrated service. Growing at 18.2% annually, this segment benefits from rising employer willingness to bundle digital platform access with GLP-1 pharmacy benefits as a combined obesity management offering. Employer wellness programs and telehealth platforms remain the primary demand driver, using digital tools to improve adherence and provide the ongoing support that sustained weight-loss maintenance requires. Manufacturers continue expanding platform integration and clinical decision support to broaden adoption beyond early digital-health adopters. This positioning keeps the segment relevant even as pharmacotherapy adoption accelerates industry-wide across major employer plans.
CAGR 18.2%
Full segment breakdown across 6 segments available in the complete report.

Regional Architecture and Country Demand Map

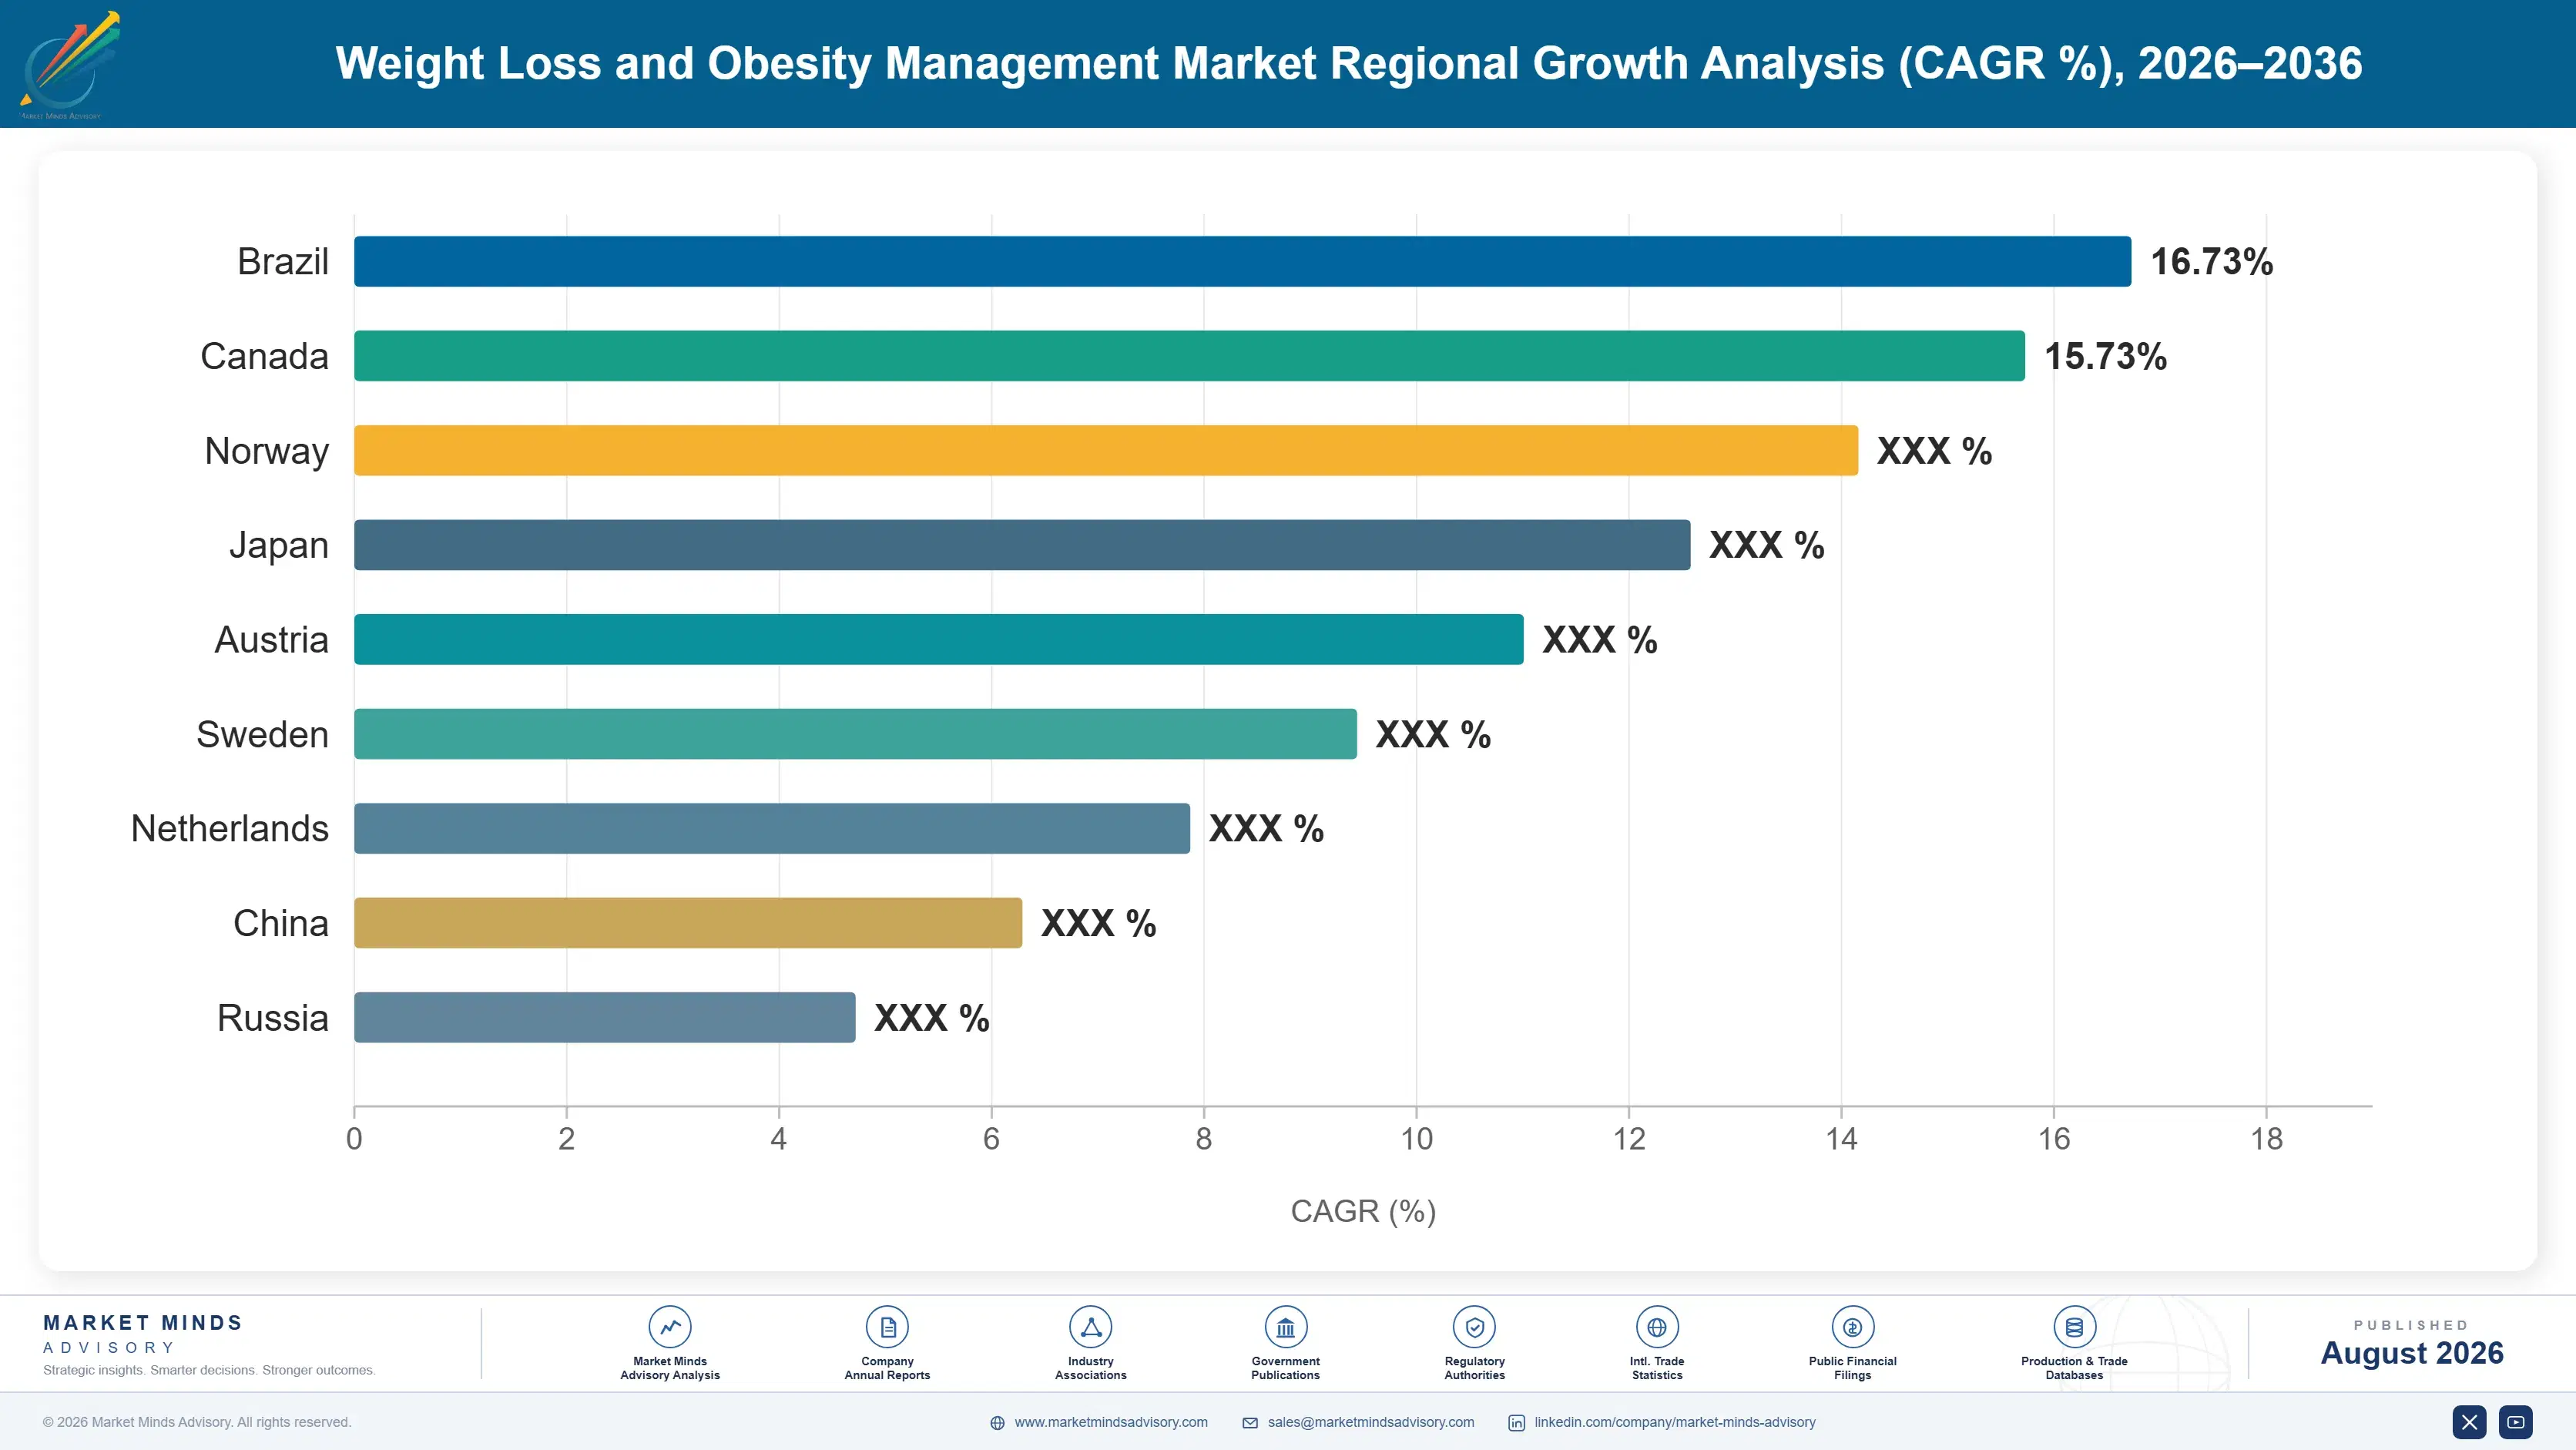
North America leads on insurance coverage depth and prescriber density, followed by East Asia's expanding manufacturing scale-up investment. Western Europe trails on more conservative national reimbursement criteria relative to underlying patient demand. South Asia and Pacific posts the fastest regional growth off a smaller established base nationwide.

North America

United States category revenue dominates this region on the strength of its dense prescriber network and broad employer and government insurance coverage for GLP-1 therapies across major health plans. Canada's smaller, more centralized system adds modest volume but moves at a slower coverage expansion pace than comparable American institutions. Rising diabetes-comorbid and standalone obesity coverage continues pulling prescribing volume toward manufacturers with proven adherence support infrastructure faster than in any other market. Employer and government payer budgets remain comparatively well funded, and GLP-1 attach rates on new coverage decisions keep rising steadily across most major health plan networks nationwide this forecast period. Oral formulation attach rates continue climbing quarter over quarter nationwide.
Share: 32% | CAGR: 15.5% (2026 to 2036)

Western Europe

Reimbursement here moves through national health technology assessment bodies rather than individual payer negotiation, which slows adoption of premium GLP-1 therapies relative to the pace of United States coverage decisions. Germany and the United Kingdom carry the largest procedural volumes, supported by established diabetes and obesity treatment networks within their respective national health systems. France's dedicated obesity treatment reimbursement pathway has meaningfully shortened patient wait times for pharmacotherapy access since its introduction. Growth trails the global average as national health systems increasingly scrutinize aggregate screening costs relative to demonstrated long-term outcomes before expanding reimbursement coverage further. Reimbursement pathways for standalone obesity coverage remain inconsistent across member states. Payer scrutiny is expected to intensify further as budget pressure grows.
Share: 22% | CAGR: 13.2% (2026 to 2036)
Regional intelligence for 5 additional markets available in the complete report: East Asia, South Asia and Pacific, Latin America, Middle East and Africa, Eastern Europe. Contact sales@marketmindsadvisory.com.
weight-loss-and-obesity-management-market-country-cagr-analysis-1787309925101

Where Obesity Treatment Manufacturers Can Expand Margin

Adherence support depth, payer coverage partnerships, and digital companion platform revenue offer the clearest paths to margin expansion as core therapy pricing faces growing payer scrutiny across major employer health systems evaluating annual formulary decisions and benefit design this budget cycle nationwide. particularly among the largest employer plans standardizing obesity treatment formularies across multiple sites.

GLP-1 Adherence Support Program Strategy

Adherence support programs bundling injection training, side-effect management, and nutritional coaching, priced around $1,200 annually per patient, are helping manufacturers reduce the roughly 38 percent one-year discontinuation rate that erodes long-term therapy revenue. Manufacturers with dedicated adherence support infrastructure report meaningfully lower discontinuation rates than those relying solely on pharmacy dispensing without structured support. This lever depends on continued patient engagement, which comparative adherence data increasingly supports as retention evidence accumulates across larger cohort studies. Manufacturers publishing detailed comparative adherence data are winning payer trust fastest across major markets. Smaller manufacturers struggle to fund comparable adherence infrastructure at scale.
Market Impact: Reduces one-year discontinuation by

Payer Coverage Partnership Growth Program

Structured payer coverage partnerships that provide real-world outcomes data and total cost of care modeling directly to employer and government health plans are accelerating formulary inclusion decisions beyond standard negotiation timelines. Manufacturers with dedicated payer relations teams report meaningfully faster formulary approval than those relying solely on standard rebate negotiations. This lever scales fastest among the two largest manufacturers with the deepest existing payer relationships, and it is increasingly cited by benefit consultants as a deciding factor when evaluating competing therapies. Manufacturers view this as a durable, long-horizon account investment.
Market Impact: Accelerates formulary approval time

Digital Companion Platform Subscription Bundling

Bundling digital companion platform access, including dosing reminders, symptom tracking, and virtual coaching, with pharmacy benefits priced around $35 monthly per patient is emerging as a durable recurring revenue stream layered on top of the core therapy relationship. Patients using bundled digital platforms report meaningfully higher one-year adherence rates than those managing therapy without structured digital support. This lever requires sustained platform development investment but creates a durable differentiation point that smaller manufacturers currently struggle to replicate. This evidence investment increasingly separates winners from laggards industry-wide. Larger platforms lead early adoption of this bundled digital service.
Market Impact: Adds roughly $35 in monthly revenue

Prescriber Education and Certification Programs

Structured prescriber education and certification programs, often funded through unrestricted educational grants, are increasingly formalized as standalone paid continuing education offerings priced near $450 per prescriber once health systems seek to expand obesity medicine treatment capacity across their physician networks. Manufacturers offering certified education pathways report stronger prescribing loyalty and higher first-line therapy selection among trained prescribers compared with those relying solely on sales representative detailing. This lever remains underdeveloped industry-wide, leaving meaningful room to expand. Manufacturers see this as durable investment rather than a one-time sales tactic. Larger health systems lead early adoption of this training investment.
Market Impact: Generates roughly $450 per newly ce

Who Controls the Margin Pool

Five manufacturers control roughly seventy-eight percent of category revenue, and the gap between the top two and the remaining three leaders is vast: Novo Nordisk and Eli Lilly each carry established multi-decade metabolic disease sales infrastructure and manufacturing scale that Boehringer Ingelheim, Pfizer, and Amgen are still building out through late-stage pipeline candidates rather than approved products. Independent challengers weigh this infrastructure gap heavily during pipeline priorit
Current competitive activity centers on three fronts: oral GLP-1 formulation launches backed by growing real-world adherence data, payer coverage partnership development aimed at expanding formulary access beyond diabetes-comorbid populations, and comparative-effectiveness trial funding designed to sway benefit committees ahead of major annual renewal cycles. Manufacturers with dedicated payer relations teams are winning a disproportionate share of these accounts.

Emerging pressure is coming from smaller, pipeline-stage entrants like Viking Therapeutics and Structure Therapeutics, which lack approved commercial products but are pursuing differentiated formulation and delivery mechanism advantages. Rankings among the top five could shift meaningfully if a smaller player's oral formulation data proves durable enough to win a major payer formulary decision ahead of the two dominant incumbents' own oral pipeline candidates.
weight-loss-and-obesity-management-market-company-positioning-matrix-1787309925627

Competitive Moat and Risk Dimensions

NOVO NORDISK A/S

Moat: Broad Metabolic Disease Franchise Scale

Novo Nordisk's decades-long presence across diabetes and metabolic disease gives it prescriber relationships and manufacturing scale that pipeline-stage competitors cannot replicate quickly. Its broad metabolic disease portfolio also lets sales teams bundle obesity therapy contracts with existing diabetes care relationships at the payer and health system level. Long-standing manufacturing infrastructure also protects against near-term supply disruption.
NOVO NORDISK A/S

Risk: Oral Formulation Development Lag

Novo Nordisk's oral GLP-1 formulation development trails Eli Lilly's on some efficacy comparisons, ceding early oral-market positioning to a direct competitor with comparable manufacturing scale. Its scale advantage in commercial infrastructure does not automatically translate into formulation leadership on the oral delivery dimension increasingly driving payer and patient preference nationwide.
ELI LILLY AND COMPANY

Moat: Deep Diabetes Care Prescriber Network

Eli Lilly built its reputation specifically on diabetes care depth rather than pure metabolic disease breadth, giving it a defensible position among endocrinologists who prioritize integrated diabetes and obesity treatment protocols. This clinical trust continues generating steady prescribing volume even as competitors introduce comparable dual-mechanism therapies.
ELI LILLY AND COMPANY

Risk: Manufacturing Capacity Constraints Persist

Eli Lilly's manufacturing capacity, despite significant recent expansion investment, has periodically lagged demand growth relative to Novo Nordisk's more established production infrastructure across some geographies. Patients and prescribers seeking consistent supply availability increasingly favor manufacturers with demonstrated allocation reliability nationwide. Competitors continue closing this manufacturing reliability gap steadily.

Players Tracked

Prominent Players

Novo Nordisk A/S
Eli Lilly and Company
Boehringer Ingelheim
Pfizer Inc.
Amgen Inc.

Other Key Players

Zealand Pharma A/S
Viking Therapeutics, Inc.
Structure Therapeutics Inc.
Rhythm Pharmaceuticals, Inc.
Novartis AG
AstraZeneca plc
Regeneron Pharmaceuticals, Inc.
Altimmune, Inc.
Metsera, Inc.
Terns Pharmaceuticals, Inc.
Noom, Inc.
WeightWatchers International, LLC
Ro (Roman Health Ventures Inc.)
Currax Pharmaceuticals LLC
Gelesis Holdings, Inc.

Recent Developments

FEBRUARY 2025

Eli Lilly Reports Positive Phase 3 Oral GLP-1 Results

Eli Lilly reported positive Phase 3 trial results for its oral GLP-1 candidate, documenting weight-loss outcomes comparable to its injectable formulation across the trial population. The results position the company for a potential regulatory submission and commercial launch targeting patients seeking non-injectable treatment options nationwide.
Signal: Signals oral formulation development is ad
JULY 2025

Novo Nordisk Expands Manufacturing Capacity Investment

Novo Nordisk announced a major expansion of its injectable formulation manufacturing capacity, adding production lines across multiple facilities to address persistent supply constraints. The investment follows several years of allocation-limited access that has periodically slowed prescribing growth across affected geographies. Competitors are watching this capacity build-out closely.
Signal: Indicates manufacturing capacity remains a
DECEMBER 2025

Pfizer and a Regional Employer Coalition Sign Coverage Agreement

Pfizer signed a value-based coverage agreement with a regional employer health coalition tying a portion of pricing to documented total cost of care reduction across the coalition's covered population. The agreement is among the first of its kind in the category, and competitors are watching closely.
Signal: Suggests value-based contracting is moving

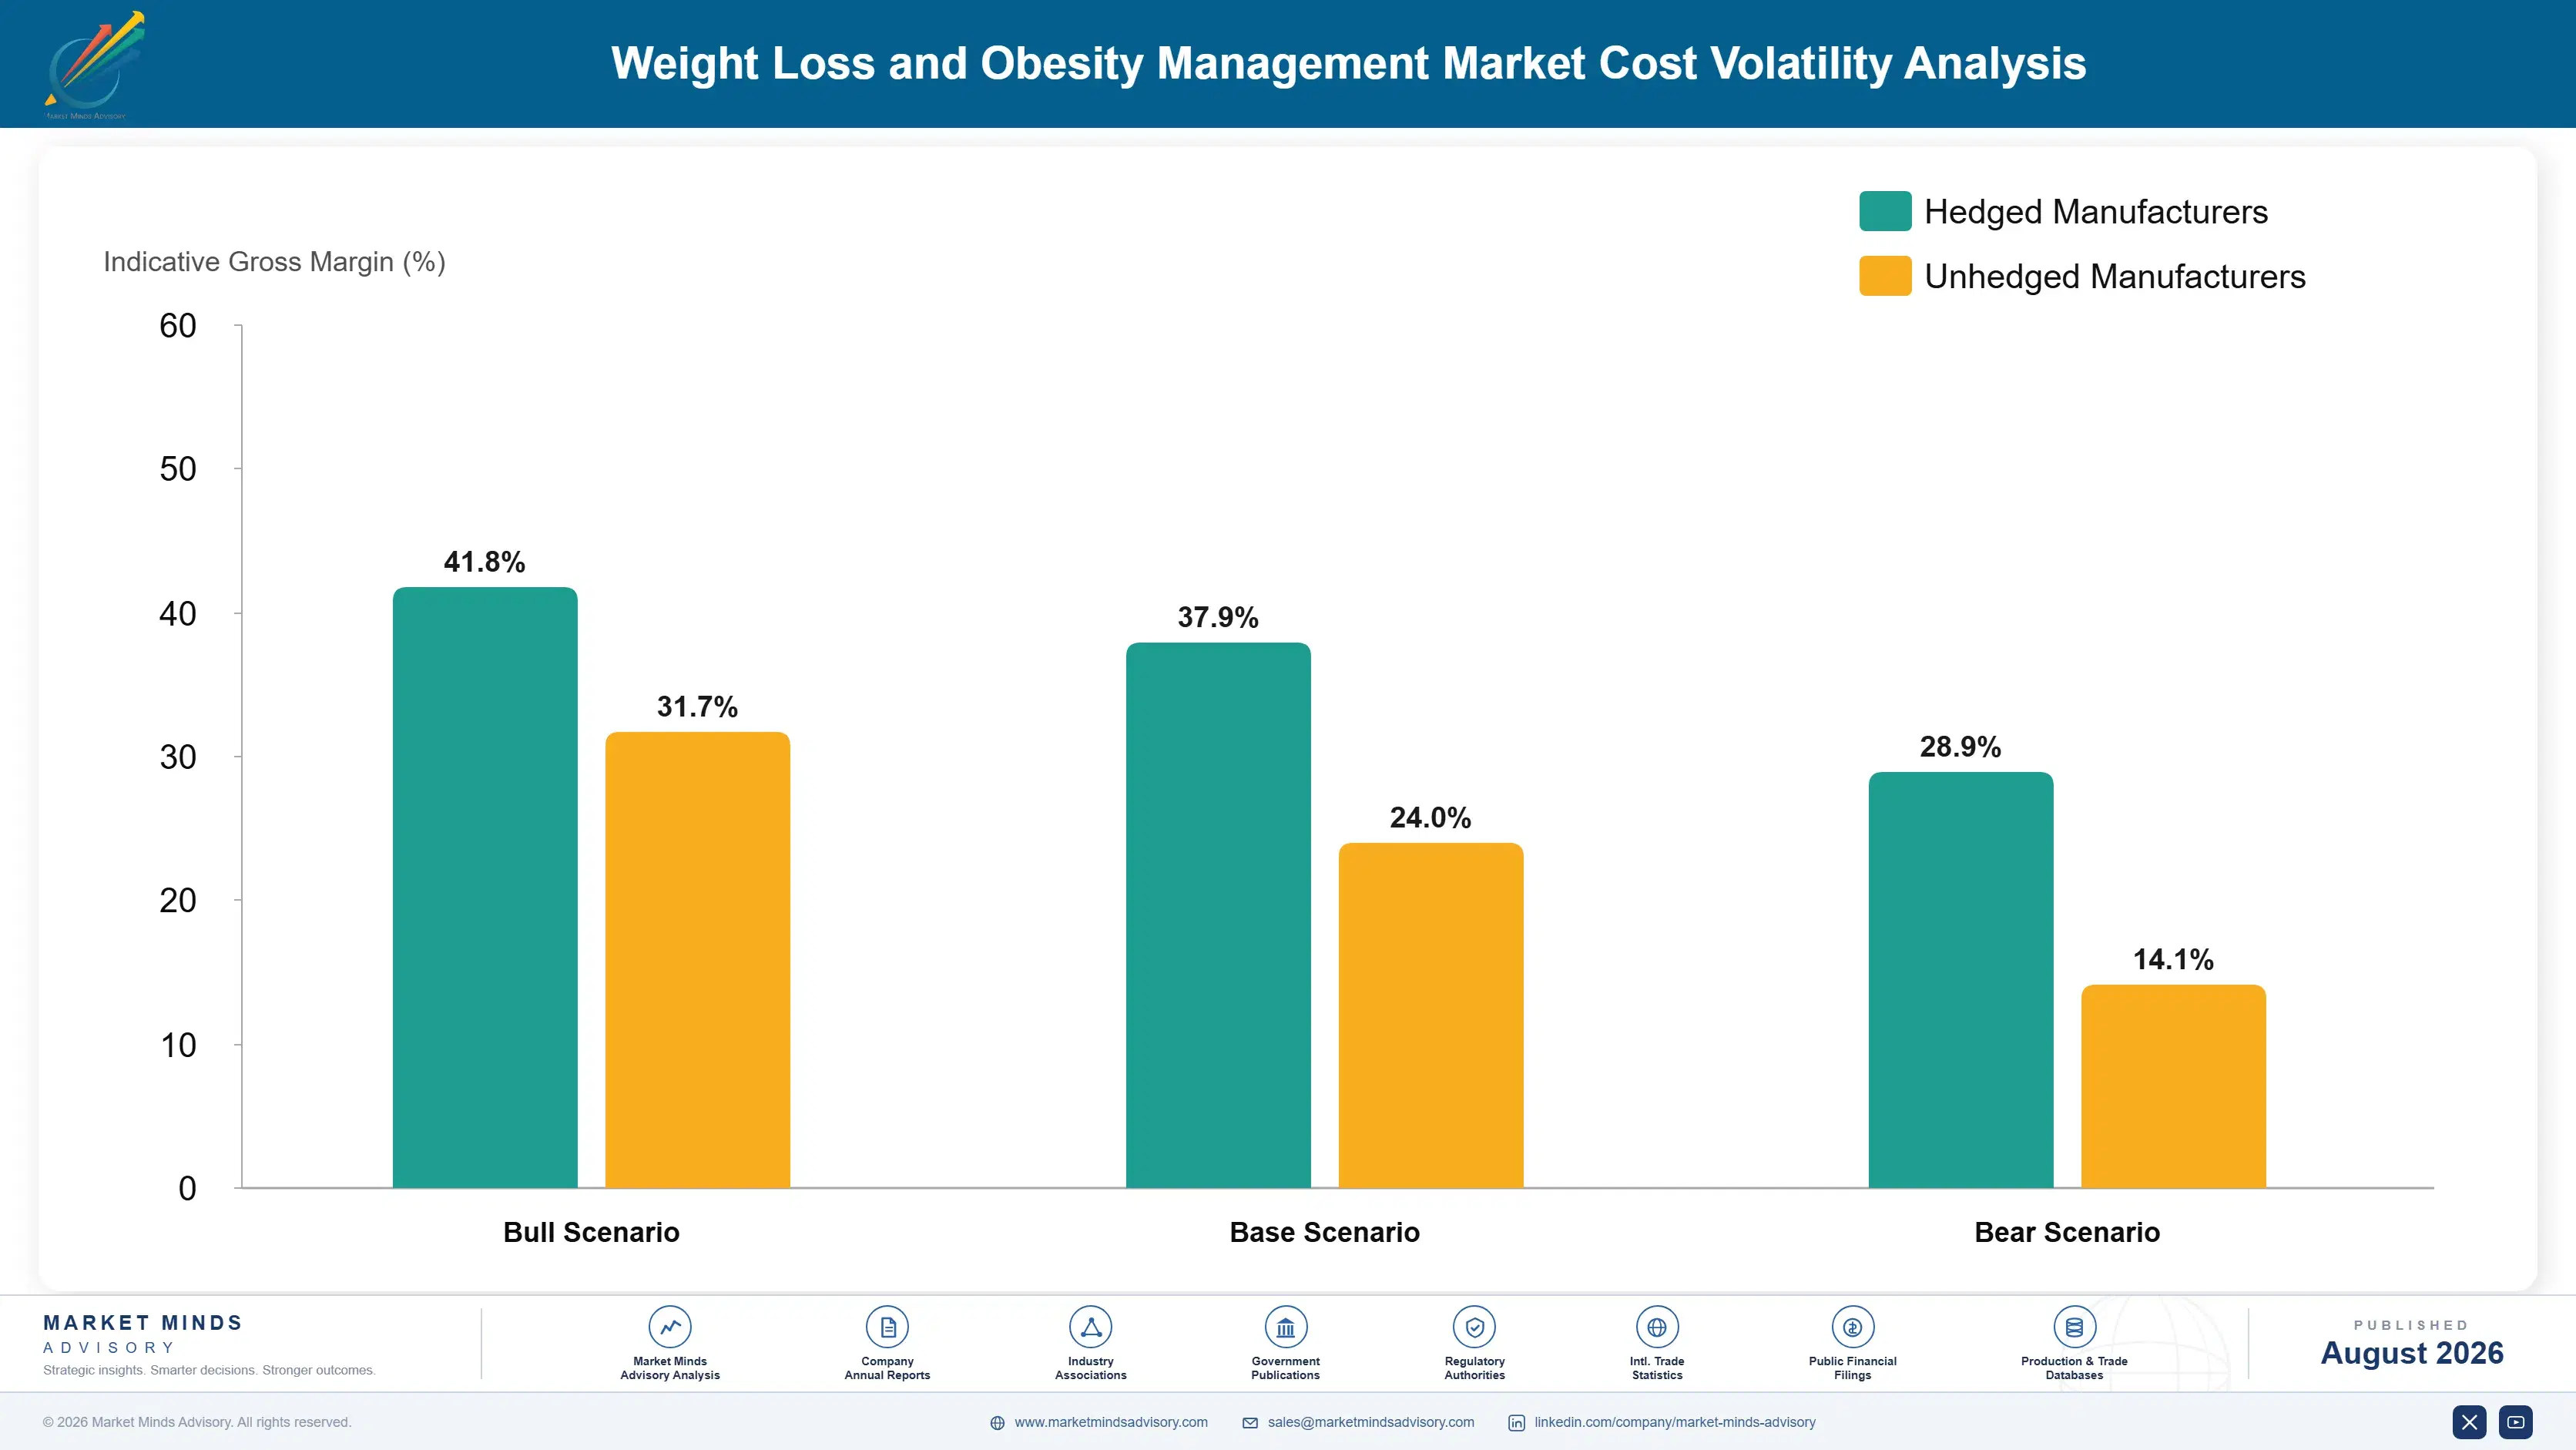
Peptide Manufacturing and Cold Chain Exposure

GLP-1 therapy production depends on complex peptide synthesis capacity, specialized fill-finish manufacturing, and cold chain distribution infrastructure, together representing a substantial share of unit cost of goods sold across the category. Peptide synthesis and fill-finish capacity are sourced predominantly from a small number of qualified biologics manufacturers in the United States, Denmark, and Germany. Limited supplier diversification remains a persistent constraint across this complex
Peptide manufacturing capacity constraints during 2022 and 2023 extended lead times and limited patient access to injectable GLP-1 formulations, a disruption documented in company annual report supply chain disclosures across the sector during that period. Several manufacturers responded by investing heavily in new production facilities and contract manufacturing partnerships, though full capacity normalization took roughly two years to complete across the industry, according to sector-wide capacity data.

Smaller manufacturers without long-term peptide manufacturing contracts or dual-sourced fill-finish capacity face proportionally higher exposure to input cost inflation and allocation constraints during periods of tight supply. The largest manufacturers' scale purchasing agreements and vertically integrated production capacity provide meaningful cost and supply certainty advantages that smaller, pipeline-stage entrants have not yet been able to replicate at comparable volume and reliability.
weight-loss-and-obesity-management-market-cost-volatility-analysis-1787309925821

Expanded Peptide Manufacturing Capacity Investment

Leading manufacturers have invested heavily in new peptide synthesis and fill-finish manufacturing facilities to reduce single-site production exposure and expand overall industry capacity. This capacity investment requires substantial upfront capital but has measurably shortened recovery time during subsequent demand surges, according to recent company disclosures and capacity reports. Multiple manufacturers have adopted this approach industry-wide in recent years.

Long-Term Contract Manufacturing Partnerships

Multi-year contract manufacturing agreements with qualified biologics production partners lock in capacity allocation and pricing during periods of tight industry-wide demand. The largest manufacturers have used scale purchasing volume to secure priority allocation status that smaller pipeline-stage competitors cannot easily match, per recent disclosures. This advantage compounds meaningfully during extended periods of tight demand.

Diversified Cold Chain Distribution Networks

Manufacturers have expanded diversified cold chain distribution partnerships to reduce single-point-of-failure risk in delivering temperature-sensitive formulations to pharmacies and patients. This diversification trades modest logistics cost increases for meaningfully reduced distribution disruption risk during future supply shocks across the broader category. Carrying costs remain modest relative to the disruption risk avoided overall. Larger manufacturers lead this diversification effort.

Portfolio Architecture for Margin Defence

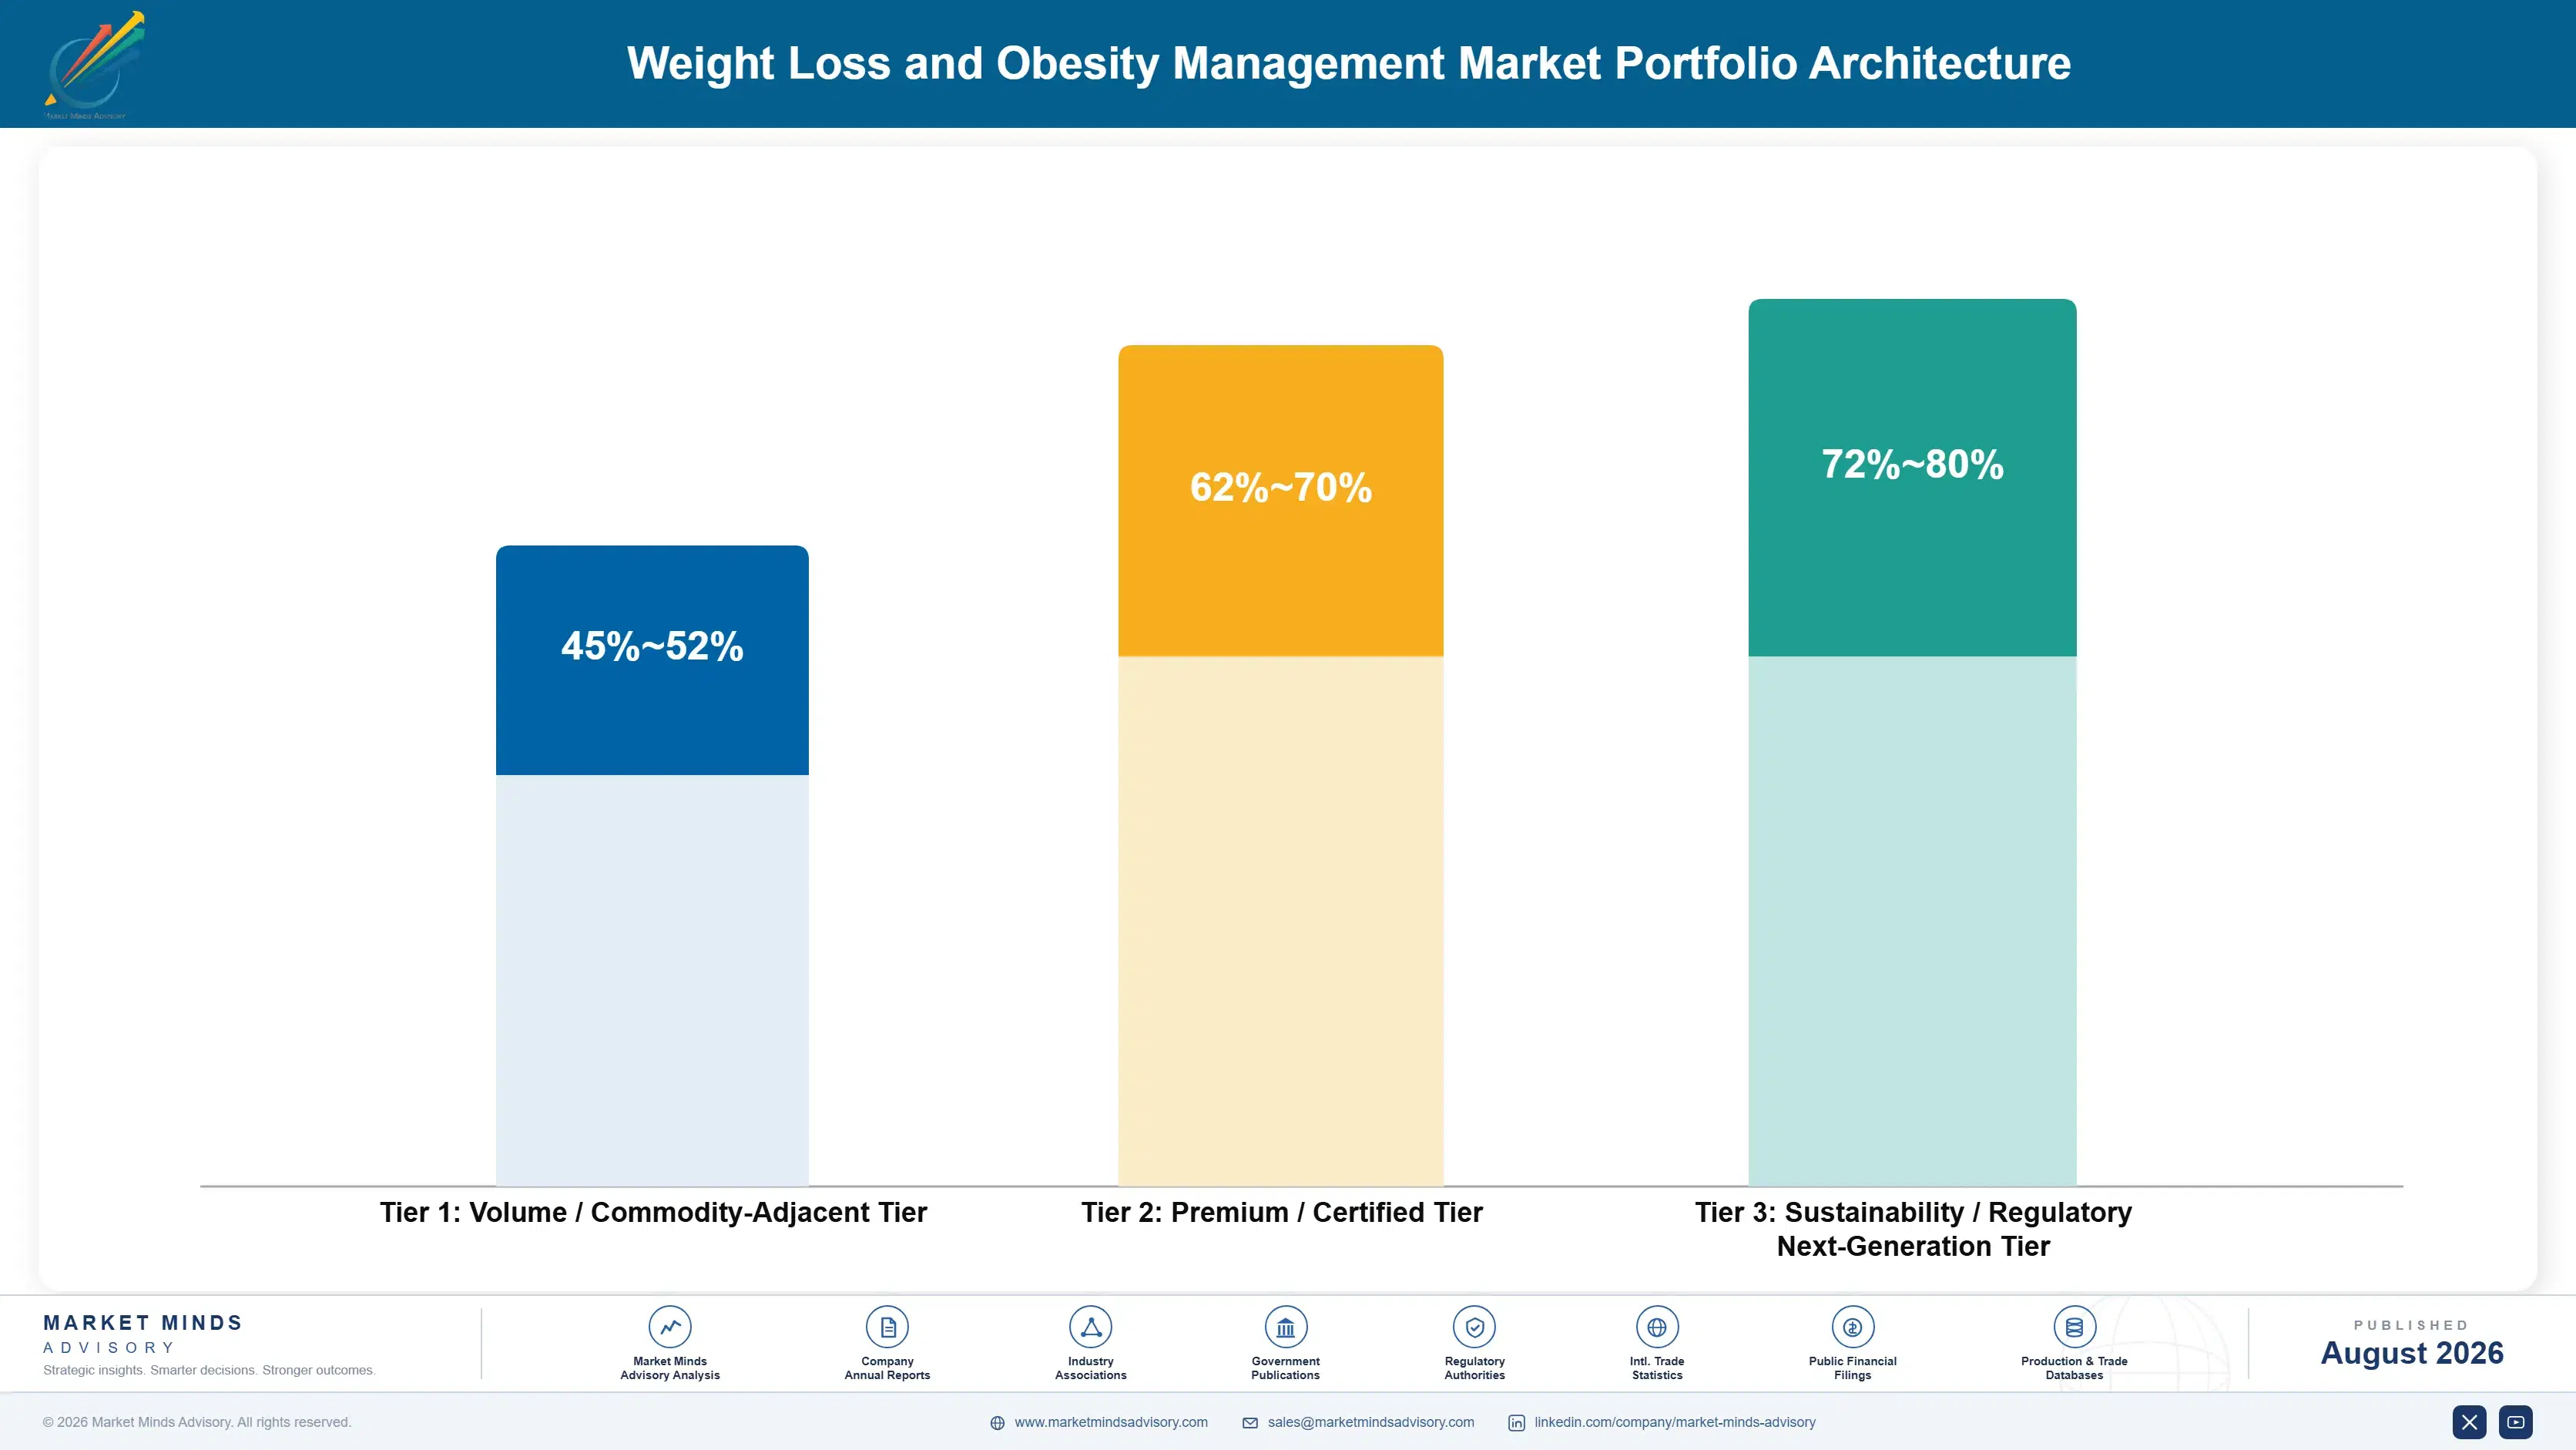
The category's margin architecture separates into three tiers: volume-adjacent meal replacement and behavioral programs carrying the thinnest margins around forty-eight percent, bariatric surgical devices and digital platforms carrying stronger margins in the mid-sixties, and GLP-1 pharmacotherapy commanding the highest prices and margins as sustained adherence evidence continues to strengthen across the covered patient base. This tiering broadly mirrors how payers evaluate competing formulary o
Manufacturers face a persistent tension between defending broad-based, lower-margin behavioral and nutrition program volume, which remains familiar to a large cohort of established patients, and pushing payers toward premium GLP-1 pharmacotherapy that carries meaningfully better unit economics but requires additional adherence infrastructure investment to sustain long-term coverage relationships. Payer benefit committees increasingly scrutinize this trade-off during annual formulary renewal negotiations.

High-value margin pools concentrate specifically in GLP-1 pharmacotherapy and its associated adherence support and digital companion revenue, where sustained treatment relationships and recurring engagement fees combine to lift blended margins well above the behavioral program baseline across the broader portfolio and covered patient population this forecast period. Manufacturers investing early in this convergence stand to capture disproportionate long-term value.

Volume / Commodity-Adjacent Tier

Meal replacement products and behavioral coaching programs sold primarily on established track record and price accessibility relative to premium pharmacotherapy. Broad-based patient populations remain the primary buyer segment here. Price-sensitive populations without pharmacy benefit coverage frequently select this tier.
Gross Margin: 45-52%

Premium / Certified Tier

Bariatric surgical devices and digital weight management platforms carrying documented efficacy evidence and broader payer familiarity than newer pharmacotherapy, positioned as the established middle tier across most treatment settings nationwide.
Gross Margin: 62-70%

Sustainability / Regulatory / Next-Generation Tier

GLP-1 pharmacotherapy bundled with adherence support and digital companion subscriptions tied to documented weight-loss durability outcomes across large employer and government payer covered populations. Large employer and government payers pursuing formulary consolidation lead adoption in this tier.
Gross Margin: 72-80%
weight-loss-and-obesity-management-market-portfolio-architecture-1787309926318

High-value Sub-segments and Strategic Watch-out

GLP-1 Receptor Agonist Therapies

The fastest-growing, highest-margin segment as payers increasingly specify GLP-1 coverage as a baseline formulary requirement nationwide. Manufacturers with strong outcomes data are converting formulary share ahead of slower-moving competitors lacking comparable evidence. Payer coverage recognition continues expanding across most major reimbursement geographies. across most markets.
Gross Margin: 72-78%

Digital Weight Management Platforms

A large, established, high-margin segment benefiting from rising employer willingness to bundle digital platform access with pharmacy benefits as a combined obesity management offering across most major employer plans. Manufacturers continue expanding platform integration and clinical decision support each product cycle. Larger employers lead early adoption of these bundled offerings.
Gross Margin: 60-66%

Bariatric Surgical Devices

A steady, mid-margin segment sold primarily on established surgical outcomes track record, facing gradual share displacement as GLP-1 pharmacotherapy earns broader first-line treatment recognition across most major reimbursement geographies this period. Manufacturers continue defending price against pharmacotherapy encroachment nationwide. Independent bariatric surgery centers remain the primary providers here.
Gross Margin: 46-52%

Meal Replacement and Nutrition Programs

A large but pressured segment retaining a meaningful role in patients not eligible for or preferring not to pursue pharmacotherapy, though it faces gradual displacement as GLP-1 access expands broadly. Behavioral programs remain a meaningful complement for many patients still. Independent programs with lower barriers continue serving this segment.
Gross Margin: 34-40%

Chronic Adherence and Lifetime Value Economics

Revenue in this category behaves like a chronic therapy annuity once a patient begins treatment: continued pharmacotherapy is required to maintain weight loss, and discontinuation typically reverses clinical benefit within months, which sustains manufacturer revenue well past the initial prescription across a multi-year treatment relationship rather than a single episodic purchase. This recurring structure gives manufacturers meaningful revenue visibility tied closely to patient retention.
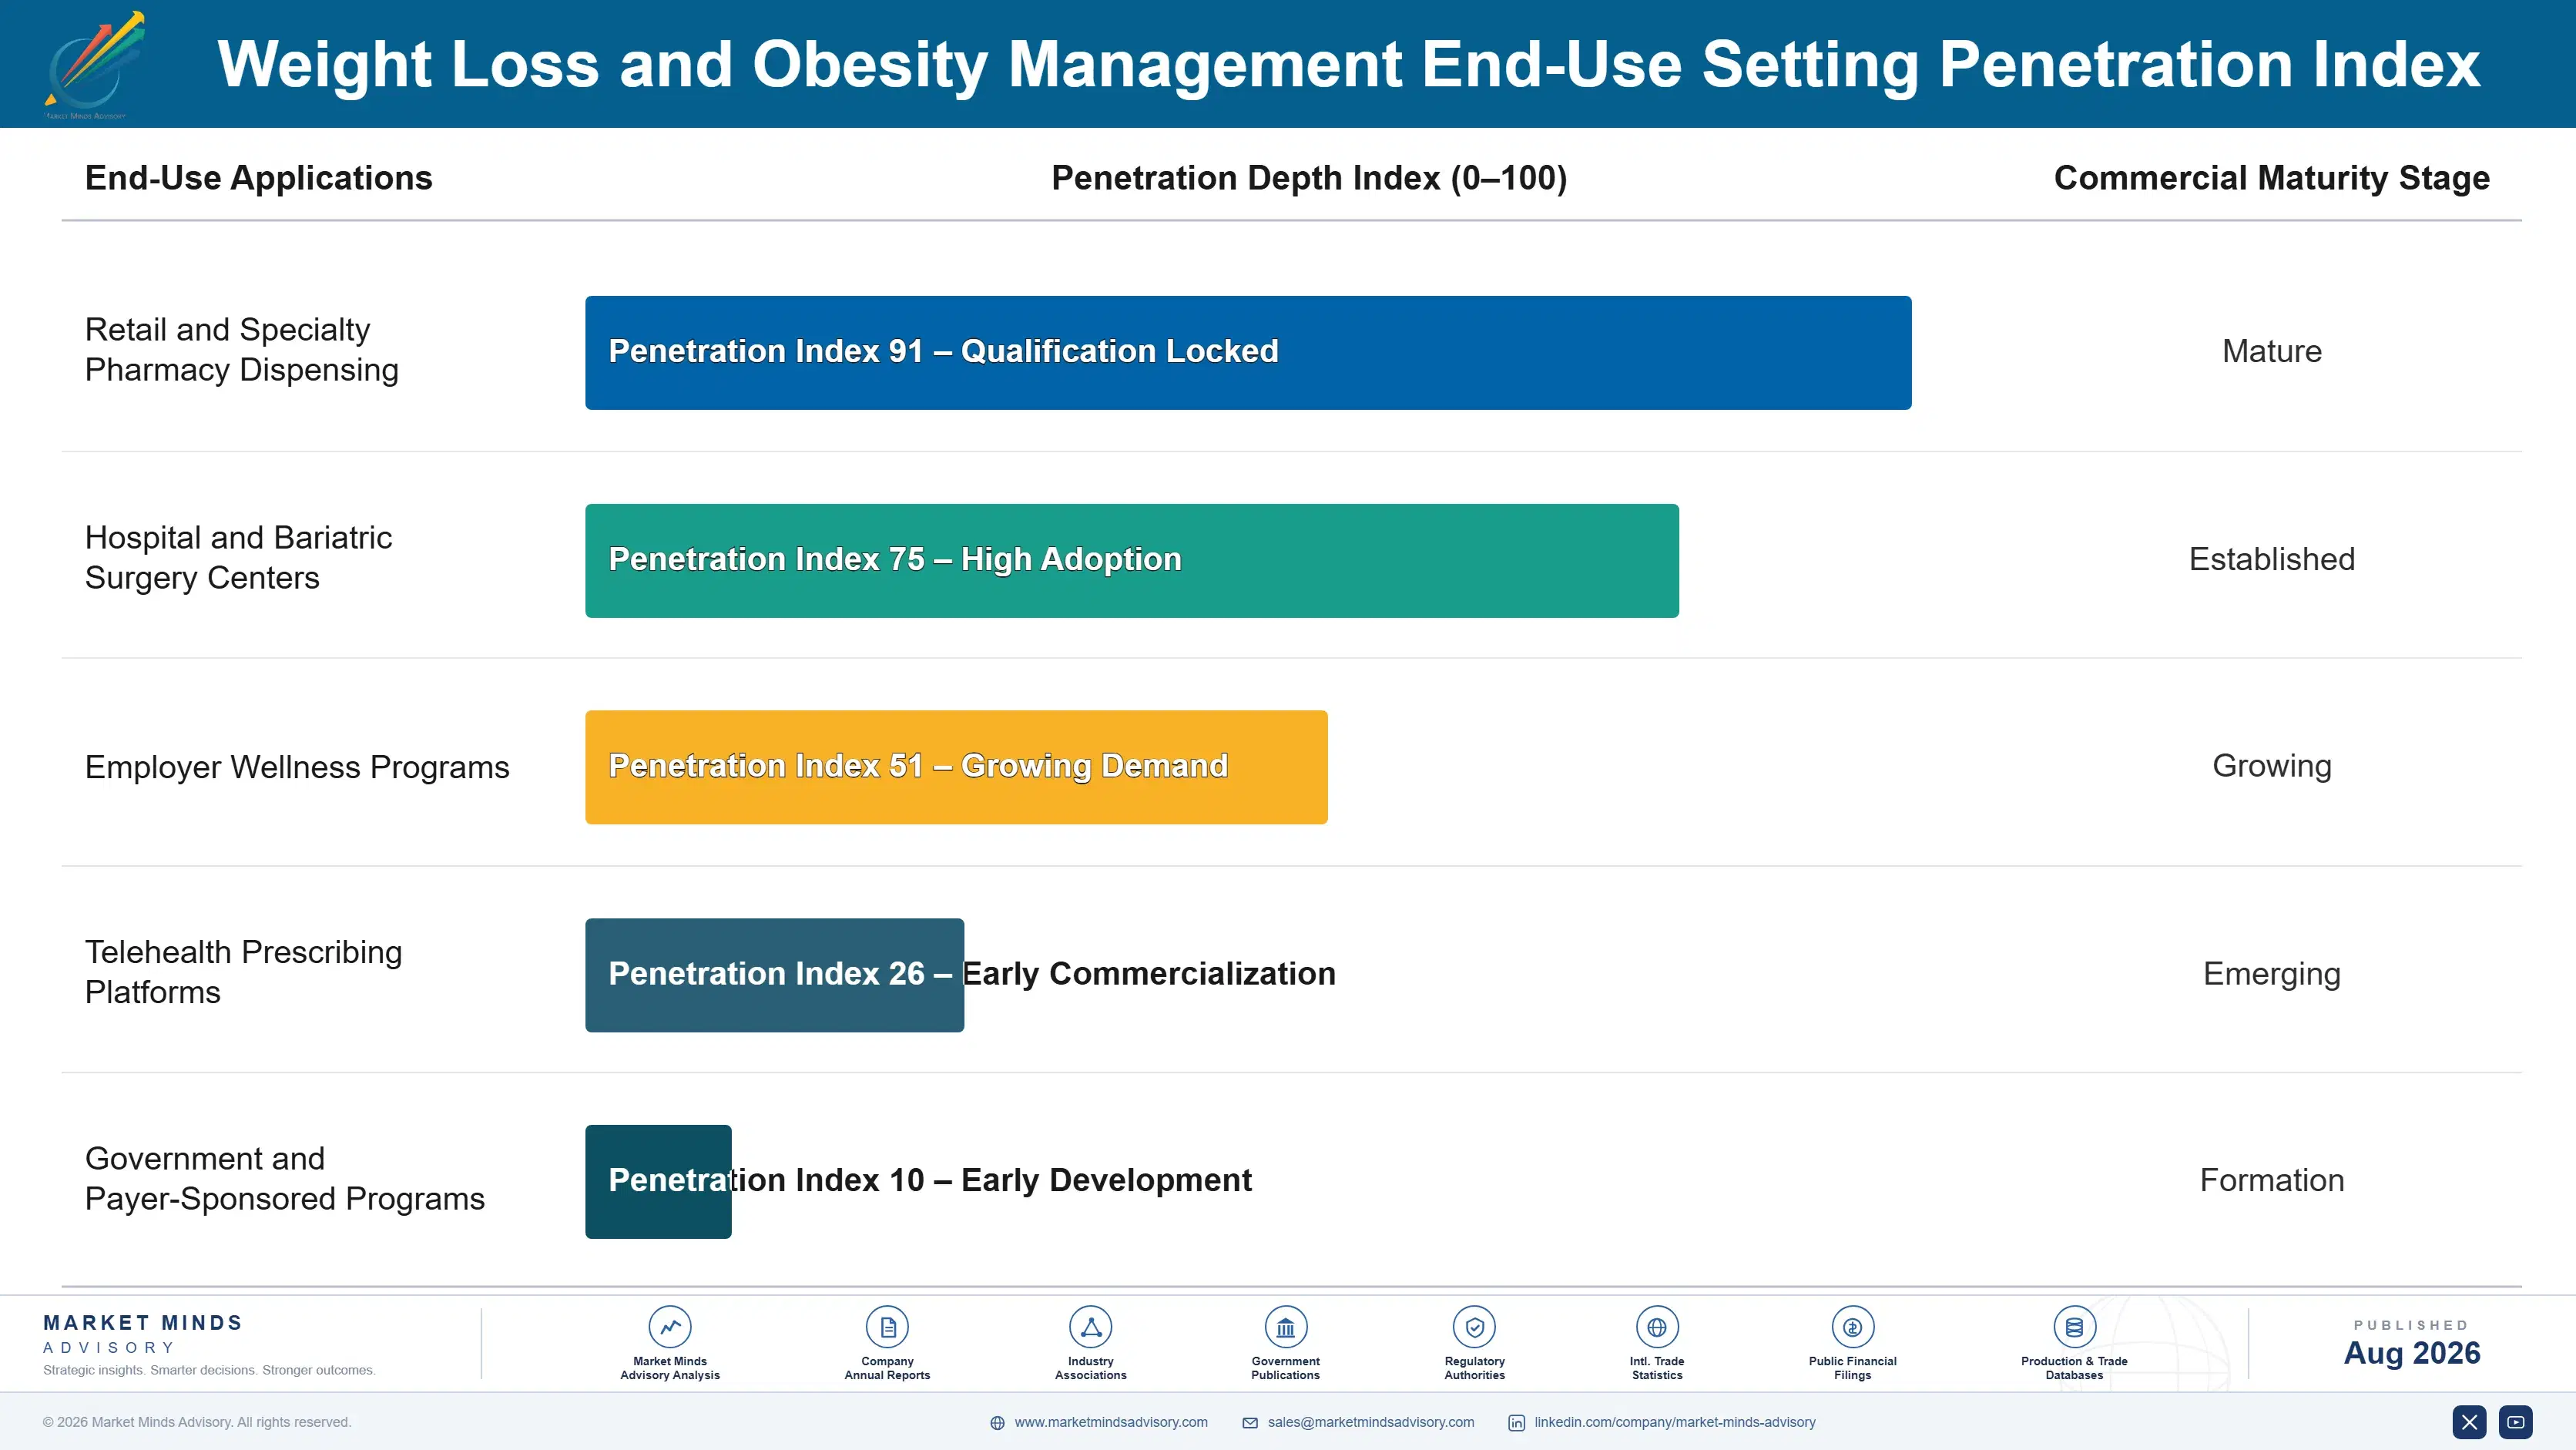
Adoption depth varies meaningfully by clinical vertical. Endocrinology and diabetes care programs show the deepest, most consistent GLP-1 adoption, while primary care and general wellness programs adopt more selectively, reserving pharmacotherapy for higher-complexity cases after exhausting simpler behavioral and dietary options already familiar to their patients. Employer-sponsored wellness programs represent a smaller but rapidly growing adoption channel as benefit design increasingly incorporates pharmacotherapy coverage.

A generational shift in buyer profile is underway as younger prescribers trained during the GLP-1 era default to evidence-based first-line pharmacotherapy selection, while an older cohort trained on legacy behavioral-first approaches shows more hesitancy rooted in decades of prior clinical practice patterns and established treatment protocols. Manufacturers increasingly tailor sales approaches differently across these two distinct prescriber cohorts to maximize conversion.
weight-loss-and-obesity-management-market-end-use-penetration-index-1787309926809

What Obesity Treatment Makers Should Do

These are among the four positions where our research anticipates prominent divergence between winners and laggards over the coming forecast period. Each is grounded in the demand model, the regulatory perimeter, and the announced capacity pipeline.
01 / ORAL FORMULATION INVESTMENT

Oral GLP-1 access is becoming the next competitive battleground.

Two of five leading manufacturers already have oral GLP-1 candidates in late-stage trials, and three smaller competitors have programs entering pivotal studies in 2026 targeting needle-averse patient populations. Manufacturers still selling purely injectable formulations by 2029 will find themselves competing only on price against oral platforms with stronger patient access and adherence evidence. The investment case for oral delivery has moved from optional differentiation to a defensive necessity for defending prescriber and payer preference nationwide across most major reimbursement geographies and prescriber networks.
02 / ADHERENCE SUPPORT STRATEGY

Reducing discontinuation directly protects long-term therapy revenue.

Manufacturers with dedicated adherence support infrastructure report meaningfully lower discontinuation rates than those relying solely on pharmacy dispensing without structured patient support programs across comparable payer geographies and benefit designs nationwide. Manufacturers building deeper adherence relationships now will retain patients longer than competitors relying on price competition alone to win formulary access across comparable payer networks, treating this as a durable differentiator. This support investment increasingly separates preferred suppliers from commodity vendors as payer scrutiny of aggregate spend intensifies nationwide across most major markets.
03 / VALUE-BASED CONTRACT STRATEGY

Early value-based agreements set precedent for pricing total cost outcomes.

Pfizer's December 2025 coverage agreement with a regional employer coalition ties pricing explicitly to documented total cost of care reduction, a structure other manufacturers and employer coalitions are watching closely this budget cycle across the industry. Manufacturers with strong cost-avoidance data have the most to gain from moving early into similar contracts ahead of competitors. Those without comparable data risk being locked out of preferred coalition status as these agreements proliferate nationwide over the next several years across most major reimbursement geographies.
04 / MANUFACTURING CAPACITY RESILIENCE

Continued capacity investment is now a competitive requirement, not optional.

The 2022 to 2023 peptide manufacturing shortage showed clearly that capacity-constrained manufacturers faced longer patient access delays than those investing early in expanded production infrastructure across multiple qualified biologics facilities worldwide and contract manufacturing partners. Smaller pipeline-stage manufacturers without the capital scale to build comparable capacity remain more exposed to future allocation constraints and access disruptions. This resilience gap increasingly factors into payer and prescriber preference alongside clinical evidence and pricing considerations across most major reimbursement geographies and testing regions.

Engagement Snapshot From the Field

A live engagement with an industry participant carrying material or product regulatory and market exposure ahead of a defining policy shift, showing how our research translates into a defensible multi-year portfolio strategy.
MARKET MINDS ADVISORY · CLIENT ENGAGEMENT SUMMARY
Weight Loss and Obesity Management Producer Strategic Portfolio Review and Transition Roadmap 2026·Investment Scenario on Weight Loss and Obesity Management Exposure Evaluation 2025-26
CLIENT PROFILE
The client is a regional employer health coalition representing several mid-sized companies with a combined covered population in the tens of thousands of employees and dependents. The coalition's benefits committee had flagged rapidly rising GLP-1 pharmacy spend as a category requiring closer review ahead of its next annual benefit design cycle, prompting the engagement. Confidentiality requirements limit disclosure of the coalition's exact identity.
STRATEGIC CHALLENGE
The coalition needed to design a sustainable GLP-1 coverage policy that balanced growing employee demand against aggregate cost concerns, without triggering adverse employee relations from restrictive prior-authorization criteria. Leadership also wanted a defensible framework for evaluating adherence support programs against standard pharmacy benefit dispensing already in place across member companies.
MMA APPROACH
MMA conducted structured interviews with the coalition's benefits committee members and participating employer HR leaders, benchmarked coverage criteria and total cost of care data against comparable regional employer coalitions, and modeled projected spend across a three-year benefit design scenario. The analysis incorporated both published comparative-effectiveness literature and coalition-specific claims data by member company.
KEY FINDINGS
  1. Comorbidity-related costs among untreated eligible employees exceeded the projected incremental cost of expanded GLP-1 coverage across the coalition's own claims data (client-reported, unverified by MMA).
  2. Adding structured adherence support to the benefit design was projected to reduce discontinuation-driven wasted spend meaningfully while improving employee satisfaction scores (client-reported, unverified by MMA).
  3. Employees enrolled in bundled digital companion platforms showed measurably higher one-year adherence rates compared with those receiving standard pharmacy dispensing alone across the coalition's population.
  4. Member companies offering structured prior-authorization support reported measurably faster treatment initiation timelines than those using generic pharmacy benefit manager criteria alone across the coalition.
CLIENT PROFILE
The client is a regional employer health coalition representing several mid-sized companies with a combined covered population in the tens of thousands of employees and dependents. The coalition's benefits committee had flagged rapidly rising GLP-1 pharmacy spend as a category requiring closer review ahead of its next annual benefit design cycle, prompting the engagement. Confidentiality requirements limit disclosure of the coalition's exact identity.
STRATEGIC CHALLENGE
The coalition needed to design a sustainable GLP-1 coverage policy that balanced growing employee demand against aggregate cost concerns, without triggering adverse employee relations from restrictive prior-authorization criteria. Leadership also wanted a defensible framework for evaluating adherence support programs against standard pharmacy benefit dispensing already in place across member companies.
MMA APPROACH
MMA conducted structured interviews with the coalition's benefits committee members and participating employer HR leaders, benchmarked coverage criteria and total cost of care data against comparable regional employer coalitions, and modeled projected spend across a three-year benefit design scenario. The analysis incorporated both published comparative-effectiveness literature and coalition-specific claims data by member company.
KEY FINDINGS
  1. Comorbidity-related costs among untreated eligible employees exceeded the projected incremental cost of expanded GLP-1 coverage across the coalition's own claims data (client-reported, unverified by MMA).
  2. Adding structured adherence support to the benefit design was projected to reduce discontinuation-driven wasted spend meaningfully while improving employee satisfaction scores (client-reported, unverified by MMA).
  3. Employees enrolled in bundled digital companion platforms showed measurably higher one-year adherence rates compared with those receiving standard pharmacy dispensing alone across the coalition's population.
  4. Member companies offering structured prior-authorization support reported measurably faster treatment initiation timelines than those using generic pharmacy benefit manager criteria alone across the coalition.
RECOMMENDED STRATEGY
Phase 1: Phase 1 (Months 1-3): Complete a coalition-wide claims and comorbidity cost audit across all member companies to establish a defensible benefit design baseline. Phase 2: Phase 2 (Months 4-8): Design and pilot an expanded coverage policy with structured adherence support at two member companies before full coalition rollout. Phase 3: Phase 3 (Months 9-14): Extend the expanded coverage and adherence support model across all remaining member companies based on pilot outcomes.
OUTCOME
The coalition adopted an expanded GLP-1 coverage policy with structured adherence support across all member companies within nine months of the engagement's conclusion. Leadership reported improved budget predictability heading into the following benefit cycle and measurably higher employee satisfaction with the redesigned pharmacy benefit (client-reported, unverified by MMA).

Frequently Asked Questions

Foundational context covering the market sizes, CAGR, scope, country, region and competition that inform every finding below. This section is provided to cover basics and most often pre-purchase conversations, answered from the MMA Primary Research Dataset.

What is the current size of the Weight Loss and Obesity Management Market?

placeholder

How large will the Weight Loss and Obesity Management Market be by 2036?

placeholder

What is the CAGR for the Weight Loss and Obesity Management Market 2026 to 2036?

placeholder

Which segment is growing fastest?

placeholder

Who are the major companies in the Weight Loss and Obesity Management Market?

placeholder

Which country is growing fastest?

placeholder

Report Segmentation Architecture

The full report scope spans multiple orthogonal segmentation dimensions, with cross-tabulated demand data provided for each dimension pair. Coverage extends further to regional breakdowns, trend trajectories, and the competitive detail needed to support segment-level decision-making.

By Treatment Modality

  • GLP-1 Receptor Agonist Therapies
  • Digital Weight Management Platforms
  • Bariatric Surgical Devices
  • Meal Replacement and Nutrition Programs
  • Combination Pharmacotherapy
  • Behavioral and Coaching Programs

By End-Use Setting

  • Retail and Specialty Pharmacy Dispensing
  • Hospital and Bariatric Surgery Centers
  • Employer Wellness Programs
  • Telehealth Prescribing Platforms
  • Government and Payer-Sponsored Programs

By Patient Segment

  • Newly Diagnosed Obesity Patients
  • Type 2 Diabetes Comorbid Patients
  • Post-Bariatric Surgery Patients
  • Adolescent Obesity Patients

By Region

  • North America
  • Western Europe
  • East Asia
  • South Asia and Pacific
  • Latin America
  • Middle East and Africa
  • Eastern Europe

Scope, Methodology, and Coverage

Every figure in this report is reproducible from documented input assumptions. The scope below maps the historical period, the forecast horizon, the segmentation dimensions, and the countries covered, alongside the underlying primary and qualitative methodology.
Historical Period
2020 to 2025
Forecast Period
2026 to 2036
Base Year
2025 (USD billions; MMA Primary Research Dataset, August 2026)
Market Definition
This market covers pharmaceutical therapies, surgical devices, and structured programs used to treat obesity and support sustained weight loss, including GLP-1 receptor agonists, bariatric surgical devices, and digital weight management platforms. It excludes general fitness equipment, cosmetic body contouring procedures, and unregulated dietary supplements without clinical weight management indications.
Quantitative Units
USD billions (current prices); patient volume where applicable
Segmentation Dimensions
By Treatment Modality; By End-Use Setting; By Patient Segment; By Region
Regions Covered
North America, Western Europe, East Asia, South Asia and Pacific, Latin America, Middle East and Africa, Eastern Europe
Countries Covered
USA, China, Germany, France, UK, Japan, South Korea, India, Australia, Canada, Brazil, Mexico, Indonesia, Vietnam, Thailand, Malaysia, UAE, Saudi Arabia, South Africa, Nigeria, Turkey, Poland, Netherlands, Italy, Spain, Sweden, Switzerland, Argentina, Colombia, Singapore, and additional markets relevant to this sector
Key Companies Profiled
Novo Nordisk A/S, Eli Lilly and Company, Boehringer Ingelheim, Pfizer Inc., Amgen Inc., Zealand Pharma A/S, Viking Therapeutics Inc., Structure Therapeutics Inc., Rhythm Pharmaceuticals Inc., Novartis AG, AstraZeneca plc, Regeneron Pharmaceuticals Inc., Altimmune Inc., Metsera Inc., Terns Pharmaceuticals Inc., Noom Inc., WeightWatchers International LLC, Ro (Roman Health Ventures Inc.), Currax Pharmaceuticals LLC, Gelesis Holdings Inc.
Quantitative Methodology
Primary survey, n=3,800 respondents, Q4 2025, six countries; demand-side model with trade association cross-validation
Qualitative Methodology
47 expert interviews, Q4 2025; applied to validate demand model assumptions, identify emerging dynamics, and assess competitive positioning
Report Format
PDF and XLSX data workbook (Word format preview document)
Publisher
Market Minds Advisory
Report Code
MMA-2026-HLT-172
Published
August 2026
Contact
sales@marketmindsadvisory.com | www.marketmindsadvisory.com

Purchase the full Weight Loss and Obesity Management Market Report (2026 to 2036).

placeholder
placeholder
placeholder
placeholder
placeholder
placeholder
placeholder

Built For The People Who Decide

From boardroom strategy to bench-side execution, this report is read cover-to-cover by leaders shaping the next decade of their industry, turning demand scenarios, market dynamics and valuation benchmarks into decisions.
CXOs/ Presidents/ VPs/ Managers
M&A and Corporate Development
Strategy Teams and R&D Heads
Procurement and Product Directors
Regulatory and Compliance Leaders
Investor Relations and Equity Analysts