

Market Minds Advisory
Web Scraping Software Market

Web Scraping Software Market: Web Scraping Software Market. Data Extraction APIs, Proxy Infrastructure, and Anti-Bot Bypass Solutions, 2026 to 2036

Websites deploying increasingly aggressive anti-bot defenses are forcing web scraping vendors into a genuine arms race, while AI companies hungry for training data have pulled entirely new buyers into the market.

Lead Analyst

Published

September 2026

Make Smarter Decisions with Customized Research Insights

Request a free sample report and evaluate market opportunities, growth trends, and competitive dynamics relevant to your business needs.

2025 MARKET VALUE$1.1BMarket Size 2025
2036 FORECAST VALUE$5.1BBase Case , 2026 to 2036
CAGR 2026 TO 203615.0 %Bull 16.3% / Bear 13.7%
INCREMENTAL OPPORTUNITY$3.8BNet 10- year value creation
EXPANSION MULTIPLE4.05x2036 value over 2026 base
Strategic Levers
M&A Pipeline
Regional Outlook
Country Rankings
Competitive Intelligence
Segmental Deep-dive
Call-Us : 91 93563 13602

Executive Snapshot and Market Trajectory.

Web scraping has quietly transformed from a niche tool used by price comparison sites and academic researchers into critical infrastructure that large language model developers depend on to source training data their products require, fundamentally reshaping who buys scraping software and how much they will pay for reliability.
Managed and enterprise scraping-as-a-service platforms are growing fastest as AI companies increasingly outsource the technically demanding work of bypassing anti-bot defenses at scale rather than building and maintaining that capability internally, a shift that has pulled well-funded new customers into a market previously dominated by smaller price comparison and market research buyers. North America leads regional demand given its concentration of major AI companies and technology firms driving the bulk of large-scale data extraction spending.
Competitive intensity is escalating into a genuine technical arms race, as websites deploy increasingly sophisticated bot detection systems that scraping vendors must continuously work to bypass, forcing sustained engineering investment that smaller vendors increasingly struggle to match against better-capitalized rivals with dedicated anti-detection research teams operating around the clock, a gap that widens further whenever a major browser vendor ships new fingerprinting defenses.
Market Definition
The Web Scraping Software Market covers platforms, APIs, and proxy infrastructure used to programmatically extract structured data from public websites, including anti-bot bypass and browser automation tooling. It excludes general-purpose data integration software, manual data entry services, and licensed data marketplaces that do not perform extraction themselves.
Base Year Value
$1.1B in 2025 (MMA Primary Research Dataset, September 2026)
Forecast Period
2026 to 2036, eleven discrete annual values
CAGR
15.0% base case. Bull 16.3%. Bear 13.7%.
Fastest Growth Segment
Managed and Enterprise Scraping-as-a-Service Platforms: 17.0% CAGR
Fastest Growth Country
Lithuania: 18.0% CAGR
Fastest Growth Region
South Asia and Pacific: 17.2% CAGR
Largest Region
North America: 30% of 2025 global value
Market Leaders
Leading vendors: Bright Data, Oxylabs, Zyte, ScraperAPI, Apify. Source: MMA Primary Research Dataset, July 2026.
Primary Survey
n=3,800 procurement and R&D decision-makers, Q4 2025, six countries
Methodology
Demand-side build-up, cross-validated against public data, 47 expert interviews

Web Scraping Software Market Forecast Scenarios

web-scraping-software-size-forecast-scenario-1789990016020
The market's early years were defined by fragmented open-source scraping libraries and small proxy resellers serving price comparison and travel aggregation buyers, with growth steady but unremarkable against a backdrop of relatively simple website defenses that most in-house engineering teams could handle without specialized tooling, keeping annual spending modest and vendor churn high throughout the period.
Base case growth through 2036 rests on three commercial mechanisms: continued AI model training data procurement at scale, e-commerce brands expanding price and inventory monitoring programs across dozens of additional marketplaces each year, and financial services firms building alternative data pipelines for investment research, each reinforcing demand for managed extraction infrastructure that keeps pace with defensive countermeasures deployed by publishers and platform operators worldwide, and each recurring on renewable annual contracts rather than one-time purchases.
A bull scenario turns on regulatory clarity following favorable court rulings on public data access, which would remove a persistent legal overhang for enterprise buyers and accelerate procurement approvals. The bear risk is a coordinated browser vendor and website publisher push toward cryptographic attestation that could make bypass economically unworkable for smaller vendors within a few short years.

The New Infrastructure Layer Behind AI Data Pipelines

Web scraping software sits at an unusual junction: a technology once treated as a gray-area workaround has become boardroom infrastructure for any company that needs external data at scale, and buyers now demand service-level agreements, dedicated account teams, and compliance documentation that would have been unthinkable in the market's earlier, scrappier years when a handful of open-source scripts sufficed for most jobs and budgets.
MARKET CONCENTRATIONCR5: 38%Top five vendors hold a modest combined market share
AVERAGE CONTRACT VALUE$42,000/yearTypical enterprise managed scraping subscription tier priced annually
TOP ORIGIN COUNTRY SHARELithuania: 12%Global proxy and scraping vendor headquarters heavily concentrated there
RESIDENTIAL PROXY COST SHARE34% of COGSLargest single recurring input cost for most vendors
ANTI-BOT BYPASS SUCCESS RATE91%Average successful extraction rate against actively defended target sites
CUSTOMER RENEWAL RATE88%Enterprise subscription renewal rate across leading platforms measured annually
Vendors compete less on raw extraction speed today and more on their ability to sustain access against ever-changing bot detection, which has pushed many to build residential and mobile proxy networks spanning millions of IP addresses worldwide and to hire specialized machine learning teams solely focused on mimicking human browsing behavior at scale across every major target website category and device type.
Pricing has shifted from simple per-request billing toward outcome-based contracts tied to successful data delivery, reflecting how much buyers now value reliability over raw volume, and larger vendors increasingly bundle data cleaning, structuring, and enrichment services on top of raw extraction to capture more of each customer's total data budget as procurement consolidates around fewer, larger suppliers each renewal cycle.
"The vendors treating this as a compliance and infrastructure business, not a clever engineering trick, are the ones enterprise buyers will still trust in three years. Everyone else is one court ruling away from a very bad quarter."
Practice Lead, Technology and Data Infrastructure Research · MMA Technology Practice · September 2026

Market Trends

AI Training Data Procurement Reshapes Buyer Composition

Large language model developers now account for a meaningful share of new enterprise scraping contracts, a buyer category that barely existed three years ago and that brings far larger budgets and far heavier extraction volumes than the price comparison and travel aggregation customers who once dominated demand. Several leading AI labs have disclosed multi-year data licensing and extraction partnerships worth tens of millions of dollars, and smaller model developers are following the same playbook at a smaller scale, pulling venture-funded buyers into a market previously served mostly by retailers and researchers.
Market Impact: AI data spend: $3 billion

Browser Fingerprinting Defenses Force Continuous Vendor Reinvestment

Major browser vendors and content delivery networks have rolled out increasingly sophisticated fingerprinting and behavioral analysis systems over the past two years, requiring scraping vendors to rebuild detection evasion logic every few months rather than annually as before, a pace few smaller teams can sustain. Cloudflare, Akamai, and DataDome collectively protect a large share of commercially significant websites, and each meaningful update to their bot management products forces a corresponding engineering response across the vendor landscape, raising the fixed cost of staying competitive and squeezing out under-capitalized smaller players industry-wide.
Market Impact: Marketplaces tracked per retailer up 2x

Market Opportunities and Growth Drivers

Generative AI Training Data Demand Accelerates Sharply

The compute and talent race among large language model developers has created sustained demand for fresh, diverse web text and image data at a scale that licensed data marketplaces alone cannot satisfy, pushing several major AI labs to sign direct extraction and proxy infrastructure contracts rather than relying solely on static licensed datasets. Industry estimates put annual AI-related data procurement spending in the low billions of dollars globally, a figure that barely existed as a spending category before 2023 and continues expanding as model training runs grow larger each year.
Market Impact: Contract delays: 3 to 4 months

E-Commerce Price Monitoring Expands Across More Marketplaces

Retailers and brands increasingly track competitor pricing, inventory availability, and promotional activity across dozens of marketplaces simultaneously, a practice that has moved from a nice-to-have analytics function to a core repricing input for companies competing hard on razor-thin margins nationwide. Major retail chains now refresh competitor price data multiple times daily rather than weekly, and the number of tracked marketplaces per retailer has roughly doubled over five years as cross-border e-commerce expansion accelerates, directly increasing the volume of extraction requests vendors must fulfill each month across every region they serve.
Market Impact: Proxy costs up 22%

Market Restraints and Challenges

Legal Uncertainty Around Public Data Access Persists

Court rulings on the legality of scraping publicly accessible websites remain inconsistent across jurisdictions, and the root cause is that most existing computer fraud and contract law predates large-scale automated extraction entirely, leaving judges to apply frameworks never designed for this activity. Enterprise buyers in regulated industries frequently delay or scale back contracts pending clearer guidance, and several vendors have responded by building in-house legal teams and publishing detailed compliance frameworks that document how their extraction methods respect robots.txt directives and published terms of service, a mitigation approach that has become a competitive differentiator among larger platforms.
Market Impact: AI buyers: 28% of contracts

Rising Proxy Infrastructure Costs Compress Vendor Margins

Residential and mobile proxy IP addresses have become significantly more expensive to source as demand from scraping vendors has outpaced the organic growth in available IP pools, and the underlying cause is that most residential proxy networks depend on consumer app SDK partnerships that pay per active device, a supply source that scales far more slowly than scraping demand. Vendors are mitigating the squeeze by building proprietary browser fingerprint rotation techniques that reduce how many proxy IPs each extraction job actually requires, and some are exploring direct ISP partnerships to secure supply outside the consumer app model entirely.
Market Impact: Defense updates now every 6 weeks
3 additional market trends, 2 additional growth drivers, and 4 additional restraints and challenges are covered in the full report. Contact sales@marketmindsadvisory.com to access the complete intelligence.

Segment CAGR and Growth Architecture

The market divides into five segments by delivery model, spanning fully managed scraping-as-a-service platforms, self-serve developer APIs, standalone proxy infrastructure sold independently of any scraping logic, browser automation and headless rendering tools, and professional services layered on top of raw extraction, each serving a distinct buyer sophistication level and price point across the industry.
web-scraping-software-market-share-analysis-1789990016568

Managed and Enterprise Scraping-as-a-Service Platforms

Managed and enterprise scraping-as-a-service platforms handle the entire extraction pipeline on the customer's behalf, from target identification through anti-bot bypass to delivering clean, structured data via API or scheduled export, and they command the highest per-contract revenue because buyers pay explicitly to avoid building and maintaining scraping infrastructure internally themselves and indefinitely. AI companies and large e-commerce brands increasingly favor this model precisely because their engineering teams would rather focus on core product work than on the constant cat-and-mouse game of evading detection every day, and vendors in this segment have responded by adding dedicated account management, custom SLAs, and compliance documentation that smaller self-serve competitors rarely offer their customers today.
CAGR 17.0%

Self-Serve Developer APIs and Proxy Infrastructure

Self-serve developer APIs let engineering teams write extraction logic themselves while outsourcing only the underlying proxy rotation, browser fingerprinting, and CAPTCHA solving infrastructure, appealing to smaller companies and individual developers who need flexibility and lower price points rather than a fully managed solution built around their exact use case and available budget constraints. This segment retains a large base of price-sensitive customers including academic researchers, small e-commerce operators, and independent data journalists, and usage-based pricing tiers starting at modest monthly minimums keep the barrier to entry low even as the same underlying infrastructure serves enterprise-grade reliability requirements for the largest self-serve accounts that scale up steadily over time each year.
CAGR 15.5%
Full segment breakdown across 5 segments available in the complete report.

Regional Architecture and Country Demand Map

North America leads on the sheer concentration of large AI companies and technology firms driving the bulk of high-value extraction spending nationwide, while East Asia and Western Europe follow closely with sizable e-commerce and financial data monitoring demand spread across their own diverse markets and industries.

North America

Concentration of large AI companies and cloud platform providers gives North America the biggest share of scraping spending, since these organizations run some of the largest training data extraction operations in the world and pay premium rates for reliability and compliance documentation. Financial services firms in New York and Chicago add a second major demand pool, building alternative data pipelines to inform investment decisions ahead of quarterly earnings releases. Retailers and marketplaces headquartered across the United States and Canada round out demand, tracking competitor pricing across dozens of e-commerce sites daily. Regulatory uncertainty around public data access remains a headwind, but enterprise budgets have kept growing regardless of ongoing litigation in several jurisdictions.
Share: 30% | CAGR: 16.3% (2026 to 2036)

Western Europe

Data protection regulation shapes almost every scraping contract signed in Western Europe, where GDPR compliance requirements push buyers toward vendors who can document exactly how personal data is filtered out of extraction pipelines before delivery. German and French manufacturers use scraping extensively for supply chain and raw material price monitoring, while London-based financial firms drive a meaningful share of alternative data demand. Vendors serving this region maintain dedicated compliance teams and often process data through EU-based infrastructure to satisfy data residency requirements that many American competitors initially underestimated. Growth trails North America and East Asia because enterprise AI adoption has moved more cautiously here, slowing the AI-driven demand surge seen elsewhere across the world.
Share: 21% | CAGR: 13.5% (2026 to 2036)
Regional intelligence for 5 additional markets available in the complete report: East Asia, South Asia and Pacific, Latin America, Middle East and Africa, Eastern Europe. Contact sales@marketmindsadvisory.com.
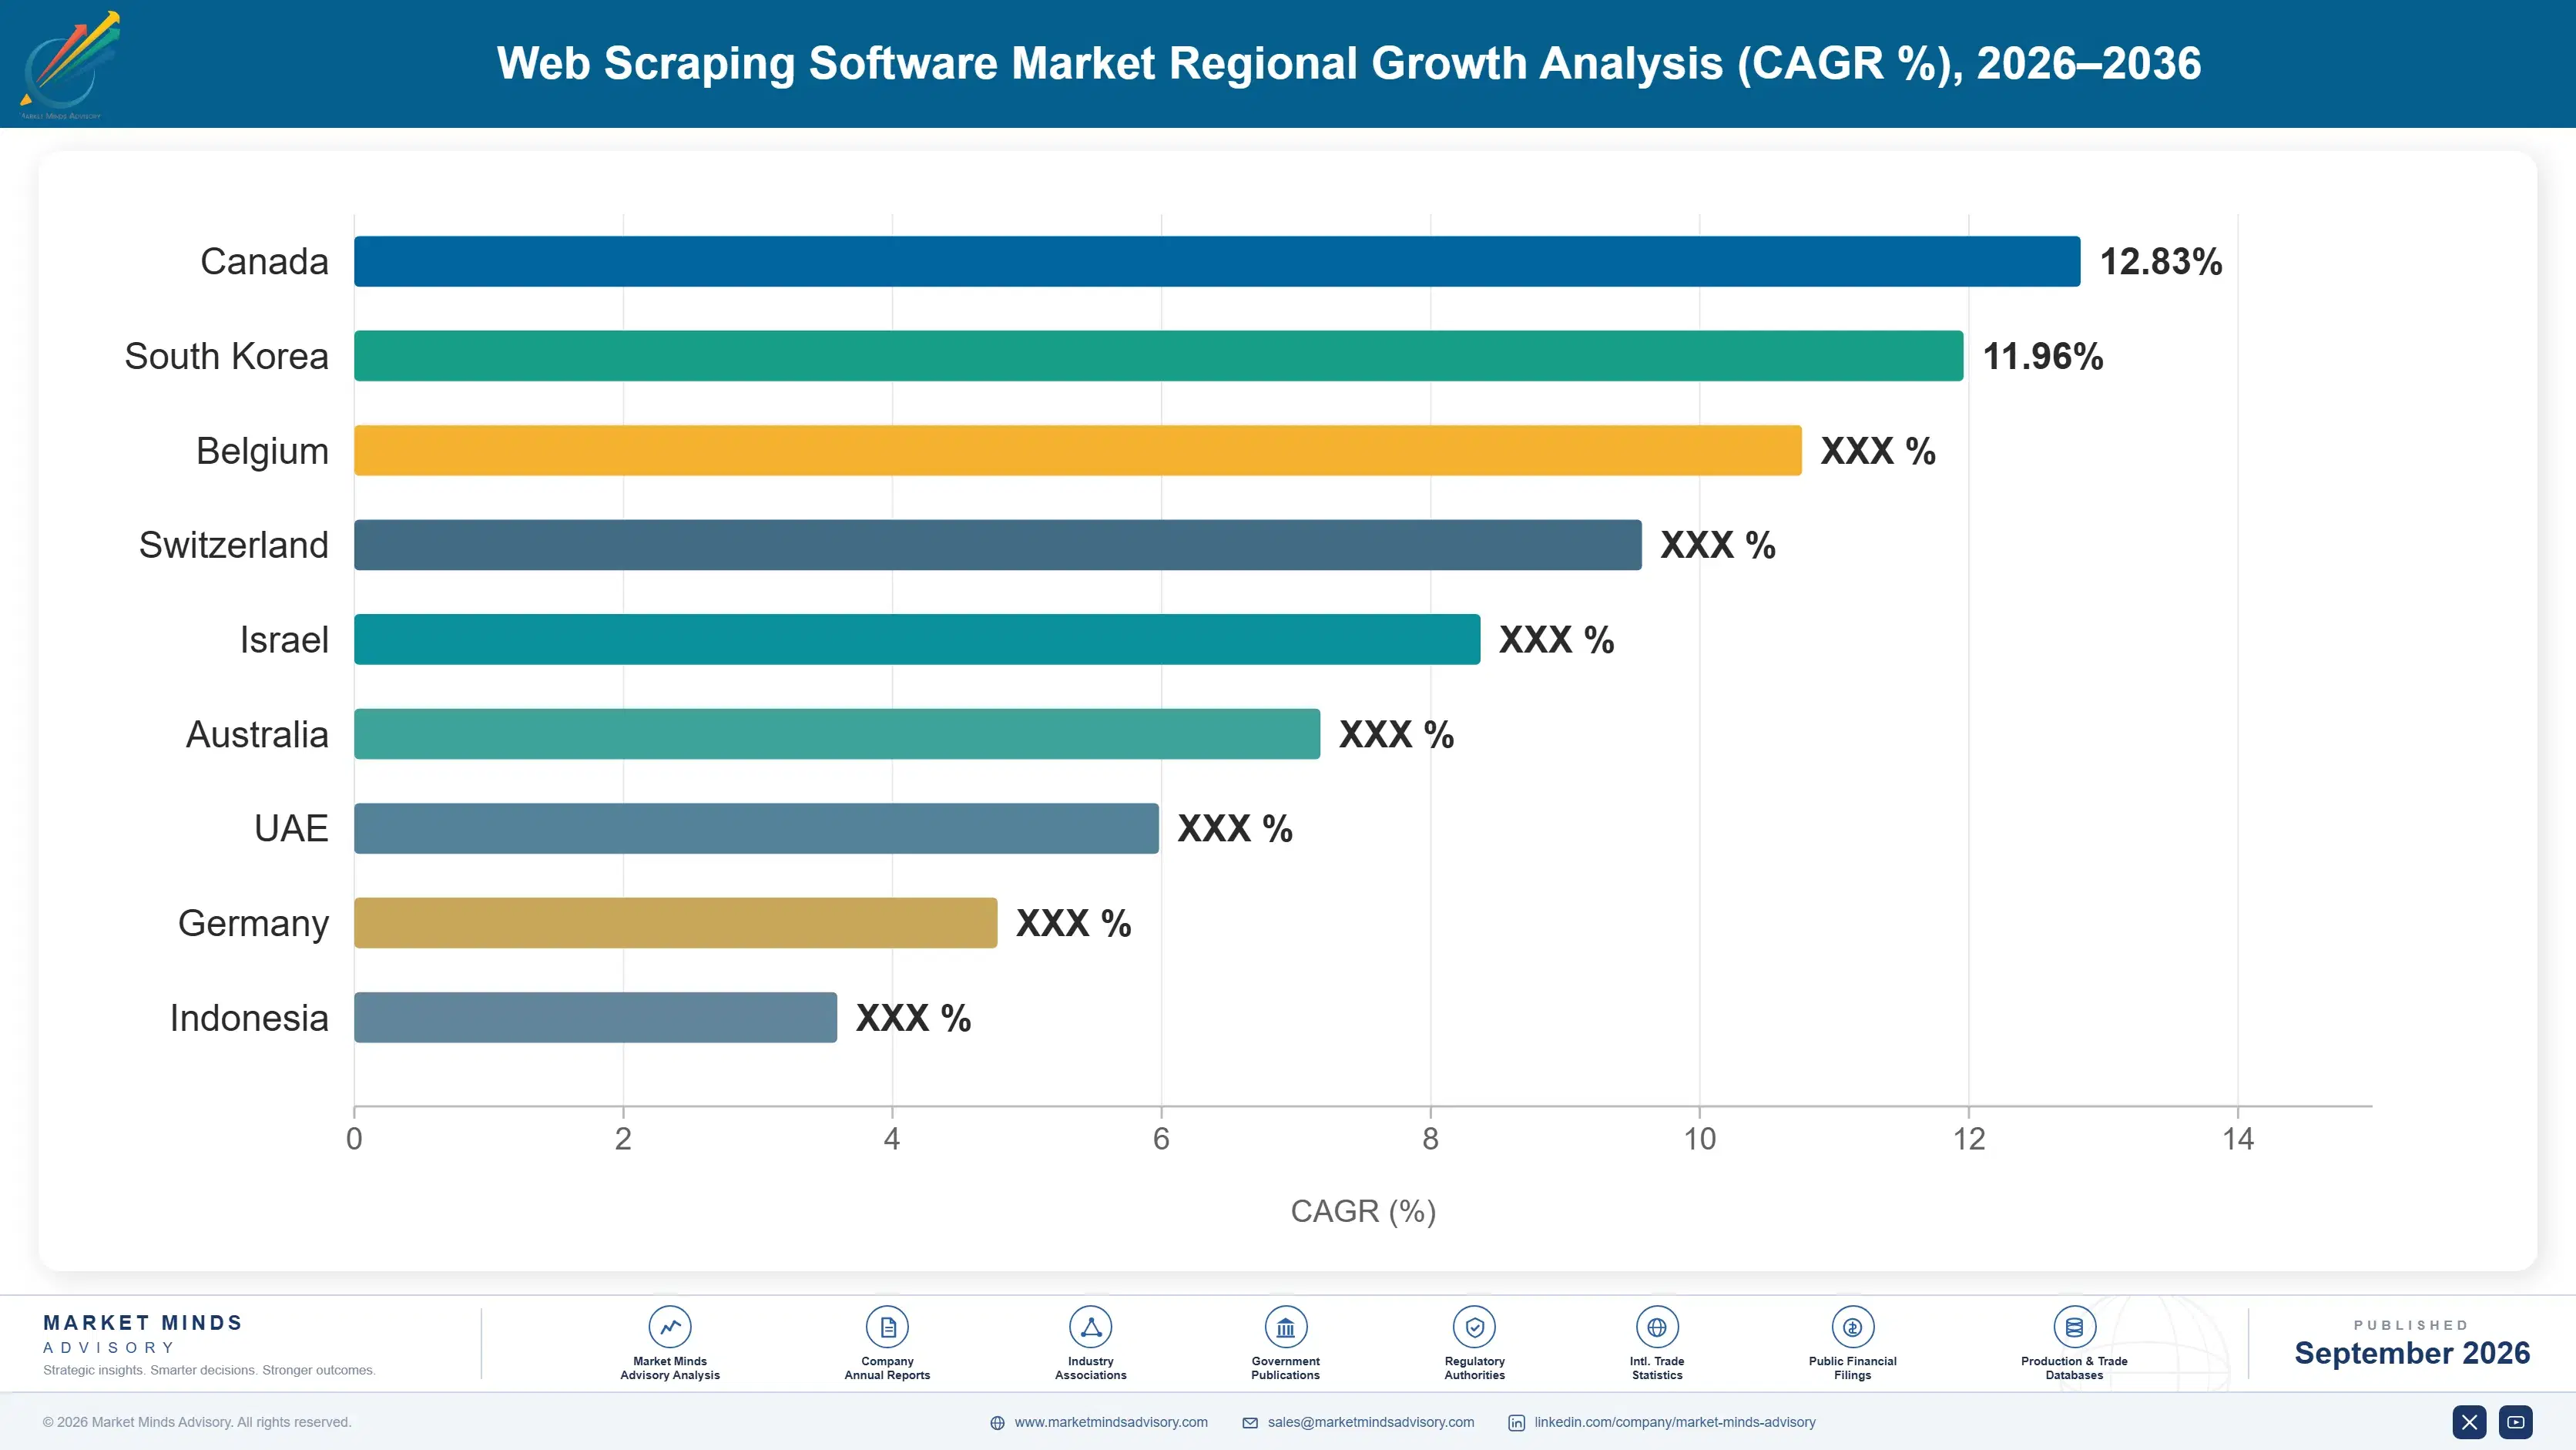
web-scraping-software-country-cagr-analysis-1789990017122

Where Vendors Can Still Grow Margin

Beyond raw extraction volume, four distinct commercial mechanisms determine which vendors actually expand margin rather than simply chasing top-line revenue growth each year: managed service upselling from self-serve tiers, compliance differentiation in procurement, data enrichment bundling on top of raw extraction, and vertical specialization into higher-value buyer categories with distinct technical and support requirements.

Upselling Self-Serve Customers Into Managed Contracts

Vendors that start customers on self-serve API tiers and later convert them to fully managed contracts capture meaningfully higher lifetime value, since managed accounts pay 2 to 3 times more per unit of data delivered once dedicated support, custom SLAs, and compliance documentation enter the relationship. Several leading platforms now track self-serve usage patterns specifically to identify accounts approaching a scale where managed conversion makes commercial sense, then proactively pitch the upgrade before the customer's own engineering team considers building equivalent capability internally, which meaningfully lowers churn risk once the conversion happens successfully.
Market Impact: Managed conversion lifts ARPU 2 to 3 times

Building Compliance Documentation as a Sales Asset

Vendors that proactively publish detailed documentation showing how their extraction methods respect robots.txt directives, rate limits, and published terms of service win a disproportionate share of enterprise deals in regulated industries where legal and procurement teams scrutinize vendor practices before signing. This has become a genuine sales differentiator worth premium pricing rather than a defensive cost center, with several vendors reporting win rates roughly 40% higher in competitive deals where compliance documentation was requested during procurement. Smaller vendors lacking dedicated legal resources increasingly lose these deals by default regardless of their underlying technical capability.
Market Impact: Compliance documentation lifts enterprise deal win rate 40%

Bundling Data Cleaning and Enrichment Services

Raw extracted data typically requires substantial cleaning, deduplication, and structuring before it becomes usable in downstream analytics or model training pipelines, and vendors that bundle these services alongside extraction capture revenue that would otherwise flow to separate data engineering contractors. Leading platforms now report that enrichment add-ons contribute up to 25% of total contract value on their largest enterprise accounts, turning what began as a pure infrastructure play into something closer to a full data supply chain service. This bundling also raises switching costs meaningfully, since customers become dependent on vendor-specific data schemas over time.
Market Impact: Enrichment adds up to 25% of contract value

Specializing in High-Value Vertical Buyer Categories

Vendors that build dedicated infrastructure and account teams for specific high-value verticals, particularly AI training data procurement and financial alternative data, extract meaningfully higher pricing than generalist competitors serving the broader long tail of smaller buyers across every industry. Specialized vendors serving AI labs report average contract values 3 to 4 times higher than their blended company average, reflecting both the scale of AI buyer extraction volume and their willingness to pay for guaranteed uptime during critical model training windows. This specialization strategy concentrates revenue risk but has proven the fastest route to premium margins so far.
Market Impact: Specialist AI contracts run 3 to 4x larger

Who Controls the Margin Pool

Competitive concentration remains modest with a CR5 near 38%, evaluated on annualized recurring revenue across managed and self-serve segments combined, leaving a wide gap between the two leading vendors and the dozens of smaller specialists competing for share. Bright Data and Oxylabs command the largest revenue bases, both built originally on proxy infrastructure before expanding into managed extraction, and the gap to the third-ranked challenger has widened as network scale advantages compound.
Current competitive activity centers on vertical specialization and compliance investment rather than pure price competition, as most vendors concluded that racing to the bottom on per-request pricing destroys margin faster than it wins share. Several platforms launched dedicated AI training data product lines in the past eighteen months, while others doubled down on financial services alternative data, each carving out a defensible niche rather than competing head-on everywhere.

Rankings are most likely to shift as AI-focused specialists that entered recently keep capturing outsized growth relative to established generalists, and consolidation appears likely as smaller vendors lacking compliance infrastructure or proxy scale struggle to remain independent. Private equity interest has picked up, and two mid-sized vendors are reportedly exploring sale processes as standalone survival grows harder to justify.
web-scraping-software-company-positioning-matrix-1789990017647

Competitive Moat and Risk Dimensions

BRIGHT DATA

Moat: Massive Global Proxy Network

Bright Data operates one of the largest residential and mobile proxy networks in the industry, built over more than a decade of ISP and app SDK partnerships that would take a new entrant years and substantial capital to replicate at comparable scale. This network effect compounds as traffic improves IP reputation scoring, making bypass rates difficult for rivals to match.
BRIGHT DATA

Risk: Regulatory Scrutiny Exposure

As the largest and most visible vendor in the category, Bright Data has faced more direct legal challenges from website operators than smaller competitors, and any unfavorable ruling in a case involving the company could set precedent affecting the industry's commercial model. This visibility cuts both ways, since buyers also view scale as evidence of compliance maturity.
OXYLABS

Moat: Deep Enterprise Compliance Investment

Oxylabs has invested heavily in dedicated legal and compliance teams that produce detailed documentation for enterprise procurement processes, a capability that has become a genuine differentiator as regulated-industry buyers increasingly require this documentation before signing. Few smaller competitors can match the depth of legal resourcing Oxylabs has built for enterprise sales cycles.
OXYLABS

Risk: High Customer Concentration Risk

A meaningful share of Oxylabs' enterprise revenue concentrates in a relatively small number of large accounts, particularly in AI training data and financial services, leaving the company more exposed than diversified peers if even one or two major customers were to build extraction capability internally or switch vendors at renewal.

Players Tracked

Prominent Players

Bright Data
Oxylabs
Zyte
ScraperAPI
Apify

Other Key Players

Smartproxy
NetNut
Rayobyte
Webshare
ScrapingBee
ScrapeOps
ParseHub
Octoparse
Diffbot
Import.io
Crawlbase
IPRoyal
Soax
Infatica
WebScrapingAPI

Recent Developments

MARCH 2026

Bright Data Acquires Browser Automation Startup

Bright Data acquired a smaller browser automation startup in March 2026 to strengthen its headless rendering capability for JavaScript-heavy websites, adding engineering talent and proprietary fingerprint rotation technology that had previously required licensing from third-party providers. The deal closed for an undisclosed sum and integrated within two quarters.
Signal: Vertical integration into browser automation signals accelerating consolidation of bypass technology capability across the leading vendor tier
JANUARY 2026

Oxylabs Signs Direct Carrier Proxy Agreement

Oxylabs signed a multi-year supply agreement with a major European telecommunications carrier in January 2026 to secure dedicated mobile proxy IP capacity, insulating the company from residential proxy cost inflation squeezing smaller competitors without equivalent carrier relationships. The agreement reportedly guarantees fixed unit pricing through 2029.
Signal: Direct carrier sourcing arrangements now hedge leading vendors against ongoing residential proxy cost inflation nationwide and beyond
MAY 2026

Apify Raises Growth Round for AI Infrastructure

Apify raised a growth equity round in May 2026 explicitly earmarked for expanding AI training data infrastructure and sales capacity targeting large language model developers, joining a wave of mid-sized vendors pivoting resources toward the fastest-growing buyer segment rather than continuing to serve the broader self-serve base equally.
Signal: Mid-sized vendors are actively reallocating capital and sales focus specifically toward the fast-growing AI buyer segment

Proxy Sourcing Costs Dominate Vendor Economics

Residential and mobile proxy IP acquisition represents the largest single cost input for most vendors, running roughly 34% of cost of goods sold, sourced primarily through consumer app SDK partnerships where mobile app developers embed proxy code for per-device payments. Datacenter proxy capacity, cheaper but easier for target sites to detect, adds a smaller secondary cost line most vendors still maintain for lower-value jobs.
A meaningful residential proxy cost spike hit the market in late 2025 after several large mobile app SDK partners tightened data-sharing terms following renewed scrutiny of consumer privacy practices, an event documented in multiple vendor investor updates and referenced in IEA-adjacent telecommunications infrastructure reporting on mobile data monetization trends. Several vendors passed a portion of the increase through to customers via revised pricing tiers within two quarters.

Vendors without direct carrier or SDK partnerships face a lasting cost disadvantage against Bright Data and Oxylabs, both of which negotiated volume-based proxy sourcing agreements unavailable to smaller competitors buying capacity on the open market at prevailing spot rates. This exposure varies meaningfully by geography too, since European vendors face tighter data-sharing regulation constraining how much proxy inventory they can source domestically compared with less-regulated markets.
web-scraping-software-cost-volatility-analysis-1789990017842

Diversifying Proxy Sourcing Across Multiple Channels

Leading vendors increasingly spread proxy acquisition across multiple SDK partners, direct carrier deals, and datacenter capacity rather than depending heavily on any single channel, reducing exposure to any one partner's policy change or sudden price increase and giving procurement teams real leverage to negotiate better terms across the full portfolio of suppliers over time and geography.

Building Proprietary Fingerprint Rotation to Reduce Proxy Volume Needs

Investing in browser fingerprint rotation and request pattern randomization reduces how many unique proxy IPs each extraction job actually requires, letting vendors extract the same data volume with meaningfully less proxy spend overall and softening the impact of any single supplier cost increase across the underlying base each fiscal quarter and every year thereafter.

Passing Cost Increases Through via Usage-Based Pricing Tiers

Vendors with usage-based or tiered pricing models can pass a portion of proxy cost inflation directly through to their customers without renegotiating fixed contracts, preserving margin more quickly than vendors locked into flat annual pricing agreements that require a full renewal cycle before any adjustment takes effect commercially or contractually across the whole business.

Portfolio Architecture for Margin Defence

The market splits cleanly between commodity-adjacent volume extraction, priced near marginal cost and serving price-sensitive self-serve buyers, and premium managed services carrying meaningfully higher gross margins because reliability, compliance, and dedicated support justify the additional spend involved for enterprise buyers. Vendors that mix both tiers poorly tend to see margin compression as volume customers demand pricing concessions that erode returns on the managed side too, over time and across renewal cycles.
Genuine tension exists between chasing high-volume, low-margin self-serve growth and concentrating resources on fewer, larger managed accounts that generate far more revenue per unit of engineering effort invested by the vendor. Most successful vendors have chosen to subsidize self-serve as a top-of-funnel acquisition channel rather than a standalone profit center, funneling the best accounts toward managed conversion over time and geography consistently.

The highest-value pools concentrate around AI training data and financial alternative data buyers willing to pay premium rates for guaranteed reliability during time-sensitive extraction windows, a customer set that barely existed several years ago and now anchors the fastest-growing and most profitable segment of the entire market for leading vendors positioned well to serve it across every region.

Volume / Commodity-Adjacent

Self-serve API access and datacenter proxy capacity priced per request, serving price-sensitive developers and small e-commerce operators competing mostly on unit economics rather than reliability guarantees across most of the smaller accounts in this tier.
Gross Margin: 15-25%

Premium / Certified

Fully managed extraction with dedicated account teams, custom SLAs, and published compliance documentation, serving enterprise buyers in regulated industries willing to pay for guaranteed reliability and legal defensibility across every contract renewal cycle.
Gross Margin: 40-55%

Sustainability / Regulatory / Next-Generation

AI training data infrastructure and financial alternative data pipelines built around guaranteed uptime during time-sensitive extraction windows, commanding the highest margins of any tier in the market today across nearly every leading vendor's book.
Gross Margin: 45-60%
web-scraping-software-portfolio-architecture-1789990018351

High-value Sub-segments and Strategic Watch-out

AI Training Data Extraction Pipelines

High-value and high-growth, this segment commands premium contract pricing from well-funded AI labs racing to secure proprietary training data advantages, and its growth rate outpaces every other segment in the market by a wide margin currently, with no sign of slowing over the next several years.
Gross Margin: 50-60%

Financial Alternative Data Extraction

High-value with moderate growth, hedge funds and asset managers pay premium rates for reliable, low-latency extraction feeding investment models, though adoption has matured enough that growth has settled into a steadier annual pace now compared with the sharper trajectory of the newer AI training data segment.
Gross Margin: 45-55%

E-Commerce Price and Inventory Monitoring

The volume core of the market, this segment generates the bulk of transaction count and recurring revenue across thousands of smaller retail and marketplace accounts, even though per-account margins run well below the premium tiers above and show little sign of expanding meaningfully in coming years.
Gross Margin: 20-30%

Academic and Independent Research Extraction

A strategic watch-out segment: budget-constrained researchers and journalists generate reputational goodwill and open-source contributions but little direct revenue, and vendors must balance access here against the cost of supporting non-commercial usage at meaningful scale without diverting resources away from paying enterprise customer segments that fund the rest of the business.
Gross Margin: 5-15%

Recurring Revenue Built on Renewal Discipline

Nearly all meaningful scraping revenue now runs on annual or multi-year subscription contracts rather than one-time project fees, since buyers need continuous extraction as target websites and defenses evolve constantly rather than a single point-in-time data pull that quickly goes stale after delivery, and renewal rates above 85% reflect just how embedded this infrastructure has become across most enterprise accounts and budgets industry-wide.
Adoption depth varies sharply by vertical: AI training data buyers integrate extraction so deeply into their model development pipelines that switching vendors mid-contract risks disrupting training schedules entirely, while e-commerce price monitoring customers treat vendors more interchangeably and switch more readily whenever a competitor undercuts pricing meaningfully, reflecting a genuine gap in switching cost between the two buyer categories today.

Buyer profiles have shifted generationally too, as procurement now runs through data engineering and machine learning teams rather than the marketing or business intelligence staff who once managed these relationships, bringing more technical evaluation criteria and longer sales cycles but also stickier, better-integrated deployments once contracts finally close, a shift vendors have had to adapt their entire sales process and messaging around.
web-scraping-software-end-use-penetration-index-1789990018850

Where This Market Is Headed

These are among the four positions where our research anticipates prominent divergence between winners and laggards over the coming forecast period. Each is grounded in the demand model, the regulatory perimeter, and the announced capacity pipeline.
01 / BUYER CONCENTRATION SHIFT

Enterprise sales teams should now be built primarily around AI buyers

AI training data procurement has become the single most important growth driver in this market today. Vendors still organizing sales teams around legacy price comparison and travel buyers are leaving the fastest-growing revenue pool to competitors who moved first and built dedicated infrastructure for it well ahead of the curve. Building dedicated AI vertical sales motion now, rather than treating it as one segment among many, positions a vendor to capture disproportionate share of the highest-value new contracts signed over the next two years.
02 / COMPLIANCE INVESTMENT PRIORITY

Legal and compliance documentation is now a genuine competitive weapon

Regulated-industry buyers increasingly require detailed compliance documentation before signing any meaningful long-term contract at all these days. Vendors without dedicated legal resources are simply losing these deals by default regardless of their underlying technical capability or competitive pricing structure. Building this documentation proactively, rather than reactively during a procurement process already underway, shortens sales cycles measurably and wins deals that would otherwise default to better-resourced competitors like Bright Data and Oxylabs, who have already made this investment at meaningful scale.
03 / PROXY SOURCING STRATEGY

Direct carrier relationships will separate winners from laggards by 2028

Residential proxy costs keep climbing steadily as consumer app SDK partnerships strain under rising demand from every direction across the industry today. Vendors without direct carrier relationships face a widening cost disadvantage against scale leaders who have already locked in fixed-rate agreements running through 2029 at attractive terms. Pursuing direct telecom partnerships now, even at meaningful upfront negotiation cost, protects margin over a multi-year horizon far better than continuing to buy proxy capacity on the open spot market at prevailing rates.
04 / VERTICAL SPECIALIZATION BET

Generalist vendors should pick one high-value vertical rather than spreading thin

Specialist vendors serving AI labs or financial services report meaningfully higher average contract values than generalists chasing every buyer category simultaneously across the board. This gap looks set to widen further as both verticals mature and buyers grow more demanding about vendor expertise and track record. Generalist strategy increasingly risks mediocrity across every segment rather than genuine strength anywhere, and the vendors moving fastest right now are the ones willing to concentrate resources and build defensible depth in one vertical.

Engagement Snapshot From the Field

A live engagement with an industry participant carrying material or product regulatory and market exposure ahead of a defining policy shift, showing how our research translates into a defensible multi-year portfolio strategy.
MARKET MINDS ADVISORY · CLIENT ENGAGEMENT SUMMARY
Web Scraping Software Producer Strategic Portfolio Review and Transition Roadmap 2026·Investment Scenario on Web Scraping Software Exposure Evaluation 2025-26
CLIENT PROFILE
The client was a mid-market e-commerce analytics provider serving retail brands with competitor price and inventory intelligence, generating roughly $18 million in annual revenue (client-reported, unverified by MMA) from a subscription base spread across North America and Western Europe. The company had grown steadily but assembled its extraction infrastructure through four separate vendor relationships without centralized oversight of spend or reliability.
STRATEGIC CHALLENGE
Fragmented vendor relationships left the client paying inconsistent per-request pricing across providers, with no leverage to negotiate volume discounts and frequent reliability gaps whenever any single vendor's extraction success rate dipped during a detection update cycle. Engineering time increasingly went toward vendor troubleshooting, and management suspected total spend, estimated near $2.4 million annually (client-reported, unverified by MMA), ran well above a consolidated approach.
MMA APPROACH
MMA conducted a structured vendor audit benchmarking all four incumbent providers against reliability, pricing, and compliance documentation criteria, then modeled total cost of ownership under two, three, and single-vendor consolidation scenarios. The analysis incorporated primary interviews with engineering leadership alongside MMA's proprietary vendor benchmarking dataset covering pricing and success rate metrics across the fifteen largest scraping vendors.
KEY FINDINGS
  1. Consolidating to two vendors instead of four would have cut total extraction spend by roughly 22% (client-reported, unverified by MMA) through volume pricing tiers alone.
  2. The two weakest incumbent vendors showed bypass success rates nearly 15 percentage points below the two strongest, directly explaining most of the client's recurring reliability complaints from downstream teams.
  3. Engineering time spent on vendor troubleshooting consumed nearly 30% of one full-time data engineer's annual capacity across the team, time that could otherwise go toward core product development work.
  4. None of the four incumbent vendors provided compliance documentation meeting the standard now expected by the client's own largest enterprise customers during procurement reviews.
CLIENT PROFILE
The client was a mid-market e-commerce analytics provider serving retail brands with competitor price and inventory intelligence, generating roughly $18 million in annual revenue (client-reported, unverified by MMA) from a subscription base spread across North America and Western Europe. The company had grown steadily but assembled its extraction infrastructure through four separate vendor relationships without centralized oversight of spend or reliability.
STRATEGIC CHALLENGE
Fragmented vendor relationships left the client paying inconsistent per-request pricing across providers, with no leverage to negotiate volume discounts and frequent reliability gaps whenever any single vendor's extraction success rate dipped during a detection update cycle. Engineering time increasingly went toward vendor troubleshooting, and management suspected total spend, estimated near $2.4 million annually (client-reported, unverified by MMA), ran well above a consolidated approach.
MMA APPROACH
MMA conducted a structured vendor audit benchmarking all four incumbent providers against reliability, pricing, and compliance documentation criteria, then modeled total cost of ownership under two, three, and single-vendor consolidation scenarios. The analysis incorporated primary interviews with engineering leadership alongside MMA's proprietary vendor benchmarking dataset covering pricing and success rate metrics across the fifteen largest scraping vendors.
KEY FINDINGS
  1. Consolidating to two vendors instead of four would have cut total extraction spend by roughly 22% (client-reported, unverified by MMA) through volume pricing tiers alone.
  2. The two weakest incumbent vendors showed bypass success rates nearly 15 percentage points below the two strongest, directly explaining most of the client's recurring reliability complaints from downstream teams.
  3. Engineering time spent on vendor troubleshooting consumed nearly 30% of one full-time data engineer's annual capacity across the team, time that could otherwise go toward core product development work.
  4. None of the four incumbent vendors provided compliance documentation meeting the standard now expected by the client's own largest enterprise customers during procurement reviews.
RECOMMENDED STRATEGY
Phase 1: Phase 1 (Months 1 to 2): Complete a full vendor audit and total cost of ownership modeling across every consolidation scenario considered. Phase 2: Phase 2 (Months 3 to 5): Migrate the highest-volume marketplace categories over to the two top-performing vendors identified during the audit. Phase 3: Phase 3 (Months 6 to 9): Complete full vendor consolidation and renegotiate volume pricing tiers with the two remaining vendors selected.
OUTCOME
The client consolidated from four vendors to two within nine months, reducing total annual extraction spend by approximately 19% (client-reported, unverified by MMA) and cutting engineering troubleshooting time by more than half. Reliability complaints from downstream product teams dropped sharply, and the client renegotiated a multi-year contract with improved compliance documentation supporting its own enterprise sales motion.

Frequently Asked Questions

Foundational context covering the market sizes, CAGR, scope, country, region and competition that inform every finding below. This section is provided to cover basics and most often pre-purchase conversations, answered from the MMA Primary Research Dataset.

What is the current size of the Web Scraping Software Market?

The Web Scraping Software Market was valued at $1.1 billion in 2025, the base year for this report. Growth accelerated meaningfully in recent years as AI companies entered the buyer base alongside traditional e-commerce and research customers.

How large will the Web Scraping Software Market be by 2036?

MMA projects the market will reach $5.1 billion by 2036, up from $1.26 billion in 2026. That represents a 4.05x expansion over the ten-year forecast period driven mainly by AI and financial data demand.

What is the CAGR for the Web Scraping Software Market 2026 to 2036?

The market is projected to grow at a 15.0% CAGR between 2026 and 2036, with a bull case of 16.3% and a bear case of 13.7% depending on regulatory and technology outcomes.

Which segment is growing fastest?

Managed and enterprise scraping-as-a-service platforms are growing fastest at a 17.0% CAGR, roughly 1.13 times the overall market rate, as AI companies outsource extraction rather than building capability internally.

Who are the major companies in the Web Scraping Software Market?

Leading vendors include Bright Data, Oxylabs, Zyte, ScraperAPI, and Apify, evaluated on annualized recurring revenue across managed and self-serve segments. Combined, the top five hold roughly 38% of the market.

Which country is growing fastest?

Lithuania is growing fastest at an 18.0% CAGR, reflecting its concentration of major global proxy infrastructure vendor headquarters and the country's outsized role exporting scraping technology rather than simply consuming it.

Report Segmentation Architecture

The full report scope spans multiple orthogonal segmentation dimensions, with cross-tabulated demand data provided for each dimension pair. Coverage extends further to regional breakdowns, trend trajectories, and the competitive detail needed to support segment-level decision-making.

By Delivery Model

  • Managed and Enterprise Scraping-as-a-Service
  • Self-Serve Developer APIs
  • Standalone Proxy Infrastructure
  • Browser Automation and Headless Rendering Tools
  • Professional Services and Data Enrichment
  • Open-Source Framework Support Services

By End-Use Industry

  • E-Commerce and Retail
  • Financial Services
  • Technology and AI Development
  • Travel and Hospitality
  • Academic and Research Institutions

By Commercial Dimension

  • Enterprise Contracts
  • Self-Serve Subscription
  • Usage-Based Pay-Per-Request
  • Professional Services Engagement

By Region

  • North America
  • Western Europe
  • East Asia
  • South Asia and Pacific
  • Latin America
  • Middle East and Africa
  • Eastern Europe

Scope, Methodology, and Coverage

Every figure in this report is reproducible from documented input assumptions. The scope below maps the historical period, the forecast horizon, the segmentation dimensions, and the countries covered, alongside the underlying primary and qualitative methodology.
Historical Period
2020 to 2025
Forecast Period
2026 to 2036
Base Year
2025 (USD billions; MMA Primary Research Dataset, September 2026)
Market Definition
The Web Scraping Software Market covers platforms, APIs, and proxy infrastructure used to programmatically extract structured data from public websites, including anti-bot bypass and browser automation tooling. It excludes general-purpose data integration software, manual data entry services, and licensed data marketplaces that do not perform extraction themselves.
Quantitative Units
USD billions (current prices); contract count; CAGR percentage; regional share percentage
Segmentation Dimensions
By Delivery Model; By End-Use Industry; By Commercial Dimension; By Region
Regions Covered
North America, Western Europe, East Asia, South Asia and Pacific, Latin America, Middle East and Africa, Eastern Europe
Countries Covered
USA, China, Germany, France, UK, Japan, South Korea, India, Australia, Canada, Brazil, Mexico, Indonesia, Vietnam, Thailand, Malaysia, UAE, Saudi Arabia, South Africa, Nigeria, Turkey, Poland, Lithuania, Netherlands, Italy, Spain, Sweden, Switzerland, Argentina, Singapore, and additional markets relevant to this sector
Key Companies Profiled
Bright Data, Oxylabs, Zyte, ScraperAPI, Apify, Smartproxy, NetNut, Rayobyte, Webshare, ScrapingBee, ScrapeOps, ParseHub, Octoparse, Diffbot, Import.io, Crawlbase, IPRoyal, Soax, Infatica, WebScrapingAPI
Quantitative Methodology
Primary survey, n=3,800 respondents, Q4 2025, six countries; demand-side model with trade association cross-validation
Qualitative Methodology
47 expert interviews, Q4 2025; applied to validate demand model assumptions, identify emerging dynamics, and assess competitive positioning
Report Format
PDF and XLSX data workbook (Word format preview document)
Publisher
Market Minds Advisory
Report Code
MMA-2026-TEC-201
Published
September 2026
Contact
sales@marketmindsadvisory.com | www.marketmindsadvisory.com

Purchase the full Web Scraping Software Market Report (2026 to 2036).

This report provides a comprehensive assessment of the global Web Scraping Software Market through 2036, covering delivery model segmentation, regional demand patterns, and competitive positioning across managed, self-serve, and proxy infrastructure providers. It quantifies market sizing, growth scenarios, and pricing dynamics shaped by the rapid entry of AI training data buyers into a category once dominated by smaller retail and research customers. Analysis extends to input cost exposure, portfolio margin architecture, and demand stickiness by buyer vertical. The report closes with forward-looking strategic recommendations for vendors and investors evaluating this category over the coming decade.
Ten-year market sizing and forecast model
Delivery model and buyer segmentation analysis
Full seven-region demand and growth breakdown
Competitive benchmarking of top twenty vendors
Proxy input cost and mitigation strategy review
Strategic verdict and revenue lever recommendations

Built For The People Who Decide

From boardroom strategy to bench-side execution, this report is read cover-to-cover by leaders shaping the next decade of their industry, turning demand scenarios, market dynamics and valuation benchmarks into decisions.
CXOs/ Presidents/ VPs/ Managers
M&A and Corporate Development
Strategy Teams and R&D Heads
Procurement and Product Directors
Regulatory and Compliance Leaders
Investor Relations and Equity Analysts