Market Minds Advisory
Web Development Outsourcing Services Market

Web Development Outsourcing Services Market: Web Development Outsourcing Services Market. Global Demand, Vendor Strategy, and Delivery Model Economics Through 2036

Enterprises shift web platform delivery to specialist outsourcing vendors as in-house engineering costs climb, generative coding tools reshape offshore contract economics, and boards demand faster digital storefront and portal modernization cycles worldwide.

Lead Analyst

Published

September 2026

Make Smarter Decisions with Customized Research Insights

Request a free sample report and evaluate market opportunities, growth trends, and competitive dynamics relevant to your business needs.

2025 MARKET VALUE$58.4BMarket Size 2025
2036 FORECAST VALUE$180.5BBase Case , 2026 to 2036
CAGR 2026 TO 203610.8 %Bull 12.1% / Bear 9.6%
INCREMENTAL OPPORTUNITY$115.8BNet 10- year value creation
EXPANSION MULTIPLE2.79x2036 value over 2026 base
Strategic Levers
M&A Pipeline
Regional Outlook
Country Rankings
Competitive Intelligence
Segmental Deep-dive
Call-Us : 91 93563 13602

Executive Snapshot and Market Trajectory.

Client procurement teams now negotiate outsourcing contracts around measurable, fully auditable productivity gains from AI coding assistants, not raw headcount alone, compressing per-project pricing while pushing vendors to prove delivery speed gains contractually rather than through anecdotal claims made repeatedly during renewal negotiations each annual budget cycle.
Custom application and e-commerce platform work drives the largest share of contract value as retailers rebuild storefronts ahead of peak shopping seasons, while South Asian delivery centers, led decisively by India, capture rising demand from cost pressured enterprises across North America and Western Europe seeking senior engineering talent at blended billing rates well below comparable domestic hiring costs across nearly every regulated and unregulated industry vertical alike.
Vendor rosters range from large systems integrators down to specialized boutique studios, and the field stays fragmented enough that no single player commands durable pricing power across every service tier; regulatory attention on data residency rules and outsourced code security audits increasingly shapes which delivery centers win the largest, longest-duration enterprise mandates, particularly within banking and healthcare client segments facing considerably tighter compliance scrutiny than they did some five years earlier.
Market Definition
This report covers custom software development, e-commerce platform engineering, UI and UX design, and related web application delivery services provided by third-party outsourcing vendors to enterprise clients globally. It excludes internal in-house development teams and generic IT infrastructure hosting services.
Base Year Value
$58.4B in 2025 (MMA Primary Research Dataset, September 2026)
Forecast Period
2026 to 2036, eleven discrete annual values
CAGR
10.8% base case. Bull 12.1%. Bear 9.6%.
Fastest Growth Segment
E-Commerce Platform Development and Integration Services: 14.5% CAGR
Fastest Growth Country
India: 13.0% CAGR
Fastest Growth Region
South Asia and Pacific: 13.0% CAGR
Largest Region
South Asia and Pacific: 26% of 2025 global value
Market Leaders
Accenture, Infosys, TCS, Wipro, and EPAM Systems lead vendor rankings. Source: MMA Analysis, July 2026.
Primary Survey
n=3,800 procurement and R&D decision-makers, Q4 2025, six countries
Methodology
Demand-side build-up, cross-validated against public data, 47 expert interviews

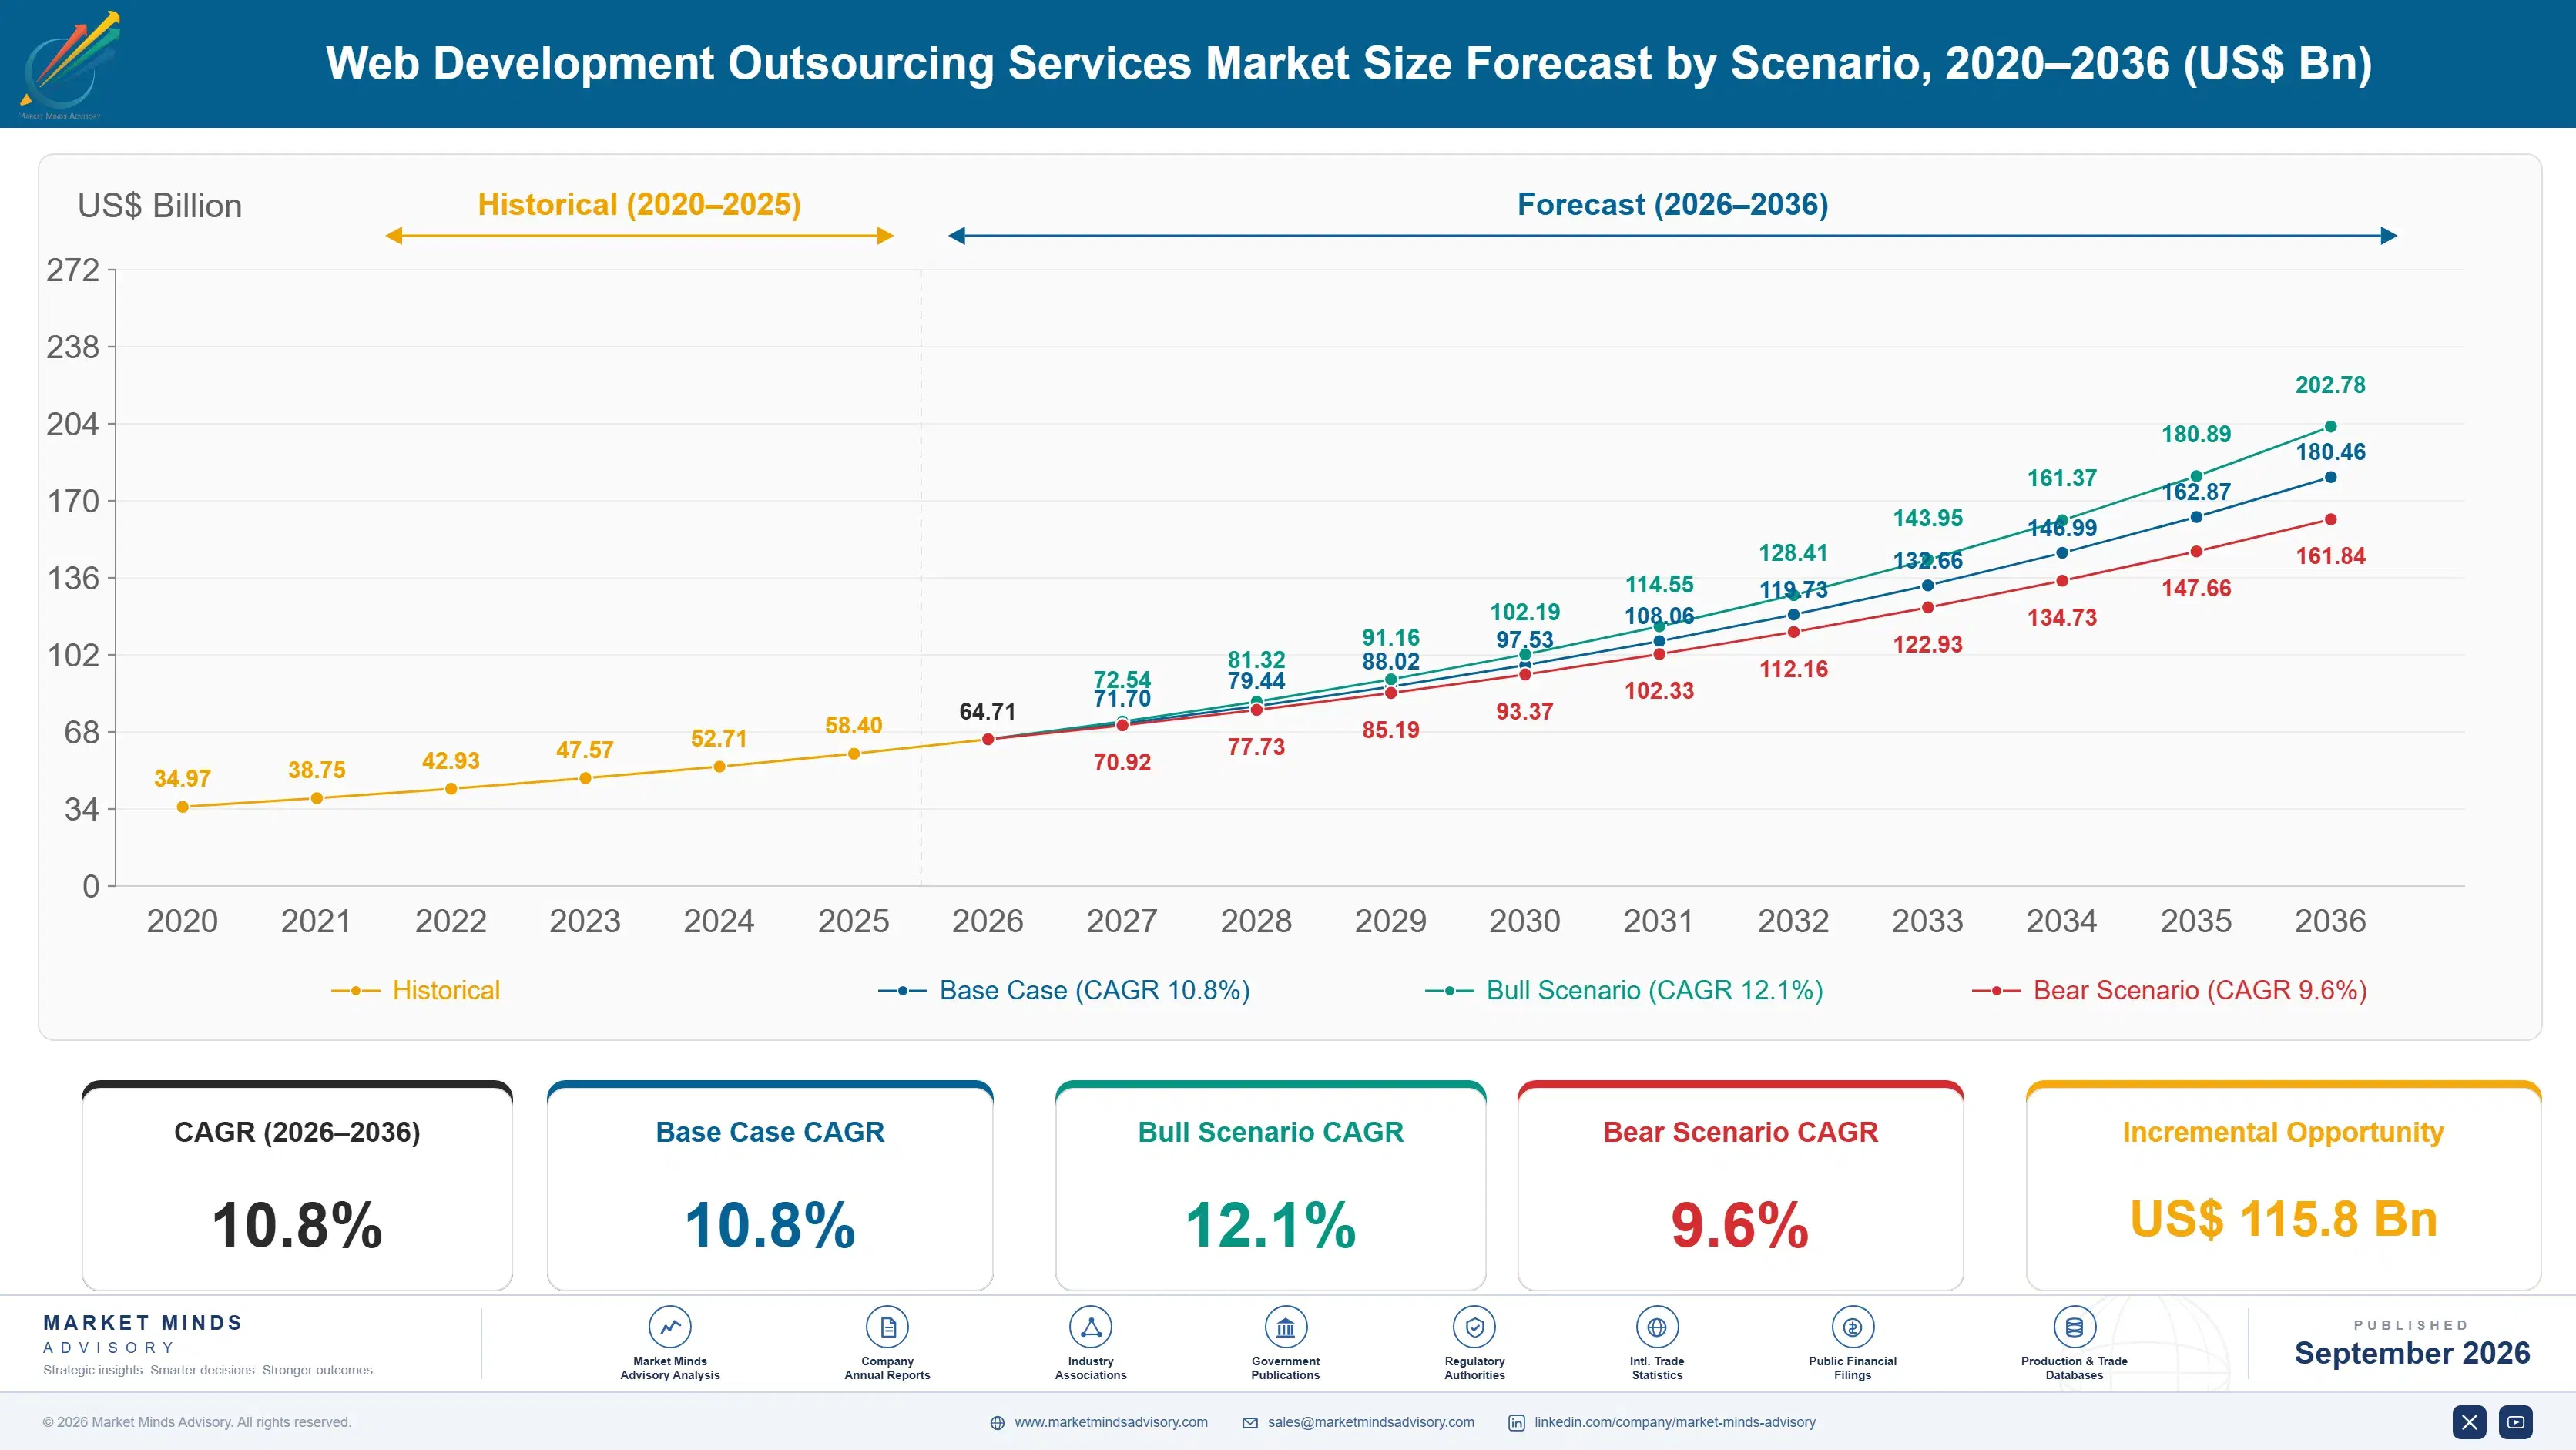
Web Development Outsourcing Services Market Forecast Scenarios

web-development-outsourcing-services-market-size-forecast-scenario-1788452191439
Between 2020 and 2025, outsourced web development scaled steadily as pandemic era digital storefront rebuilding gave way to sustained enterprise demand for platform modernization, with growth broadening from e-commerce alone into core banking, healthcare portals, and logistics applications across mid-market clients seeking lower-cost senior engineering capacity than domestic hiring could reliably supply at comparable seniority levels.
The base case assumes enterprises hold outsourcing budgets roughly steady while reallocating spend toward AI-augmented delivery teams, cloud native architecture rebuilds, and platform consolidation projects that replace legacy content management systems entirely; vendors capturing certified AI tooling capability, senior architect availability, and fixed-price delivery guarantees command the largest multi-year contract renewals across regulated banking, healthcare, and retail client industries through the coming decade as procurement teams consolidate vendor panels further.
A bull scenario assumes accelerated generative coding adoption cuts delivery timelines enough that vendors underbid domestic teams on velocity, not cost alone, expanding contract volume sharply across every major client region worldwide. A bear scenario assumes in-house AI copilots reduce enterprise reliance on outsourced coding capacity for routine application maintenance work specifically, not custom platform builds or integration projects.

Vendor Economics Behind the Outsourcing Boom

Enterprise clients increasingly treat outsourced web development as a strategic capacity lever rather than a simple cost center, structuring contracts around outcome-based milestones instead of pure time and materials billing, a shift accelerating as generative coding tools compress delivery timelines across custom application and e-commerce platform engagements alike, forcing vendors to rebuild pricing models around demonstrated output rather than staffed hours.
MARKET CONCENTRATIONCR5 24%share of global contract value the top five vendors hold
AVERAGE HOURLY BILLING RATE$38/hr blendedblended senior and junior engineer billing rate charged globally
INDIA DELIVERY CENTER SHARE41%share of global outsourced engineering headcount based there
CLIENT CONTRACT RENEWAL RATE78%share of enterprise clients renewing multi-year vendor agreements
AVERAGE PROJECT CYCLE LENGTH7.5 monthstypical duration of a custom platform build engagement
OFFSHORE DELIVERY COST SHARE62% of COGSengineering labor cost share of total vendor operating expenses
Vendors compete less on headline hourly rates now and more on proven senior architect availability, security certification depth, and demonstrated AI-augmented delivery velocity, since procurement teams increasingly benchmark bids against internal engineering costs rather than solely against competing offshore quotes from rival delivery centers, a change that rewards vendors able to document measurable productivity improvements across successive project phases and contract renewal cycles.
India retains the largest share of global delivery headcount, but Eastern European and Latin American centers are winning selective mandates on time zone proximity and specialized regulatory compliance knowledge, fragmenting what was once a more India-concentrated competitive landscape across nearly every major client industry vertical, particularly among European banking and healthcare clients wary of extended handoff delays and language barrier friction.
"Clients no longer buy hours, they buy verified delivery velocity, and vendors that cannot prove it contractually are losing renewal negotiations to rivals who can. The vendors gaining share are the ones treating AI tooling as a pricing argument, not a marketing slogan."
Senior Analyst, Technology Services Practice · MMA Technology Practice · September 2026

Market Trends

Generative AI Coding Assistants Compress Delivery Cycles

Vendors now embed generative coding assistants across custom application builds, cutting routine feature development time significantly and reshaping how contracts price labor from the outset of every engagement. Clients increasingly expect delivery timelines that reflect AI-augmented output rather than headcount alone, and vendors unable to demonstrate measurable velocity gains through documented sprint metrics are losing renewal negotiations to competitors who can prove faster, cheaper delivery cycles backed by verifiable client-facing dashboards each quarter, a capability now considered central to competitive bid evaluation across nearly every major enterprise procurement process worldwide.
Market Impact: Expands contract scope by 18 percent
Outcome-Based Contracting Replaces Pure Time and Materials

Large enterprise clients increasingly negotiate contracts around delivered features and uptime guarantees rather than staffed hours, pushing vendors to absorb considerably more delivery risk in exchange for higher effective margins on successful projects completed strictly on schedule and within agreed budget parameters. This shift rewards vendors with mature estimation practices and proven track records, while newer entrants lacking a verifiable delivery history struggle to win outcome-based mandates from risk-averse enterprise procurement teams evaluating multiple competing bids across each annual contract renewal and multi-year strategic budget planning cycle across the industry.
Market Impact: Sustains a 3.5x cost advantage

Market Opportunities and Growth Drivers

Enterprise Cloud Migration Budgets Fund Platform Rebuilds

Enterprises allocating cloud migration budgets increasingly bundle legacy platform rebuilds into the same initiative, since moving a decade-old content management system to modern cloud infrastructure rarely succeeds without rearchitecting the underlying application code first. This bundling expands the addressable scope of a typical outsourcing engagement well beyond simple infrastructure migration, pulling in custom development, integration testing, and security hardening work that previously sat in separate, smaller vendor contracts negotiated independently across different budget cycles, departments, and internal stakeholder groups managing distinct legacy systems across the same enterprise organization and technology roadmap.
Market Impact: Cuts retainer value by 15 percent

India's Engineering Talent Pipeline Sustains Cost Advantage

India graduates roughly one and a half million engineering students annually, sustaining a deep, continuously replenished talent pool that keeps blended billing rates well below comparable North American and Western European hiring costs even as senior architect wages rise domestically each passing year across nearly every metropolitan hiring market. This durable talent supply, not merely currency advantage alone, explains why India retains the largest share of delivery headcount despite mounting competition from Eastern European and Latin American centers pursuing the same enterprise contracts aggressively across every major client industry and geography worldwide.
Market Impact: Adds 22 percent to compliance costs

Market Restraints and Challenges

In-House AI Copilots Erode Routine Maintenance Demand

Enterprise engineering teams increasingly deploy AI copilots internally to handle routine bug fixes, minor feature additions, and content updates that once justified ongoing outsourced maintenance retainers each budget cycle. The root cause is that generative tools have matured enough to make simple, well-documented maintenance tasks tractable for smaller in-house teams without specialized outsourced support, particularly at companies with modern, well-organized codebases and disciplined internal engineering practices. Vendors are responding by repositioning maintenance contracts around complex, high-risk changes and platform architecture work that AI tools cannot yet reliably automate unsupervised at scale.
Market Impact: Cuts delivery cycles by 30 percent

Data Residency Rules Complicate Cross-Border Delivery Models

Financial services and healthcare clients increasingly require that client data and source code remain within specific national or regional jurisdictions, complicating delivery models built around distributed, multi-country engineering teams collaborating across time zones and shifting work handoffs each sprint cycle. The root cause is tightening data protection regulation across the European Union and parts of Asia, which raises compliance costs for vendors lacking regionally isolated delivery infrastructure. Larger vendors are mitigating this by building dedicated in-region delivery centers, while smaller boutique studios increasingly partner with regional infrastructure providers to remain compliant instead.
Market Impact: Raises vendor margins by 6 points
3 additional market trends, 4 additional growth drivers, and 2 additional restraints and challenges are covered in the full report. Contact sales@marketmindsadvisory.com to access the complete intelligence.

Segment CAGR and Growth Architecture

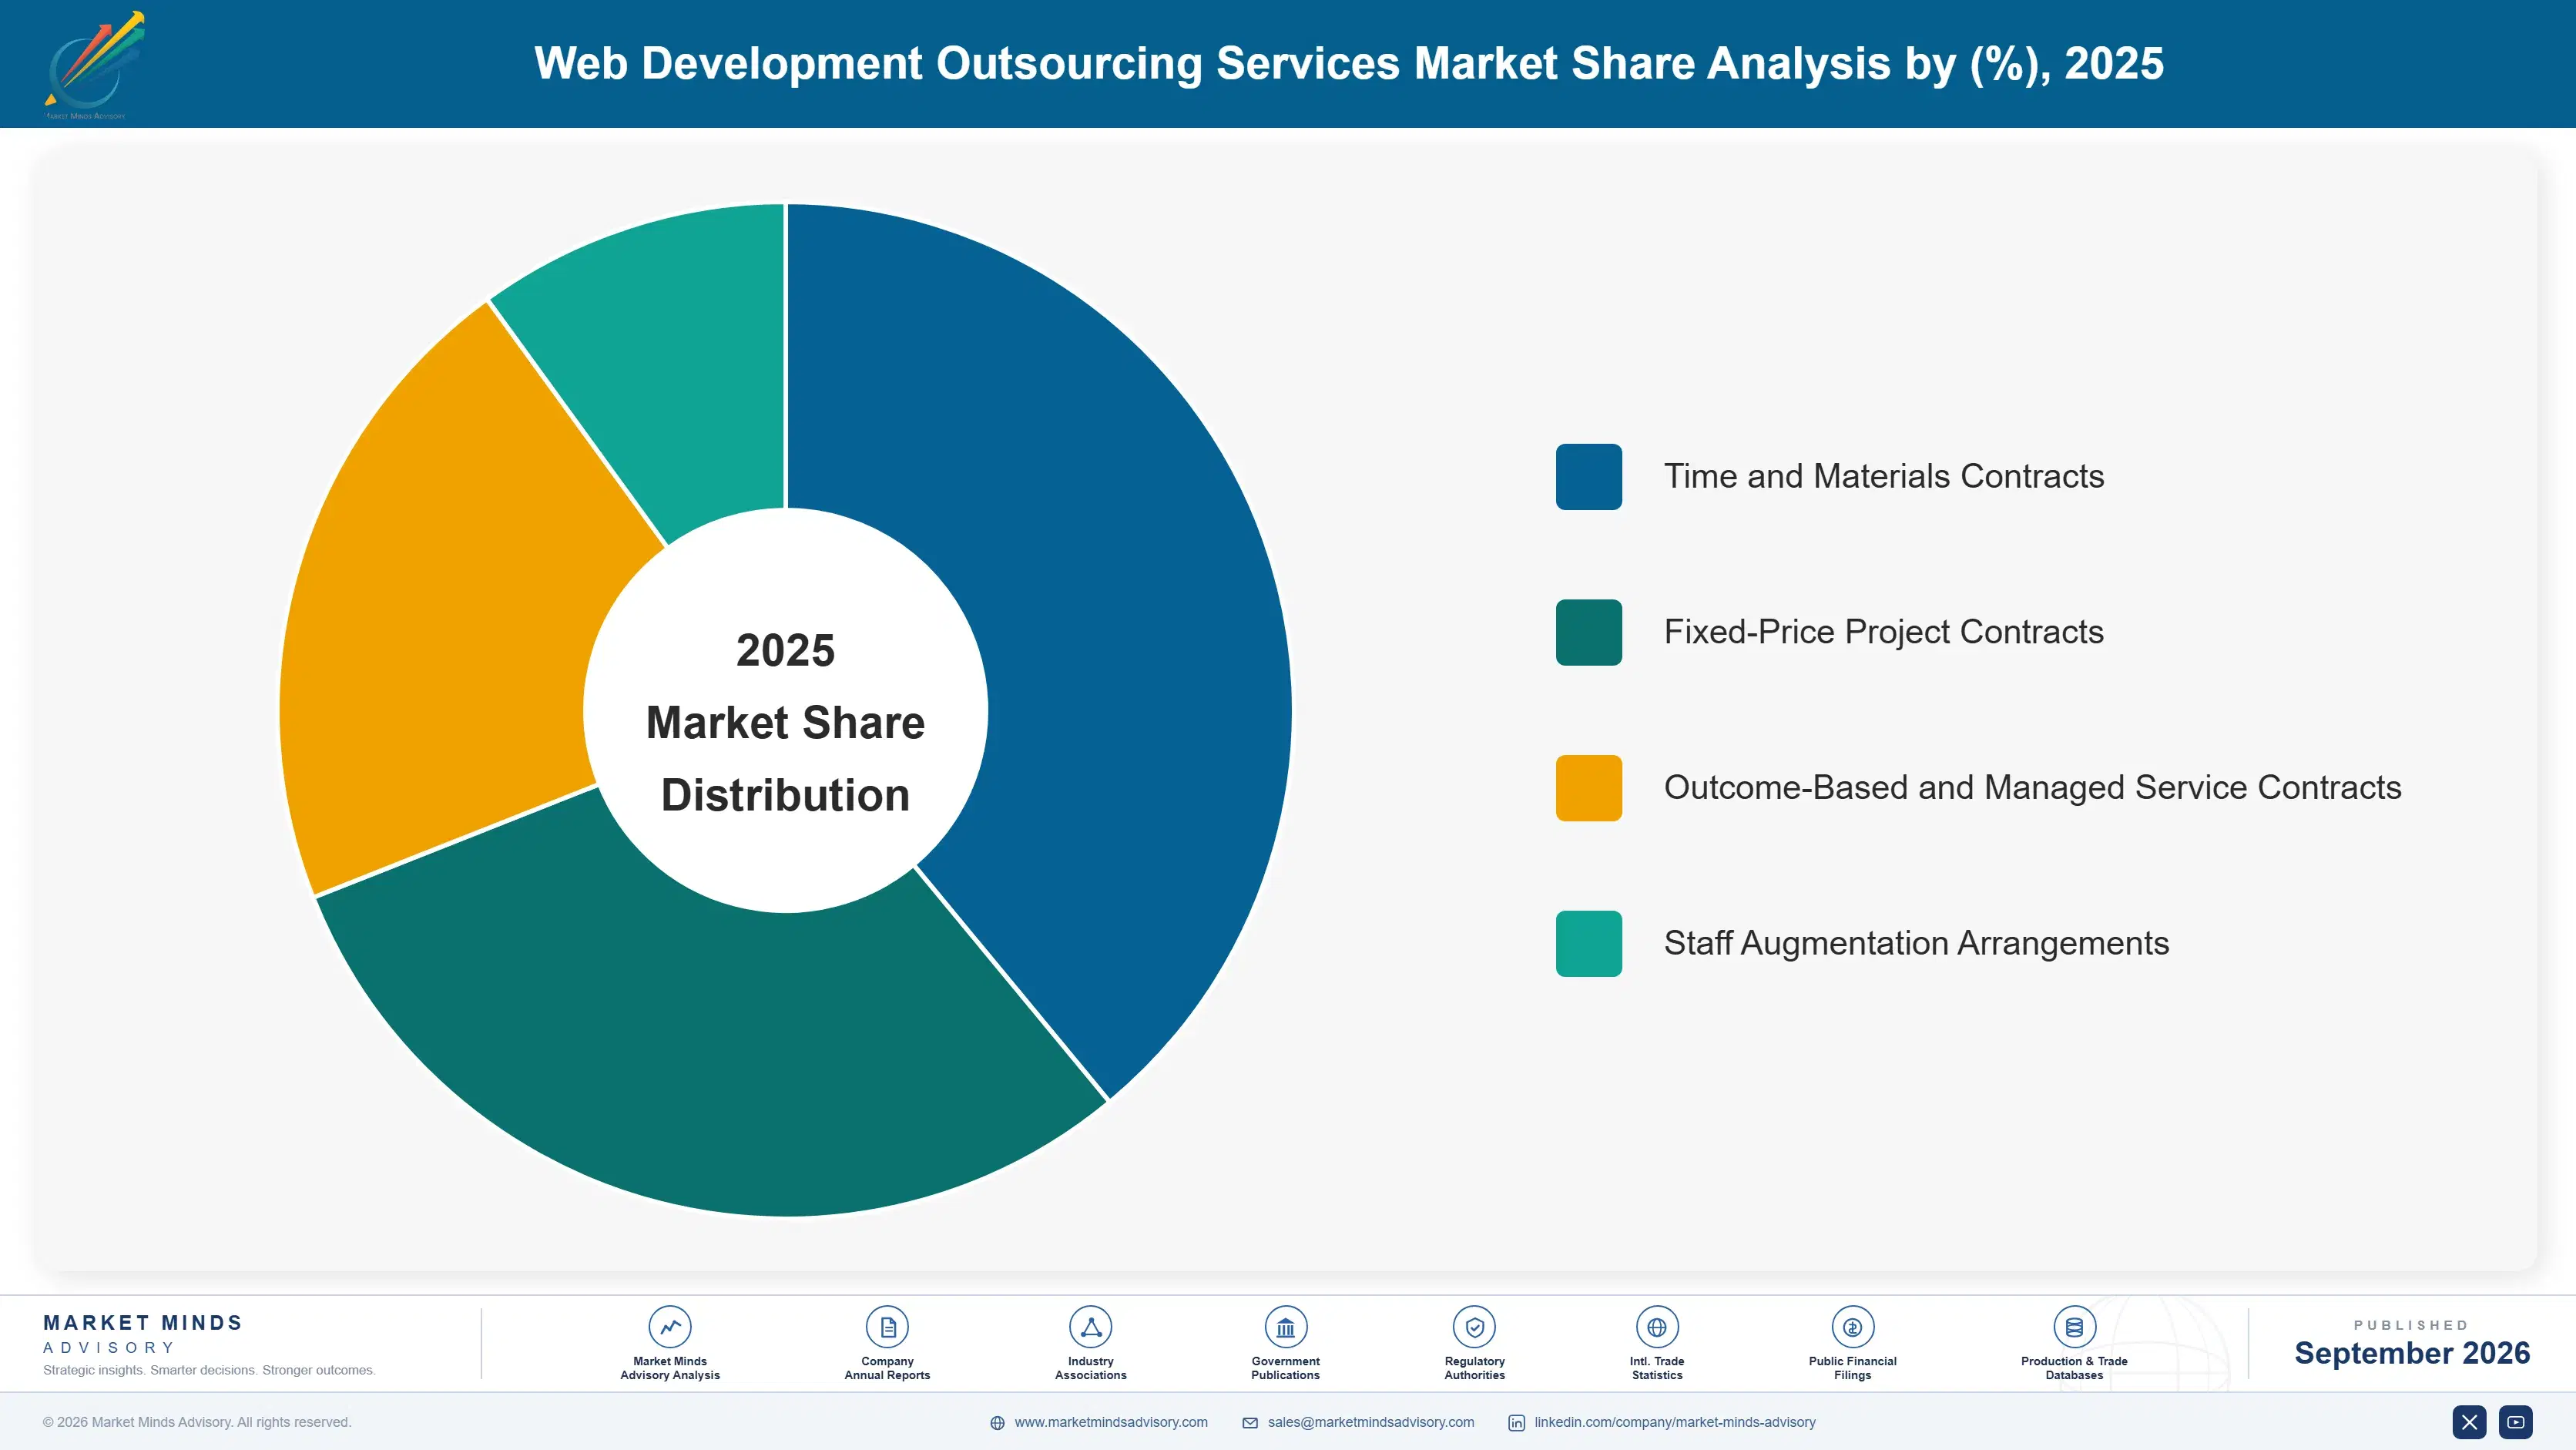
Six primary service lines structure vendor contracts, spanning custom application builds, e-commerce platform work, front-end design, ongoing maintenance, content management implementation, and quality assurance testing, each carrying distinct margin profiles, delivery timelines, and client renewal patterns that shape how vendors staff, price, and prioritize competing project bids across every client industry vertical and geographic delivery region.
web-development-outsourcing-services-market-market-share-analysis-1788452191971

E-Commerce Platform Development and Integration Services

E-commerce platform development and integration work commands the fastest growth as retailers rebuild storefronts around headless commerce architecture, personalization engines, and checkout optimization ahead of recurring peak shopping seasons each year. Vendors specializing in major commerce platforms capture premium pricing versus generalist competitors, since clients value proven integration experience over broad but shallow technical capability across many platforms simultaneously and geographies. Contract values here run notably higher than custom application work due to tighter seasonal deadlines, elevated uptime requirements during peak traffic events, and the specialized payment gateway integration expertise clients increasingly demand from vendors bidding on these high-stakes seasonal contracts across every major retail category and international market segment worldwide.
CAGR 14.5%

UI and UX Design and Front-End Engineering Services

UI and UX design and front-end engineering services grow rapidly as enterprises prioritize conversion rate improvements and accessibility compliance across customer-facing web properties competing for shrinking attention spans each quarter and platform update cycle. Clients increasingly bundle design and front-end build work into single contracts rather than splitting design agencies from development vendors, rewarding outsourcing partners that can deliver both disciplines under one accountable team working from a shared specification document. This convergence is compressing project timelines and raising average contract values, since clients avoid the coordination overhead and handoff friction that separate design and engineering vendors historically created across sequential project phases, stakeholder reviews, and formal approval cycles industry wide.
CAGR 12.8%
Full segment breakdown across 7 segments available in the complete report.

Regional Architecture and Country Demand Map

Regional demand concentrates where enterprise digital transformation budgets and technical talent pools overlap most closely, with South Asia's engineering base and North America's enterprise procurement volume anchoring the largest shares of contract value, while other regions compete on specialized compliance and time zone advantages instead.

North America

Enterprise procurement volume in the United States drives the region's contract value, as retailers, banks, and healthcare systems outsource custom platform work to control engineering headcount costs amid persistently high domestic software salaries. Canadian firms contribute a smaller but growing share, particularly in fintech and logistics platform rebuilds. Regulatory scrutiny over vendor data handling has intensified following several high-profile breaches at third-party contractors, pushing large enterprises toward vendors that can demonstrate SOC 2 and similar compliance certifications contractually. Contract sizes here run larger on average than in most other regions, reflecting the scale of platform modernization initiatives underway at major North American retailers, banks, and insurers pursuing multi-year digital transformation roadmaps.
Share: 22% | CAGR: 11.5% (2026 to 2036)

Western Europe

Germany, the United Kingdom, and France anchor Western European demand, where enterprises increasingly outsource platform work to manage engineering costs under strict data protection and labor regulations that raise the cost of expanding in-house teams substantially year over year. Financial services and automotive manufacturers lead adoption, rebuilding customer portals and dealer platforms to meet evolving digital service expectations across every major national market. Nearshoring to Eastern European delivery centers remains common given shared time zones and cultural proximity, though some enterprises are shifting selective work toward South Asian vendors offering lower blended rates. Data residency requirements under European Union regulation shape which delivery models large financial and healthcare clients are willing to approve for outsourced platform work.
Share: 19% | CAGR: 9.3% (2026 to 2036)
Regional intelligence for 5 additional markets available in the complete report: East Asia, South Asia and Pacific, Latin America, Middle East and Africa, Eastern Europe. Contact sales@marketmindsadvisory.com.
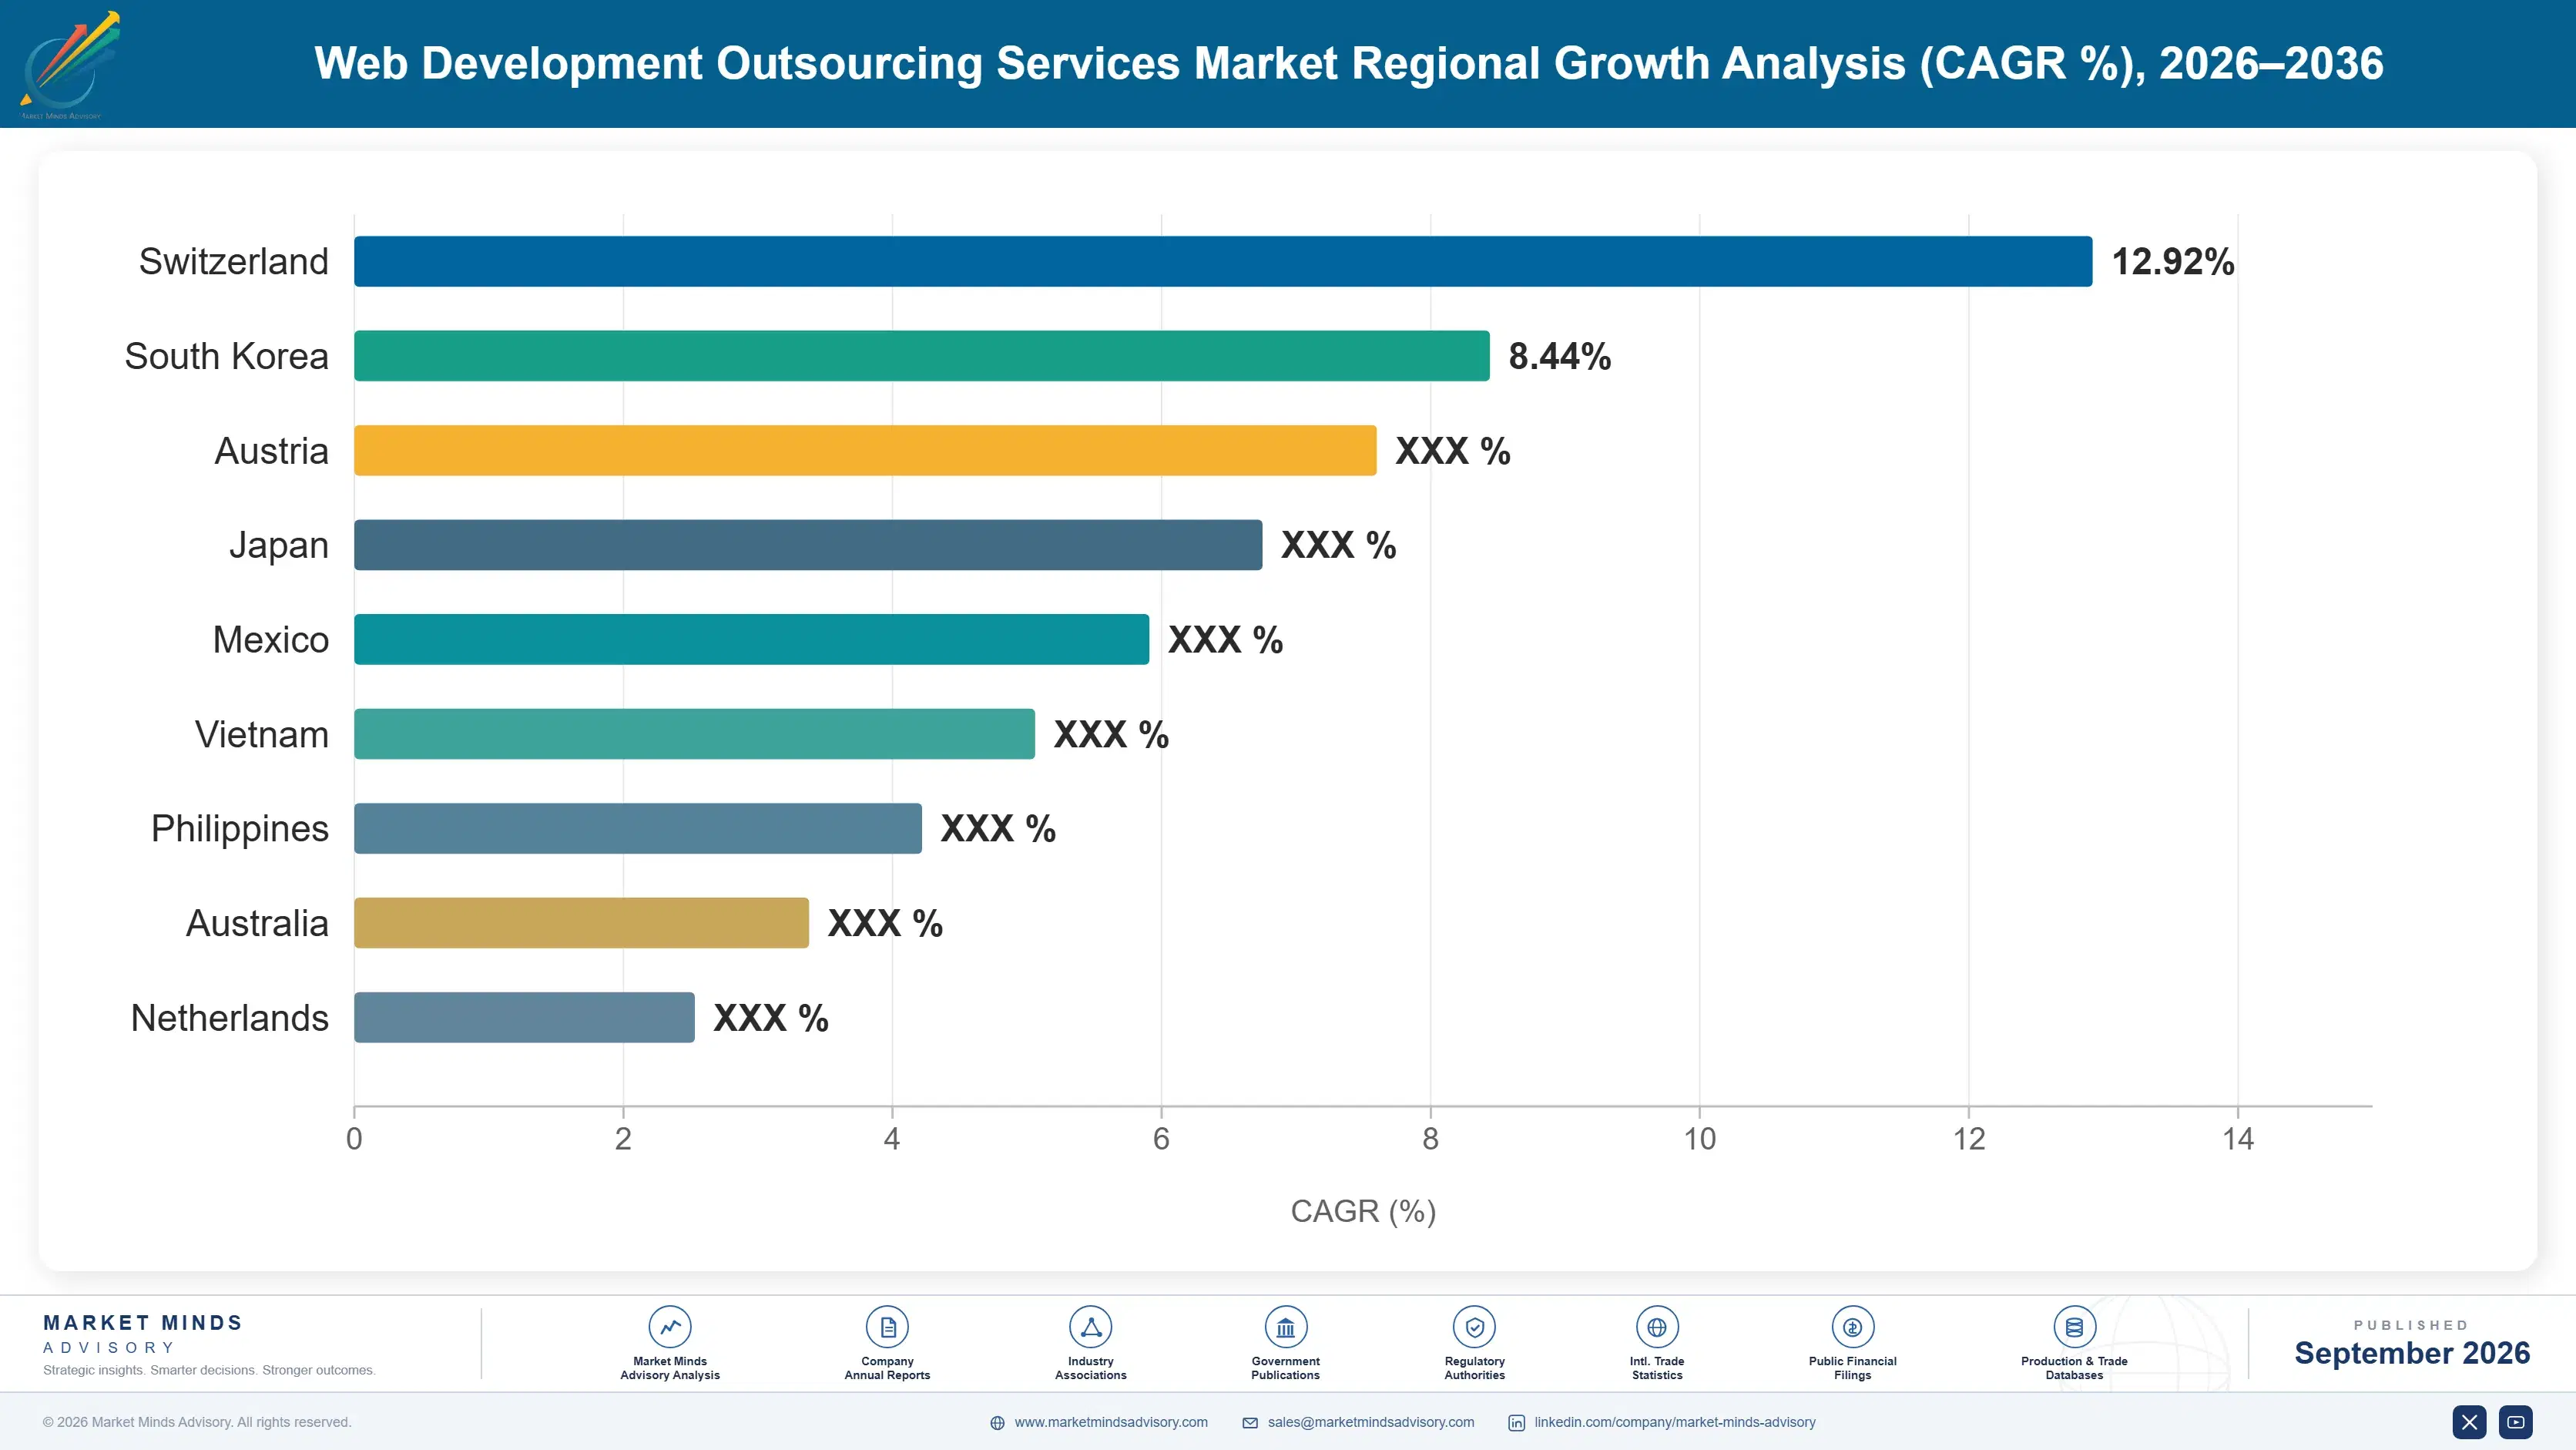
web-development-outsourcing-services-market-country-cagr-analysis-1788452192482

Where Vendors Are Capturing Margin Growth

Vendors face compressing hourly rates but expanding margin opportunity through outcome-based pricing, AI tooling premiums, regional delivery expansion, and specialized compliance capability, each rewarding vendors that invest ahead of client demand rather than merely reacting to competitive pricing pressure alone across every major contract renewal cycle, client industry vertical, and geographic delivery market worldwide.

AI-Augmented Delivery Velocity Pricing Premiums for Vendors

Vendors documenting verified AI-augmented delivery speed gains are winning premium pricing versus competitors still billing purely on staffed hours. Clients pay a measurable premium, often 12 to 15 percent above standard blended rates, for vendors that can contractually guarantee faster cycle times backed by transparent sprint velocity dashboards updated weekly. This premium is proving durable rather than transitory, since clients increasingly treat proven AI tooling maturity as a prerequisite for shortlisting vendors on large, competitive enterprise bids, not merely a differentiator among otherwise similar competing proposals from rival delivery organizations.
Market Impact: Adds a 12 to 15 percent pricing premium

Outcome-Based Contract Structuring for Enterprise Clients

Vendors restructuring contracts around delivered features and uptime guarantees rather than time and materials billing are capturing higher effective margins, often 5 to 8 percentage points above comparable staffed-hour engagements, on successfully completed projects delivered on schedule and within budget. This shift requires mature estimation discipline and a demonstrated delivery track record, which smaller or newer vendors frequently lack entirely. Established vendors with proven histories are using this capability gap to win larger, longer-duration mandates away from smaller, less experienced competitors bidding primarily on price alone across each renewal cycle.
Market Impact: Raises effective margins by 5 to 8 percentage points

Regulated Industry Compliance Certification Specialization Strategy

Vendors that invest in healthcare and financial services compliance certifications, including relevant security and data handling standards, are winning larger, stickier contracts within regulated industries paying materially higher effective rates than unregulated sectors typically allow across comparable project scopes. This specialization requires meaningful upfront investment in certification and audit readiness, typically exceeding 2 million dollars for larger vendors, but the resulting contracts carry renewal rates well above the market average across every client segment. Smaller vendors without this capability increasingly find themselves excluded entirely from the largest regulated industry mandates available anywhere.
Market Impact: Lifts contract renewal rates by roughly 20 percent

Dedicated Regional Delivery Center Capacity Expansion

Vendors building dedicated delivery centers in fast-growing regions, particularly Latin America and parts of Eastern Europe, are capturing nearshore contracts that value time zone proximity over pure cost advantage alone across nearly every client conversation and vendor selection process. This expansion requires significant capital investment, often 40 million dollars or more per major center, but positions vendors to win contracts specifically excluding traditional offshore delivery models entirely from consideration. Clients increasingly favor vendors offering flexible delivery geography options over single-location providers locked into one delivery region only, permanently and without exception.
Market Impact: Expands nearshore contract capture by nearly 18 percent

Who Controls the Margin Pool

The competitive field is fragmented, with a CR5 of just 24 percent reflecting the low barriers to entry that let boutique studios compete alongside global systems integrators for the same enterprise mandates. Accenture leads on scale and enterprise trust, but the gap to second-tier challengers like Infosys and TCS is narrow, since all three compete for similar large transformation programs using comparable global delivery models.
Current competitive activity centers on AI tooling investment, with every major vendor racing to demonstrate measurable delivery velocity gains through proprietary coding assistant platforms and internal productivity benchmarking programs shared with prospective clients. Vendors are also expanding nearshore delivery capacity in Latin America and Eastern Europe to capture contracts that specifically exclude offshore-only delivery models, a requirement increasingly written into enterprise procurement policy.

Emerging pressure comes from boutique AI-native studios that undercut established vendors on price for smaller projects while matching delivery speed through heavy automation, forcing incumbents to defend mid-market accounts more aggressively. Rankings are most likely to shift among mid-tier challengers rather than at the very top, as smaller vendors consolidate through acquisition to compete for the large enterprise mandates currently dominated by the five leading players.
web-development-outsourcing-services-market-company-positioning-matrix-1788452193048

Competitive Moat and Risk Dimensions

ACCENTURE PLC

Moat: Enterprise trust and scale

Accenture's decades-long relationships with Fortune 500 procurement teams and its ability to staff hundreds of engineers simultaneously across time zones give it access to the largest transformation mandates that smaller vendors cannot credibly bid for. This scale advantage compounds as satisfied clients renew and expand engagements into adjacent platform work, deepening account penetration over successive contract cycles and reference-driven referrals.
ACCENTURE PLC

Risk: Premium pricing under pressure

Accenture's higher blended rates make it vulnerable to boutique and offshore competitors offering comparable AI-augmented delivery speed at meaningfully lower cost, particularly for mid-market clients less attached to brand reputation. Sustained price pressure from Indian and nearshore vendors could erode share in commoditized project categories where technical differentiation matters less than raw cost efficiency to budget-conscious procurement teams.
INFOSYS LIMITED

Moat: Delivery scale and cost base

Infosys operates one of the largest engineering delivery bases in India, giving it cost advantages and staffing flexibility that let it absorb large, complex mandates other vendors would need years to scale toward. Its established relationships across banking, retail, and healthcare clients globally provide a diversified revenue base that reduces dependency on any single industry vertical or geographic market.
INFOSYS LIMITED

Risk: Talent wage inflation pressure

Rising senior engineer wages within India are compressing the cost advantage that has historically differentiated Infosys from Western vendors, forcing the company to either raise prices or accept thinner margins on renewal contracts. Continued wage inflation, combined with competition from smaller, more specialized Indian vendors, could erode the blended-rate advantage that has long anchored client acquisition strategy.

Players Tracked

Prominent Players

Accenture plc
Infosys Limited
Tata Consultancy Services
Wipro Limited
EPAM Systems Inc

Other Key Players

Cognizant Technology Solutions
HCL Technologies
Tech Mahindra Limited
Capgemini SE
Globant SA
Endava plc
DXC Technology Company
Sopra Steria Group
Luxoft Holding Inc
Softtek
Mindtree Limited
Persistent Systems Limited
Grid Dynamics Holdings Inc
Thoughtworks Holding Inc
L&T Infotech Limited

Recent Developments

JUNE 2026

Accenture acquired a specialized AI-native web engineering studio to strengthen its generative coding delivery capability across enterprise application modernization mandates, expanding headcount by several hundred engineers and adding proprietary tooling that competing systems integrators currently lack in comparable form, according to the company's public deal announcement.
Signal: Signals continued consolidation toward AI-native technical capability among leading global systems integrators competing for large mandates.
MARCH 2026

Infosys announced a multi-year strategic partnership with a major European retailer to rebuild its e-commerce platform across twelve countries, one of the largest single contracts awarded in the sector this year, reflecting continued enterprise willingness to consolidate delivery under fewer strategic vendor relationships rather than fragmented sourcing arrangements.
Signal: Signals large enterprise clients increasingly favoring fewer, deeper vendor relationships over fragmented multi-vendor sourcing strategies industry wide.
JANUARY 2026

TCS opened a new delivery center in Colombia specifically targeting nearshore contracts for North American clients seeking time zone alignment, part of a broader push by Indian vendors to diversify delivery geography beyond traditional offshore-only models amid shifting client procurement preferences toward blended delivery arrangements.
Signal: Signals Indian vendors actively diversifying delivery geography beyond traditional offshore-only models toward flexible, blended nearshore arrangements.

Engineering Labor Cost Exposure and Volatility

Engineering labor represents roughly 62 percent of vendor cost of goods sold, sourced predominantly from India, Eastern Europe, and Latin America, where salaries have historically run well below comparable North American and Western European levels. Cloud infrastructure hosting and third-party software licensing costs make up most of the remaining cost base, a smaller but rising share as vendors adopt more AI tooling subscriptions.
India's National Association of Software and Service Companies reported senior engineer wage growth accelerating meaningfully through 2025, compressing the cost advantage vendors have relied on for two decades. Vendors absorbed most of this increase rather than passing it fully to clients, given intense competitive pricing pressure across the mid-market segment, which visibly compressed operating margins at several major listed Indian outsourcing vendors during the most recent reporting period.

Vendors with concentrated delivery in India face proportionally greater wage exposure than those with diversified delivery across Eastern Europe and Latin America, creating a genuine competitive disadvantage for India-concentrated vendors during periods of rapid wage growth. Larger vendors are diversifying delivery geography specifically to hedge this exposure, while smaller, India-concentrated boutique studios have fewer options and absorb wage pressure directly into thinner operating margins.
web-development-outsourcing-services-market-cost-volatility-analysis-1788452193243

Diversifying Delivery Across Multiple Cost Geographies

Vendors are opening or expanding delivery centers in Eastern Europe, Latin America, and Southeast Asia specifically to reduce dependence on any single wage market, particularly India, spreading wage inflation risk across regions with different economic cycles and hedging against concentrated cost exposure in any one geography over time, while also improving time zone coverage for global clients.

Automating Routine Work to Offset Rising Wages

Vendors are deploying AI coding assistants to offset rising per-engineer costs by increasing output per employee rather than solely relying on headcount growth, allowing them to maintain competitive pricing even as blended wage costs climb steadily across their largest delivery center markets each year, protecting margins without passing the full cost increase directly onto enterprise clients.

Portfolio Architecture for Margin Defence

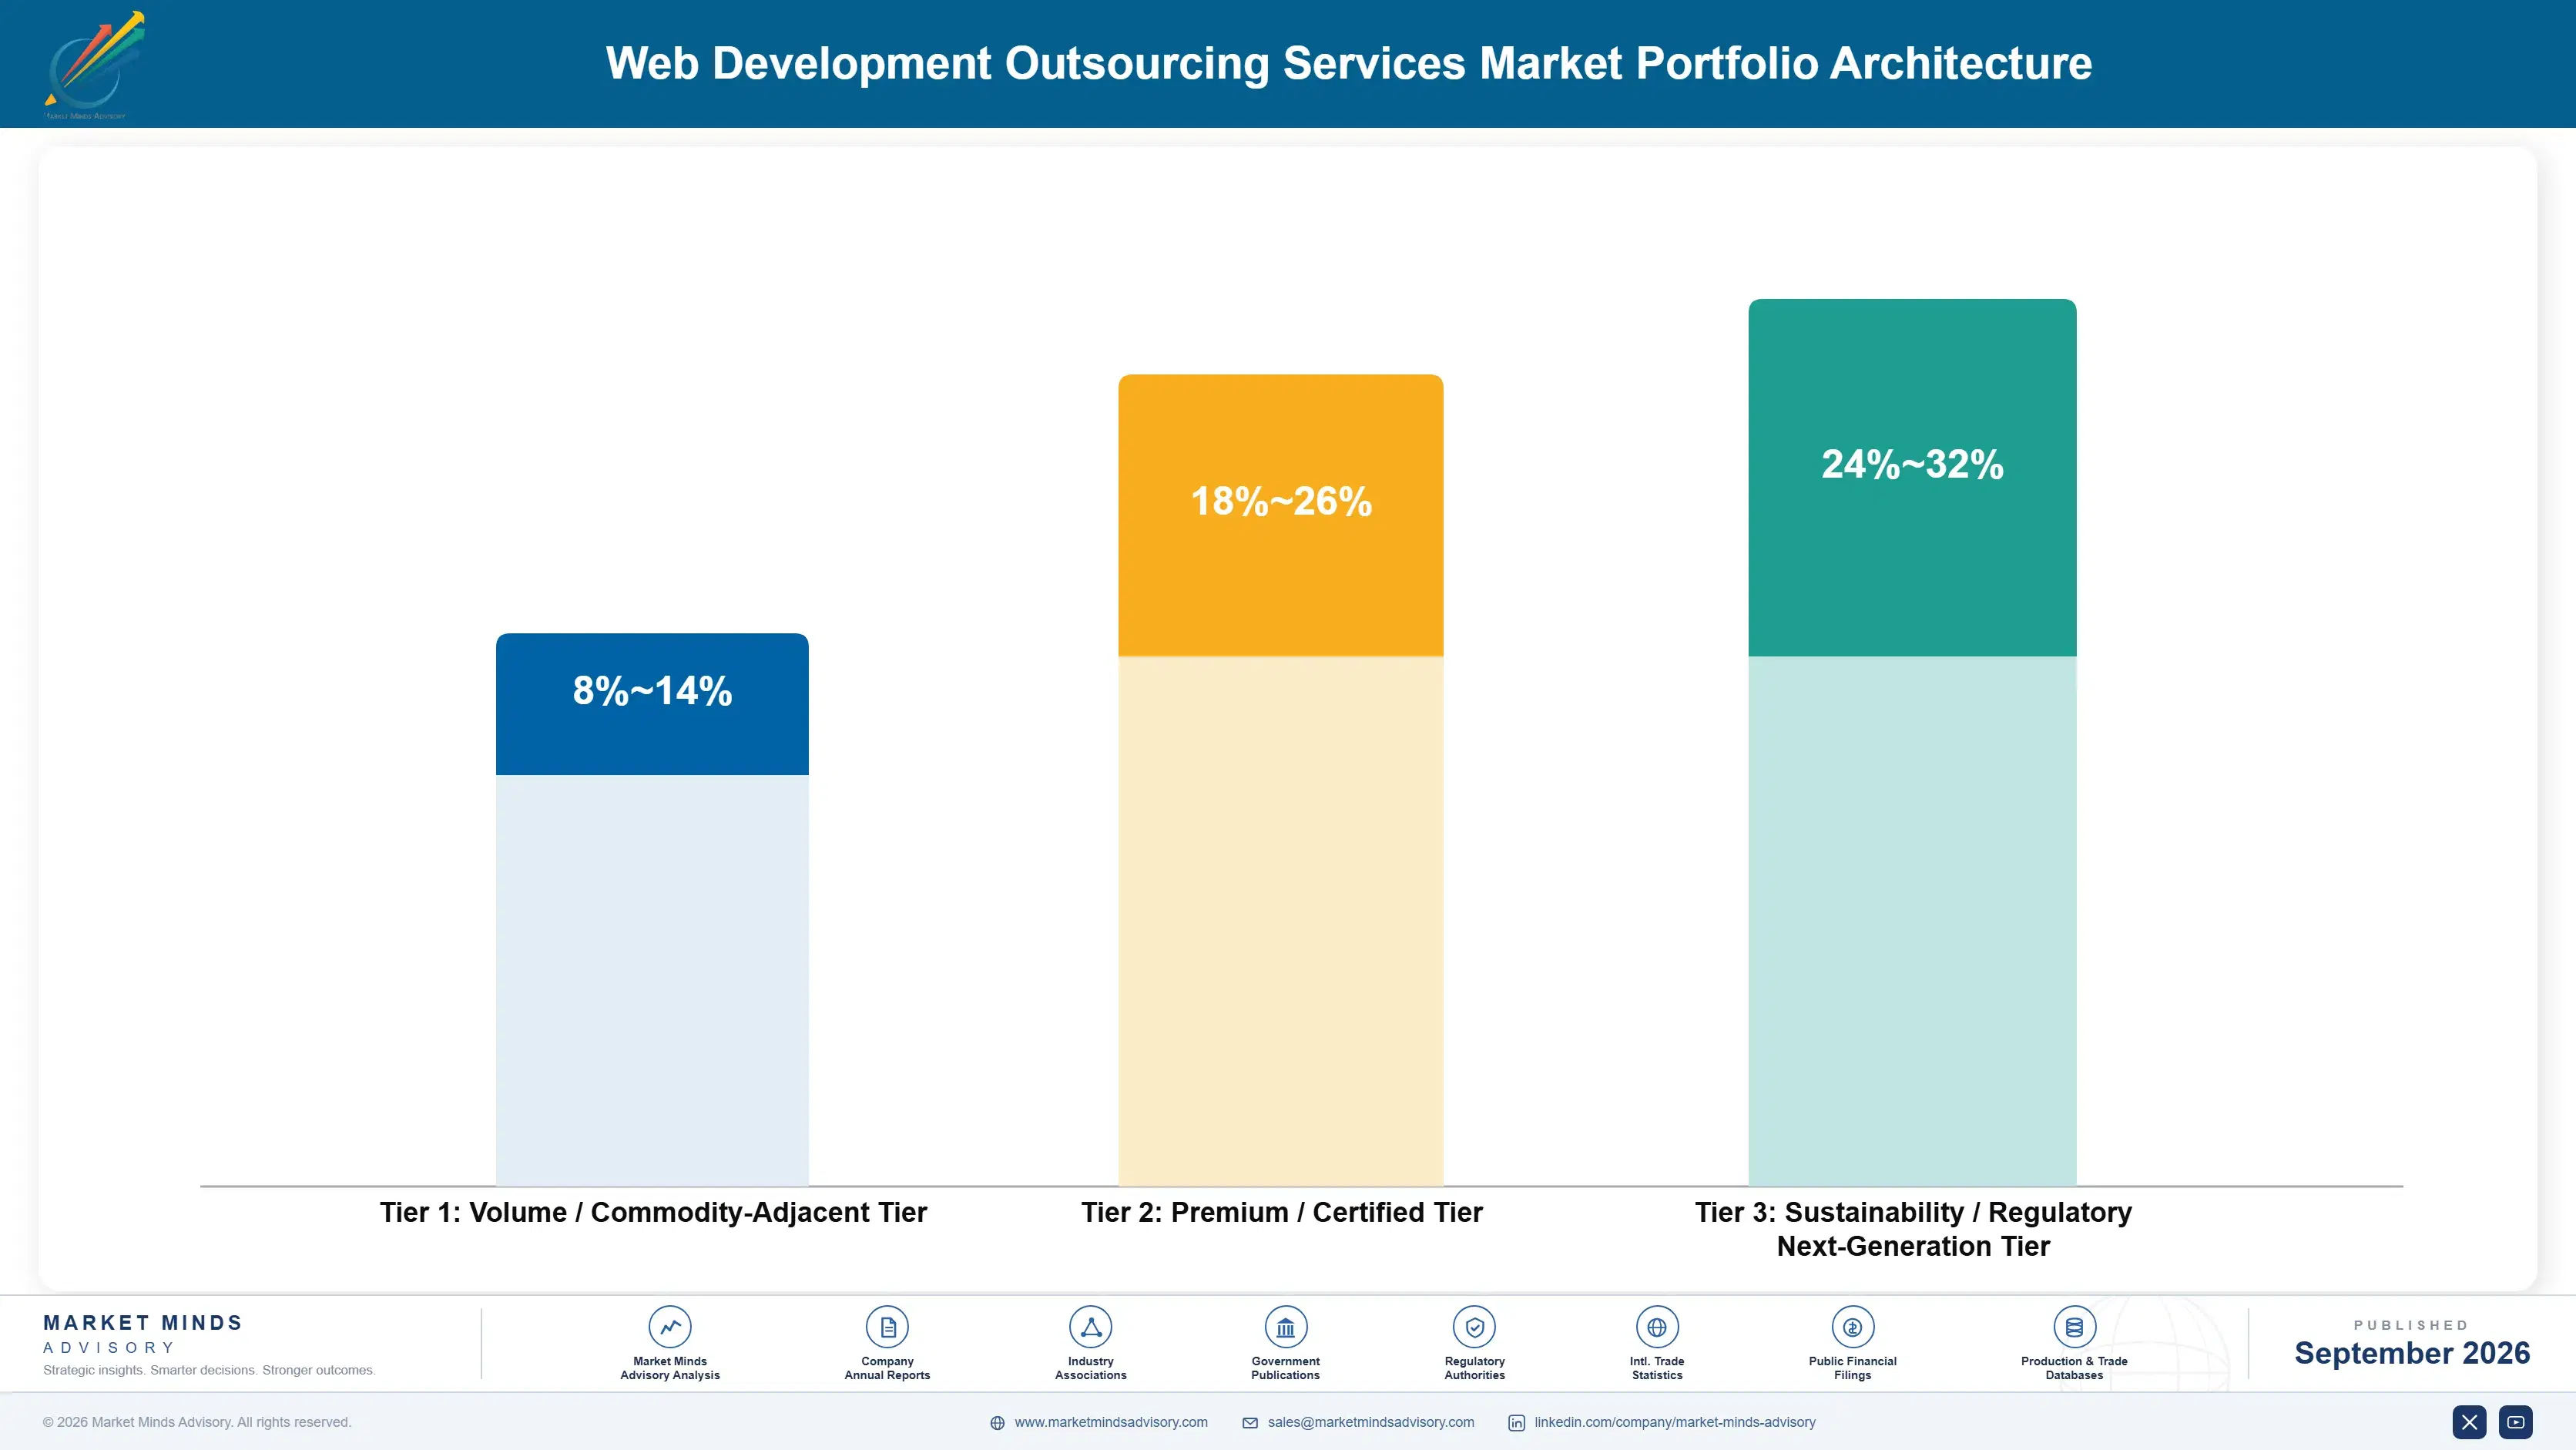
Vendor economics split cleanly across three tiers, and the gap between them is widening as clients pay dramatically more for proven delivery velocity than for basic staffing capacity alone. Volume commodity work sits at the bottom, absorbing wage inflation directly since clients treat it as fungible across competing vendors offering similar blended rates and comparable delivery timelines.
Premium certified work commands materially higher margins because compliance investment and demonstrated delivery discipline create switching costs that protect incumbent vendors from opportunistic price competition. The tension between chasing volume scale and building premium capability defines strategic choices at nearly every vendor above the smallest boutique studios, since resources devoted to certification cannot simultaneously fund headcount expansion for lower-margin commodity contracts.

High-value pools concentrate specifically around regulated industry clients and AI-augmented delivery contracts, where margins run well above the market average and renewal rates are consistently stronger. Vendors that commit early to these higher-margin categories are pulling meaningfully ahead of generalist competitors still competing primarily on cost, a gap in profitability that appears likely to widen further as client budgets increasingly reward demonstrated capability over raw staffing scale.

Volume / Commodity-Adjacent Tier

Standard maintenance and routine feature work priced primarily on blended hourly rates, with thin margins compressed further by wage inflation and intense price competition among comparably capable vendors offering nearly identical technical capability and delivery timelines across the mid-market client segment.
Gross Margin: 8-14%

Premium / Certified Tier

Compliance-certified delivery for regulated banking, healthcare, and financial services clients, commanding higher margins through demonstrated audit readiness and proven multi-year delivery track records that smaller vendors rarely match, supporting stronger renewal rates and reduced exposure to opportunistic price-only competition.
Gross Margin: 18-26%

Sustainability / Regulatory / Next-Generation Tier

AI-augmented delivery and outcome-based contracts capturing the highest margins as clients pay for verified velocity gains and reduced project risk rather than simple staffing capacity, rewarding vendors that invest early in proprietary tooling and transparent delivery measurement dashboards.
Gross Margin: 24-32%
web-development-outsourcing-services-market-portfolio-architecture-1788452193742

High-value Sub-segments and Strategic Watch-out

E-Commerce Platform Development and Integration

Retailers rebuilding storefronts around headless commerce and personalization command premium pricing and the fastest segment growth rate, driven by recurring seasonal deadlines and specialized payment integration expertise vendors increasingly compete to demonstrate. Contract values here consistently exceed those of custom application work given the elevated uptime and integration complexity required.
Gross Margin: 20-28%

Regulated Industry Compliance Delivery

Banking and healthcare compliance work grows steadily rather than explosively, but commands premium rates and strong renewal loyalty since switching vendors mid-engagement carries significant audit and knowledge transfer risk for regulated clients. This stability makes the segment attractive even without the fastest headline growth rate.
Gross Margin: 18-25%

Custom Application Maintenance Services

Routine maintenance and minor feature work remains the largest volume category by contract count, though margins are thinnest here and increasingly pressured by in-house AI copilots handling simpler routine tasks internally without outsourced vendor involvement. Vendors are repositioning this work around complex changes AI tools cannot yet automate.
Gross Margin: 8-13%

Generalist Offshore Staffing Contracts

Pure staff augmentation contracts without specialized capability face the steepest margin erosion as clients increasingly demand outcome-based pricing, leaving generalist vendors without differentiation exposed to aggressive price-only competitive bidding pressure from both established and newly emerging rival delivery organizations across every major offshore and nearshore delivery region worldwide.
Gross Margin: 5-10%

Renewal Economics of Outsourced Delivery

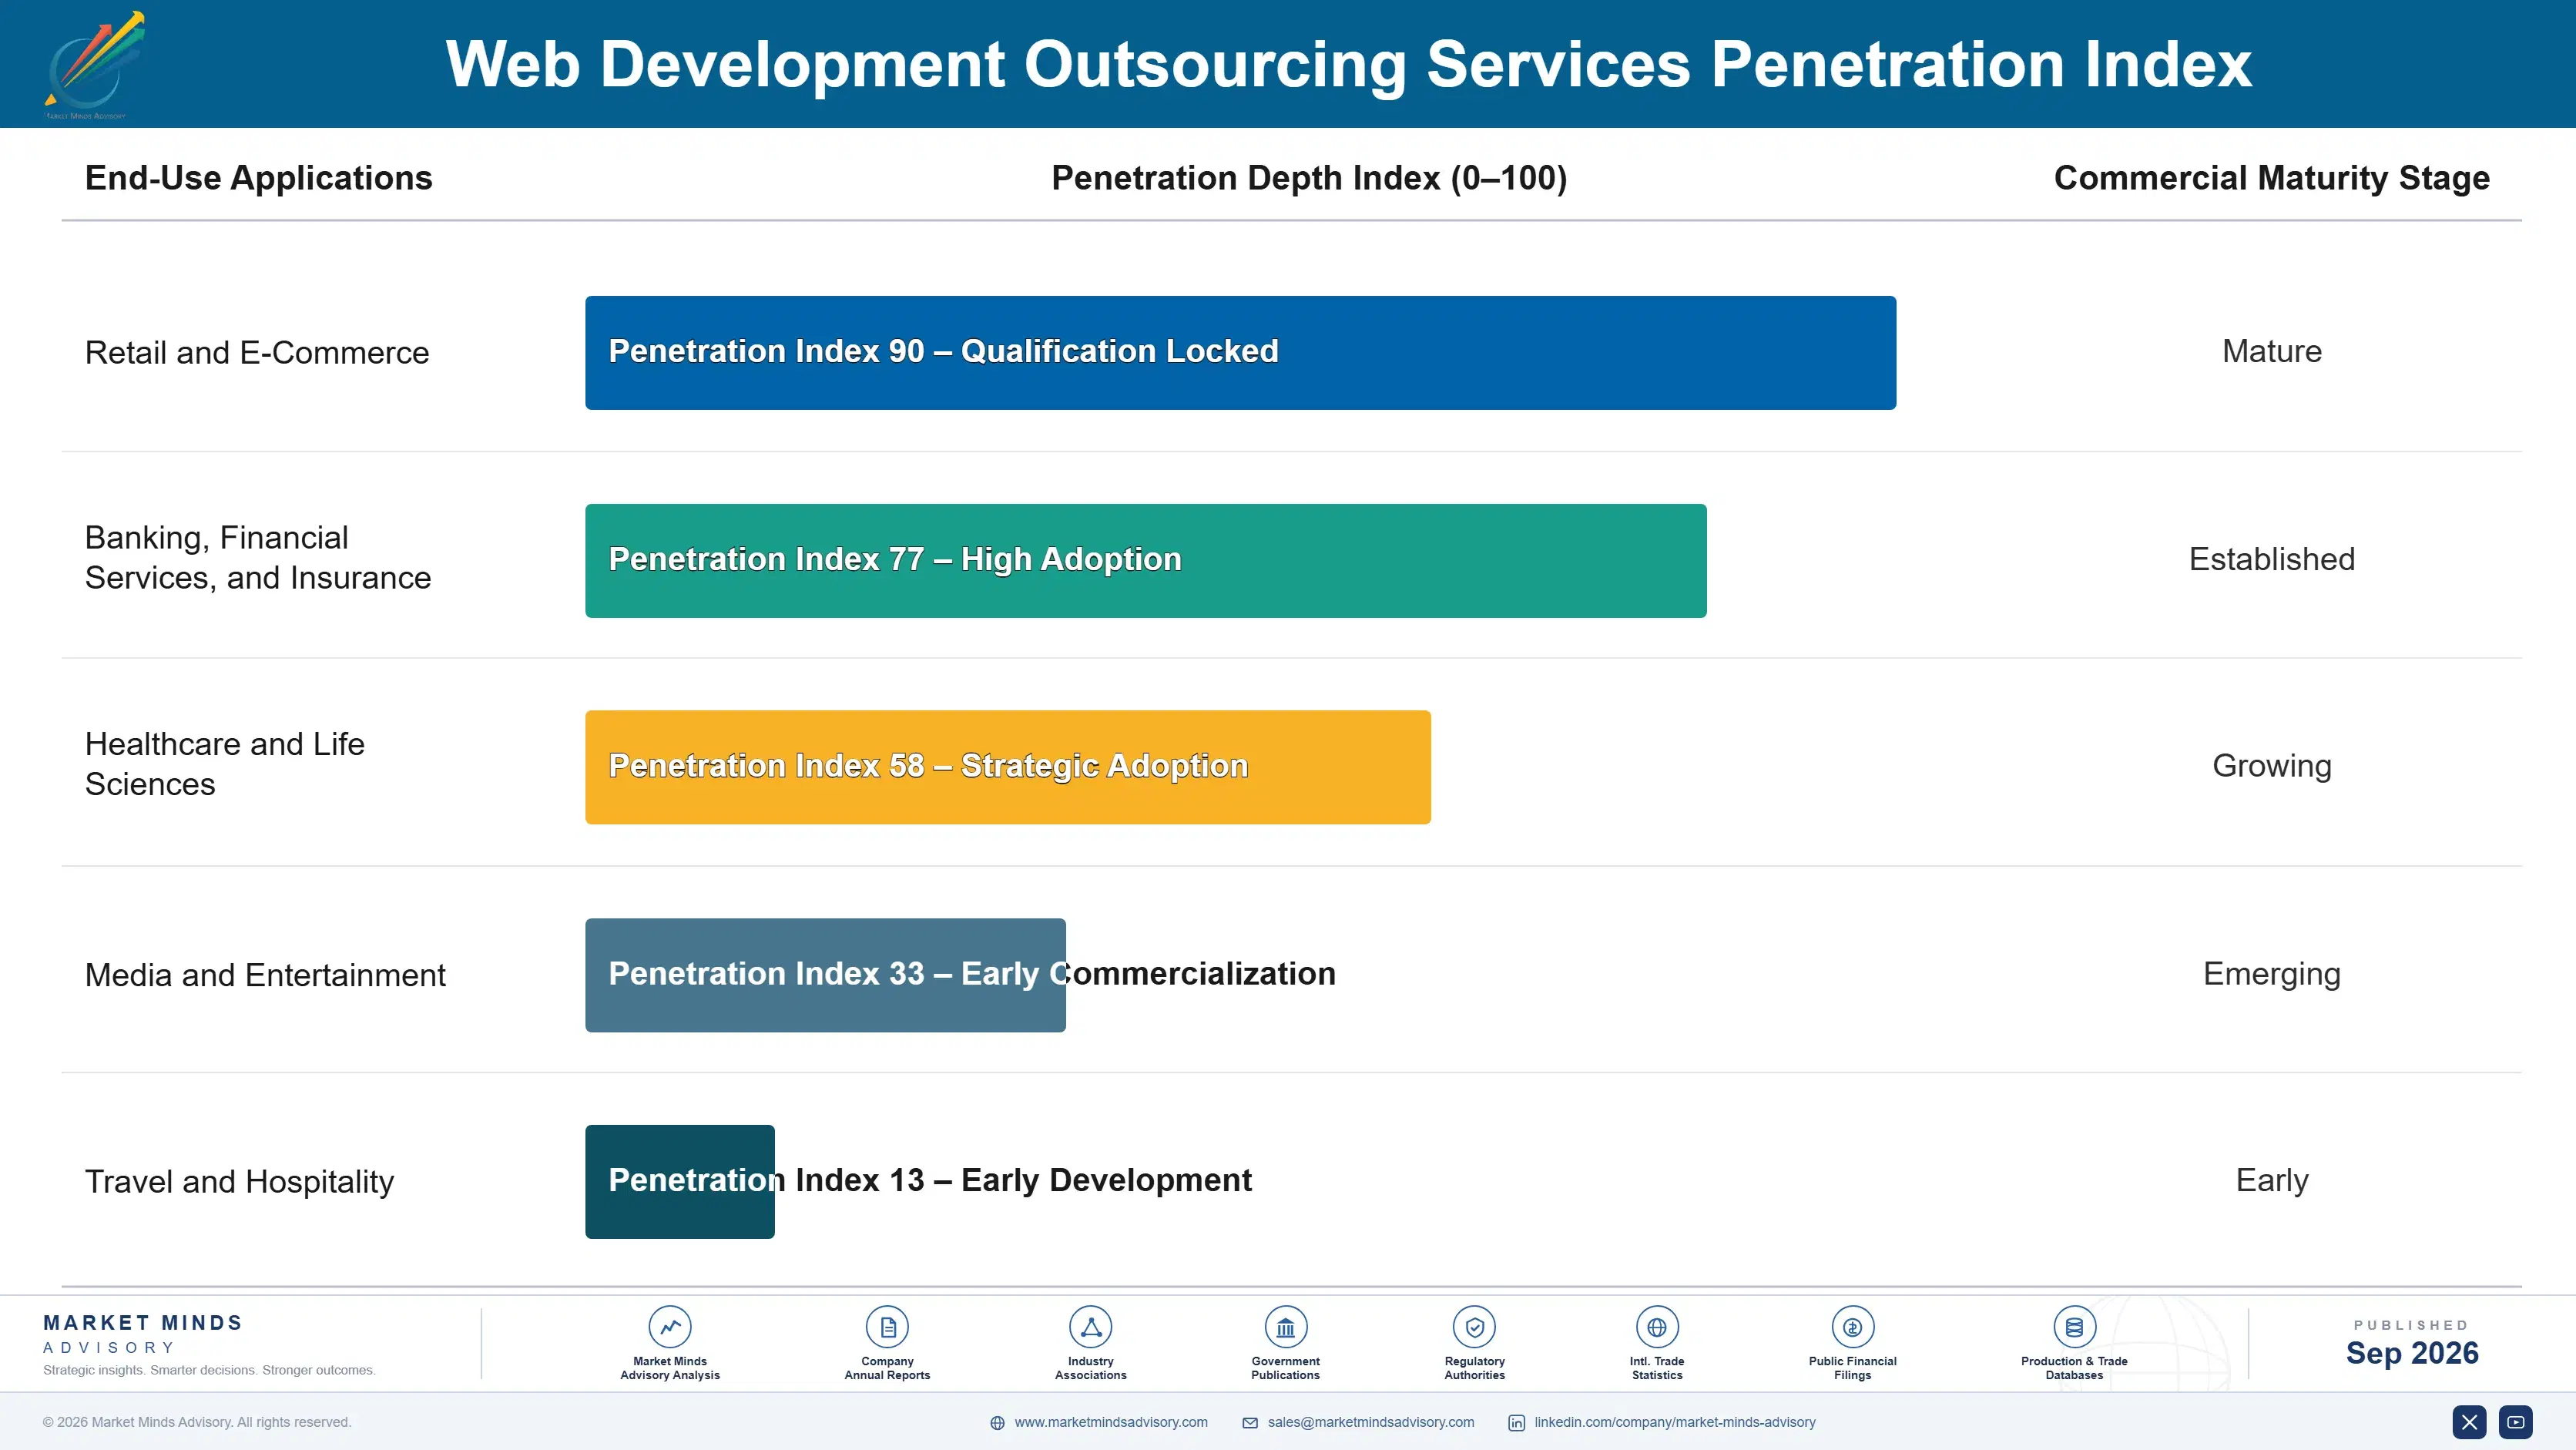
Outsourcing contracts increasingly function as annuities rather than one-time engagements, since vendors that complete an initial platform build typically retain maintenance, feature expansion, and infrastructure support work for years afterward, and switching a delivery vendor mid-lifecycle carries meaningful knowledge transfer costs that most enterprise clients would rather avoid entirely, especially once codebases grow large and institutional context accumulates deeply within the incumbent delivery team over successive years.
Adoption stickiness varies sharply by end-use vertical: banking and healthcare clients embed vendors deeply into compliance documentation and audit workflows, making displacement costly and slow to execute, while retail and media clients treat vendor relationships more transactionally, rebidding storefront contracts more frequently as seasonal campaign needs and platform vendor preferences shift year to year across competitive bidding cycles.

Buyer profiles are shifting generationally too, as digital-native procurement leaders now evaluate vendors on AI tooling maturity and delivery transparency dashboards rather than relationship tenure alone, a change forcing legacy vendors accustomed to long, informal client relationships to formalize reporting and prove measurable value each renewal cycle or risk losing incumbency to younger, faster-moving competitive challengers entering the same client accounts.
web-development-outsourcing-services-market-end-use-penetration-index-1788452194258

Winning the Outsourcing Margin Shift

These are among the four positions where our research anticipates prominent divergence between winners and laggards over the coming forecast period. Each is grounded in the demand model, the regulatory perimeter, and the announced capacity pipeline.
01 / AI DELIVERY INVESTMENT

Prioritize verifiable AI-augmented delivery velocity over headcount scale

Vendors that document measurable delivery speed gains through transparent, client-facing dashboards are winning premium pricing and renewal loyalty that pure staffing scale no longer guarantees on its own. Clients increasingly shortlist vendors on proven AI tooling maturity before evaluating cost at all, making this capability a genuine prerequisite rather than a mere differentiator for the largest competitive enterprise bids across every regulated and unregulated client industry. Vendors delaying this investment risk losing renewal negotiations to faster-moving rivals within two to three contract cycles at most.
02 / COMPLIANCE CERTIFICATION FOCUS

Build regulated industry certification depth before competitors close the gap

Compliance certification in banking and healthcare creates switching costs that protect incumbent vendors from opportunistic price competition far more durably than general technical reputation or brand recognition alone ever could. The upfront investment runs into seven figures for larger vendors, but resulting contracts carry renewal rates well above market average and insulate margins from commodity pricing pressure across cyclical downturns. Vendors without this capability increasingly find themselves excluded from the largest, longest-duration regulated industry mandates entirely, regardless of otherwise strong technical delivery credentials.
03 / DELIVERY GEOGRAPHY DIVERSIFICATION

Diversify delivery beyond India to hedge concentrated wage inflation risk

Vendors concentrated in a single delivery geography face disproportionate exposure when wage inflation accelerates sharply in that specific market, a risk already playing out visibly across several India-heavy vendors currently reporting compressed operating margins. Building delivery capacity across Eastern Europe, Latin America, and Southeast Asia spreads this exposure across regions with genuinely different wage cycles while simultaneously improving time zone coverage for global enterprise clients. This diversification requires years of sustained investment, so vendors should begin planning well before wage pressure becomes acute and unavoidable.
04 / OUTCOME-BASED CONTRACT DESIGN

Shift pricing models toward outcomes before clients force the change

Enterprise clients are increasingly rewriting procurement policy to favor outcome-based pricing over traditional time and materials billing, and vendors that adapt proactively capture meaningfully higher effective margins on successfully completed projects delivered on schedule. Vendors that simply wait for clients to mandate this shift will end up negotiating from a considerably weaker position, accepting client-defined terms rather than proactively shaping favorable contract structures themselves ahead of the transition. Mature estimation discipline and a demonstrated delivery track record remain firm prerequisites for winning outcome-based mandates profitably at real scale.

Engagement Snapshot From the Field

A live engagement with an industry participant carrying material or product regulatory and market exposure ahead of a defining policy shift, showing how our research translates into a defensible multi-year portfolio strategy.
MARKET MINDS ADVISORY · CLIENT ENGAGEMENT SUMMARY
Web Development Outsourcing Services Producer Strategic Portfolio Review and Transition Roadmap 2026·Investment Scenario on Web Development Outsourcing Services Exposure Evaluation 2025-26
CLIENT PROFILE
The client is a mid-sized North American specialty retailer operating roughly two hundred stores alongside a growing e-commerce channel that had scaled inconsistently across three separate outsourcing vendors over six years. Annual revenue reportedly exceeds 900 million dollars (client-reported, unverified by MMA), with digital commerce contributing an increasing share each year. Leadership sought to consolidate fragmented vendor relationships ahead of a major platform replatforming initiative.
STRATEGIC CHALLENGE
The client's three incumbent vendors delivered inconsistent code quality and duplicated infrastructure, driving up maintenance costs and slowing feature releases ahead of peak shopping season deadlines each year. Leadership needed a single strategic delivery partner capable of unifying the platform architecture and reducing this three-vendor sprawl and its ongoing coordination overhead.
MMA APPROACH
MMA conducted a structured vendor evaluation across cost, delivery capability, compliance certification, and AI tooling maturity, benchmarking five shortlisted candidates against the client's specific platform requirements and growth roadmap. The engagement combined primary interviews with vendor delivery leads and a detailed review of each candidate's documented delivery track record and reference client outcomes.
KEY FINDINGS
  1. The incumbent three-vendor structure added an estimated 18 percent to annual maintenance cost through duplicated infrastructure and redundant tooling investments (client-reported, unverified by MMA).
  2. Vendors demonstrating AI-augmented delivery velocity completed comparable feature work in roughly 30 percent less time than incumbents still relying on manual coding processes.
  3. Compliance certification depth mattered considerably less for this retailer than for banking clients, given its lighter regulatory obligations and simpler audit requirements overall.
  4. Consolidating to a single strategic vendor was projected to cut annual platform maintenance spend by roughly 22 percent within the first full year (client-reported, unverified by MMA).
CLIENT PROFILE
The client is a mid-sized North American specialty retailer operating roughly two hundred stores alongside a growing e-commerce channel that had scaled inconsistently across three separate outsourcing vendors over six years. Annual revenue reportedly exceeds 900 million dollars (client-reported, unverified by MMA), with digital commerce contributing an increasing share each year. Leadership sought to consolidate fragmented vendor relationships ahead of a major platform replatforming initiative.
STRATEGIC CHALLENGE
The client's three incumbent vendors delivered inconsistent code quality and duplicated infrastructure, driving up maintenance costs and slowing feature releases ahead of peak shopping season deadlines each year. Leadership needed a single strategic delivery partner capable of unifying the platform architecture and reducing this three-vendor sprawl and its ongoing coordination overhead.
MMA APPROACH
MMA conducted a structured vendor evaluation across cost, delivery capability, compliance certification, and AI tooling maturity, benchmarking five shortlisted candidates against the client's specific platform requirements and growth roadmap. The engagement combined primary interviews with vendor delivery leads and a detailed review of each candidate's documented delivery track record and reference client outcomes.
KEY FINDINGS
  1. The incumbent three-vendor structure added an estimated 18 percent to annual maintenance cost through duplicated infrastructure and redundant tooling investments (client-reported, unverified by MMA).
  2. Vendors demonstrating AI-augmented delivery velocity completed comparable feature work in roughly 30 percent less time than incumbents still relying on manual coding processes.
  3. Compliance certification depth mattered considerably less for this retailer than for banking clients, given its lighter regulatory obligations and simpler audit requirements overall.
  4. Consolidating to a single strategic vendor was projected to cut annual platform maintenance spend by roughly 22 percent within the first full year (client-reported, unverified by MMA).
RECOMMENDED STRATEGY
Phase 1: Phase 1 (Months 1 to 3): Conduct structured vendor evaluation and select a single strategic delivery partner based on documented criteria and reference checks. Phase 2: Phase 2 (Months 4 to 9): Migrate core platform infrastructure and consolidate duplicated systems under the newly selected strategic vendor relationship without disrupting live operations. Phase 3: Phase 3 (Months 10 to 14): Scale feature delivery velocity and formalize AI tooling adoption across the fully unified platform architecture and delivery team.
OUTCOME
The client consolidated from three vendors to one within fourteen months, reporting a 21 percent reduction in annual platform maintenance spend and materially faster feature release cycles ahead of the following peak shopping season (client-reported, unverified by MMA). Leadership credited the unified delivery model with improving cross-team coordination substantially.

Frequently Asked Questions

Foundational context covering the market sizes, CAGR, scope, country, region and competition that inform every finding below. This section is provided to cover basics and most often pre-purchase conversations, answered from the MMA Primary Research Dataset.

What is the current size of the Web Development Outsourcing Services Market?

The market reached an estimated 58.4 billion dollars in 2025, according to MMA Primary Research Dataset, July 2026, reflecting sustained enterprise demand for custom platform and e-commerce delivery capacity.

How large will the Web Development Outsourcing Services Market be by 2036?

MMA projects the market will reach approximately 180.5 billion dollars by 2036, expanding roughly 2.79 times from its 2026 base value as enterprise outsourcing budgets continue growing steadily.

What is the CAGR for the Web Development Outsourcing Services Market 2026 to 2036?

The market is expected to grow at a compound annual rate of 10.8 percent between 2026 and 2036, supported by AI-augmented delivery adoption and expanding platform modernization budgets.

Which segment is growing fastest?

E-commerce platform development and integration services lead growth at roughly 14.5 percent annually, about 1.34 times the overall market rate, driven by recurring seasonal storefront rebuilding cycles.

Who are the major companies in the Web Development Outsourcing Services Market?

Accenture, Infosys, Tata Consultancy Services, Wipro, and EPAM Systems lead the competitive field, though the market remains fragmented with a CR5 of just 24 percent overall.

Which country is growing fastest?

India leads at roughly 13.0 percent annually, driven by its dominant position as the world's largest engineering delivery hub for outsourced web development and platform work.

Report Segmentation Architecture

The full report scope spans multiple orthogonal segmentation dimensions, with cross-tabulated demand data provided for each dimension pair. Coverage extends further to regional breakdowns, trend trajectories, and the competitive detail needed to support segment-level decision-making.
  • Custom Web Application Development
  • E-Commerce Platform Development and Integration
  • UI/UX Design and Front-End Engineering Services
  • Website Maintenance and Support Services
  • Content Management System Implementation Services
  • Quality Assurance and Testing Services
  • Retail and E-Commerce
  • Banking, Financial Services, and Insurance
  • Healthcare and Life Sciences
  • Media and Entertainment
  • Travel and Hospitality
  • Time and Materials Contracts
  • Fixed-Price Project Contracts
  • Outcome-Based and Managed Service Contracts
  • Staff Augmentation Arrangements

By Region

  • North America
  • Western Europe
  • East Asia
  • South Asia and Pacific
  • Latin America
  • Middle East and Africa
  • Eastern Europe

Scope, Methodology, and Coverage

Every figure in this report is reproducible from documented input assumptions. The scope below maps the historical period, the forecast horizon, the segmentation dimensions, and the countries covered, alongside the underlying primary and qualitative methodology.
Historical Period
2020 to 2025
Forecast Period
2026 to 2036
Base Year
2025 (USD billions; MMA Primary Research Dataset, September 2026)
Market Definition
This report covers custom software development, e-commerce platform engineering, UI and UX design, and related web application delivery services provided by third-party outsourcing vendors to enterprise clients globally. It excludes internal in-house development teams and generic IT infrastructure hosting services.
Quantitative Units
USD billions (current prices)
Segmentation Dimensions
By Primary Market Dimension; By End-Use Industry; By Commercial Dimension; By Region
Regions Covered
North America, Western Europe, East Asia, South Asia and Pacific, Latin America, Middle East and Africa, Eastern Europe
Countries Covered
USA, China, Germany, France, UK, Japan, South Korea, India, Australia, Canada, Brazil, Mexico, Indonesia, Vietnam, Thailand, Malaysia, UAE, Saudi Arabia, South Africa, Nigeria, Turkey, Poland, Netherlands, Italy, Spain, Sweden, Switzerland, Argentina, Colombia, Singapore, and additional markets relevant to this sector
Key Companies Profiled
Accenture plc, Infosys Limited, Tata Consultancy Services, Wipro Limited, EPAM Systems Inc, Cognizant Technology Solutions, HCL Technologies, Tech Mahindra Limited, Capgemini SE, Globant SA, Endava plc, DXC Technology Company, Sopra Steria Group, Luxoft Holding Inc, Softtek, Mindtree Limited, Persistent Systems Limited, Grid Dynamics Holdings Inc, Thoughtworks Holding Inc, L&T Infotech Limited
Quantitative Methodology
Primary survey, n=3,800 respondents, Q4 2025, six countries; demand-side model with trade association cross-validation
Qualitative Methodology
47 expert interviews, Q4 2025; applied to validate demand model assumptions, identify emerging dynamics, and assess competitive positioning
Report Format
PDF and XLSX data workbook (Word format preview document)
Publisher
Market Minds Advisory
Report Code
MMA-2026-TEC-342
Published
September 2026
Contact
sales@marketmindsadvisory.com | www.marketmindsadvisory.com

Purchase the full Web Development Outsourcing Services Market Report (2026 to 2036).

This report delivers a complete assessment of the global web development outsourcing services market, quantifying segment-level growth rates, regional demand concentration, and competitive positioning among twenty leading vendors through 2036. The analysis draws on primary survey data from 3,800 respondents and 47 expert interviews conducted in the fourth quarter of 2025. It examines how AI-augmented delivery capability, outcome-based contracting, and delivery geography diversification are reshaping vendor economics across every major client industry. Readers gain a clear view of where margin growth concentrates and which vendors are best positioned to capture it.
Ten-year market sizing and growth forecasts
Segment-level CAGR and demand growth analysis
Competitive benchmarking of twenty leading vendors
Regional demand architecture across seven regions
Engineering labor cost and volatility assessment
Strategic revenue lever identification for vendors

Built For The People Who Decide

From boardroom strategy to bench-side execution, this report is read cover-to-cover by leaders shaping the next decade of their industry, turning demand scenarios, market dynamics and valuation benchmarks into decisions.
CXOs/ Presidents/ VPs/ Managers
M&A and Corporate Development
Strategy Teams and R&D Heads
Procurement and Product Directors
Regulatory and Compliance Leaders
Investor Relations and Equity Analysts