Market Minds Advisory
Web Based e-Detailing Market

Web Based e-Detailing Market: Web Based e-Detailing Market: Prescriber Access, Self-Guided Engagement and Approval Throughput, 2026 to 2036

The ceiling on this channel is not pharmaceutical digital ambition. It is how many physicians will still open a door, and roughly 51% now decline in-person representative visits as a matter of policy.

Lead Analyst

Published

September 2026

Make Smarter Decisions with Customized Research Insights

Request a free sample report and evaluate market opportunities, growth trends, and competitive dynamics relevant to your business needs.

2025 MARKET VALUE$2.4BMarket Size 2025
2036 FORECAST VALUE$6.4BBase Case , 2026 to 2036
CAGR 2026 TO 20369.4 %Bull 10.6% / Bear 8.2%
INCREMENTAL OPPORTUNITY$3.8BNet 10- year value creation
EXPANSION MULTIPLE2.46x2036 value over 2026 base
Strategic Levers
M&A Pipeline
Regional Outlook
Country Rankings
Competitive Intelligence
Segmental Deep-dive
Call-Us : 91 93563 13602

Executive Snapshot and Market Trajectory.

Everybody expected this channel to revert after 2021 and it partly did, but not to where it started. What holds it up is not enthusiasm for digital promotion. Around 51% of prescribers now decline in-person representative visits as a stated policy, and those physicians still need reaching somehow.
Self-guided portals grow at 14.1%, half again the market rate of 9.4%, and they are the channel nobody in commercial operations actually wanted. Representatives prefer live conversation while physicians prefer content at eleven at night, and 58% of engagement now happens outside clinical working hours. Third-party physician media networks follow at 12.6%. Those networks sell access to prescribers who will not engage with a manufacturer directly at any spending level. Manufacturers cannot rebuild that audience.
Approval throughput is the constraint the industry rarely discusses. Median time from asset creation to promotional approval runs 31 days, which throttles the responsiveness digital channels were supposed to deliver. East Asia holds 30% of platform revenue, the highest of any region, on physician platform reach that Western equivalents have never matched. Modular content assembled from pre-cleared components is the only mechanism that has shortened that cycle anywhere.
Market Definition
This market covers digital promotion of pharmaceutical products to healthcare professionals delivered over the web, including rep-led remote video detailing, self-guided unassisted detailing portals, third-party healthcare professional media detailing networks, web-based educational detailing modules, digital sample and prescribing support requests, and messaging and asynchronous detailing channels. It excludes in-person field detailing, medical science liaison activity, patient-facing advertising, clinical trial recruitment, and customer relationship management platforms themselves.
Base Year Value
$2.4B in 2025 (MMA Primary Research Dataset, September 2026)
Forecast Period
2026 to 2036, eleven discrete annual values
CAGR
9.4% base case. Bull 10.6%. Bear 8.2%.
Fastest Growth Segment
Self-Guided Unassisted Detailing Portals: 14.1% CAGR
Fastest Growth Country
China: 14.8% CAGR
Fastest Growth Region
South Asia and Pacific: 11.4% CAGR
Largest Region
East Asia: 30% of 2025 global value
Market Leaders
Veeva Systems, IQVIA, Doximity, M3, and Viseven lead the field. Source: MMA Primary Research Dataset, July 2026.
Primary Survey
n=3,800 procurement and R&D decision-makers, Q4 2025, six countries
Methodology
Demand-side build-up, cross-validated against public data, 47 expert interviews

Web Based e-Detailing Market Forecast Scenarios

web-based-e-detailing-market-size-forecast-scenario-1790012126763
Between 2020 and 2025 this channel expanded under duress, contracted when access reopened, and settled somewhere neither side had planned. In-person detailing returned but not to prior levels, because prescriber access policies had hardened during the interval and health systems found the restrictions convenient. Historical growth of 8.0% averages a surge and a partial retreat, and describes neither period accurately.
The base case at 9.4% rests on three mechanisms. Restricted prescriber access is a policy position rather than a preference, and 51% of physicians now decline in-person visits, which sustains remote channels regardless of commercial preference. Self-guided engagement matches how physicians actually consume information, at times no representative is available. And third-party media networks reach prescribers who will not engage with a manufacturer directly at all. None of the three depends on manufacturers preferring digital channels.
The bull case at 10.6% depends on access restrictions widening further as health systems formalise policies that are currently informal, which would enlarge the population reachable only through digital channels. The bear case at 8.2% is measurement pressure: digital promotion is assessed on engagement metrics that do not map convincingly onto prescribing, and a serious effectiveness review could reduce budgets quickly.

Access Decides The Channel

The most common framing of this market has the causation backwards. Manufacturers did not choose digital detailing because it works better; they use it because roughly 51% of prescribers now decline in-person visits under health system policies that hardened after 2020 and were never relaxed. The channel exists at the size access restrictions permit rather than at the size anybody designed. Forecasts built on adoption enthusiasm have consistently overshot what actually happened, and those built on access policy have not.
TOP FIVE CONCENTRATION38%Share of platform revenue held by the leading providers
NO-SEE PRESCRIBER SHARE51%Physicians declining in-person representative visits as stated policy
SELF-GUIDED ENGAGEMENT SHARE44%Detailing interactions completed with no representative present at all
CONTENT APPROVAL CYCLE31 daysMedian time from asset creation to promotional approval being granted
AVERAGE ANNUAL CONTRACTUSD 142,000Platform value averaged across pharmaceutical brand deployments annually
OUT OF HOURS ENGAGEMENT58%Interactions occurring outside normal clinical working hours entirely
Physician behaviour then decided which digital format actually grew. Representatives prefer live conversation, which is what remote video detailing offers. Physicians prefer reading something at eleven at night when clinic has finished, which is what self-guided portals offer. Around 58% of engagement occurs outside working hours, and self-guided portals grow fastest at 14.1% for exactly that reason.
Approval throughput limits everything else. Median time from asset creation to promotional approval runs 31 days through medical, legal, and regulatory review processes designed for printed materials. That is a serious constraint on a channel sold partly on responsiveness, and modular approved content that reuses pre-cleared components is the only mechanism that has meaningfully shortened it anywhere.
"Commercial teams still present this as a digital transformation story and the physicians we speak to describe something simpler. They stopped seeing representatives, the information still has to arrive somehow, and they would rather read it when they choose than sit through a scheduled call. That is the whole market in three sentences."
Practice Director, Pharmaceutical Commercial and Digital Engagement · MMA Healthcare Practice · September 2026

Market Trends

Physician Access Policy Sets The Channel Ceiling

Around 51% of prescribers decline in-person representative visits under health system policies that hardened during the pandemic and were never relaxed afterwards, since restricting commercial access proved administratively convenient. Manufacturers reach those physicians remotely or not at all. That makes the size of this channel a function of access policy rather than of any digital strategy, and it explains why forecasts built on adoption enthusiasm have consistently overshot what actually happened. Health systems found the restrictions administratively convenient, which is why none of them were relaxed once the original justification passed.
Market Impact: Country grows at 14.8%
Self-Guided Formats Beat The Ones Reps Prefer

Representatives value live conversation and remote video detailing preserves it, which is why commercial organisations invested there first. Physicians consume information at times no representative is working, and 58% of engagement now occurs outside clinical hours. Self-guided portals grow at 14.1% against 7.2% for rep-led video. The format matching physician behaviour is winning against the format matching the commercial model, which was predictable and was largely not predicted. Commercial organisations resist the conclusion because it reduces the representative's role, which is an argument about internal structure rather than about what physicians want.
Market Impact: Segment grows at 12.6%

Market Opportunities and Growth Drivers

Enforcement Curtails In-Person Promotion In Large Markets

Anti-corruption enforcement in healthcare has substantially reduced in-person pharmaceutical promotion across several major markets, moving spending toward channels that leave an auditable record of exactly what was shown and to whom. Chinese growth of 14.8% leads every country covered on that basis alongside physician platform reach nothing in the West matches. The compliance advantage of a recorded digital interaction is now cited more often than any engagement argument. An interaction that can be reconstructed afterwards carries less risk than one nobody recorded, which matters more than any engagement figure. Compliance advantage now features more often than reach.
Market Impact: Approval takes 31 days

Third-Party Networks Reach Physicians Manufacturers Cannot

A prescriber who declines contact with a manufacturer will frequently engage with an independent physician platform they already use for reference, peer discussion, or continuing education. Third-party media detailing networks grow at 12.6% by selling access to that audience rather than trying to rebuild it. Manufacturers accept less control over context in exchange for reaching an audience their own channels have been unable to attract at any spending level. Japanese and Chinese platforms hold physician membership that dwarfs Western equivalents, which is much of why regional revenue concentrates where it does.
Market Impact: Affects 100% of reporting

Market Restraints and Challenges

Approval Cycles Throttle The Promised Responsiveness

Median approval time runs 31 days from asset creation to promotional clearance, and the root cause is that medical, legal, and regulatory review processes were designed for printed materials produced a few times a year. Commercially this undermines a channel sold on responsiveness and leaves campaigns arriving after the moment they addressed. Participants respond with modular content assembled from pre-cleared components, review workflow tooling, and pre-approved variant libraries covering predictable message needs. Restructuring how content is authored is the harder half, which is why adoption trails the benefit considerably. Campaigns still arrive after their moment.
Market Impact: Covers 51% of prescribers

Engagement Metrics Do Not Predict Prescribing

Digital promotion reports clicks, dwell time, and completion rates, and the root cause of the problem is that none of these map convincingly onto prescribing behaviour that manufacturers ultimately fund the channel to influence. Commercially this leaves budgets vulnerable whenever effectiveness receives serious scrutiny. Participants respond with prescription data linkage where regulation permits it, controlled exposure testing across matched physician groups, and honest reporting of what engagement does and does not indicate. The honest position looks weaker in a pitch and considerably stronger when somebody senior asks what the spending achieved.
Market Impact: Segment grows at 14.1%
3 additional market trends, 4 additional growth drivers, and 2 additional restraints and challenges are covered in the full report. Contact sales@marketmindsadvisory.com to access the complete intelligence.

Segment CAGR and Growth Architecture

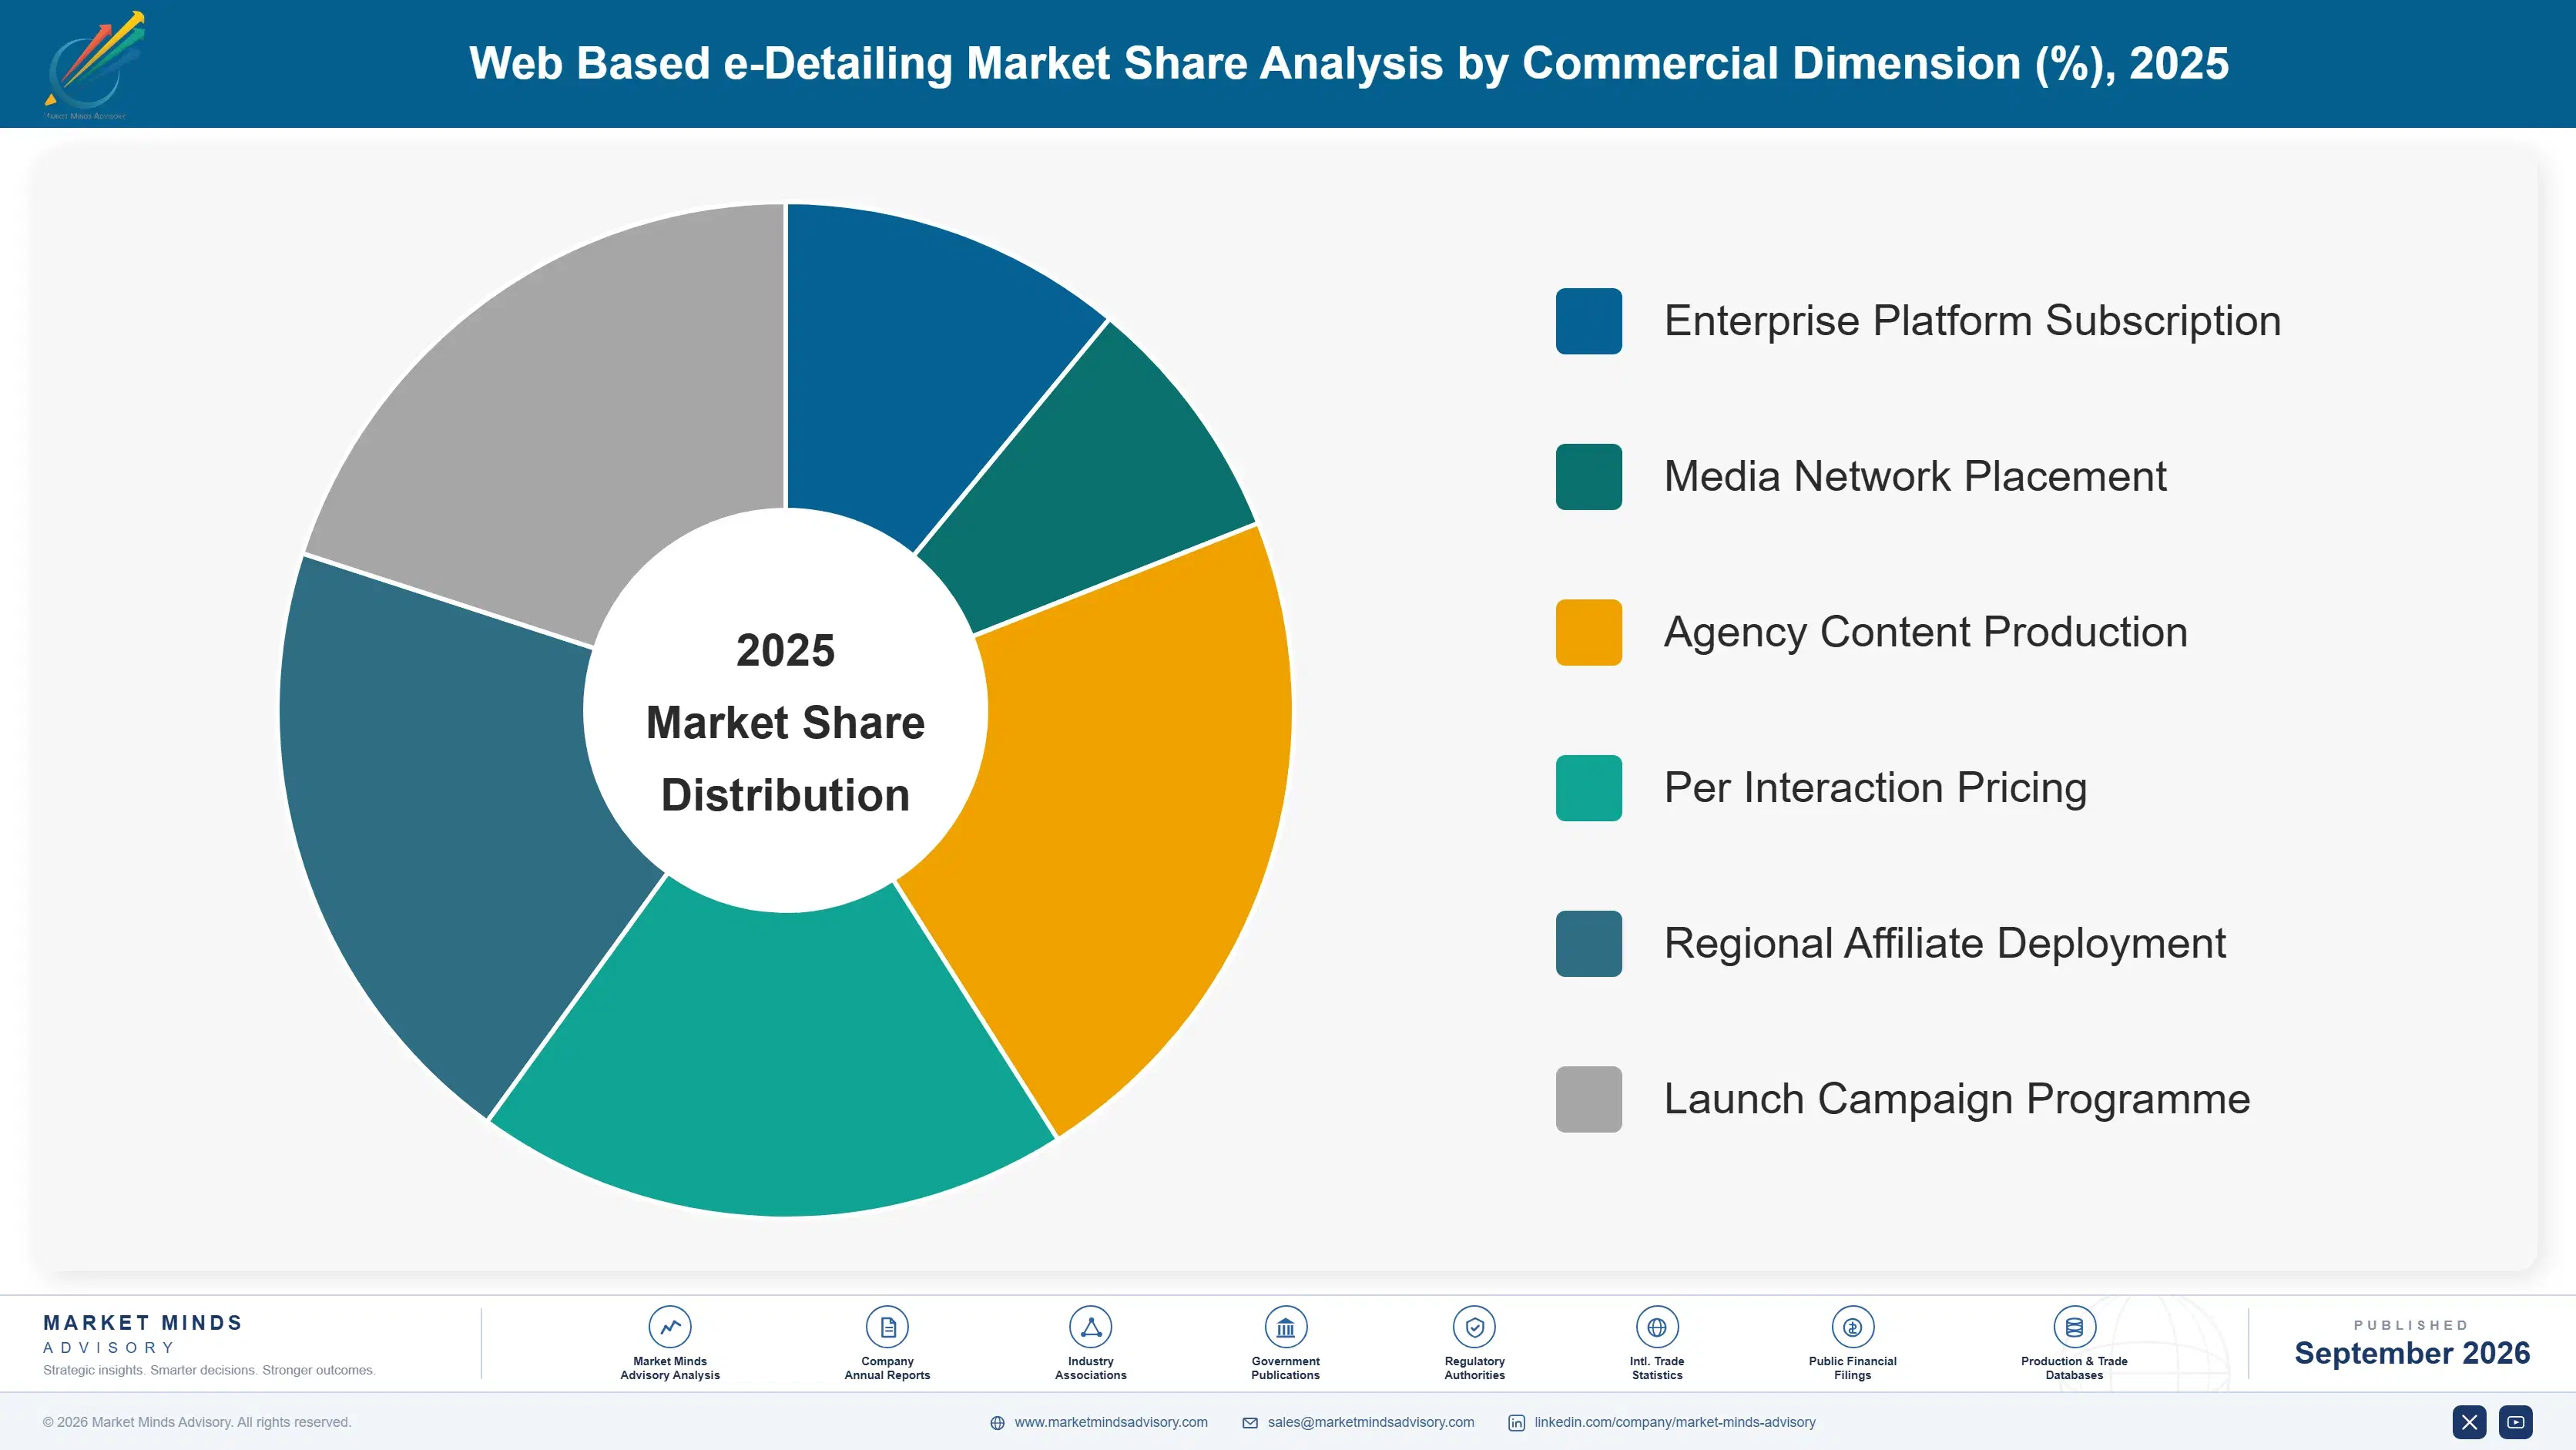
Segmentation follows detailing delivery format. Six categories cover the market: rep-led remote video detailing, self-guided unassisted detailing portals, third-party healthcare professional media detailing networks, web-based educational detailing modules, digital sample and prescribing support requests, and messaging and asynchronous detailing channels. Content production and approval tooling are counted within the format they serve. Media placement sits within its delivery format.
web-based-e-detailing-market-market-share-analysis-1790012127352

Self-Guided Unassisted Detailing Portals

Self-guided portals grow at 14.1%, half again the market rate of 9.4%, because they match how physicians actually behave rather than how commercial organisations prefer to operate. Around 58% of engagement occurs outside clinical working hours, when no representative is available and no scheduled call is possible. Rep-led video detailing grows at half that rate despite receiving most of the early investment, since it preserves a live conversation the representative values and the physician frequently does not. The format that fits the audience is winning, which was foreseeable and was mostly not foreseen. Providers repackaging rep-led decks rather than rebuilding for self-guided reading see none of the benefit. The format fitting the audience beats the one fitting the commercial model.
CAGR 14.1%

Third-Party HCP Media Detailing Networks

Third-party networks grow at 12.6% by selling access to physicians who decline manufacturer contact but engage readily with independent platforms they already use for reference, peer discussion, and continuing education. Rebuilding that audience directly has been attempted repeatedly and has not worked at any spending level. Manufacturers accept reduced control over surrounding context in exchange for reach they cannot otherwise obtain. Japanese and Chinese platforms hold physician membership that dwarfs Western equivalents, which is a substantial part of why regional revenue concentrates where it does. Monetising harder risks the professional usefulness the audience arrived for, which constrains growth in a way manufacturer channels never face. Membership depth rather than technology decides this position, and it takes years to build credibly.
CAGR 12.6%
Full segment breakdown across 6 segments available in the complete report.

Regional Architecture and Country Demand Map

Regional shares follow prescriber access restriction and physician platform reach rather than pharmaceutical market size, and those diverge considerably. All seven regions sit inside the standard bands here, with East Asia leading on platform membership depth. Access policy explains more than pharmaceutical spending does. Membership depth decides much of it.

East Asia

Japanese physician platforms hold membership covering the substantial majority of practising doctors, a depth no Western equivalent approaches, and manufacturers reach prescribers through them as a primary rather than supplementary channel. Chinese growth of 14.8% leads every country covered, driven by enforcement that has sharply reduced in-person promotion and moved spending toward interactions leaving an auditable record. Growth of 10.4% exceeds the world rate. Korean adoption follows similar patterns at smaller scale, and regional platforms increasingly sell reach to manufacturers headquartered elsewhere. Regional platforms increasingly sell reach to manufacturers headquartered elsewhere, which turns a domestic audience asset into an internationally traded one. Korean adoption follows similar patterns at a smaller scale across the same platforms.
Share: 30% | CAGR: 10.4% (2026 to 2036)

North America

Prescriber access restriction is more formalised here than anywhere, with health system policies governing commercial contact across large integrated provider organisations rather than being left to individual physicians. That sustains remote channels by policy rather than by preference. Growth of 8.8% is close to the world rate. Approval cycles here run longer than the world average because legal review is more cautious, which delays exactly the responsiveness the channel was bought for. Third-party physician networks compete directly with manufacturer channels for the same limited attention. Physicians here move between employed positions frequently, so an access policy set by one health system reaches a large number of prescribers at once and outlasts any individual relationship a representative had built.
Share: 28% | CAGR: 8.8% (2026 to 2036)
Regional intelligence for 5 additional markets available in the complete report: Western Europe, South Asia and Pacific, Latin America, Middle East and Africa, Eastern Europe. Contact sales@marketmindsadvisory.com.
web-based-e-detailing-market-country-cagr-analysis-1790012127894

Where Providers Grow Their Position

Four commercial moves separate providers growing with physician behaviour from those building for a commercial model prescribers have already walked away from. Each accepts that access policy sets the ceiling and that approval throughput, not creative capability, limits what reaches anybody. Prescribers walked away from the commercial model some time ago. Creative capability decides very little now.

Build For Eleven At Night, Not Appointments

Around 58% of physician engagement occurs outside clinical working hours, when no representative is available and no scheduled call can happen. Providers building self-guided experiences report engagement 3.4 times that of rep-led formats for the same content and audience, and the segment grows at 14.1% against 7.2%. Commercial organisations resist this because it reduces the representative's role, which is a discussion about internal structure rather than about what physicians want. Rebuilding content for self-guided reading rather than repackaging rep-led decks is what produces the difference. Most providers still repackage rather than rebuild.
Market Impact: Delivers 3.4 times more engagement for each asset

Attack The Thirty One Day Approval Cycle

Median approval runs 31 days through review processes built for print, which undermines a channel sold on responsiveness and leaves campaigns arriving after their moment. Providers supplying modular content assembled from pre-cleared components cut that cycle by 44 to 61%, which is the single largest operational improvement available in this market. It requires manufacturers to restructure how content is authored rather than merely how it is reviewed, which slows adoption considerably. Campaigns currently arrive after the congress or launch moment they were built to support. Nothing else available comes close.
Market Impact: Cuts promotional approval cycles by 44 to 61%

Sell Reach To Physicians Who Refuse Manufacturers

Prescribers declining manufacturer contact engage readily with independent platforms they already use for reference and peer discussion, and rebuilding that audience directly has failed at every spending level attempted. Providers holding genuine physician membership monetise access at 2.8 times the effective rate of manufacturer-owned channels, because the audience cannot be reached any other way. Membership depth rather than technology decides the position, and it takes years to establish credibly. Years of non-commercial usefulness precede any of it, which is why so few parties hold the position. Very few parties hold it.
Market Impact: Monetises at 2.8 times the effective manufacturer rate

Report Honestly On What Engagement Indicates

Clicks, dwell time, and completion rates do not map convincingly onto prescribing, and every commercial team funding this channel knows it while continuing to report them. Providers offering controlled exposure testing across matched physician groups, and stating plainly where engagement predicts nothing, retain accounts 2.3 times longer through effectiveness reviews. The honest position looks weaker in a pitch and considerably stronger when somebody senior eventually asks what the spending achieved. Every commercial team funding this channel already knows the metrics do not predict prescribing. Saying so plainly is the differentiator.
Market Impact: Retains client accounts 2.3 times longer than rivals

Who Controls the Margin Pool

Concentration is moderate. Five providers hold 38% of platform revenue, measured consistently on that basis across all participants, and the field divides between commercial platform vendors serving manufacturers, physician media networks holding audiences, and agencies producing the content that moves through both. Those three groups compete for the same budget while rarely competing on the same terms.
Competition currently turns on three things: physician audience depth, which cannot be bought quickly at any price; approval throughput capability, which decides how much content actually reaches anybody; and honest effectiveness measurement, which matters most when budgets face scrutiny rather than during a pitch. Creative capability is where agencies compete and where manufacturers move work between suppliers most freely, so it decides very little about who holds a durable position here.

Pressure comes from two directions. Physician media networks capture spending that manufacturers previously directed through their own channels. Meanwhile customer relationship platform vendors extend into content delivery from an adjacent position. Rankings will shift toward participants holding physician audiences or approval throughput, since neither is available to a competitor by buying software. Content producers hold the weakest position of anyone.
web-based-e-detailing-market-company-positioning-matrix-1790012128420

Competitive Moat and Risk Dimensions

VEEVA SYSTEMS

Moat: Commercial Platform And Compliance

Detailing content flowing through the same environment that holds approval records, representative activity, and regulatory documentation removes reconciliation work manufacturers would otherwise perform manually across systems. Compliance evidence sitting alongside the content that generated it is what makes the position genuinely difficult to unpick once established.
VEEVA SYSTEMS

Risk: Audience Dependence On Manufacturers

A platform serving manufacturers reaches only the physicians those manufacturers can already contact, which excludes the 51% declining representative access entirely. Growth into that population requires an audience relationship the company does not hold and cannot build quickly against networks physicians already use daily. Physicians already use those daily.
M3

Moat: Physician Membership Depth

Membership covering the substantial majority of practising physicians in its home market gives the company reach manufacturers cannot replicate at any spending level, and that audience arrives for reference and peer content rather than for promotion. Rebuilding an equivalent relationship takes years of non-commercial value delivery first.
M3

Risk: Audience Tolerance For Promotion

The membership exists because the platform is useful professionally, and promotional density is the variable most likely to erode that usefulness if commercial pressure increases. Monetising harder risks the asset itself, which constrains revenue growth in a way manufacturers' own channels never face. The constraint is real and permanent.

Players Tracked

Prominent Players

Veeva Systems
IQVIA
Doximity
M3
Viseven

Other Key Players

Indegene
Aktana
Within3
Sermo
WebMD
Docplexus
OptimizeRx
Doceree
Salesforce
Oracle
EPAM
Cognizant
Publicis Health
Omnicom Health Group
Klick Health

Recent Developments

FEBRUARY 2026

Veeva Systems Releases Modular Approved Content Assembly For Detailing

Veeva Systems released modular content assembly that builds detailing materials from pre-cleared components, addressing approval cycles that had left campaigns arriving weeks after the clinical moment they were designed to address. Components cleared once are reused across markets and indications rather than being reviewed again from the beginning each time.
Signal: Approval throughput rather than creative capability limits what actually reaches a prescriber. Authoring must change too.
SEPTEMBER 2025

IQVIA Acquires Healthcare Professional Media Network For Audience Reach

IQVIA completed an acquisition of a healthcare professional media network, obtaining direct physician audience relationships that manufacturer-operated channels have repeatedly failed to build at any level of spending attempted. The audience arrives for reference and peer content rather than for promotion, which is precisely what makes the relationship valuable.
Signal: Audience relationships are bought because they cannot be constructed quickly through promotional investment. Years of usefulness precede it.
MAY 2025

M3 Signs Self-Guided Detailing Supply Agreement With Pharmaceutical Company

M3 entered a multi-year supply agreement providing self-guided detailing placement across its physician membership, with no acquisition, joint venture, or equity investment involved in the arrangement between the parties. Placement covers self-guided formats rather than scheduled sessions, matching how the platform's members actually consume clinical material.
Signal: Manufacturers are buying access to audiences rather than building channels of their own. Building one has repeatedly failed.

What Digital Detailing Costs

Three input groups dominate cost of revenue. Platform engineering runs 34% to 42%, concentrated in North America, Western Europe, and India. Content production and modular asset development take 26% to 34%, unusually high for software because every market and indication needs cleared variants. Compliance review support and adverse event handling add 18% to 26%, since any promotional interaction can generate a reportable event.
Compliance and content review costs rose through 2024 and 2025 as promotional oversight expectations tightened and manufacturers extended variant coverage across more markets, and several providers described the additional review effort in their annual reports for those years. Food and Drug Administration guidance and European Commission publications set the obligations that content teams track, and country-level interpretation multiplies the work rather than sharing it. Duplication reflects caution as much as genuine difference.

The competitive disadvantage mechanism runs through physician audience rather than product capability. A provider without an audience relationship can only reach prescribers a manufacturer already contacts, which excludes the majority now declining representative access. Exposure varies sharply by provider type: media networks own the scarce asset, while platform vendors and agencies depend on manufacturers whose reach is precisely the problem this channel exists to solve.
web-based-e-detailing-market-cost-volatility-analysis-1790012128616

Author Content Modularly Against Pre-Cleared Components

Approval cycles running 31 days come from reviewing complete assets built for print rather than assembling cleared components, and every market variant repeats that work in full. Modular authoring shortens the cycle substantially and reduces the review burden that compliance teams carry, which is the constraint limiting how much content reaches anybody at all.

Build Adverse Event Capture Into Every Interaction Path

Any promotional interaction with a healthcare professional can surface a reportable event, and retrofitting capture after an interaction design is complete costs far more than including it from the outset. Systematic capture also removes the compliance objection that slows approval of new interaction formats before anybody has evaluated their commercial merit. Retrofitting capture costs considerably more.

Share Content Variants Across Markets Where Rules Permit

Country-level promotional interpretation multiplies variant production across every market a manufacturer serves, and much of that duplication reflects caution rather than genuine regulatory difference. Identifying where variants can legitimately be shared reduces production cost materially and shortens the approval queue that everything else waits behind. Approval queues shorten as a direct consequence of doing this properly.

Portfolio Architecture for Margin Defence

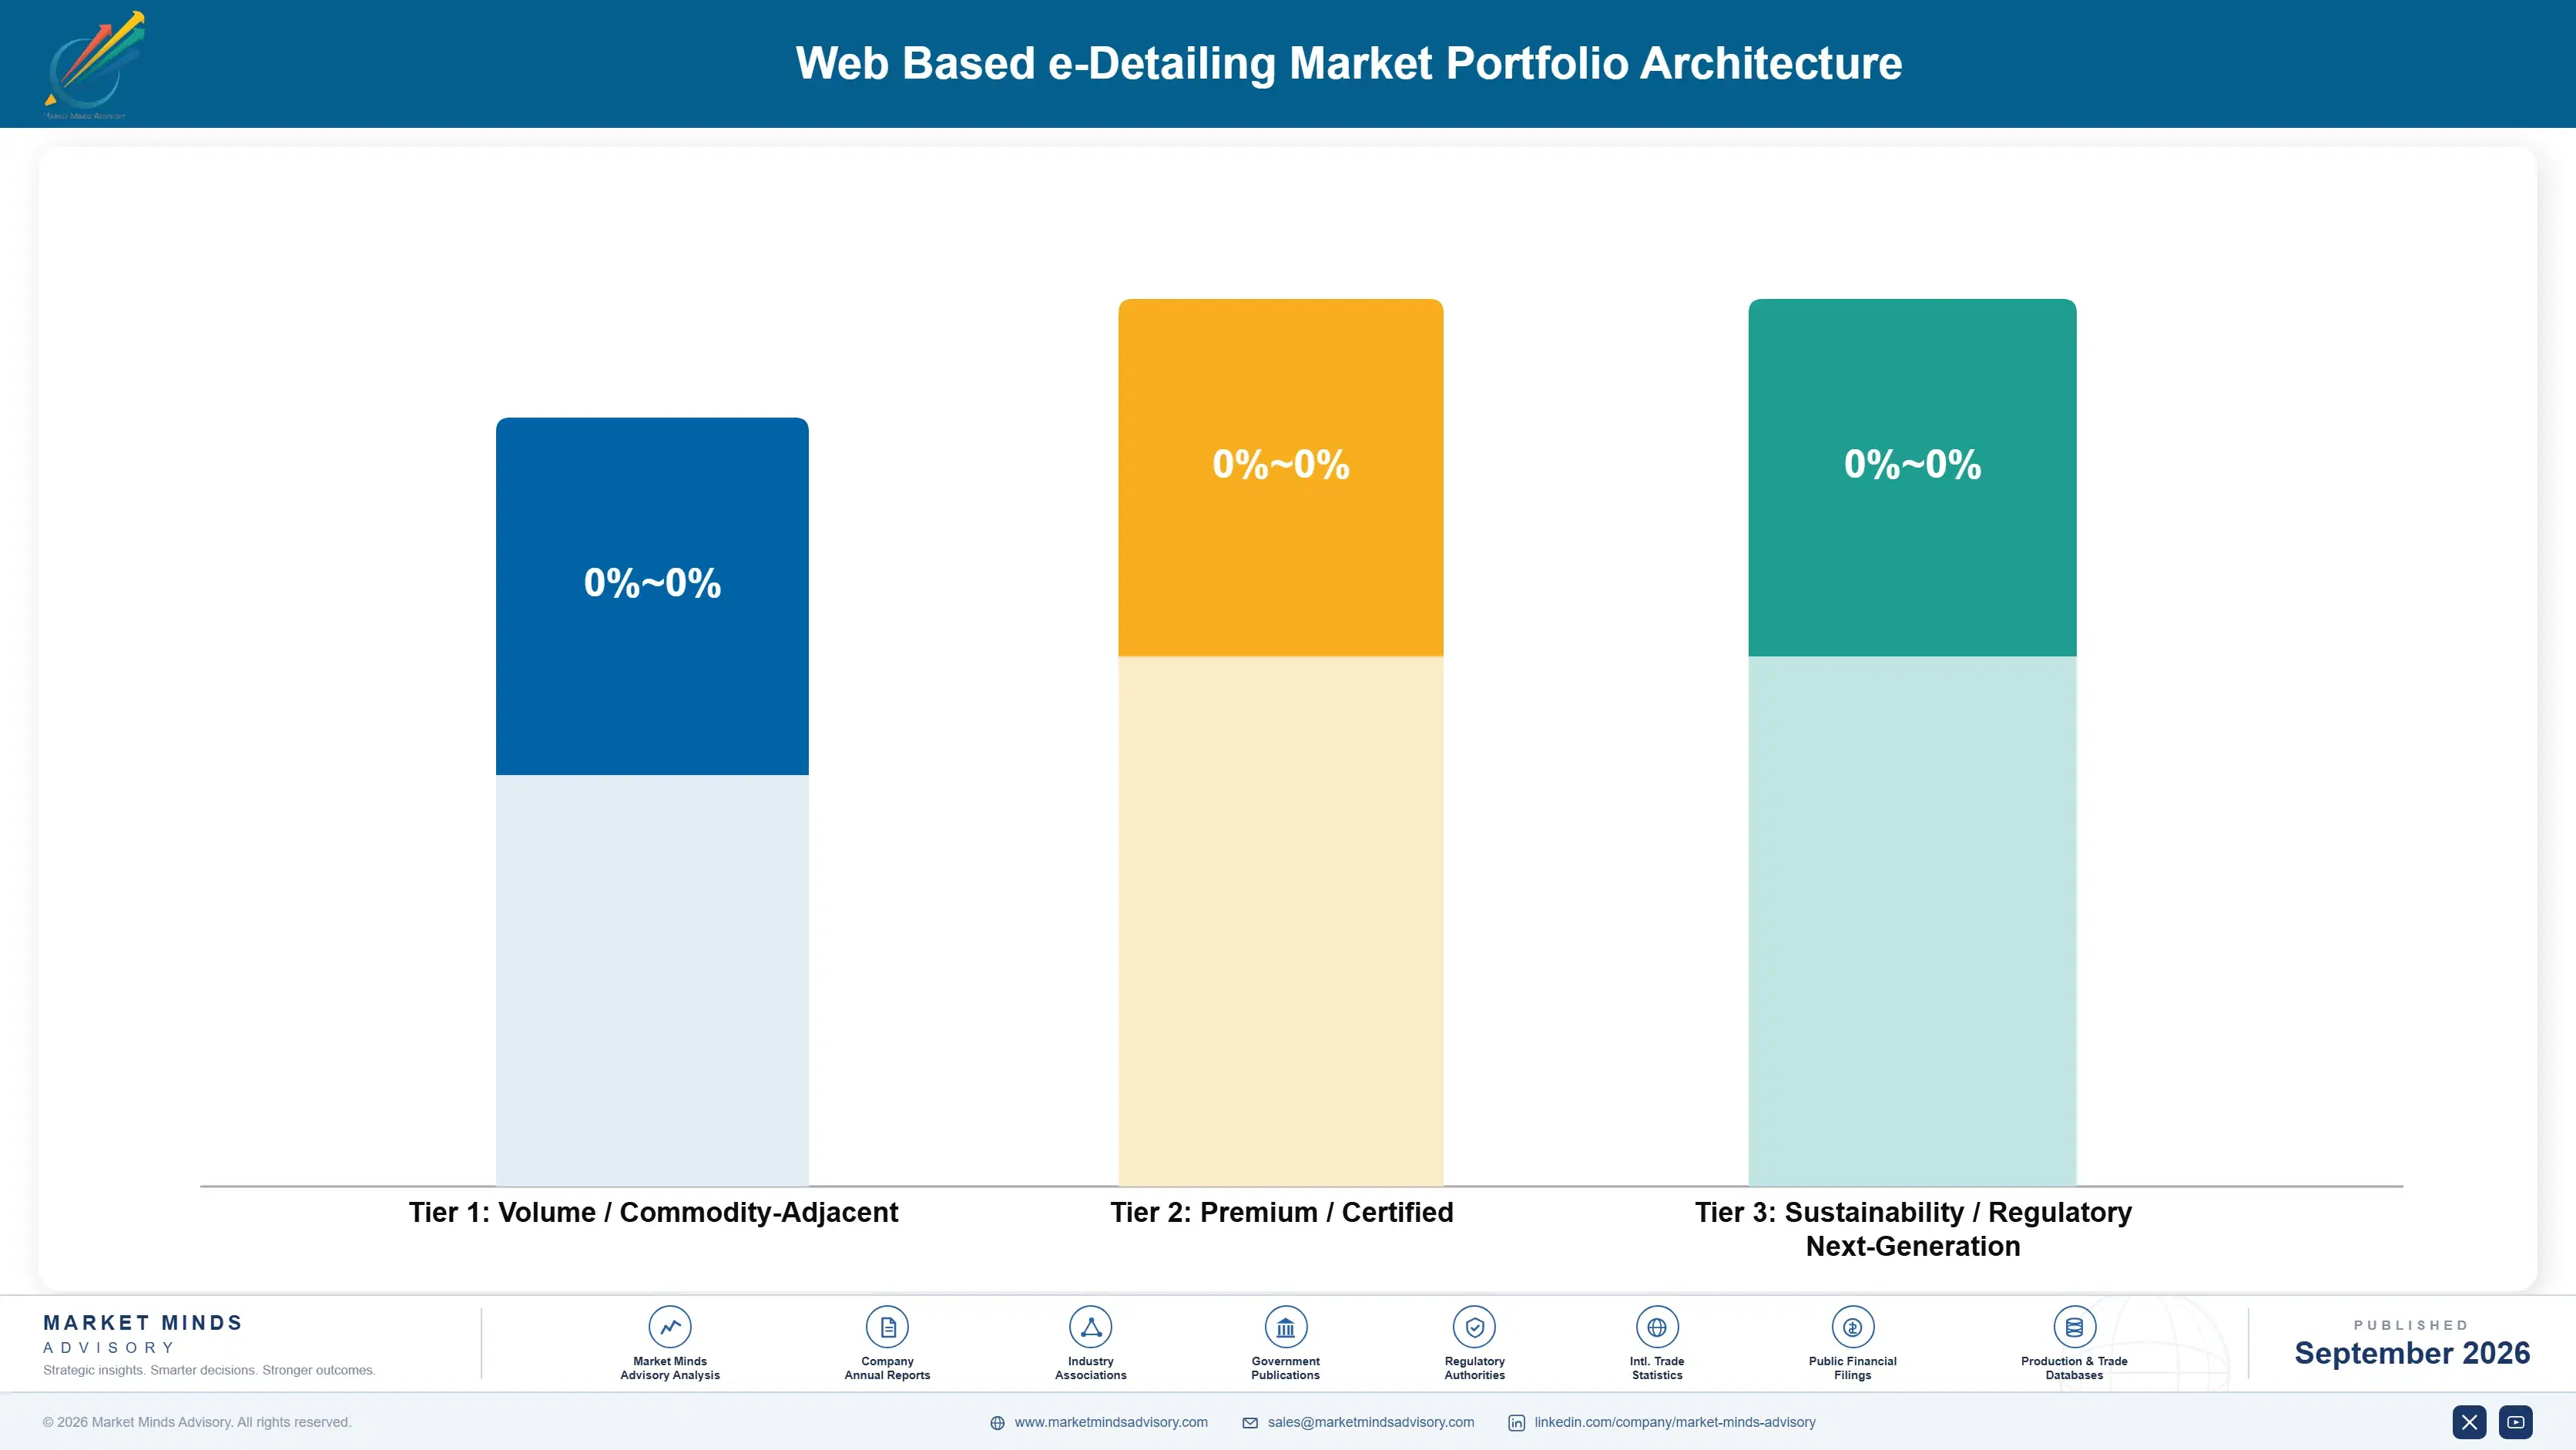
Margin follows who owns the physician relationship. Content production and campaign services are close to commodity, with agencies competing on cost and manufacturers moving work between them freely. Platform delivery earns better, since compliance integration creates real switching friction. Physician media network access earns most, because the audience cannot be replicated by anybody at any spending level. Audience ownership rather than product capability decides this entire hierarchy.
The tension between volume and premium runs through reach. A manufacturer detailing to prescribers it already contacts buys delivery tooling and negotiates on price like any software purchase. A manufacturer trying to reach the 51% who decline representative visits is buying something only a few parties can supply, and it does not negotiate the same way at all. The two buyers behave nothing alike.

High-value pools concentrate where reach is otherwise impossible: specialist prescribers in restricted-access health systems, physicians in markets where in-person promotion has been curtailed by enforcement, and audiences on independent platforms that manufacturers cannot join. Where a field force still has access, digital detailing supplements rather than substitutes, and it is priced as a supplement. Supplements are priced as supplements.

Volume / Commodity-Adjacent

Content production, campaign services, and asset development where agencies compete on cost and manufacturers move work between suppliers freely. The twelve-point range reflects production efficiency and variant reuse rather than any creative difference between the participants.
Gross Margin: 34% to 46%

Premium / Certified

Platform delivery integrated with approval records, representative activity, and compliance evidence, which creates genuine switching friction for manufacturers. The twelve-point range separates providers holding approval workflow integration from those delivering content without it.
Gross Margin: 56% to 68%

Sustainability / Regulatory / Next-Generation

Physician media network access and modular approval throughput, neither of which a competitor obtains by purchasing software. The fourteen-point range reflects audience membership depth, which decides pricing power more than any other variable here.
Gross Margin: 62% to 76%
web-based-e-detailing-market-portfolio-architecture-1790012129118

High-value Sub-segments and Strategic Watch-out

Physician Network Audience Access

Highest value in the category, reaching the prescribers who decline manufacturer contact entirely and cannot be reached any other way. The fourteen-point range reflects membership depth, and monetising harder risks the professional usefulness the audience came for. Only a few parties hold this asset at all.
Gross Margin: 64% to 78%

Self-Guided Detailing Delivery

Fastest growth at 14.1%, matching physician behaviour where 58% of engagement happens outside clinical hours entirely. The twelve-point range separates providers building genuinely self-guided experiences from those repackaging rep-led material without redesigning it. Repackaged rep-led material performs considerably worse here. Rebuilding for reading is the difference.
Gross Margin: 58% to 70%

Modular Approval Throughput

High value attacking the 31 day approval cycle that limits how much content reaches anybody at all. The twelve-point range reflects how deeply each provider integrates with manufacturer review processes rather than merely storing cleared assets. Authoring change rather than review tooling produces the gain.
Gross Margin: 56% to 68%

Campaign Content Production

The strategic watch-out. Agencies compete on cost, manufacturers move work freely between them, and country variant duplication inflates effort without raising price. The twelve-point range reflects production efficiency and nothing commercially defensible. Country variant duplication inflates effort without raising price. Nothing here is commercially defensible.
Gross Margin: 30% to 42%

How This Spending Repeats

Platform subscriptions renew annually while campaign and media spending recurs per brand and per launch, which makes this a mixture of predictable software revenue and volatile promotional budget. Launch cycles dominate the volatility, since a brand entering a competitive market spends multiples of what an established product spends, and that spending stops abruptly when the launch window closes. Launch spending stops abruptly when the window closes, which makes forecasting this half genuinely difficult.
Attachment depth follows compliance integration and audience, not creative quality. A manufacturer whose approval records, representative activity, and content history sit in one environment does not move without reconstructing regulatory evidence it may later need. A manufacturer buying media placement has no attachment at all and reallocates between networks each planning cycle on measured reach.

The buyer has shifted from brand marketing toward commercial operations and compliance. Digital detailing was once bought by brand teams evaluating creative and engagement reporting. Access constraints made it an operational necessity rather than a campaign choice, and approval throughput made it a compliance conversation, so both functions now hold influence brand teams no longer exercise alone. Brand teams no longer decide alone.
web-based-e-detailing-market-end-use-penetration-index-1790012129605

Where This Market Rewards

These are among the four positions where our research anticipates prominent divergence between winners and laggards over the coming forecast period. Each is grounded in the demand model, the regulatory perimeter, and the announced capacity pipeline.
01 / ACCESS REALITY ACCEPTANCE

Half the prescribers already closed the door

Around 51% of physicians decline in-person representative visits under health system policies that hardened after 2020 and were never relaxed, because restricting commercial access proved administratively convenient for everybody managing a clinic. That sets the ceiling on this channel far more than any digital strategy does. Forecasts built on adoption enthusiasm have consistently overshot, and forecasts built on access policy have not, which is why access policy predicts this market better than strategy does, and access policy has proved the better forecasting variable throughout.
02 / PHYSICIAN BEHAVIOUR DESIGN

Build for the reader, not the representative

Around 58% of engagement occurs outside clinical working hours when no representative is available and no scheduled call is possible, which is why self-guided portals grow at 14.1% against 7.2% for rep-led video. Providers building genuinely self-guided experiences report engagement 3.4 times that of rep-led formats on identical content. Commercial organisations resist it because it reduces the representative's role, which is an internal argument rather than a market one, and it will be settled internally rather than by any evidence.
03 / APPROVAL THROUGHPUT ATTACK

Thirty one days is the actual constraint

Median approval runs 31 days through medical, legal, and regulatory review designed for printed materials produced a few times each year. Providers supplying modular content assembled from pre-cleared components cut that by 44 to 61%, the largest operational improvement available anywhere in this market. It requires manufacturers to change how content is authored rather than merely reviewed, which is why adoption has been slower than the benefit warrants, though the gain is larger than almost anything else available, and no other operational change comes close in size.
04 / AUDIENCE ASSET OWNERSHIP

Reach nobody else can sell you

Prescribers declining manufacturer contact engage readily with independent platforms they already use professionally, and rebuilding that audience directly has failed at every spending level attempted so far. Providers holding genuine physician membership monetise access at 2.8 times the effective rate of manufacturer-owned channels. Membership depth rather than technology decides the position, and it takes years of non-commercial usefulness to establish credibly at all, which is why buying one has proved easier than building it, which is why acquiring one has proved easier than building it.

Engagement Snapshot From the Field

A live engagement with an industry participant carrying material or product regulatory and market exposure ahead of a defining policy shift, showing how our research translates into a defensible multi-year portfolio strategy.
MARKET MINDS ADVISORY · CLIENT ENGAGEMENT SUMMARY
Web Based e-Detailing Producer Strategic Portfolio Review and Transition Roadmap 2026·Investment Scenario on Web Based e-Detailing Exposure Evaluation 2025-26
CLIENT PROFILE
A specialty pharmaceutical company promoting four products to roughly 28,000 target prescribers across eleven markets, spending approximately USD 19 million annually on digital detailing platforms, content, and media placement (client-reported, unverified by MMA). Field force coverage had fallen for three consecutive years without a corresponding channel review. Engagement reporting and prescribing data had never been examined together.
STRATEGIC CHALLENGE
Commercial leadership had asked whether digital detailing was working and nobody could answer with evidence. Reported engagement figures rose every quarter while prescribing in the same physician segments stayed flat, and the two datasets had never been examined against one another at any level. The question had been asked twice before.
MMA APPROACH
MMA matched digital engagement records against prescribing data at physician level where regulation permitted, separated target physicians by whether field access existed, and compared self-guided against rep-led formats on identical content. Approval cycle times were measured per market from creation to clearance. Spending was also mapped against whether each target physician retained field access.
KEY FINDINGS
  1. Among physicians with no field access, digital engagement correlated measurably with prescribing change, while among physicians the field force still visited it showed no relationship at all.
  2. Self-guided content generated 3.1 times the completed engagements of rep-led video sessions on identical material, and 61% of that engagement occurred outside clinical hours.
  3. Median approval time was 37 days, and in two markets campaign assets cleared after the clinical congress they had been created to support had already finished.
  4. Around 44% of digital spending targeted physicians the field force was already visiting, duplicating contact rather than extending reach into the restricted population.
CLIENT PROFILE
A specialty pharmaceutical company promoting four products to roughly 28,000 target prescribers across eleven markets, spending approximately USD 19 million annually on digital detailing platforms, content, and media placement (client-reported, unverified by MMA). Field force coverage had fallen for three consecutive years without a corresponding channel review. Engagement reporting and prescribing data had never been examined together.
STRATEGIC CHALLENGE
Commercial leadership had asked whether digital detailing was working and nobody could answer with evidence. Reported engagement figures rose every quarter while prescribing in the same physician segments stayed flat, and the two datasets had never been examined against one another at any level. The question had been asked twice before.
MMA APPROACH
MMA matched digital engagement records against prescribing data at physician level where regulation permitted, separated target physicians by whether field access existed, and compared self-guided against rep-led formats on identical content. Approval cycle times were measured per market from creation to clearance. Spending was also mapped against whether each target physician retained field access.
KEY FINDINGS
  1. Among physicians with no field access, digital engagement correlated measurably with prescribing change, while among physicians the field force still visited it showed no relationship at all.
  2. Self-guided content generated 3.1 times the completed engagements of rep-led video sessions on identical material, and 61% of that engagement occurred outside clinical hours.
  3. Median approval time was 37 days, and in two markets campaign assets cleared after the clinical congress they had been created to support had already finished.
  4. Around 44% of digital spending targeted physicians the field force was already visiting, duplicating contact rather than extending reach into the restricted population.
RECOMMENDED STRATEGY
Phase 1: Phase one: redirect digital spending toward physicians with no field access, where the evidence shows an effect, and stop duplicating contact with visited prescribers. Phase 2: Phase two: rebuild content for self-guided consumption rather than repackaging rep-led decks, since the formats perform very differently on identical material. Phase 3: Phase three: adopt modular authoring against pre-cleared components so assets clear before the congress or launch moment they were built for.
OUTCOME
Digital spending fell 17% while engagement among restricted-access physicians rose 54% (client-reported, unverified by MMA). Median approval time dropped from 37 days to 16. Prescribing in the restricted-access segment moved measurably for the first time in three years. Duplicated contact with visited prescribers ended entirely.

Frequently Asked Questions

Foundational context covering the market sizes, CAGR, scope, country, region and competition that inform every finding below. This section is provided to cover basics and most often pre-purchase conversations, answered from the MMA Primary Research Dataset.

What is the current size of the Web Based e-Detailing Market?

The market was worth USD 2.4 billion in 2025 and reaches USD 2.6 billion in 2026. Value covers digital detailing platforms, content, and media placement to healthcare professionals.

How large will the Web Based e-Detailing Market be by 2036?

MMA forecasts USD 6.4 billion by 2036, an increase of USD 3.8 billion across the forecast period. That represents 2.46 times the 2026 base of USD 2.6 billion.

What is the CAGR for the Web Based e-Detailing Market 2026 to 2036?

The base case compound annual growth rate is 9.4%, with a bull case at 10.6% and a bear case at 8.2%. Historical growth from 2020 to 2025 ran at 8.0%.

Which segment is growing fastest?

Self-guided unassisted detailing portals grow at 14.1%, half again the market rate of 9.4%. Around 58% of physician engagement now happens outside clinical working hours.

Who are the major companies in the Web Based e-Detailing Market?

Veeva Systems, IQVIA, Doximity, M3, and Viseven lead, together holding 38% of platform revenue. Platform vendors, media networks, and agencies compete for the same budgets.

Which country is growing fastest?

China grows at 14.8%, driven by enforcement that sharply reduced in-person promotion alongside physician platform reach that Western equivalents have never come close to matching.

Report Segmentation Architecture

The full report scope spans multiple orthogonal segmentation dimensions, with cross-tabulated demand data provided for each dimension pair. Coverage extends further to regional breakdowns, trend trajectories, and the competitive detail needed to support segment-level decision-making.

By Detailing Delivery Format

  • Rep-Led Remote Video Detailing
  • Self-Guided Unassisted Detailing Portals
  • Third-Party HCP Media Detailing Networks
  • Web-Based Educational Detailing Modules
  • Digital Sample and Prescribing Support Requests
  • Messaging and Asynchronous Detailing Channels

By End-Use Industry

  • Large Pharmaceutical Manufacturers
  • Specialty and Rare Disease Companies
  • Generic and Biosimilar Manufacturers
  • Medical Device and Diagnostics
  • Animal Health Manufacturers
  • Consumer Health and Vaccines

By Commercial Dimension

  • Enterprise Platform Subscription
  • Media Network Placement
  • Agency Content Production
  • Per Interaction Pricing
  • Regional Affiliate Deployment
  • Launch Campaign Programme

By Region

  • East Asia
  • North America
  • Western Europe
  • South Asia and Pacific
  • Latin America
  • Middle East and Africa
  • Eastern Europe

Scope, Methodology, and Coverage

Every figure in this report is reproducible from documented input assumptions. The scope below maps the historical period, the forecast horizon, the segmentation dimensions, and the countries covered, alongside the underlying primary and qualitative methodology.
Historical Period
2020 to 2025
Forecast Period
2026 to 2036
Base Year
2025 (USD billions; MMA Primary Research Dataset, September 2026)
Market Definition
This market covers digital promotion of pharmaceutical products to healthcare professionals delivered over the web, including rep-led remote video detailing, self-guided unassisted detailing portals, third-party healthcare professional media detailing networks, web-based educational detailing modules, digital sample and prescribing support requests, and messaging and asynchronous detailing channels. It excludes in-person field detailing, medical science liaison activity, patient-facing advertising, trial recruitment, and customer relationship management platforms.
Quantitative Units
USD billions, platform, content, and media placement revenue
Segmentation Dimensions
Detailing delivery format, end-use industry, commercial dimension, region
Regions Covered
East Asia, North America, Western Europe, South Asia and Pacific, Latin America, Middle East and Africa, Eastern Europe
Countries Covered
Japan, China, South Korea, Taiwan, United States, Canada, Mexico, Germany, France, United Kingdom, Italy, Spain, Switzerland, Netherlands, Belgium, India, Australia, Indonesia, Thailand, Singapore, Brazil, Mexico, Argentina, Colombia, Saudi Arabia, United Arab Emirates, Egypt, South Africa, Poland, Russia
Key Companies Profiled
Veeva Systems, IQVIA, Doximity, M3, Viseven, Indegene, Aktana, Within3, Sermo, WebMD, Docplexus, OptimizeRx, Doceree, Salesforce, Oracle, EPAM, Cognizant, Publicis Health, Omnicom Health Group, Klick Health
Quantitative Methodology
Primary survey, n=3,800 respondents, Q4 2025, six countries; demand-side model with trade association cross-validation
Qualitative Methodology
47 expert interviews, Q4 2025; applied to validate demand model assumptions, identify emerging dynamics, and assess competitive positioning
Report Format
PDF and XLSX data workbook (Word format preview document)
Publisher
Market Minds Advisory
Report Code
MMA-2026-HLT-861
Published
September 2026
Contact
sales@marketmindsadvisory.com | www.marketmindsadvisory.com

Purchase the full Web Based e-Detailing Market Report (2026 to 2036).

The full report sizes the web based e-detailing market across six delivery formats, seven regions, and thirty countries, with forecasts to 2036 under base, bull, and bear cases. It examines why prescriber access policy rather than digital strategy sets the channel ceiling, how self-guided formats outperform the ones commercial organisations preferred, and what a thirty one day approval cycle does to a channel sold on responsiveness. Competitive analysis covers twenty participants evaluated consistently on platform and media revenue, with detailed treatment of physician audience depth and approval throughput. Cost structure, margin architecture, and regional access drivers are analysed throughout. Primary research includes 3,800 survey responses and 47 expert interviews.
Six delivery formats sized and forecast separately
Twenty participants evaluated on platform and media revenue
Regional prescriber access restriction mapped across seven geographies
Margin architecture by format and audience ownership
Engagement timing and format performance benchmarked across physician segments
Approval cycle analysis measured by market and content structure

Built For The People Who Decide

From boardroom strategy to bench-side execution, this report is read cover-to-cover by leaders shaping the next decade of their industry, turning demand scenarios, market dynamics and valuation benchmarks into decisions.
CXOs/ Presidents/ VPs/ Managers
M&A and Corporate Development
Strategy Teams and R&D Heads
Procurement and Product Directors
Regulatory and Compliance Leaders
Investor Relations and Equity Analysts