Market Minds Advisory
Web 3.0 Blockchain Market

Web 3.0 Blockchain Market: Web 3.0 Blockchain Market: Network Infrastructure, Custody and Tokenized Asset Platforms, 2026 to 2036

Most revenue here comes from making blockchains usable rather than from applications that needed one. The fastest growing segment requires a licensed custodian and a named issuer, which is exactly the intermediary structure being removed.

Lead Analyst

Published

September 2026

Make Smarter Decisions with Customized Research Insights

Request a free sample report and evaluate market opportunities, growth trends, and competitive dynamics relevant to your business needs.

2025 MARKET VALUE$3.1BMarket Size 2025
2036 FORECAST VALUE$17.0BBase Case , 2026 to 2036
CAGR 2026 TO 203616.8 %Bull 18.1% / Bear 15.5%
INCREMENTAL OPPORTUNITY$13.4BNet 10- year value creation
EXPANSION MULTIPLE4.72x2036 value over 2026 base
Strategic Levers
M&A Pipeline
Regional Outlook
Country Rankings
Competitive Intelligence
Segmental Deep-dive
Call-Us : 91 93563 13602

Executive Snapshot and Market Trajectory.

About 64% of revenue in this category comes from infrastructure that makes networks usable rather than from applications that required a blockchain to exist. Node providers, indexers, wallets, and custodians earn reliably. The applications they support mostly do not, and that gap keeps widening. Tools have proved the better business.
Tokenized real world asset platforms grow at 25.2%, half again the market rate of 16.8%, and they are the least decentralised part of the market by a considerable distance. A tokenized fund needs a regulated custodian, a legal wrapper, and a named issuer, which reintroduces every intermediary the technology was supposed to remove. Roughly USD 34 billion of assets now sit in these structures. Institutions require every one of them.
Revenue is following regulatory clarity rather than developer enthusiasm. Around 41% is now earned by licensed entities, and the Emirates grows at 24.6% on a licensing regime built deliberately to attract them. Concentration is very low at 28%, and protocol survival is worse than the funding activity suggests, with a median network reaching 31 months before development stops. Protocol breadth is the only defence available.
Market Definition
This market covers infrastructure, platforms, and services enabling decentralised network applications, including protocol and network infrastructure, node, indexing and developer infrastructure services, tokenized real world asset platforms, wallets, custody and key management, decentralised storage and compute, and decentralised identity and credentials. It excludes cryptocurrency trading and exchange revenue, mining and validation rewards, enterprise permissioned ledger deployments sold as conventional software, and payment card tokenization.
Base Year Value
$3.1B in 2025 (MMA Primary Research Dataset, September 2026)
Forecast Period
2026 to 2036, eleven discrete annual values
CAGR
16.8% base case. Bull 18.1%. Bear 15.5%.
Fastest Growth Segment
Tokenized Real World Asset Platforms: 25.2% CAGR
Fastest Growth Country
United Arab Emirates: 24.6% CAGR
Fastest Growth Region
South Asia and Pacific: 18.7% CAGR
Largest Region
North America: 27% of 2025 global value
Market Leaders
Consensys, Coinbase, Fireblocks, Alchemy, and Chainlink Labs lead the field. Source: MMA Primary Research Dataset, July 2026.
Primary Survey
n=3,800 procurement and R&D decision-makers, Q4 2025, six countries
Methodology
Demand-side build-up, cross-validated against public data, 47 expert interviews

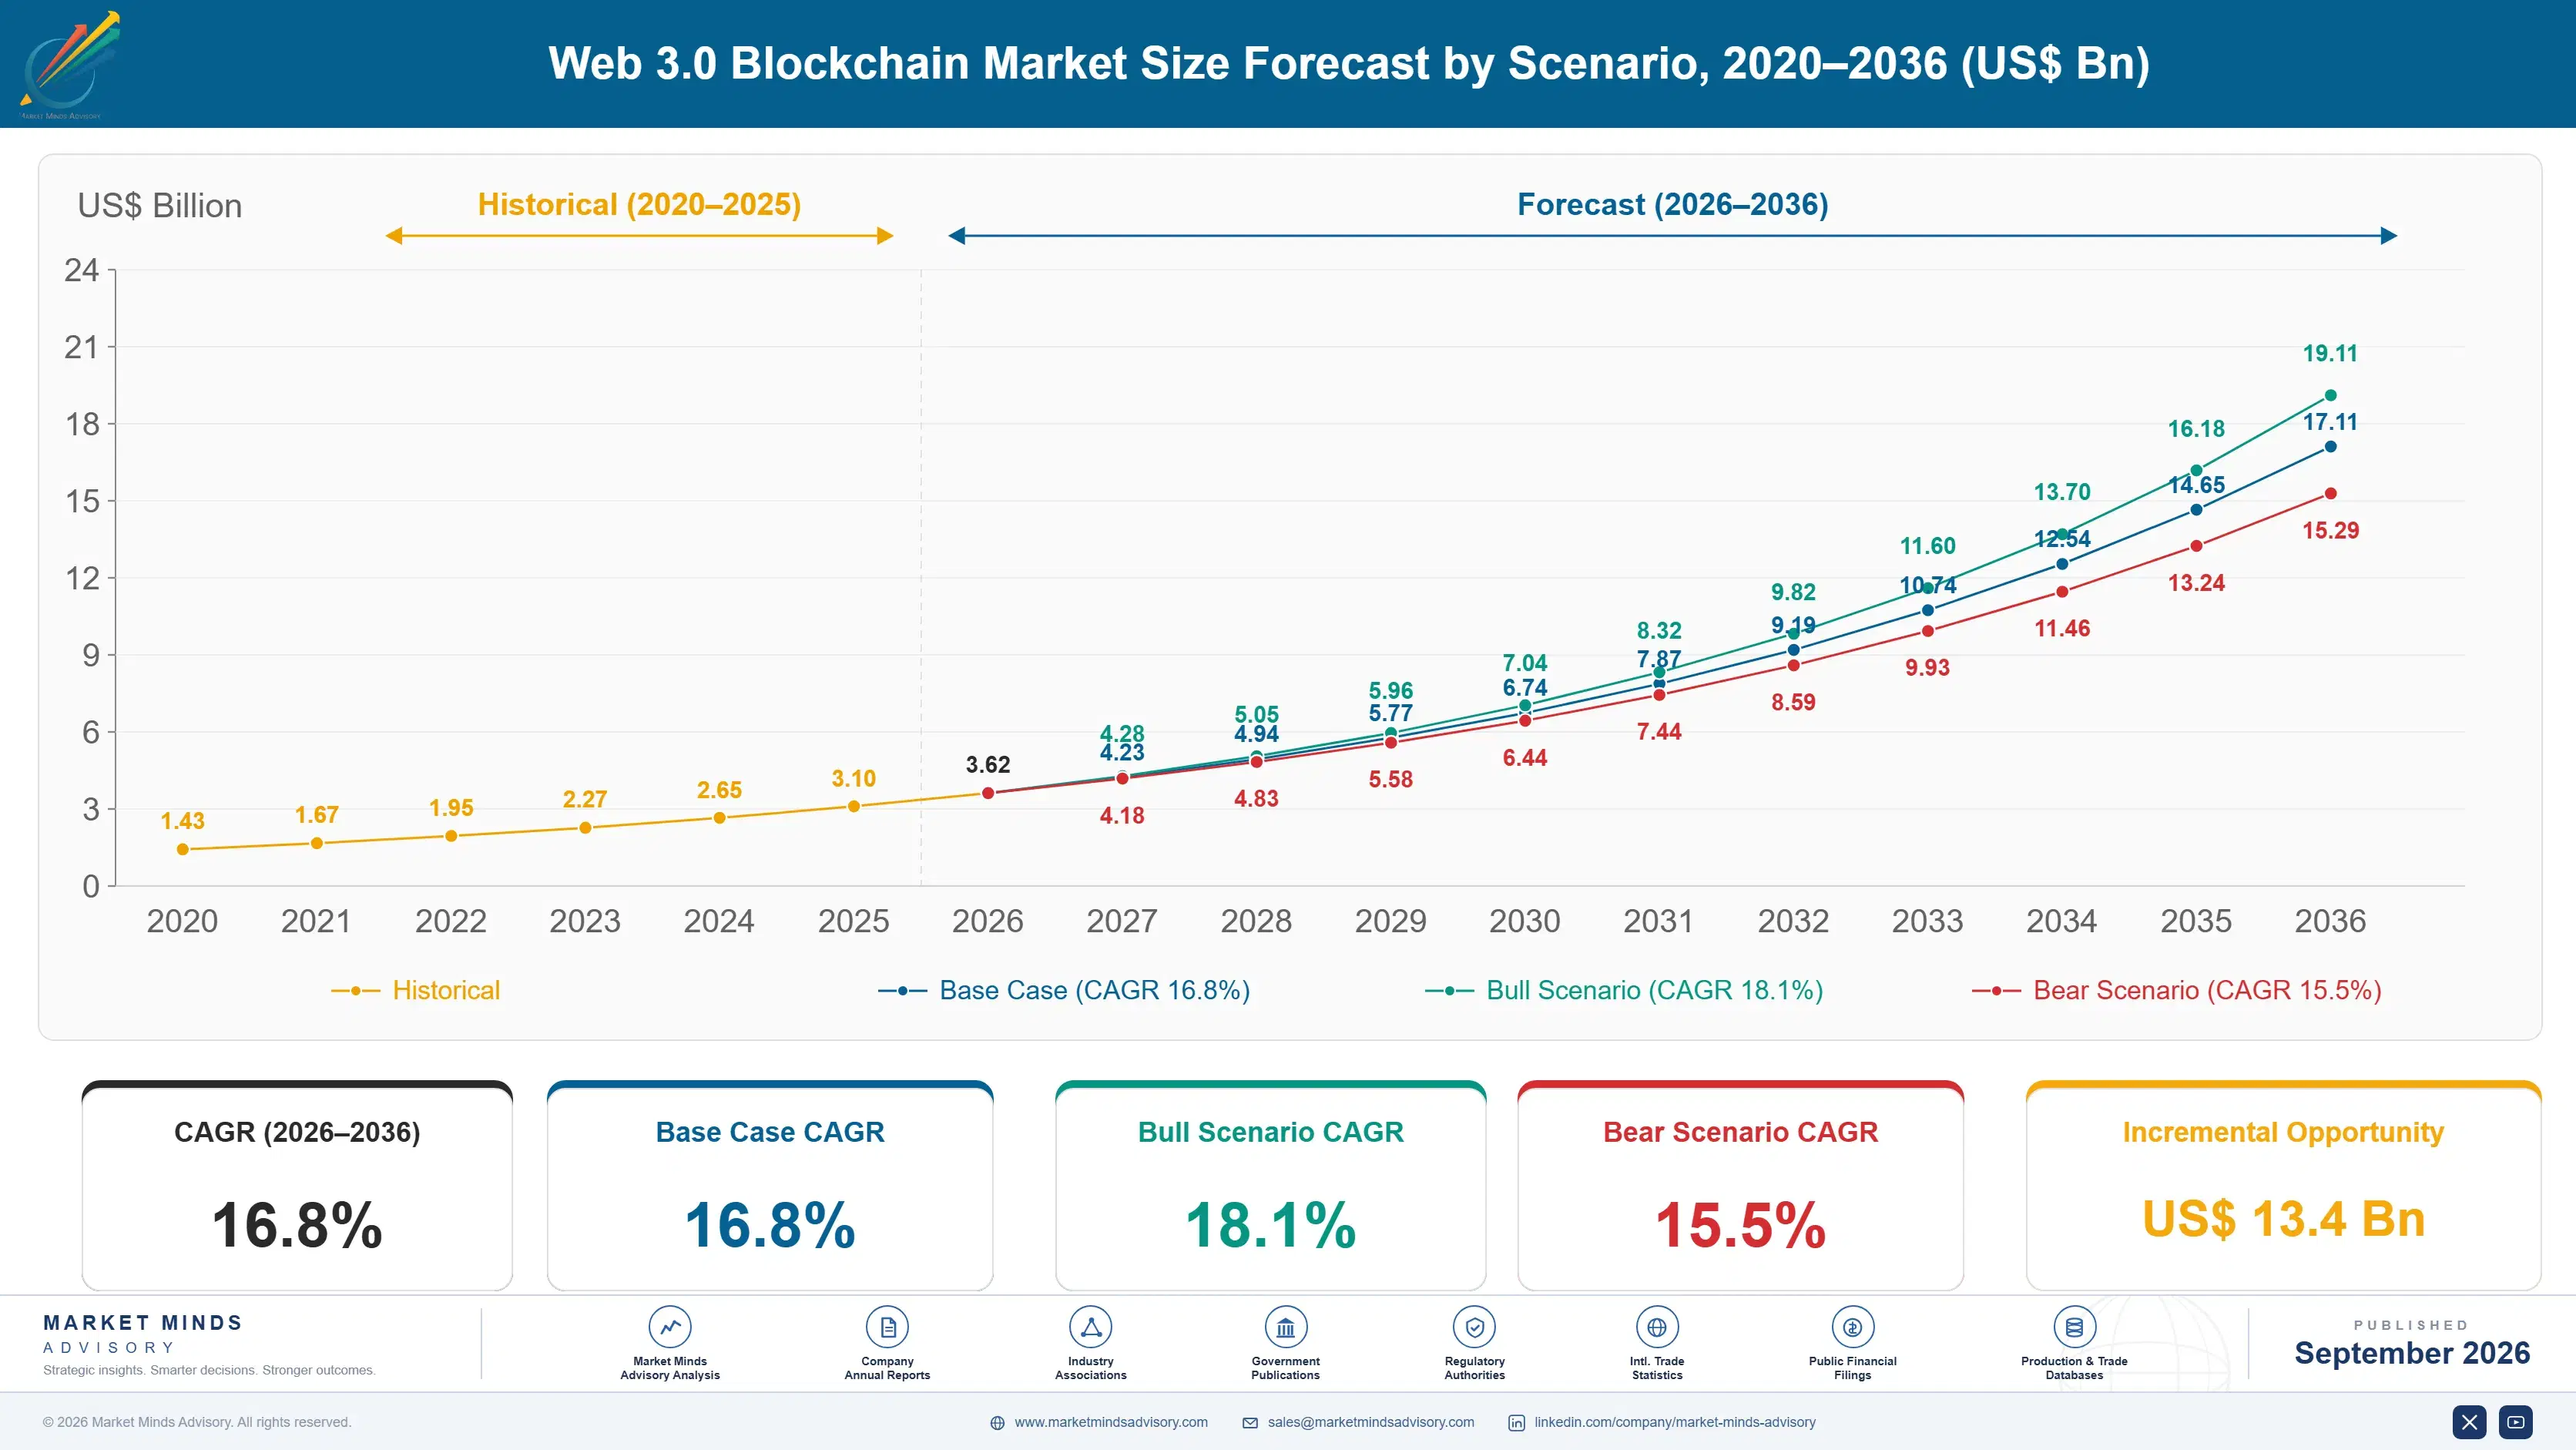
Web 3.0 Blockchain Market Forecast Scenarios

web-3-0-blockchain-market-size-forecast-scenario-1790008006666
Growth between 2020 and 2025 was violent in both directions and the compound figure flatters it considerably. Speculative activity funded an enormous amount of protocol development, most of which stopped when funding did, while infrastructure providers serving whoever remained kept earning throughout. Historical growth of 15.4% describes a market where the businesses that survived were mostly the ones selling tools rather than the ones building applications.
The base case at 16.8% rests on three mechanisms. Regulatory frameworks in the Emirates, Singapore, Hong Kong, and across the European Union have created jurisdictions where regulated institutions can participate without legal ambiguity. Tokenized funds and money market instruments give institutional balance sheets a reason to hold assets on these networks. And custody infrastructure has matured enough that insurers will write cover, which was the practical barrier for most institutional participants.
The bull case at 18.1% depends on tokenized settlement being adopted for a mainstream instrument class at scale, which would move institutional volume rather than institutional experimentation. The bear case at 15.5% is a custody or bridge failure at an institution large enough to reverse regulatory confidence, which has happened before and set the category back several years each time it did.

Selling Shovels, Not Finding Gold

The commercial pattern here is old and well understood. Some 64% of revenue comes from infrastructure that makes networks usable: nodes, indexing, developer tooling, wallets, and custody. Those businesses earn whether or not any particular application succeeds, and most applications have not. Developer retention at 18% after two years describes the attrition underneath. Selling tools works; building applications mostly has not.
TOP FIVE CONCENTRATION28%Share of revenue held by the leading infrastructure providers
INFRASTRUCTURE REVENUE SHARE64%Category revenue from making networks usable rather than applications
TOKENIZED ASSET VALUEUSD 34 billionReal world assets held in regulated token structures
LICENSED ENTITY SHARE41%Revenue earned by entities holding a formal regulatory licence
DEVELOPER RETENTION18%Protocol developers still active after twenty four months
MEDIAN PROTOCOL LIFESPAN31 monthsPeriod before a network stops meaningful development activity
Protocol survival is worse than funding activity ever suggested. A median network reaches 31 months before meaningful development stops, which means infrastructure providers serve a customer base that continually turns over while the aggregate keeps growing. That is a workable business and a poor one to build a single-protocol dependency on, which several providers learned expensively. Several providers learned that dependency expensively.
The fastest growing part is also the least decentralised. Tokenized real world assets require a regulated custodian holding the underlying, a legal structure making the token enforceable, and an identified issuer accountable for both. Around USD 34 billion sits in these arrangements. Everything the original architecture existed to remove has been carefully put back, and institutions will not participate otherwise. Institutions will not participate on any other terms.
"The honest summary is that this industry has found a genuine business selling infrastructure, and is still looking for the applications that justify it. Tokenized assets are working precisely because they abandoned decentralisation. That is not a criticism, and nobody in the sector enjoys hearing it put that way."
Practice Director, Digital Assets and Distributed Infrastructure · MMA Technology Practice · September 2026

Market Trends

Tokenized Assets Reintroduce Every Intermediary Removed

A tokenized money market fund needs a regulated custodian holding the underlying instruments, a legal structure making the token a claim somebody must honour, an identified issuer accountable for both, and a transfer agent maintaining the register. Institutions will not participate without all four. Tokenized platforms grow at 25.2% precisely because they accepted this, and roughly USD 34 billion now sits in such structures. The technology contributes settlement speed and programmability rather than disintermediation, which is a smaller claim and a considerably more saleable one. It is a smaller claim and a much easier sale.
Market Impact: Segment grows at 22.1%
Licensing Regimes Concentrate Regulated Activity Geographically

The Emirates, Singapore, Hong Kong, and the European Union built frameworks defining what regulated participants may do, and businesses seeking institutional customers moved to where that certainty exists. Around 41% of category revenue is now earned by licensed entities, up sharply across three years. Emirates growth of 24.6% leads every country covered. The concentration is deliberate policy rather than accident, and it has produced a geographic distribution of activity that bears very little relationship to where developers or users are located. Activity distribution now bears little relationship to where developers or users are located.
Market Impact: Accounts for 64% of revenue

Market Opportunities and Growth Drivers

Custody Insurance Removed The Institutional Participation Barrier

Institutions could not hold these assets while nobody would insure the custody arrangement, and that was the practical obstacle rather than any view about the technology itself. Custody providers with qualified structures, segregated key management, and audited controls can now obtain cover, which converted an impossible conversation into a procurement one. Wallets, custody, and key management grow at 22.1% as a direct result. Insurers rather than regulators turned out to be the gatekeepers that mattered most for institutional adoption. Nobody holds an asset they cannot insure, whatever the regulator permits.
Market Impact: Median protocol lasts 31 months

Infrastructure Providers Earn Regardless Of Application Success

Node access, indexing, and developer tooling are consumed by every application on a network whether that application finds users or not, which makes those businesses considerably more durable than anything built on top of them. Infrastructure accounts for 64% of category revenue. The exposure is to protocol survival rather than to application success, and with a median network lasting 31 months providers serving several protocols hold a far safer position than those tied to any single one. Breadth rather than depth is what protects the position. Several learned that expensively.
Market Impact: Affects 41% licensed revenue

Market Restraints and Challenges

Protocol Turnover Continually Resets The Customer Base

A median network reaches 31 months before meaningful development stops, and developer retention runs at 18% after two years, which means infrastructure providers serve customers who keep disappearing. The root cause is that most protocols were funded on speculative expectation rather than on any application demand. Commercially this makes revenue concentration on any single network dangerous, as several providers discovered when a chain they had built around went quiet. Participants respond by supporting many networks, by pricing on aggregate usage, and by moving toward regulated customers who persist. Regulated customers persist far longer.
Market Impact: Holds USD 34 billion in assets

Custody Failure Risk Threatens Regulatory Confidence Directly

A significant custody or bridge failure at an institutional participant reverses regulatory confidence across every jurisdiction watching, and this has happened repeatedly, setting the category back years each time. The root cause is that key management failure is absolute rather than recoverable. Commercially it means every provider carries reputational exposure to competitors' mistakes. Participants respond through qualified custody structures, insurance cover that signals third-party diligence, independent control audits, and by supporting supervisory frameworks that raise minimum standards across the field. Every provider carries reputational exposure to a competitor's failure, which is an uncomfortable position nobody can hedge.
Market Impact: Covers 41% of category revenue
3 additional market trends, 4 additional growth drivers, and 2 additional restraints and challenges are covered in the full report. Contact sales@marketmindsadvisory.com to access the complete intelligence.

Segment CAGR and Growth Architecture

Segmentation follows the layer being sold. Six categories cover the market: protocol and network infrastructure, node, indexing and developer infrastructure services, tokenized real world asset platforms, wallets, custody and key management, decentralised storage and compute, and decentralised identity and credentials. Infrastructure layers earn most while application layers grow unevenly. Custody and tokenization now carry most of the institutional revenue.
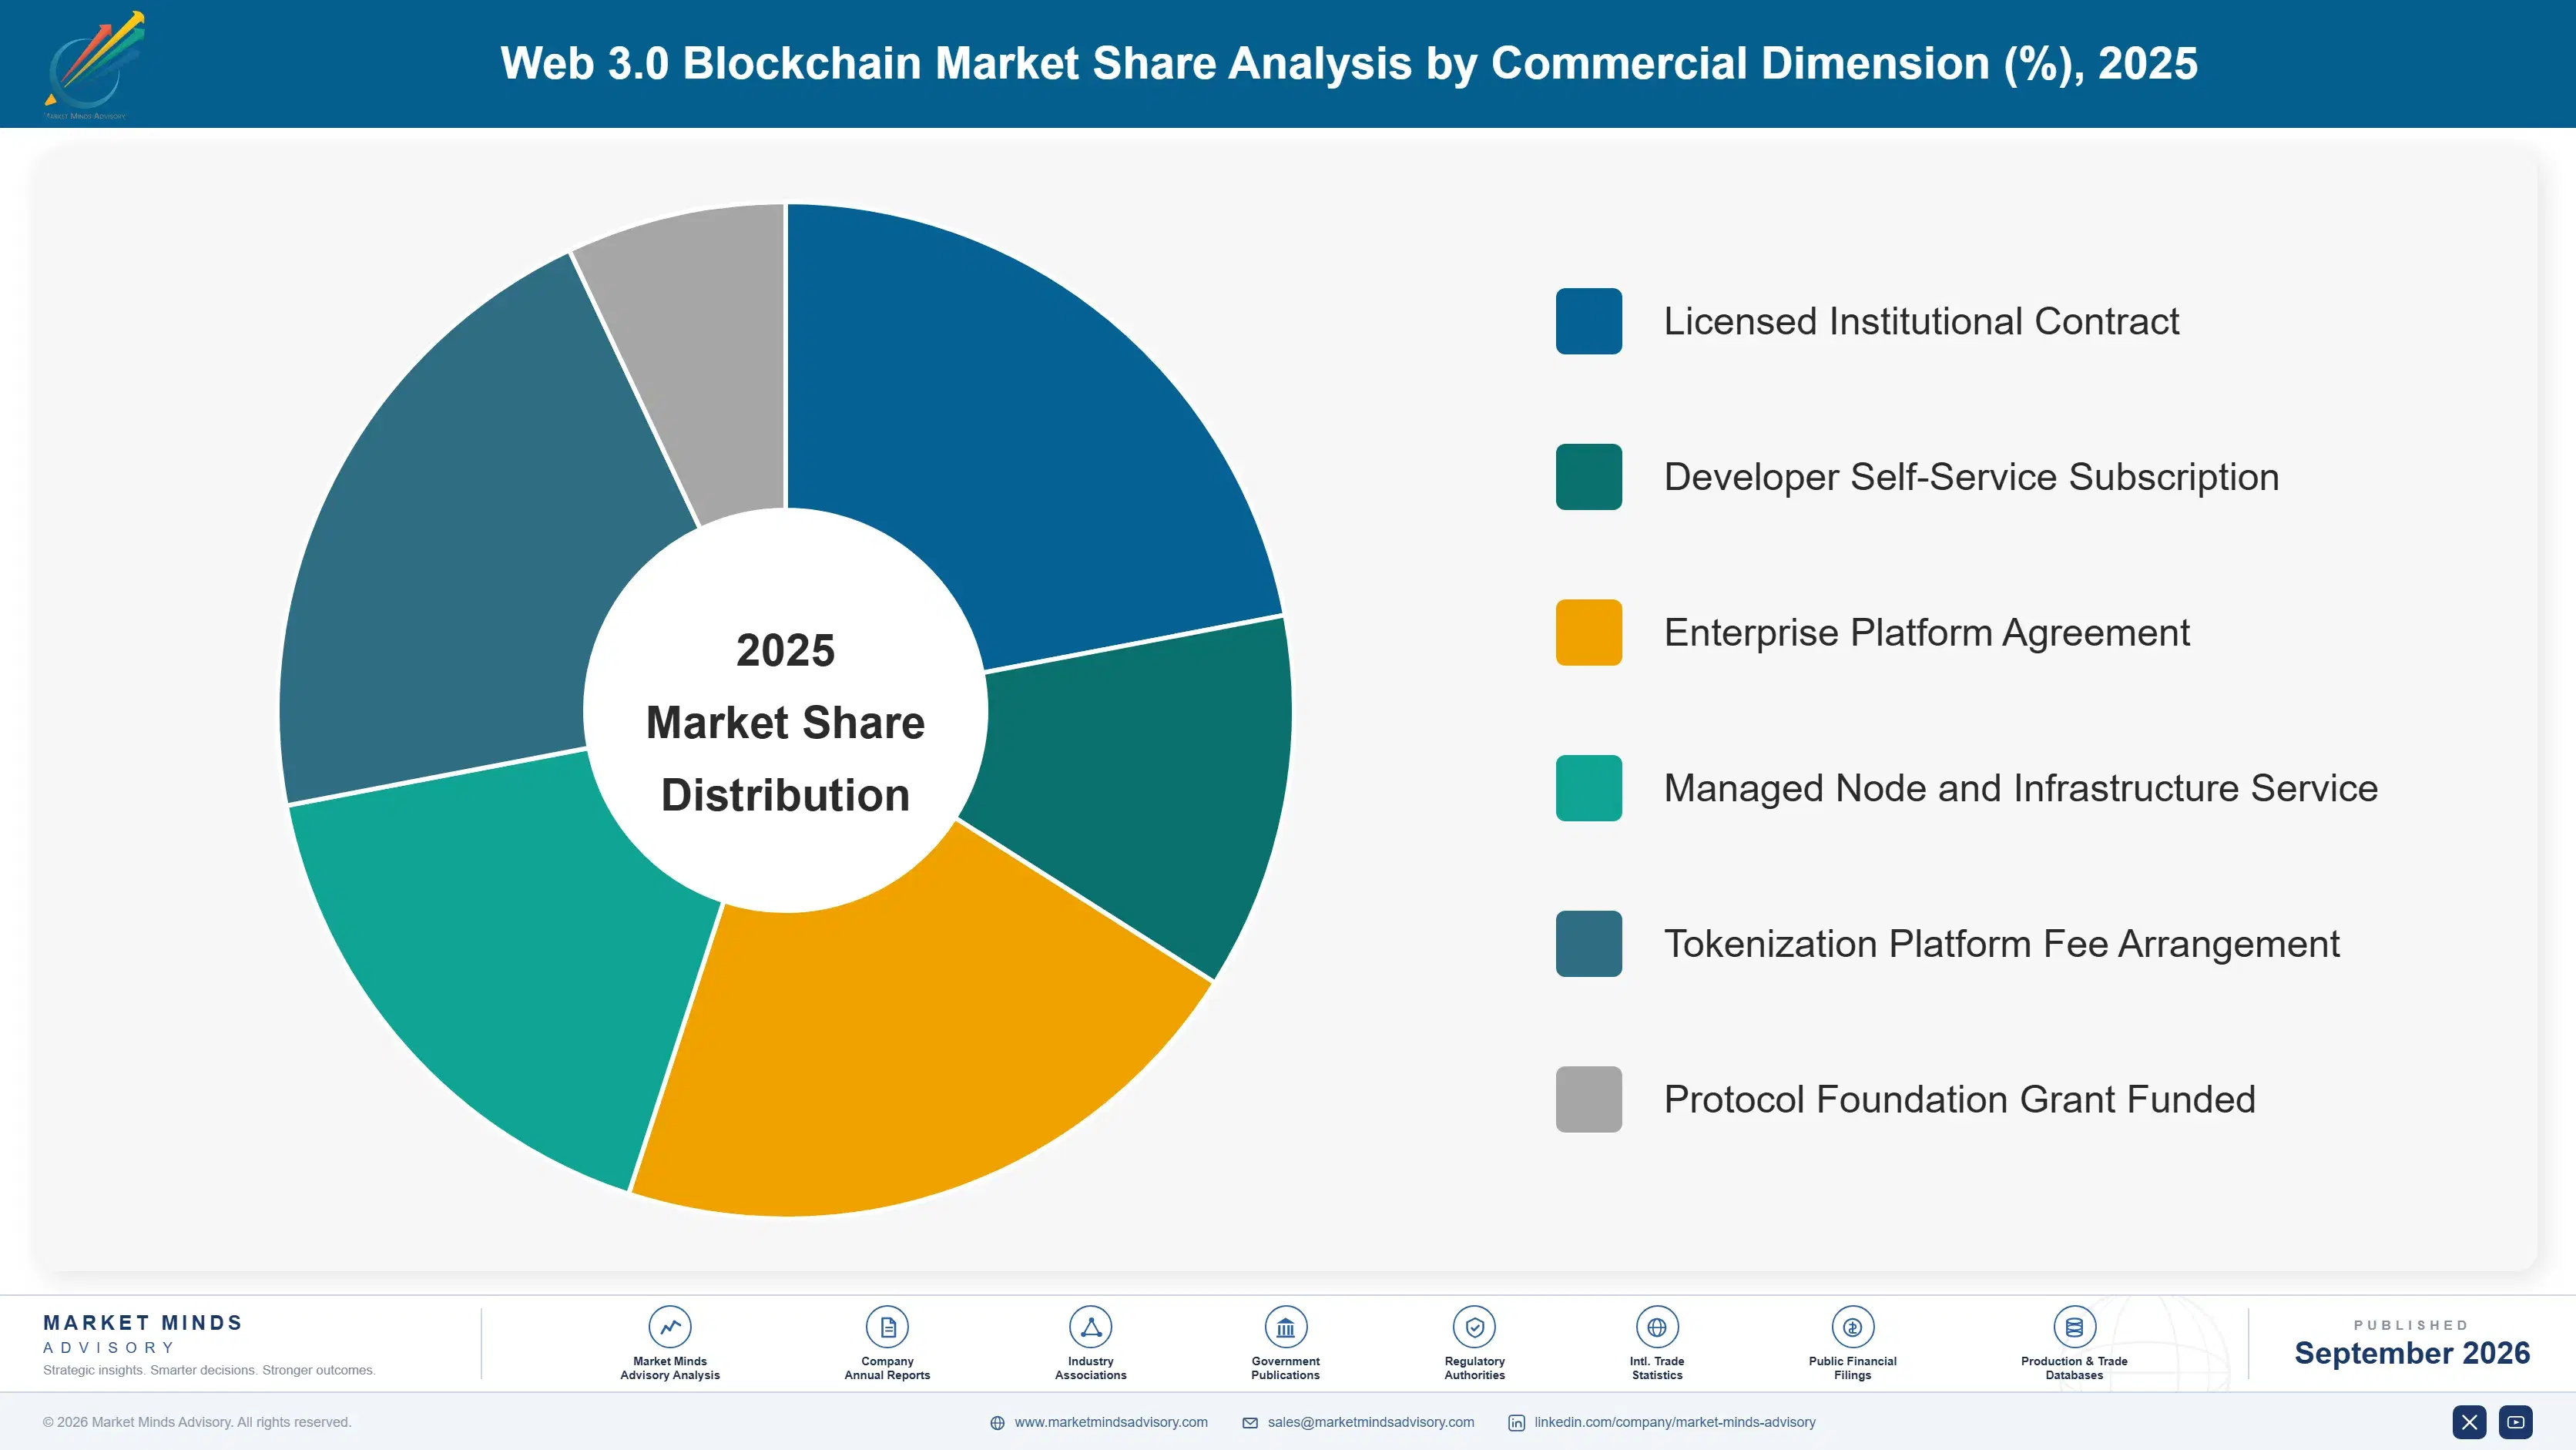
web-3-0-blockchain-market-market-share-analysis-1790008007247

Tokenized Real World Asset Platforms

Tokenized assets grow at 25.2%, half again the market rate of 16.8%, and they work because they gave up on decentralisation entirely. A tokenized fund requires a regulated custodian holding the underlying, a legal structure making the token enforceable, a named issuer, and a transfer agent, and institutions will not participate without every one of them. Roughly USD 34 billion sits in these arrangements. What the technology actually contributes is settlement speed, programmable distribution, and fractional access, which is a far narrower claim than the original architecture made and considerably easier to sell to a regulated buyer. Regulated buyers find that narrower claim persuasive. Nobody in the sector enjoys saying so.
CAGR 25.2%

Wallets Custody And Key Management

Custody grows at 22.1% because insurers changed their position, not because institutions changed their minds. Nobody could hold these assets while the custody arrangement was uninsurable, and providers with qualified structures, segregated key management, and audited controls can now obtain cover, which turned an impossible conversation into an ordinary procurement. The exposure remains uncomfortable, since key management failure is absolute rather than recoverable, and one significant loss at an institutional participant damages every provider in the field regardless of whose controls actually failed on the day. Insurers rather than regulators turned out to be the practical gatekeepers on institutional participation, which the sector took years to understand. Cover changed everything.
CAGR 22.1%
Full segment breakdown across 6 segments available in the complete report.

Regional Architecture and Country Demand Map

Regional shares follow where regulated activity is licensed and revenue is booked, which bears very little relationship to where developers actually work or where users transact. Read this table as a licensing map rather than an activity map. Three regions fall outside the standard bands for purely regulatory reasons.

North America

Capital, infrastructure providers, and the largest institutional participants concentrate here, though a long period of regulatory ambiguity pushed a meaningful share of activity to license elsewhere while retaining engineering domestically. That split persists in the revenue figures, with businesses headquartered in this region booking revenue through entities licensed in other jurisdictions. Growth of 16.1% tracks the market rate closely. Institutional tokenized fund activity has accelerated as clarity improved, and the region holds the deepest concentration of custody providers that insurers will actually cover. Businesses headquartered here frequently book revenue through entities licensed in other jurisdictions entirely. Regulatory ambiguity pushed licensing offshore while engineering stayed put. Institutional tokenized fund activity has accelerated since clarity improved.
Share: 27% | CAGR: 16.1% (2026 to 2036)

Western Europe

The European Union framework gave regulated institutions a defined position on what they may hold and issue, which converted a compliance question into an operational one across the whole bloc at once. Swiss arrangements predate it and continue to attract token issuance structures. Growth of 15.3% is the slowest of the seven regions, reflecting a framework that provides certainty without particular commercial encouragement. Tokenized fund and bond issuance is the most active application, driven by asset managers who wanted the settlement benefits and needed the legal clarity first. Asset managers wanted the settlement benefits and needed the legal clarity before committing anything. Swiss arrangements predate the bloc framework and continue attracting issuance structures.
Share: 22% | CAGR: 15.3% (2026 to 2036)
Regional intelligence for 5 additional markets available in the complete report: East Asia, South Asia and Pacific, Middle East and Africa, Latin America, Eastern Europe. Contact sales@marketmindsadvisory.com.
web-3-0-blockchain-market-country-cagr-analysis-1790008007770

Where Revenue Actually Comes From

Four commercial moves separate businesses earning durable revenue from those waiting for applications to arrive. Each accepts that infrastructure earns while applications experiment, that institutions require intermediaries, and that regulatory clarity has become a location decision rather than a compliance exercise. Regulatory clarity has become a location decision rather than a compliance exercise anywhere.

Support Many Protocols Rather Than Backing One

A median network reaches 31 months before development stops, so infrastructure revenue concentrated on any single protocol is exposed to a timeline nobody controls. Providers supporting eight or more networks show revenue volatility 3.4 times lower than those tied to one or two, and they capture developers migrating between chains rather than losing them. The engineering cost of breadth is real and modest, and several providers learned the alternative expensively when a chain they had built around went quiet. Developers migrating between chains are captured rather than lost. Breadth costs little.
Market Impact: Lowers revenue volatility by roughly 3.4 times overall

Obtain Licences Where Institutions Require Them

Around 41% of category revenue is now earned by licensed entities, and institutional customers will not contract with anybody operating outside a recognised framework whatever the technology offers. Businesses holding licences in two or more of the established jurisdictions win institutional mandates at roughly 4.2 times the rate of unlicensed competitors. Obtaining them costs money, time, and operational constraint, and the alternative is competing only for customers who cannot themselves be regulated. The alternative is competing only for customers who cannot themselves be regulated. Operational constraint comes with it. Licences take time.
Market Impact: Wins 4.2 times more institutional mandates than rivals

Build Custody That Insurers Will Actually Cover

Insurers rather than regulators were the practical gatekeepers on institutional participation, since nobody holds assets they cannot insure. Qualified structures, segregated key management, and independently audited controls are what makes cover obtainable, and providers with it convert institutional evaluations at 3.7 times the rate of those without. The controls are expensive and constraining, and the coverage signals third-party diligence in a way no self-assessment achieves, which is most of its commercial value. That signalling is most of its commercial value to a risk committee. Self-assessment persuades nobody. Cover signals diligence.
Market Impact: Converts 3.7 times more institutional evaluations than rivals

Sell Settlement Benefits Rather Than Disintermediation

Institutions buying tokenized assets want faster settlement, programmable distribution, and fractional access, and they specifically require the custodian, issuer, and legal wrapper that disintermediation arguments propose removing. Providers positioning on operational benefit rather than on architecture close institutional deals 2.9 times more often. It is a narrower claim than the sector prefers making and it is the one the buyer is actually paying for, which those with financial services backgrounds understood considerably faster. Those with financial services backgrounds understood this considerably faster than the sector generally did. It is the narrower claim.
Market Impact: Closes 2.9 times more institutional deals than rivals

Who Controls the Margin Pool

This is among the most fragmented categories we cover. Five providers hold 28% of revenue, measured consistently on that basis across all participants, and beneath them sits a very long tail of infrastructure services, custody providers, and tokenization platforms serving narrow segments. The gap between the leader and the fifth is modest, and positions move quickly because the underlying customer base turns over so rapidly. The customer base turns over faster than positions consolidate.
Competition currently turns on three things: licences in jurisdictions institutional customers recognise, custody arrangements insurers will cover, and protocol breadth that survives individual networks going quiet. Technical architecture differentiates far less than the sector's own discourse suggests, because institutional buyers evaluate operational risk and regulatory standing first. Institutional buyers weigh operational risk and regulatory standing first.

Pressure comes from two directions. Established financial infrastructure providers are entering tokenization with existing institutional relationships and licences already in place. Meanwhile cloud platforms offer node infrastructure that undercuts specialist providers on price. Rankings will shift toward participants holding licences and insurable custody, which are slow to obtain and difficult to replicate. Both are slow to obtain and hard to replicate quickly.
web-3-0-blockchain-market-company-positioning-matrix-1790008008298

Competitive Moat and Risk Dimensions

CONSENSYS

Moat: Developer Tooling Installed Position

Wallet and developer infrastructure embedded across an enormous share of application development creates a distribution position competitors cannot buy, since developers build against what they already know and switching means rewriting integration work. That position earns whether or not any individual application finds users, which is the durable characteristic in this market.
CONSENSYS

Risk: Single Network Concentration Exposure

Revenue concentrates heavily on one protocol family, and with a median network reaching 31 months before development stops, that concentration carries a risk the company does not control. Competitors supporting many networks capture developers migrating between chains, and diversifying means competing without the home advantage the position was built on.
FIREBLOCKS

Moat: Insurable Institutional Custody Structure

Qualified custody arrangements with segregated key management and independently audited controls attract insurance cover that institutional participants require before holding anything at all. That cover is slow and expensive to obtain and signals third-party diligence in a way no self-assessment can, which is precisely what a risk committee needs to see.
FIREBLOCKS

Risk: Traditional Custodians Entering Directly

Established financial custodians hold institutional relationships, licences, and balance sheets that specialist providers cannot match, and several have built digital asset capability rather than partnering for it. Competing against an incumbent custodian for the same institutional mandate is a considerably harder contest than competing against other specialists was.

Players Tracked

Prominent Players

Consensys
Coinbase
Fireblocks
Alchemy
Chainlink Labs

Other Key Players

Blockdaemon
QuickNode
Chainstack
Anchorage Digital
Ledger
Copper
Zodia Custody
Securitize
Tokeny
Ondo Finance
Ava Labs
Polygon Labs
Circle
Ripple
Chainalysis

Recent Developments

FEBRUARY 2026

Securitize Signs Tokenization Agreement With Institutional Asset Manager

Securitize entered an agreement to tokenize money market fund shares for an institutional asset manager, with a regulated custodian holding the underlying instruments and a transfer agent maintaining the register alongside the token structure itself. Distribution partners obtain same-day settlement and fractional access. Redemption runs alongside.
Signal: Institutional tokenization keeps every intermediary in place and sells settlement speed instead of any real disintermediation.
SEPTEMBER 2025

Fireblocks Obtains Digital Asset Custody Licence In Gulf Jurisdiction

Fireblocks obtained a digital asset custody licence under a Gulf regulatory framework, adding to authorisations held elsewhere and giving institutional clients in the region a locally supervised counterparty for holding tokenized instruments. Segregated key management and audited controls formed part of the application. Regional clients gain a supervised counterparty.
Signal: Licences are collected jurisdiction by jurisdiction because institutions will not contract outside frameworks their supervisors recognise.
MAY 2025

Consensys Acquires Multi-Network Node Infrastructure Provider

Consensys completed an acquisition of a node infrastructure provider supporting several protocol families, reducing dependence on a single network in a market where a median chain reaches roughly thirty one months before development stops. Customers gain access across several protocol families under one contract. Migration support is included.
Signal: Protocol breadth is being acquired because single network concentration has proved expensive more than once already.

What Running This Infrastructure Costs

Three inputs dominate provider cost. Cloud infrastructure for node operation, indexing, and data availability runs 30% to 38% of cost of goods sold, and it scales with the number of protocols supported rather than with customer count. Engineering takes 28% to 36%, weighted toward protocol specialists whose skills are scarce. Licensing, compliance, and independent security audit add a further 12% to 18%, repeated in every jurisdiction.
Cloud infrastructure and independent security audit costs both rose materially through 2024 and 2025, the first with general capacity demand and the second as audit capacity failed to expand alongside the number of deployments requiring it. Several providers described the resulting margin pressure in their annual reports for those years, with audit scheduling becoming a delivery constraint rather than only a cost one. Institutional onboarding stalled behind it.

The competitive disadvantage mechanism runs through protocol breadth rather than through cloud efficiency. Supporting many networks multiplies infrastructure and engineering cost against customers who each use one or two, while supporting few concentrates risk on protocols that may stop. Exposure varies by provider type. Large providers amortise breadth across a wide customer base. Specialists carry either concentration risk or a cost structure their revenue cannot support.
web-3-0-blockchain-market-cost-volatility-analysis-1790008008496

Share Node Infrastructure Across Customer Deployments

Running dedicated nodes per customer multiplies cost against a service most customers use intermittently. Shared infrastructure with logical separation delivers the same access at a fraction of the cost, and providers who built this way support far more customers per unit of infrastructure than those provisioning dedicated capacity for each contract. Most customers use the service intermittently.

Schedule Independent Security Audits Well Ahead

Audit capacity has not expanded alongside the number of deployments requiring review, which makes scheduling a delivery constraint rather than only an expense. Providers booking capacity months ahead avoid the delays that stall institutional onboarding, and the certainty is worth considerably more than the premium paid for it. Delivery certainty is worth the premium.

Reuse Licensing Evidence Across Comparable Jurisdictions

Regulatory frameworks across the established jurisdictions ask overlapping questions about controls, segregation, and governance even where the applications differ entirely. Structuring evidence so one control set supports several applications reduces the repeated effort substantially, and providers who did this obtained subsequent licences in a fraction of the time. Subsequent applications complete far faster. Elapsed time falls sharply.

Portfolio Architecture for Margin Defence

Margin follows regulatory standing and how many customers share the underlying cost. Node access and basic developer infrastructure is competitive, with cloud platforms offering comparable capability and buyers comparing price directly. Multi-protocol indexing and tooling earn better. Licensed custody and tokenization platform operation earn most, because the licence and the insurable structure behind them take years to obtain and cannot be replicated quickly. Licences take years and cannot be bought quickly.
The tension between volume and premium runs through customer type. Application developers are numerous, price sensitive, and disappear at a rate that developer retention of 18% after two years makes plain. Institutional customers are few, slow to onboard, and persist, which makes them worth several times more over any reasonable horizon despite requiring licences and controls to serve at all. Institutional customers are worth several times more over any horizon.

High-value pools concentrate where a regulated institution needs a counterparty it can contract with: insurable custody, licensed tokenization platform operation, and infrastructure supporting institutional settlement. These share a customer who cannot use an unlicensed provider whatever the technology offers. Everywhere else, the buyer is a developer comparing price on services that several providers deliver adequately.

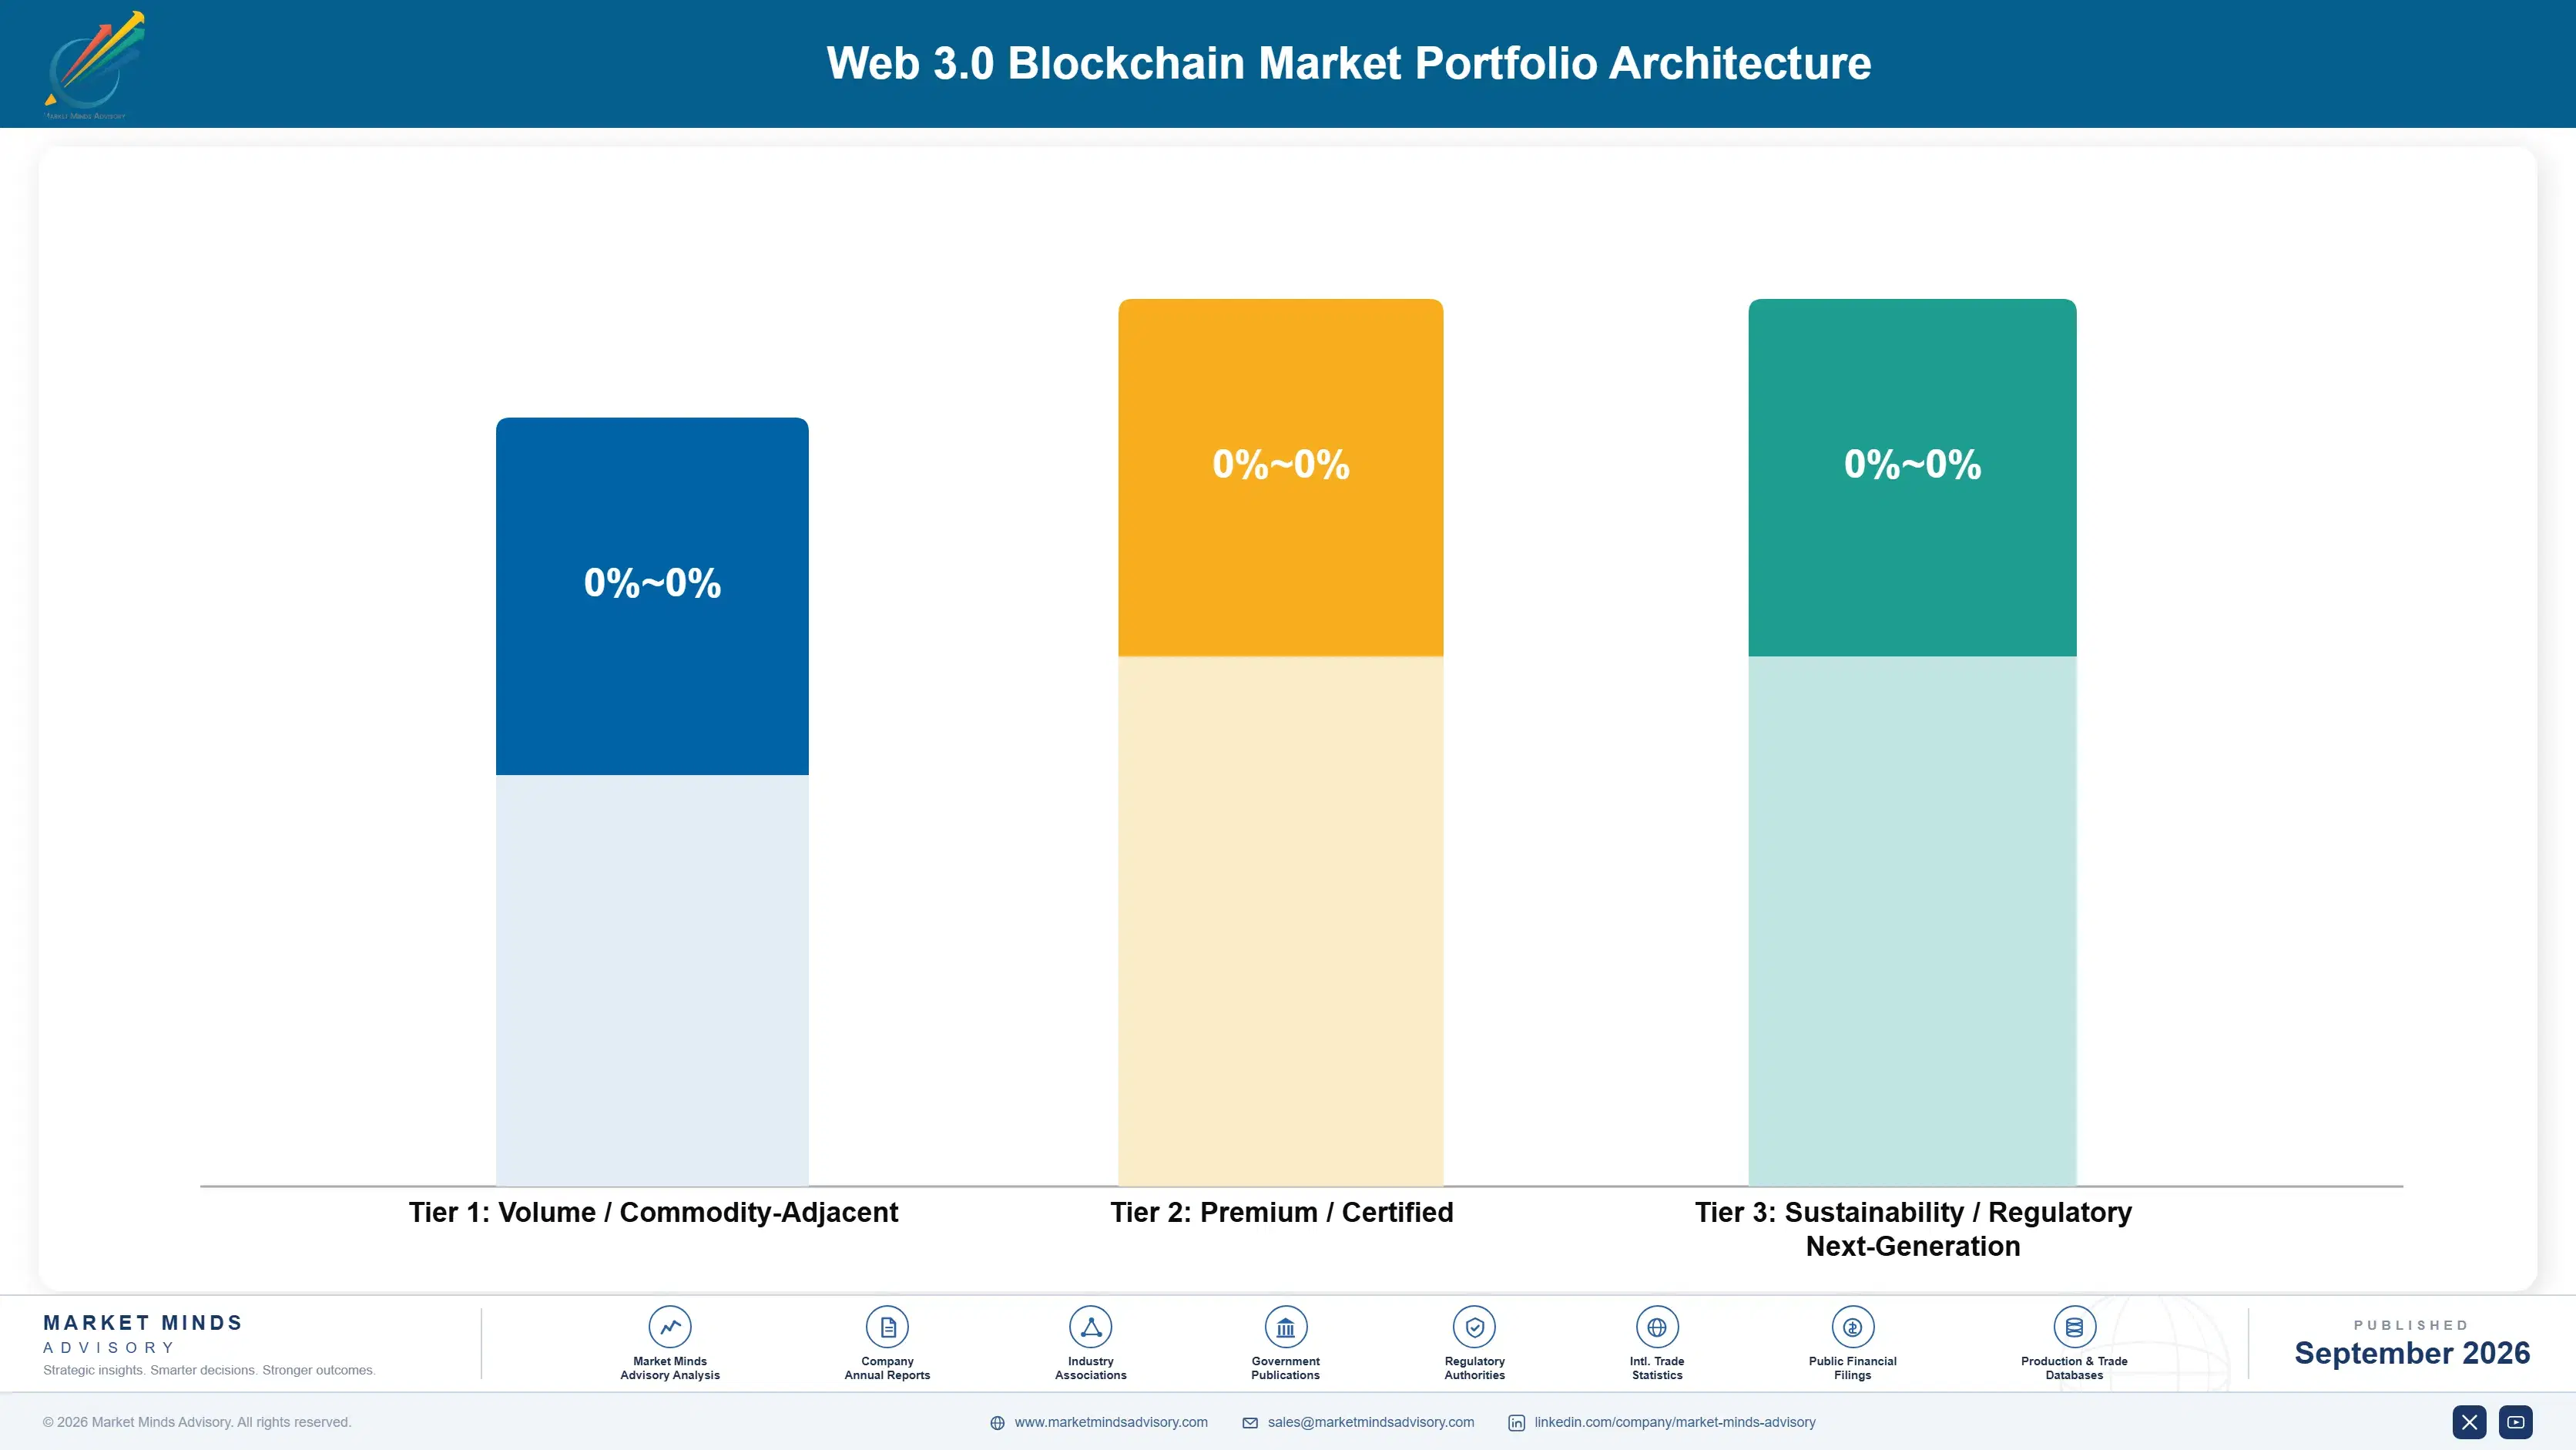
Volume / Commodity-Adjacent

Node access and basic developer infrastructure where cloud platforms offer comparable capability and buyers compare price directly. Customers are numerous, price sensitive, and turn over rapidly. The eleven-point range reflects whether providers share infrastructure or provision dedicated capacity per contract.
Gross Margin: 34% to 45%

Premium / Certified

Multi-protocol indexing, developer tooling, and decentralised storage where breadth and reliability limit the credible field. Revenue survives individual networks going quiet. The ten-point range separates providers supporting many protocols efficiently from those carrying breadth against too few customers.
Gross Margin: 56% to 66%

Sustainability / Regulatory / Next-Generation

Licensed custody, tokenization platform operation, and institutional settlement infrastructure. Licences and insurable structures take years to obtain and institutional buyers cannot use anything else. The twelve-point range reflects how differently jurisdictions price supervised operation and how many licences a provider holds.
Gross Margin: 66% to 78%
web-3-0-blockchain-market-portfolio-architecture-1790008009003

High-value Sub-segments and Strategic Watch-out

Licensed Institutional Custody

Highest value, growing at 22.1%, and gated by insurance cover that qualified structures and audited controls make obtainable. Institutions hold nothing they cannot insure. The eleven-point range reflects differences in licence coverage and how many jurisdictions each provider is authorised within. Cover is the gate.
Gross Margin: 68% to 79%

Tokenized Asset Platform Operation

Fastest growth at 25.2% on roughly USD 34 billion of assets, and the least decentralised part of the market by a distance. Custodian, issuer, transfer agent, and legal wrapper are all required. Established financial infrastructure providers are entering with licences already held. Licences already held give them an advantage.
Gross Margin: 62% to 73%

Multi-Protocol Developer Infrastructure

The durable core, earning whether applications succeed or not, and protected against a median protocol lifespan of 31 months by breadth. Providers supporting eight or more networks show far lower revenue volatility. Developers migrating between chains are captured rather than lost. Breadth is the protection.
Gross Margin: 54% to 64%

Single Network Node Provision

The strategic watch-out. Cloud platforms offer comparable node access at lower prices, and concentration on one protocol exposes revenue to a timeline nobody controls. The thirteen-point range reflects the gap between shared infrastructure models and dedicated provisioning per customer contract. Price comparison dominates. Timelines are uncontrolled.
Gross Margin: 30% to 43%

Why This Revenue Persists

Revenue durability here depends almost entirely on customer type, and the difference is stark. Application developers churn continuously, with retention at 18% after two years and a median protocol reaching 31 months, so infrastructure revenue from that population is replaced rather than retained. Institutional customers behave completely differently, onboarding slowly through risk committees and then staying for years because reopening the assessment is unattractive.
Depth of commitment tracks how much the customer had to do to start. An institution that obtained internal approval, satisfied its auditors, and integrated custody into treasury operations does not repeat that work casually. A developer who signed up for node access with a credit card leaves the same way. Tokenization platform customers sit at the committed end, since the legal structures were built around a specific provider.

The buyer has changed more than the technology has. Developers and founders drove purchasing for a decade, evaluating on architecture and community. Institutional risk committees, treasury functions, and compliance officers now control the revenue that matters, and they ask about licences, insurance, audited controls, and counterparty standing. Providers whose positioning still addresses developers are reaching the population that pays least and stays shortest.
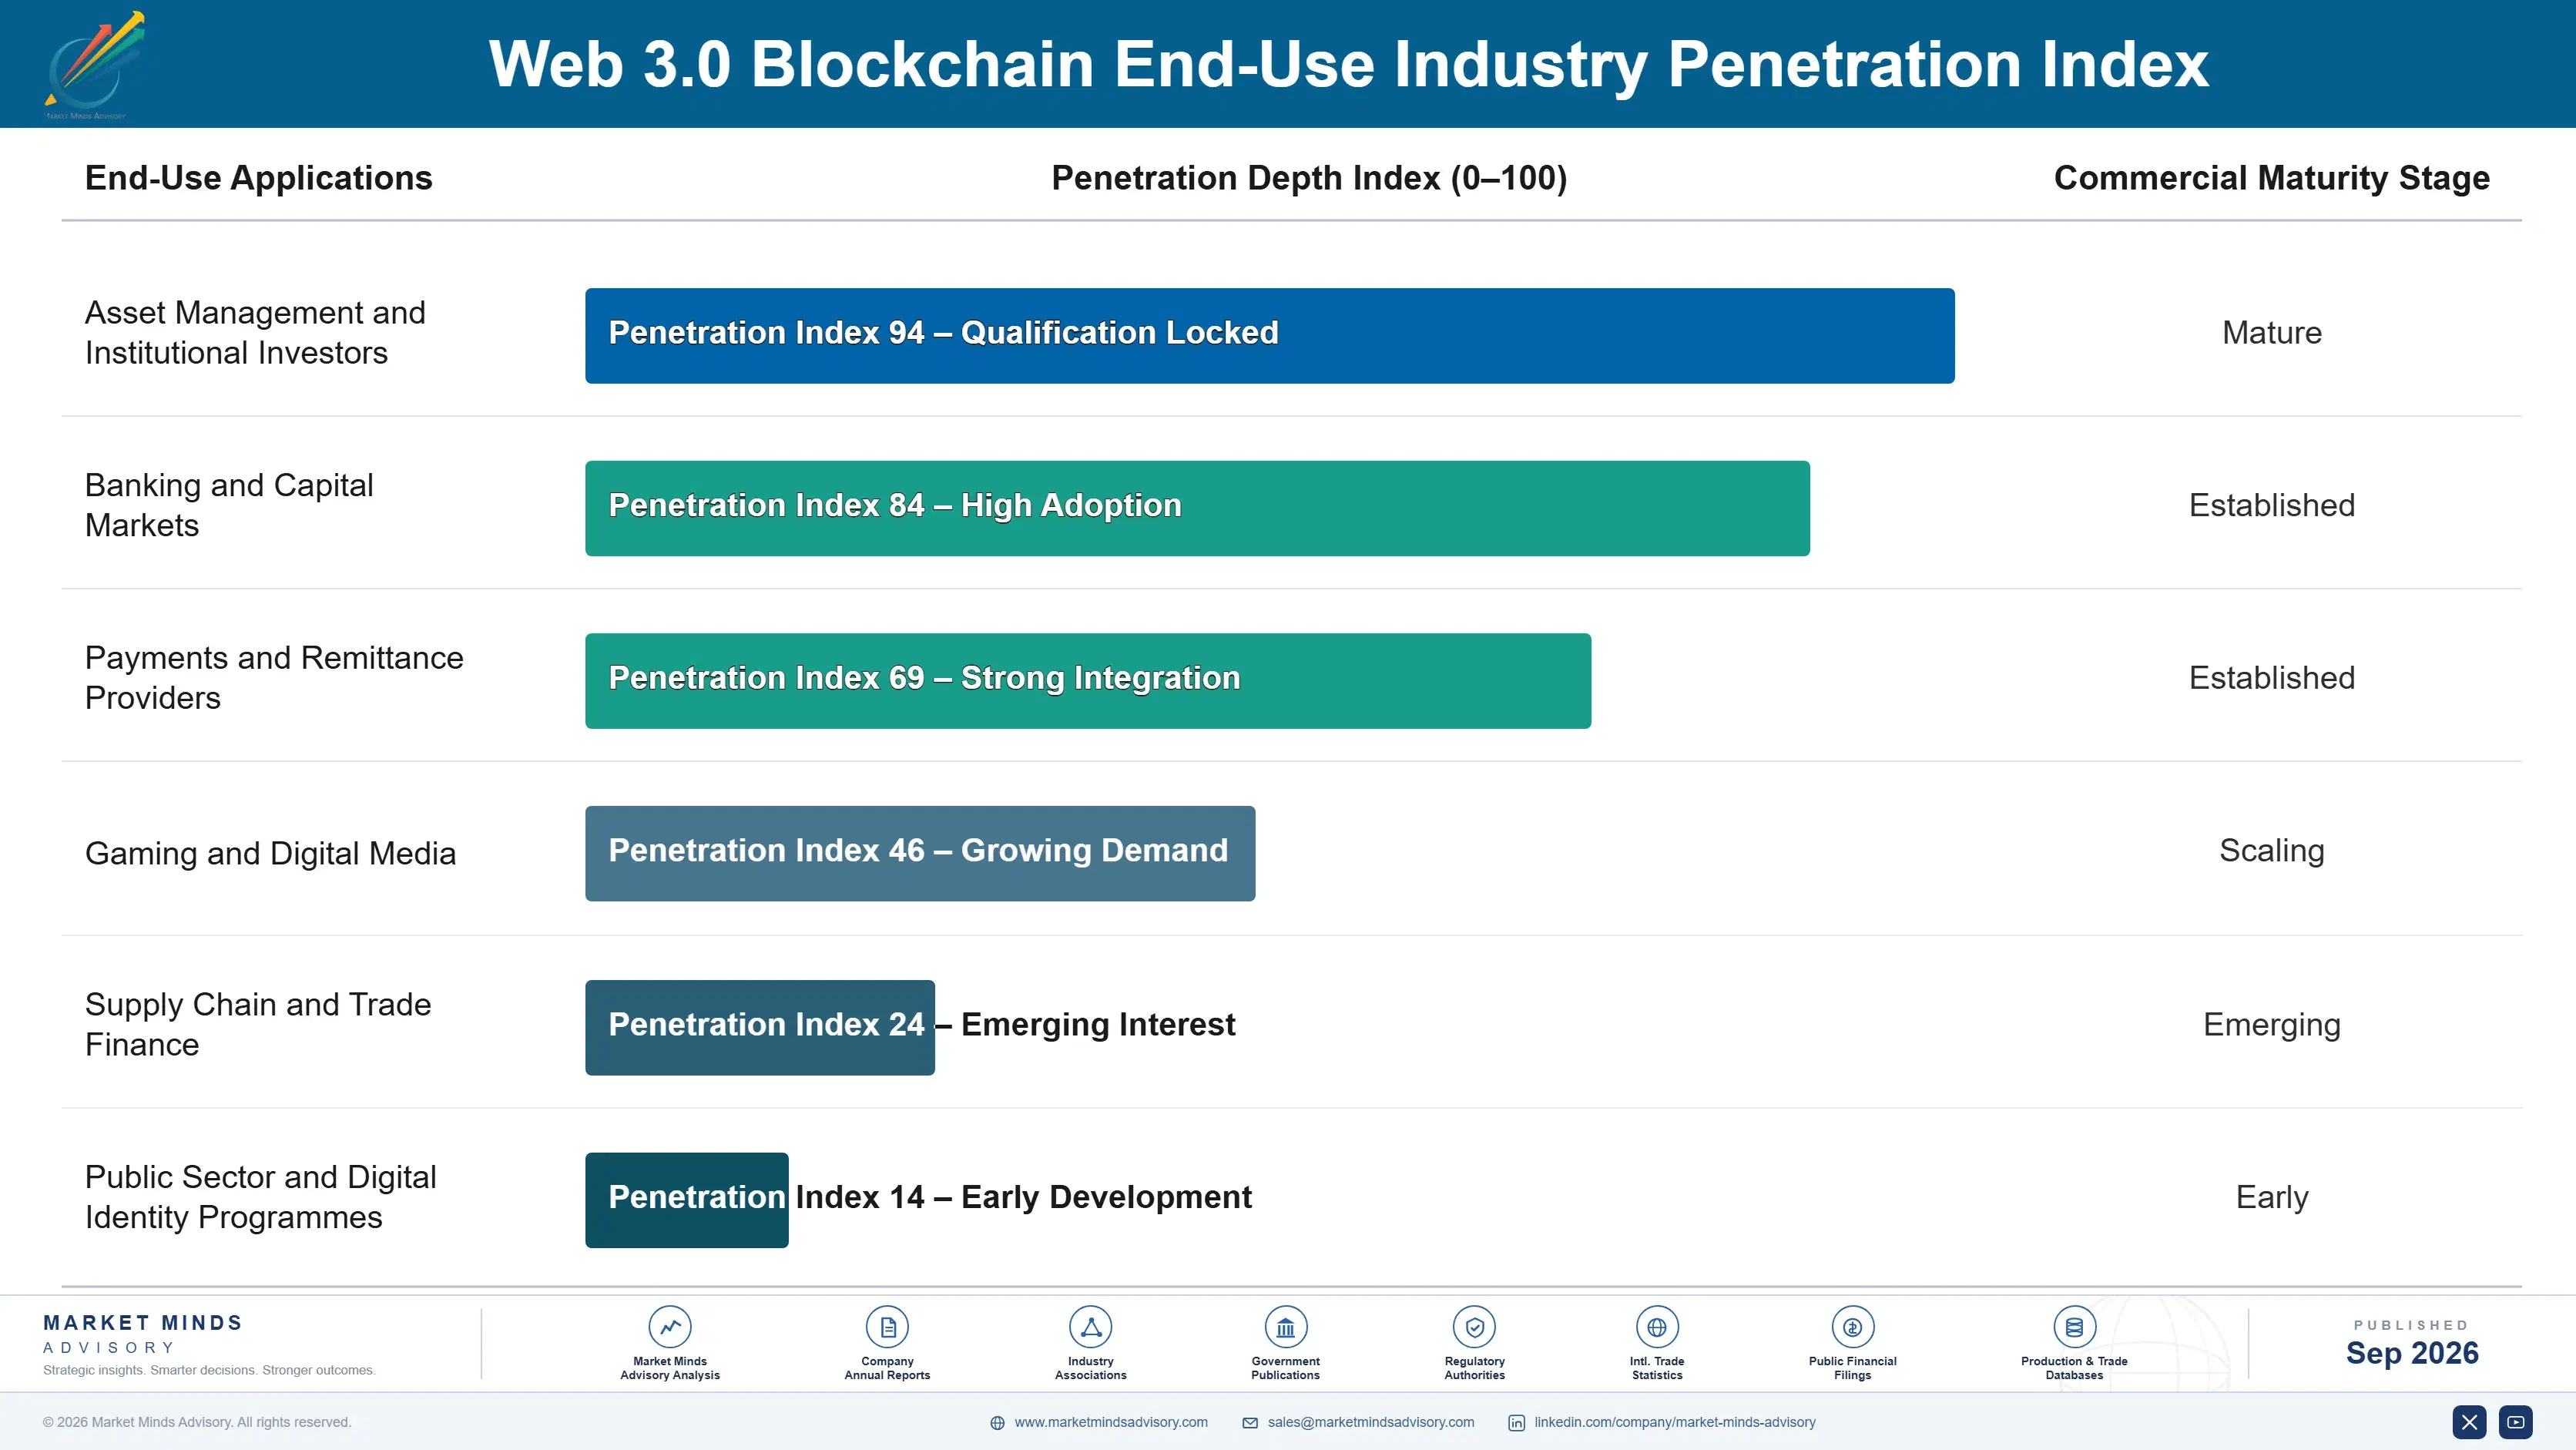
web-3-0-blockchain-market-end-use-penetration-index-1790008009503

Where This Market Rewards

These are among the four positions where our research anticipates prominent divergence between winners and laggards over the coming forecast period. Each is grounded in the demand model, the regulatory perimeter, and the announced capacity pipeline.
01 / INFRASTRUCTURE POSITION PRIORITY

Tools earn while applications keep experimenting

Infrastructure accounts for 64% of category revenue because node access, indexing, and developer tooling are consumed whether or not any individual application finds users, and most have not. Developer retention at 18% after two years and a median protocol lifespan of 31 months describe the attrition underneath that revenue. Providers supporting eight or more networks show revenue volatility 3.4 times lower than those concentrated on one or two protocols, and they capture developers migrating rather than losing them between chains.
02 / REGULATORY STANDING INVESTMENT

Institutions will not contract outside recognised frameworks

Around 41% of category revenue is now earned by licensed entities, and no institutional customer will engage a counterparty operating outside a framework their own supervisor recognises, whatever the underlying technology happens to offer them. Businesses licensed in two or more established jurisdictions win institutional mandates roughly 4.2 times more often than unlicensed competitors. The cost is money, time, and operational constraint, and the alternative is a permanently smaller customer population, which several providers have chosen and later regretted afterwards.
03 / INSURABILITY AS GATEKEEPER

Insurers decided this, not regulators

Institutions could not hold these assets while nobody would insure the custody arrangement, and that practical obstacle mattered far more than any regulatory position or technical argument about key management. Qualified structures, segregated keys, and independently audited controls make cover obtainable, and providers holding it convert institutional evaluations 3.7 times more often. The coverage signals third-party diligence in a way no self-assessment ever achieves with a risk committee, however carefully the controls are described in a document or a presentation.
04 / NARROW CLAIM DISCIPLINE

Sell settlement speed, never sell disintermediation

Tokenized asset platforms grow at 25.2% while requiring a regulated custodian, a legal wrapper, a named issuer, and a transfer agent, which reinstates every intermediary the original architecture proposed removing. Institutions want settlement speed, programmable distribution, and fractional access, and they specifically want the intermediaries. Providers positioning on operational benefit rather than architecture close institutional deals 2.9 times more often than those still arguing the original case, which those from financial services understood considerably faster, and acted on it first.

Engagement Snapshot From the Field

A live engagement with an industry participant carrying material or product regulatory and market exposure ahead of a defining policy shift, showing how our research translates into a defensible multi-year portfolio strategy.
MARKET MINDS ADVISORY · CLIENT ENGAGEMENT SUMMARY
Web 3.0 Blockchain Producer Strategic Portfolio Review and Transition Roadmap 2026·Investment Scenario on Web 3.0 Blockchain Exposure Evaluation 2025-26
CLIENT PROFILE
A global asset manager with approximately USD 340 billion under management across fixed income and money market strategies (client-reported, unverified by MMA). Distribution partners in Asia and the Gulf had begun asking for tokenized share classes, and an internal working group had spent a year without producing a recommendation that risk and legal functions would both accept.
STRATEGIC CHALLENGE
The working group had approached the question as a technology selection, comparing protocols and platform architectures, while risk and legal were asking about custody of the underlying, enforceability of the token as a claim, and which supervised entity would be accountable. The two conversations had not intersected at all in twelve months.
MMA APPROACH
MMA restructured the assessment around the legal and operational requirements first, mapping which supervised entity would hold the underlying, who would maintain the register, and which jurisdictions permitted the structure. Providers were then evaluated on licences held, insurance cover, and audited controls rather than on protocol architecture or throughput. Distribution partner requirements were tested directly.
KEY FINDINGS
  1. Only four of eleven candidate providers held custody licences in jurisdictions where the manager's distribution partners could contract with them under their own supervisory requirements.
  2. Insurance cover on the custody arrangement was the binding constraint for the manager's own risk committee, and three of the four remaining candidates could not evidence adequate cover.
  3. Protocol selection affected settlement time and cost materially but had no bearing whatever on the legal, custody, or accountability questions that had stalled the working group.
  4. Distribution partners wanted fractional access and same-day settlement specifically, and none had asked for disintermediation or expressed any interest in the underlying architecture.
CLIENT PROFILE
A global asset manager with approximately USD 340 billion under management across fixed income and money market strategies (client-reported, unverified by MMA). Distribution partners in Asia and the Gulf had begun asking for tokenized share classes, and an internal working group had spent a year without producing a recommendation that risk and legal functions would both accept.
STRATEGIC CHALLENGE
The working group had approached the question as a technology selection, comparing protocols and platform architectures, while risk and legal were asking about custody of the underlying, enforceability of the token as a claim, and which supervised entity would be accountable. The two conversations had not intersected at all in twelve months.
MMA APPROACH
MMA restructured the assessment around the legal and operational requirements first, mapping which supervised entity would hold the underlying, who would maintain the register, and which jurisdictions permitted the structure. Providers were then evaluated on licences held, insurance cover, and audited controls rather than on protocol architecture or throughput. Distribution partner requirements were tested directly.
KEY FINDINGS
  1. Only four of eleven candidate providers held custody licences in jurisdictions where the manager's distribution partners could contract with them under their own supervisory requirements.
  2. Insurance cover on the custody arrangement was the binding constraint for the manager's own risk committee, and three of the four remaining candidates could not evidence adequate cover.
  3. Protocol selection affected settlement time and cost materially but had no bearing whatever on the legal, custody, or accountability questions that had stalled the working group.
  4. Distribution partners wanted fractional access and same-day settlement specifically, and none had asked for disintermediation or expressed any interest in the underlying architecture.
RECOMMENDED STRATEGY
Phase 1: Phase one: fix the legal and custody structure before selecting any technology, identifying the supervised entity accountable for the underlying and the register. Phase 2: Phase two: shortlist providers on licences held and insurance cover evidenced, treating protocol architecture as a secondary operational consideration rather than a primary one. Phase 3: Phase three: launch a single tokenized share class on one strategy, measuring settlement time and distribution reach against the existing arrangement before extending further.
OUTCOME
The tokenized share class launched within seven months of the restructured assessment, against a working group that had produced nothing in twelve (client-reported, unverified by MMA). Settlement moved from two days to same day. Two further strategies were approved for tokenization on the same structure within the following year.

Frequently Asked Questions

Foundational context covering the market sizes, CAGR, scope, country, region and competition that inform every finding below. This section is provided to cover basics and most often pre-purchase conversations, answered from the MMA Primary Research Dataset.

What is the current size of the Web 3.0 Blockchain Market?

The market was worth USD 3.1 billion in 2025 and reaches USD 3.6 billion in 2026. Value covers infrastructure, platforms, and services rather than trading or mining revenue.

How large will the Web 3.0 Blockchain Market be by 2036?

MMA forecasts USD 17.0 billion by 2036, an increase of USD 13.4 billion across the forecast period. That represents 4.72 times the 2026 base of USD 3.6 billion.

What is the CAGR for the Web 3.0 Blockchain Market 2026 to 2036?

The base case compound annual growth rate is 16.8%, with a bull case at 18.1% and a bear case at 15.5%. Historical growth from 2020 to 2025 ran at 15.4%.

Which segment is growing fastest?

Tokenized real world asset platforms grow at 25.2%, half again the market rate of 16.8%. They are also the least decentralised part of the market by some distance.

Who are the major companies in the Web 3.0 Blockchain Market?

Consensys, Coinbase, Fireblocks, Alchemy, and Chainlink Labs lead, holding 28% of revenue between them. A very long tail of specialist providers sits beneath those five.

Which country is growing fastest?

The United Arab Emirates grows at 24.6%, on licensing frameworks built deliberately to attract regulated digital asset businesses. Firms relocated there specifically seeking institutional customers.

Report Segmentation Architecture

The full report scope spans multiple orthogonal segmentation dimensions, with cross-tabulated demand data provided for each dimension pair. Coverage extends further to regional breakdowns, trend trajectories, and the competitive detail needed to support segment-level decision-making.

By Infrastructure Layer

  • Protocol and Network Infrastructure
  • Node, Indexing and Developer Infrastructure Services
  • Tokenized Real World Asset Platforms
  • Wallets, Custody and Key Management
  • Decentralised Storage and Compute
  • Decentralised Identity and Credentials

By End-Use Industry

  • Asset Management and Institutional Investors
  • Banking and Capital Markets
  • Payments and Remittance Providers
  • Gaming and Digital Media
  • Supply Chain and Trade Finance
  • Public Sector and Digital Identity Programmes

By Commercial Dimension

  • Licensed Institutional Contract
  • Developer Self-Service Subscription
  • Enterprise Platform Agreement
  • Managed Node and Infrastructure Service
  • Tokenization Platform Fee Arrangement
  • Protocol Foundation Grant Funded

By Region

  • North America
  • Western Europe
  • East Asia
  • South Asia and Pacific
  • Middle East and Africa
  • Latin America
  • Eastern Europe

Scope, Methodology, and Coverage

Every figure in this report is reproducible from documented input assumptions. The scope below maps the historical period, the forecast horizon, the segmentation dimensions, and the countries covered, alongside the underlying primary and qualitative methodology.
Historical Period
2020 to 2025
Forecast Period
2026 to 2036
Base Year
2025 (USD billions; MMA Primary Research Dataset, September 2026)
Market Definition
This market covers infrastructure, platforms, and services enabling decentralised network applications, including protocol and network infrastructure, node, indexing and developer infrastructure services, tokenized real world asset platforms, wallets, custody and key management, decentralised storage and compute, and decentralised identity and credentials. It excludes cryptocurrency trading and exchange revenue, mining and validation rewards, enterprise permissioned ledger deployments sold as conventional software, and payment card tokenization.
Quantitative Units
USD billions, infrastructure and platform revenue
Segmentation Dimensions
Infrastructure layer, end-use industry, commercial dimension, region
Regions Covered
North America, Western Europe, East Asia, South Asia and Pacific, Middle East and Africa, Latin America, Eastern Europe
Countries Covered
United States, Canada, United Kingdom, Switzerland, Germany, France, Netherlands, Ireland, Luxembourg, Japan, South Korea, Hong Kong, Taiwan, Singapore, Australia, India, Indonesia, United Arab Emirates, Saudi Arabia, Bahrain, Nigeria, Kenya, South Africa, Brazil, Argentina, Mexico, Estonia, Poland, Lithuania, Czechia
Key Companies Profiled
Consensys, Coinbase, Fireblocks, Alchemy, Chainlink Labs, Blockdaemon, QuickNode, Chainstack, Anchorage Digital, Ledger, Copper, Zodia Custody, Securitize, Tokeny, Ondo Finance, Ava Labs, Polygon Labs, Circle, Ripple, Chainalysis
Quantitative Methodology
Primary survey, n=3,800 respondents, Q4 2025, six countries; demand-side model with trade association cross-validation
Qualitative Methodology
47 expert interviews, Q4 2025; applied to validate demand model assumptions, identify emerging dynamics, and assess competitive positioning
Report Format
PDF and XLSX data workbook (Word format preview document)
Publisher
Market Minds Advisory
Report Code
MMA-2026-TEC-591
Published
September 2026
Contact
sales@marketmindsadvisory.com | www.marketmindsadvisory.com

Purchase the full Web 3.0 Blockchain Market Report (2026 to 2036).

The full report sizes the decentralised network infrastructure market across six layers, seven regions, and thirty countries, with forecasts to 2036 under base, bull, and bear cases. It examines why infrastructure earns while applications experiment, how tokenized assets grew by reinstating the intermediaries the architecture proposed removing, and why insurers rather than regulators gated institutional participation. Competitive analysis covers twenty participants evaluated consistently on infrastructure and platform revenue, with detailed treatment of licensing geography and protocol concentration risk. Cost structure, margin architecture by layer, and regional regulatory drivers are analysed in full. Primary research includes 3,800 survey responses and 47 expert interviews.
Six infrastructure layers sized and forecast separately
Twenty participants evaluated on infrastructure and platform revenue
Regional licensing and regulatory drivers across seven geographies
Margin architecture by layer and regulatory standing
Protocol survival and developer retention analysis with cohort data
Institutional onboarding benchmarks by licence and insurance status

Built For The People Who Decide

From boardroom strategy to bench-side execution, this report is read cover-to-cover by leaders shaping the next decade of their industry, turning demand scenarios, market dynamics and valuation benchmarks into decisions.
CXOs/ Presidents/ VPs/ Managers
M&A and Corporate Development
Strategy Teams and R&D Heads
Procurement and Product Directors
Regulatory and Compliance Leaders
Investor Relations and Equity Analysts