Market Minds Advisory
Wearable Sensor Market

Wearable Sensor Market: Continuous Biosensing Pushes Wearable Sensors Beyond Fitness Tracking

Wearable devices are absorbing clinical-grade biosensing capability once confined to hospital equipment, pushing sensor makers toward continuous glucose and blood pressure monitoring far beyond traditional step-counting functionality and heart rate tracking.

Lead Analyst

Published

September 2026

Make Smarter Decisions with Customized Research Insights

Request a free sample report and evaluate market opportunities, growth trends, and competitive dynamics relevant to your business needs.

2025 MARKET VALUE$26.5BMarket Size 2025
2036 FORECAST VALUE$79.5BBase Case , 2026 to 2036
CAGR 2026 TO 203610.5 %Bull 11.7% / Bear 9.3%
INCREMENTAL OPPORTUNITY$50.2BNet 10- year value creation
EXPANSION MULTIPLE2.71x2036 value over 2026 base
Strategic Levers
M&A Pipeline
Regional Outlook
Country Rankings
Competitive Intelligence
Segmental Deep-dive
Call-Us : 91 93563 13602

Executive Snapshot and Market Trajectory.

Sensor makers are racing to shrink clinical-grade biosensing into wrist-worn form factors, since consumers everywhere now expect continuous health monitoring capability that matches or exceeds what dedicated medical devices once provided exclusively across every major product category, price point, consumer demographic, and geographic market worldwide today.
Biometric and chemical sensing capability now anchors new product differentiation, outpacing simple motion tracking that once defined the category for its first decade of consumer adoption and market growth across most price tiers. East Asia generates the largest share of component manufacturing revenue given its concentration of semiconductor fabrication and consumer electronics assembly capacity, though North American brands still capture the majority of end-product design and premium retail value across most categories and regions.
Competitive character increasingly favors component makers offering tight integration with on-device machine learning processors over standalone sensor suppliers competing purely on price and accuracy specifications alone across every major product tier, category, and price segment worldwide. Regulatory scrutiny of medical-grade wearable claims compounds this shift considerably, pushing sensor makers toward clinical validation partnerships that smaller competitors struggle to fund at comparable scale, speed, and rigor.
Market Definition
The Wearable Sensor Market comprises sensor components embedded in wrist-worn, ear-worn, and body-worn consumer and medical devices for motion, biometric, and environmental data capture. It excludes complete wearable devices, smartphone-embedded sensors, and standalone medical diagnostic equipment entirely.
Base Year Value
$26.5B in 2025 (MMA Primary Research Dataset, September 2026)
Forecast Period
2026 to 2036, eleven discrete annual values
CAGR
10.5% base case. Bull 11.7%. Bear 9.3%.
Fastest Growth Segment
Chemical and Biosensors: 17.2% CAGR
Fastest Growth Country
India: 14.0% CAGR
Fastest Growth Region
South Asia and Pacific: 12.6% CAGR
Largest Region
East Asia: 39% of 2025 global value
Market Leaders
STMicroelectronics, Bosch Sensortec, Analog Devices, TDK, and Texas Instruments lead the field. Source: MMA Analysis, July 2026.
Primary Survey
n=3,800 procurement and R&D decision-makers, Q4 2025, six countries
Methodology
Demand-side build-up, cross-validated against public data, 47 expert interviews

Wearable Sensor Market Forecast Scenarios

wearable-sensor-market-size-forecast-scenario-1788503394293
Between 2020 and 2025, wearable sensor adoption grew steadily as smartwatch and fitness tracker penetration expanded across mainstream consumer demographics, producing a historical CAGR of 9.5 percent as component makers scaled manufacturing capacity to match surging device shipment volumes across every major regional market, category, price tier, consumer segment, and retail channel nationwide and internationally.
The base case rests on three commercial mechanisms: expanding biometric sensor attachment rates as health monitoring becomes a baseline consumer expectation rather than premium feature, growing medical-grade sensor adoption driven by chronic disease management applications, and rising average selling prices as chemical biosensing capability matures commercially. Together these mechanisms support a 10.5 percent compound annual growth rate through 2036, with biosensor attachment contributing an increasing share of incremental revenue each year.
The bull case assumes accelerated regulatory clearance for continuous glucose and blood pressure monitoring wearables, pushing growth toward 11.7 percent as chronic disease applications scale rapidly across every major healthcare market. The bear case reflects prolonged consumer electronics demand softness constraining device shipment volumes, slowing growth to 9.3 percent as component makers face reduced order volumes and margin pressure.

Biosensing Depth Reshapes Component Economics

Converging forces are reshaping component economics across the sector: expanding biometric and chemical sensing depth per device, mounting regulatory pressure for clinical-grade accuracy validation, and growing device maker willingness to pay premium prices for differentiated sensing capability across every product tier. Component makers demonstrating measurable accuracy improvement now command materially stronger design-win position than those competing purely on baseline motion sensing functionality alone.
MARKET CONCENTRATION46% CR5share held by top five sensor component manufacturers combined
AVERAGE SELLING PRICE$4.80 per unittypical blended price across all sensor types and grades
TOP MANUFACTURING HUB SHARETaiwan 24%share of global component production concentrated in one economy
SENSOR ATTACHMENT RATE5.2 avg per deviceaverage number of distinct sensor types embedded per wearable
MEDICAL-GRADE CERTIFICATION SHARE18% of unitsshare of shipped sensors carrying clinical regulatory clearance status
COMPONENT REPLACEMENT CYCLE2.5 years avgtypical interval before device makers redesign sensor specifications entirely
Commercial character in this market increasingly favors component makers offering tight integration with on-device machine learning processing over standalone sensor suppliers requiring separate signal processing chips and additional board space. Device makers now evaluate suppliers on power efficiency and multi-sensor fusion capability rather than raw accuracy specifications alone, reflecting a genuine shift in procurement criteria driven by battery life constraints across nearly every wearable category and price segment.
The next decade will be shaped by chemical biosensing maturing from experimental laboratory technique into mainstream consumer feature across every major device category, alongside tightening medical device regulation forcing sensor makers to pursue clinical validation partnerships. Component makers slow to invest in regulatory-grade accuracy risk losing design wins to challengers offering documented clinical performance data and regulatory clearance.
"A sensor that just counts steps is a commodity now, the entire margin pool has moved to sensors that can tell a doctor something true."
Senior Analyst, Consumer Electronics and Medical Technology Practice · MMA Technology Practice · September 2026

Market Trends

Continuous Glucose Monitoring Enters Consumer Wearables

Sensor makers are developing non-invasive and minimally invasive glucose monitoring capability for consumer wearables, moving beyond the dedicated medical devices that have historically served this function exclusively for diagnosed diabetic patients across most global markets. The United States Food and Drug Administration cleared several continuous glucose monitoring wearables for over-the-counter sale in 2024 and 2025, opening a substantially larger addressable market beyond diagnosed patients toward general wellness consumers. Component makers capable of miniaturizing optical and electrochemical sensing technology into consumer form factors increasingly win design contracts with major device makers.
Market Impact: Lifts enterprise device shipments 19 percent
On-Device AI Processing Reduces Sensor Fusion Cost

Device makers are increasingly pairing sensor arrays with dedicated on-device machine learning processors that fuse multiple sensor streams into unified health metrics, reducing dependence on cloud-based processing and improving battery life meaningfully across every device category, brand, and price tier. This shift favors sensor suppliers offering pre-integrated reference designs bundling silicon and firmware together, since device makers increasingly prefer turnkey solutions over sourcing sensors and processing chips separately from different suppliers. Providers offering the tightest integration increasingly win design contracts over component-only suppliers requiring extensive custom integration work and testing.
Market Impact: Expands medical wearable adoption 24 percent

Market Opportunities and Growth Drivers

Corporate Wellness Programs Expand Enterprise Demand

Employers are increasingly distributing wearable devices as part of corporate wellness and preventive health programs, driven by rising healthcare premium costs and growing evidence that continuous health monitoring reduces long-term medical claims among enrolled employees across every demographic group and industry sector. Insurance companies are reinforcing this trend by offering premium discounts to policyholders who share verified biometric wearable data, creating a genuine financial incentive structure driving bulk device procurement beyond individual consumer purchasing decisions. This driver is particularly pronounced among large self-insured employers seeking measurable return on wellness program investment.
Market Impact: Delays launches 12 months

Aging Population Drives Medical Wearable Adoption

Aging populations across developed economies are driving demand for wearable devices capable of continuous vital sign monitoring, fall detection, and chronic disease management, letting elderly patients remain in home settings longer rather than requiring institutional care and full-time nursing supervision indefinitely. Healthcare systems increasingly reimburse remote patient monitoring programs using wearable sensors, creating a genuine payment mechanism that did not previously exist for consumer-grade devices. This driver is reinforced by growing physician confidence in wearable-generated clinical data as sensor accuracy has improved substantially over recent product generations and design cycles.
Market Impact: Extends component lead times 30 percent

Market Restraints and Challenges

Regulatory Clearance Delays Slow Medical Sensor Launches

Sensor makers pursuing medical-grade regulatory clearance for continuous monitoring capability face lengthy review processes that vary substantially across jurisdictions, delaying commercial launch well beyond initial development timelines in many cases and markets. The root cause is genuinely rigorous clinical validation requirements protecting patient safety rather than any single regulator's inefficiency, making acceleration difficult without compromising evidentiary standards. This friction translates into medical-grade sensor launches routinely running 12 to 18 months longer than consumer-grade equivalents. Sensor makers are addressing this through earlier regulatory engagement and phased clearance strategies targeting lower-risk indications first.
Market Impact: Expands glucose sensor shipments 45 percent

Semiconductor Supply Constraints Limit Production Scaling

Advanced sensor manufacturing depends on specialized semiconductor fabrication capacity that remains constrained industry-wide, forcing component makers to compete with other electronics categories for limited foundry allocation during periods of peak demand and seasonal ordering cycles. The underlying cause is finite global fabrication capacity for the specialized process nodes wearable sensors require, a constraint that cannot be resolved quickly given multi-year foundry construction timelines. This dynamic has extended component lead times by an estimated 30 percent during recent demand surges. Some makers mitigate this by securing long-term capacity reservation agreements with foundry partners.
Market Impact: Cuts fusion cost 22 percent
3 additional market trends, 4 additional growth drivers, and 3 additional restraints and challenges are covered in the full report. Contact sales@marketmindsadvisory.com to access the complete intelligence.

Segment CAGR and Growth Architecture

Segmentation follows sensing technology and function, the dimension component makers and device brands use most consistently to evaluate design-win potential and margin profile across the industry and every product category. Six segments span the full sensing spectrum from basic motion detection through emerging chemical biosensing, reflecting the market's ongoing shift toward clinical-grade capability and regulatory validation.
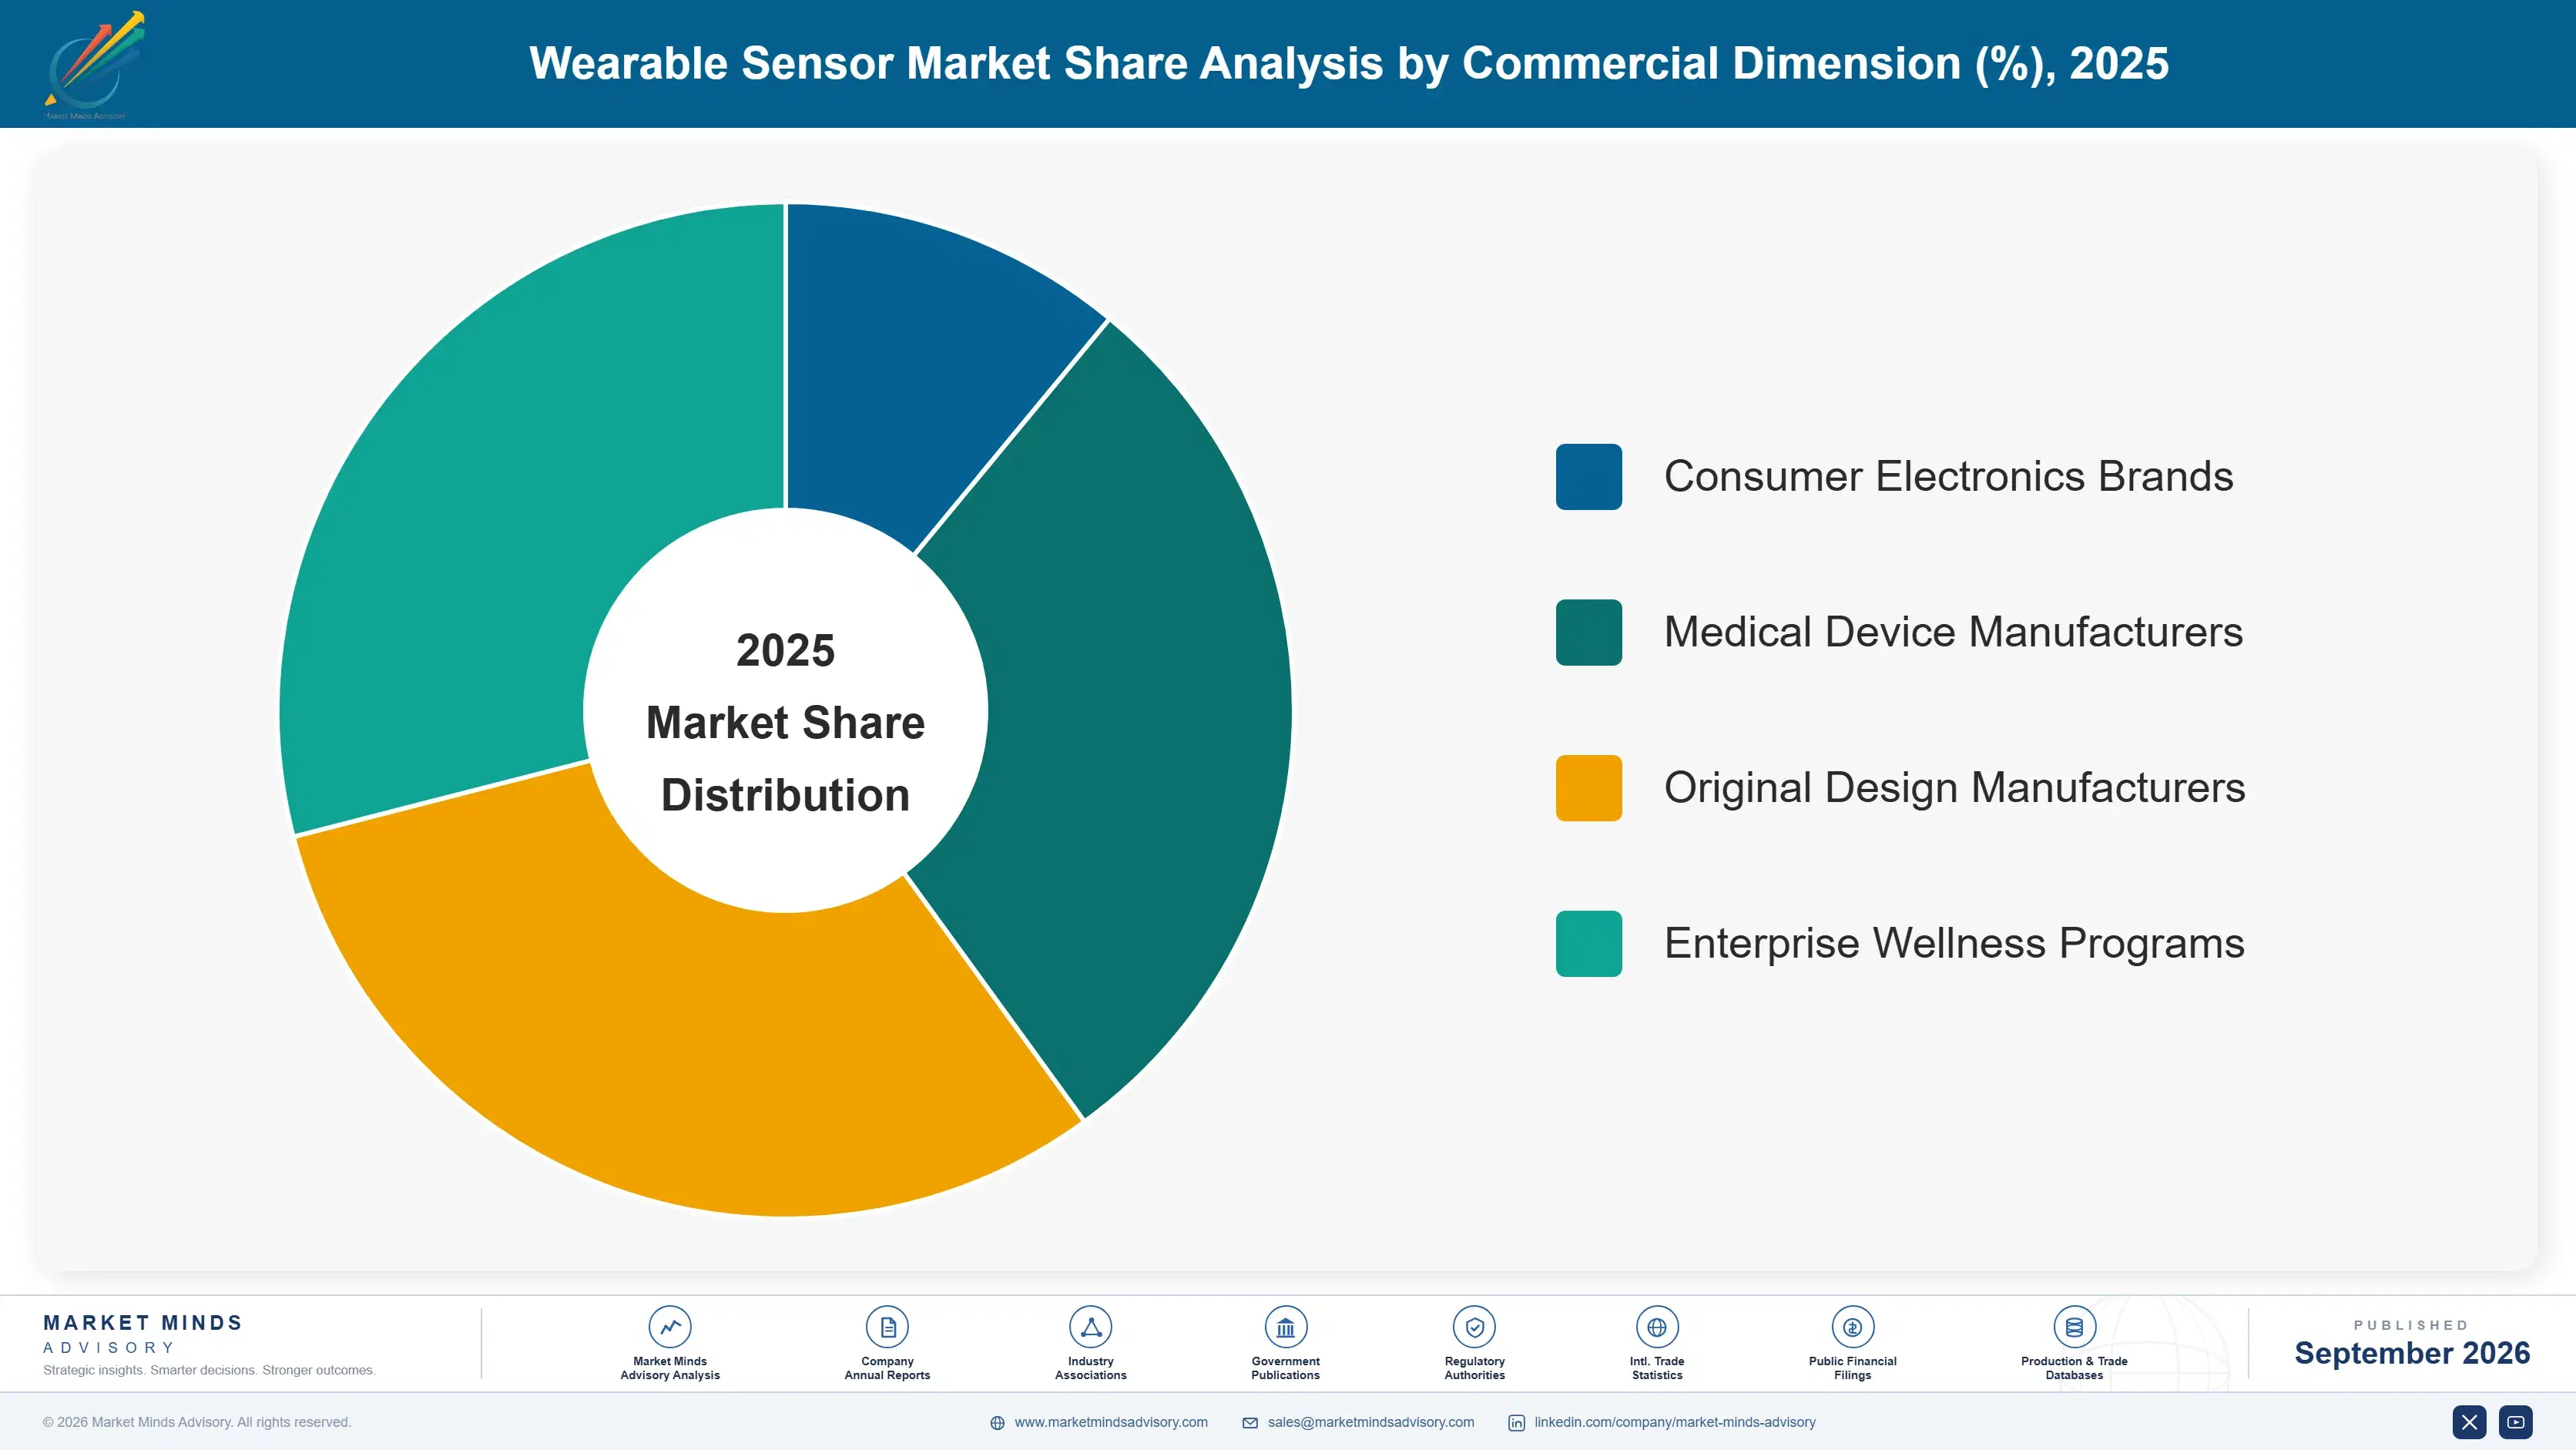
wearable-sensor-market-market-share-analysis-1788503394828

Chemical and Biosensors

This segment covers sensors capable of detecting glucose, lactate, and other biochemical markers directly from sweat or interstitial fluid, representing the newest and most technically demanding category in wearable sensing today and by far the fastest-growing segment overall across the entire portfolio and full product roadmap. Adoption is accelerating sharply as regulatory clearance for over-the-counter continuous glucose monitoring wearables opens a substantially larger addressable market beyond diagnosed diabetic patients toward general wellness consumers seeking preventive health insight and daily metabolic awareness. Component makers capable of miniaturizing electrochemical sensing technology into consumer-durable form factors increasingly win design contracts with major device makers racing to differentiate on clinical-grade capability and regulatory clearance.
CAGR 17.2%

Biometric and Physiological Sensors

This segment covers optical heart rate, blood oxygen, and electrocardiogram sensing capability that has moved from premium smartwatch feature into mainstream expectation across nearly every wearable price tier, device category, and consumer demographic worldwide today and across every major global region and market. Growth is driven by expanding regulatory clearance for arrhythmia detection features and growing consumer expectation that even entry-level fitness bands include comprehensive biometric monitoring capability comparable to premium devices at similar accuracy levels and reliability standards throughout. Component makers offering the most accurate optical sensing at the lowest power consumption increasingly win design contracts across both premium and mass-market device categories simultaneously, consistently, and reliably each year.
CAGR 14.0%
Full segment breakdown across 6 segments available in the complete report.

Regional Architecture and Country Demand Map

Component manufacturing concentrates wherever consumer electronics assembly and semiconductor fabrication capacity clusters most densely, rather than following end-consumer purchasing patterns worldwide. East Asia generates well over a third of global revenue given its manufacturing base, though device design and brand value still concentrate elsewhere entirely.

North America

US device brands anchor premium wearable design and command the deepest R&D investment in next-generation sensing technology, even though actual component manufacturing occurs predominantly overseas across Asian foundries and assembly plants. Medical device regulatory expertise concentrated domestically accelerates clinical-grade sensor clearance for American brands specifically, giving them a genuine speed-to-market advantage over overseas competitors. Canadian sensor research institutions contribute meaningful innovation in emerging biosensing categories, particularly around non-invasive glucose monitoring technology still working through regulatory approval processes. Vendors succeeding here typically maintain close design collaboration with domestic device brands throughout the product development cycle. This collaboration accelerates time to market considerably compared to arrangements involving purely overseas suppliers and distant engineering teams.
Share: 24% | CAGR: 11.0% (2026 to 2036)

Western Europe

German automotive and industrial sensor expertise increasingly extends into medical-grade wearable applications, applying decades of precision sensor manufacturing experience gained from adjacent industrial sectors. Nordic markets favor premium wearable brands given high disposable income and strong consumer trust in continuous health monitoring technology broadly across every age group. British and French medical device regulatory frameworks, operating under European Union oversight, create additional certification requirements that sensor makers must navigate before launching clinical-grade wearable products across the broader European market and its many national health systems. Vendors expanding here increasingly partner with automotive-heritage sensor makers rather than pursuing standalone market entry alone. This partnership model preserves access to specialized precision manufacturing expertise unavailable through purely domestic sensor development alone.
Share: 18% | CAGR: 9.0% (2026 to 2036)
Regional intelligence for 5 additional markets available in the complete report: East Asia, South Asia and Pacific, Latin America, Middle East and Africa, Eastern Europe. Contact sales@marketmindsadvisory.com.
wearable-sensor-market-country-cagr-analysis-1788503395336

Capturing Value From Sensing Depth

Component makers capture incremental revenue through four distinct mechanisms tied to genuine sensing capability rather than generic unit pricing alone or arbitrary tier naming conventions used elsewhere. Together these levers determine which suppliers compound design-win value fastest as device makers demand deeper, more clinically credible sensing across every wearable category, price tier, and product generation.

Premium Pricing for Clinical-Grade Sensor Accuracy

Component makers increasingly charge substantially elevated prices, typically 30 to 40 percent above baseline consumer pricing, for sensors carrying medical-grade regulatory clearance, justified by the extensive clinical validation and quality system investment required to achieve that certification status across every jurisdiction, product category, target market, and regulatory regime worldwide today. This pricing separates commodity consumer sensing revenue from differentiated clinical revenue, letting suppliers capture value proportional to genuine validation cost. Device makers pursuing medical-grade product positioning increasingly accept these premiums once alternative unclinically validated suppliers prove unsuitable for regulatory submission.
Market Impact: Adds a 30 to 40 percent clinical pricing premium

Reference Design Licensing Revenue Stream Model

Component makers increasingly license complete reference designs bundling sensor silicon, firmware, and validated algorithms to smaller device makers lacking in-house sensor integration expertise, generating incremental licensing revenue equal to roughly 8 to 12 percent of total component sales beyond standard hardware margins across every product line. This model appeals particularly to smaller consumer electronics brands seeking faster time to market without building dedicated sensor engineering teams internally from scratch or costly acquisitions. Component makers offering the most complete, field-tested reference designs increasingly win these licensing engagements over competitors offering component-only sales.
Market Impact: Generates 8 to 12 percent of segment revenue

Multi-Sensor Fusion Bundle Pricing Strategy Model

Component makers increasingly bundle multiple sensor types with integrated fusion processing into single packaged modules, commanding premium pricing typically 18 to 25 percent above individual sensor components sold separately to device makers assembling systems independently, manually, and without vendor support themselves. This bundling captures value from the substantial engineering effort required to fuse multiple sensor streams into unified, calibrated health metrics that device makers would otherwise need to develop internally themselves at considerable cost and delay. Device makers increasingly prefer these integrated bundles, accepting premium pricing for faster development timelines.
Market Impact: Adds 18 to 25 percent bundle pricing premium

Software and Algorithm Licensing Attachment Fee

Component makers increasingly attach proprietary signal processing algorithms and health metric calculation software to hardware sales, generating recurring per-unit licensing fees that continue well after the initial component sale transaction completes and ships to global customers. This revenue stream often generates margins exceeding 2 dollars per unit for suppliers offering the most clinically validated algorithm packages, since algorithm development requires specialized data science expertise few smaller competitors possess in-house today or in the near future. This attachment model also deepens customer relationships considerably, since switching component suppliers means redeveloping calibration algorithms entirely from scratch.
Market Impact: Adds over 2 dollars in recurring per-unit revenue

Who Controls the Margin Pool

The competitive field carries meaningfully high concentration, with a CR5 of 46 percent reflecting the substantial semiconductor design and manufacturing expertise required to compete credibly at scale. STMicroelectronics leads decisively on design-win breadth and motion sensor market share, and the gap between STMicroelectronics and the second-ranked challenger remains genuinely wide, reflecting years of accumulated automotive and consumer electronics design experience.
Current competitive activity centers on embedding chemical biosensing capability natively rather than through separate discrete components, as suppliers race to demonstrate clinical-grade accuracy ahead of tightening medical device regulatory scrutiny across every major market. Suppliers are also expanding reference design licensing and algorithm bundling capability to deepen device maker switching cost, a dimension growing faster than traditional discrete component sales as integration complexity rises.

Emerging pressure comes from specialized biosensor startups like Sensirion expanding into chemical sensing categories, directly challenging incumbent motion and optical sensor suppliers on emerging technology depth rather than competing purely on price. Rankings are most likely to shift among mid-tier challengers competing for mass-market fitness band contracts, rather than at the very top where STMicroelectronics's design-win breadth continues to favor the established leader significantly.
wearable-sensor-market-company-positioning-matrix-1788503395860

Competitive Moat and Risk Dimensions

STMICROELECTRONICS NV

Moat: Design-win breadth and scale

STMicroelectronics supplies motion sensing components to the majority of leading wearable device brands, built through years of accumulated automotive and consumer electronics design expertise that few competitors can match at comparable manufacturing scale. This design-win breadth compounds as satisfied device makers expand component attachment into adjacent sensing categories during every product refresh cycle.
STMICROELECTRONICS NV

Risk: Narrower chemical sensing depth

STMicroelectronics historically prioritized motion and inertial sensing over the chemical biosensing capability increasingly demanded by device makers pursuing medical-grade product differentiation across multiple wearable categories. Specialized biosensor startups with deeper chemical sensing expertise increasingly win design contracts for glucose and lactate monitoring applications specifically, eroding STMicroelectronics's position in that segment.
BOSCH SENSORTEC GMBH

Moat: MEMS manufacturing precision

Bosch Sensortec operates highly precise micro-electromechanical systems manufacturing capability inherited from Bosch's broader automotive and industrial sensor heritage, giving it genuine accuracy advantages in motion and environmental sensing categories. This manufacturing precision creates switching costs that competitors lacking equivalent automotive-grade quality systems cannot easily replicate.
BOSCH SENSORTEC GMBH

Risk: Limited consumer brand visibility

Bosch Sensortec operates primarily as a component supplier lacking the direct consumer brand visibility that some competitors gain through parent company consumer electronics divisions and established marketing channels. This limits opportunities for bundled reference design deals that some rivals increasingly offer to smaller device makers seeking turnkey solutions.

Players Tracked

Prominent Players

STMicroelectronics NV
Bosch Sensortec GmbH
Analog Devices Inc
TDK Corporation
Texas Instruments Incorporated

Other Key Players

Knowles Corporation
ams OSRAM AG
NXP Semiconductors NV
Infineon Technologies AG
Murata Manufacturing Co Ltd
Broadcom Inc
Qualcomm Incorporated
Sensirion AG
MEMSIC Semiconductor Corporation
ROHM Co Ltd
Panasonic Corporation
Vishay Intertechnology Inc
Sensata Technologies Holding plc
Honeywell International Inc
Renesas Electronics Corporation

Recent Developments

SEPTEMBER 2025

STMicroelectronics Launches Integrated Biosensor Module

STMicroelectronics launched an integrated multi-sensor module combining motion, optical, and preliminary chemical sensing capability into a single packaged component, reducing device maker integration complexity and strengthening its competitive position ahead of expanding medical-grade wearable demand across every major device category, price tier, and regional market.
Signal: Signals leading suppliers racing to bundle chemical sensing capability into unified reference design packages today and going forward.
DECEMBER 2025

Bosch Sensortec Expands Automotive-Grade Manufacturing

Bosch Sensortec announced expanded manufacturing capacity dedicated specifically to automotive-grade quality wearable sensors, targeting device makers pursuing medical-grade regulatory clearance requiring documented manufacturing consistency far exceeding standard consumer electronics production quality standards across every product line, category, target market, design generation, and manufacturing geography worldwide.
Signal: Signals continued vendor investment in manufacturing quality systems to support medical-grade clearance pathways broadly and consistently.
MARCH 2026

Analog Devices Acquires Chemical Sensing Startup

Analog Devices acquired a specialized chemical biosensing startup to strengthen its glucose and lactate monitoring capability, adding proprietary electrochemical sensing technology that rival component suppliers currently lack in comparable form, reinforcing its position among device makers pursuing clinical differentiation, regulatory approval, and long-term market leadership.
Signal: Signals continued consolidation toward chemical biosensing capability among leading wearable sensor component suppliers worldwide and beyond.

Semiconductor Fabrication Cost Exposure

Semiconductor fabrication and packaging account for roughly 60 to 70 percent of sensor component cost of goods sold, sourced primarily from specialized foundries concentrated in Taiwan, South Korea, and increasingly mainland China and Japan. Rare earth and specialty chemical inputs required for certain chemical biosensing elements represent a smaller but growing input as biosensor production scales.
Semiconductor foundry pricing rose meaningfully through 2024 and into 2025 as demand for specialized process nodes outpaced available fabrication capacity amid broader chip industry competition and rising AI compute demand, according to Taiwan's national statistical reporting on semiconductor export values. Component makers competing for constrained foundry allocation absorbed noticeably higher fabrication costs during this period, squeezing margins for smaller suppliers lacking long-term capacity reservation agreements.

Smaller component makers lacking long-term foundry relationships face a genuine cost disadvantage against larger competitors like STMicroelectronics and Texas Instruments, which secure priority capacity allocation and volume discount pricing through decades of accumulated foundry partnership and scale. This dynamic favors scale incumbents in price-sensitive consumer sensor segments, since undercapitalized challengers cannot sustain premium spot-market fabrication pricing without compressing margins below sustainable levels for long.
wearable-sensor-market-cost-volatility-analysis-1788503396062

Long-Term Foundry Capacity Reservation Agreements

Some component makers negotiate multi-year reserved capacity commitments directly with semiconductor foundries, locking in discounted fabrication pricing well below prevailing spot-market rates in exchange for guaranteed minimum order volume commitments spanning their entire product portfolio, every planned device generation, and every anticipated product refresh cycle over the coming multi-year horizon and well beyond that.

Multi-Foundry Sourcing to Reduce Concentration Risk

Leading suppliers qualify sensor designs across multiple foundry partners simultaneously rather than depending entirely on a single fabrication source, using competitive bidding to secure better pricing terms while reducing exposure to any single foundry's capacity constraints, disruption, unexpected pricing changes, or geopolitical risk during periods of especially tight global supply and steadily rising demand.

Design Simplification to Reduce Process Node Requirements

Some component makers redesign sensor architectures quite deliberately to use less advanced, more widely available process nodes where performance requirements allow, trading marginal accuracy or power efficiency gains for meaningfully lower fabrication cost and reduced exposure to constrained leading-edge foundry capacity during periods of peak industry-wide demand, shortage, and especially tight capacity allocation nationwide.

Portfolio Architecture for Margin Defence

The wearable sensor field splits cleanly between commodity motion sensing priced near marginal cost and premium chemical and medical-grade biosensing commanding meaningfully higher unit prices through genuine clinical validation investment and regulatory clearance. Gross margin architecture reflects this split directly, with clinical-grade tiers generating substantially wider margins than basic motion sensing functionality sold mostly on price to mass-market device makers.
Volume motion sensing revenue still dominates unit count across mass-market fitness bands and basic smartwatches, but premium chemical biosensing revenue is growing faster and increasingly drives new component maker investment decisions across the industry. Suppliers face a genuine tension allocating engineering resources between defending baseline motion sensing share against low-cost entrants and building premium biosensing capability that commands durable pricing power over multi-year design-win contracts.

High-value margin pools concentrate overwhelmingly in medical-grade device accounts adopting full biosensing suites bundled with algorithm licensing and reference design support, rather than in standalone motion sensors sold individually to mass-market device makers. Component makers capturing this bundled premium tier increasingly separate themselves from commodity competitors on realized design-win economics, even where headline unit pricing looks broadly comparable across the field today.

Volume / Commodity-Adjacent Tier

Basic motion and inertial sensing components priced near marginal cost, generating gross margins of roughly 35 to 42 percent as suppliers compete primarily on price and volume for mass-market device makers.
Gross Margin: 35-42%

Premium / Certified Tier

Biometric and physiological sensors bundled with algorithm licensing and reference design support, generating gross margins of roughly 48 to 56 percent through demonstrated accuracy, reliability, integration convenience, and support quality.
Gross Margin: 48-56%

Sustainability / Regulatory / Next-Generation Tier

Medical-grade chemical biosensors carrying regulatory clearance commanding gross margins of roughly 55 to 65 percent as device makers pursue clinical differentiation and premium positioning strategies across every product category consistently.
Gross Margin: 55-65%
wearable-sensor-market-portfolio-architecture-1788503396556

High-value Sub-segments and Strategic Watch-out

Chemical and Biosensors

This segment commands the widest gross margins in the entire portfolio while growing fastest at 17.2 percent, driven by device makers demanding documented, clinically validated glucose and lactate sensing across every major wearable device category each design cycle and every annual product refresh decision approved.
Gross Margin: 55-65%

Biometric and Physiological Sensors

Biometric and physiological sensors generate strong margins with steady, fast growth as heart rate, oxygen, and electrocardiogram sensing become baseline expectations across nearly every wearable price tier and consumer demographic each generational product refresh, design cycle, annual planning decision, and budget cycle globally and domestically.
Gross Margin: 48-56%

Motion and Inertial Sensors

This segment anchors overall unit volume and remains the largest revenue contributor today, even as its relative growth rate trails premium biometric and chemical sensing tiers across most mass-market and premium device accounts evaluating design-win decisions each product cycle, refresh, annual strategic review, and budget planning session.
Gross Margin: 35-42%

Temperature and Environmental Sensors

Standalone discrete temperature and environmental sensors face gradual displacement as integrated multi-sensor fusion modules absorb this functionality alongside broader sensing capability, leaving standalone component vendors exposed to shrinking addressable demand over the coming decade unless they consolidate further, pivot toward adjacent categories, or exit entirely.
Gross Margin: 32-40%

Design-Win Economics of Sensor Suppliers

Wearable sensor supply runs on multi-year design-win contracts tied to specific device generations, producing recurring revenue that compounds as component makers expand attachment across successive product refresh cycles from the same device maker and adjacent product lines. Design-win retention exceeds 80 percent across consecutive device generations once a sensor supplier's components pass qualification testing, since switching suppliers requires costly requalification and potential redesign risk.
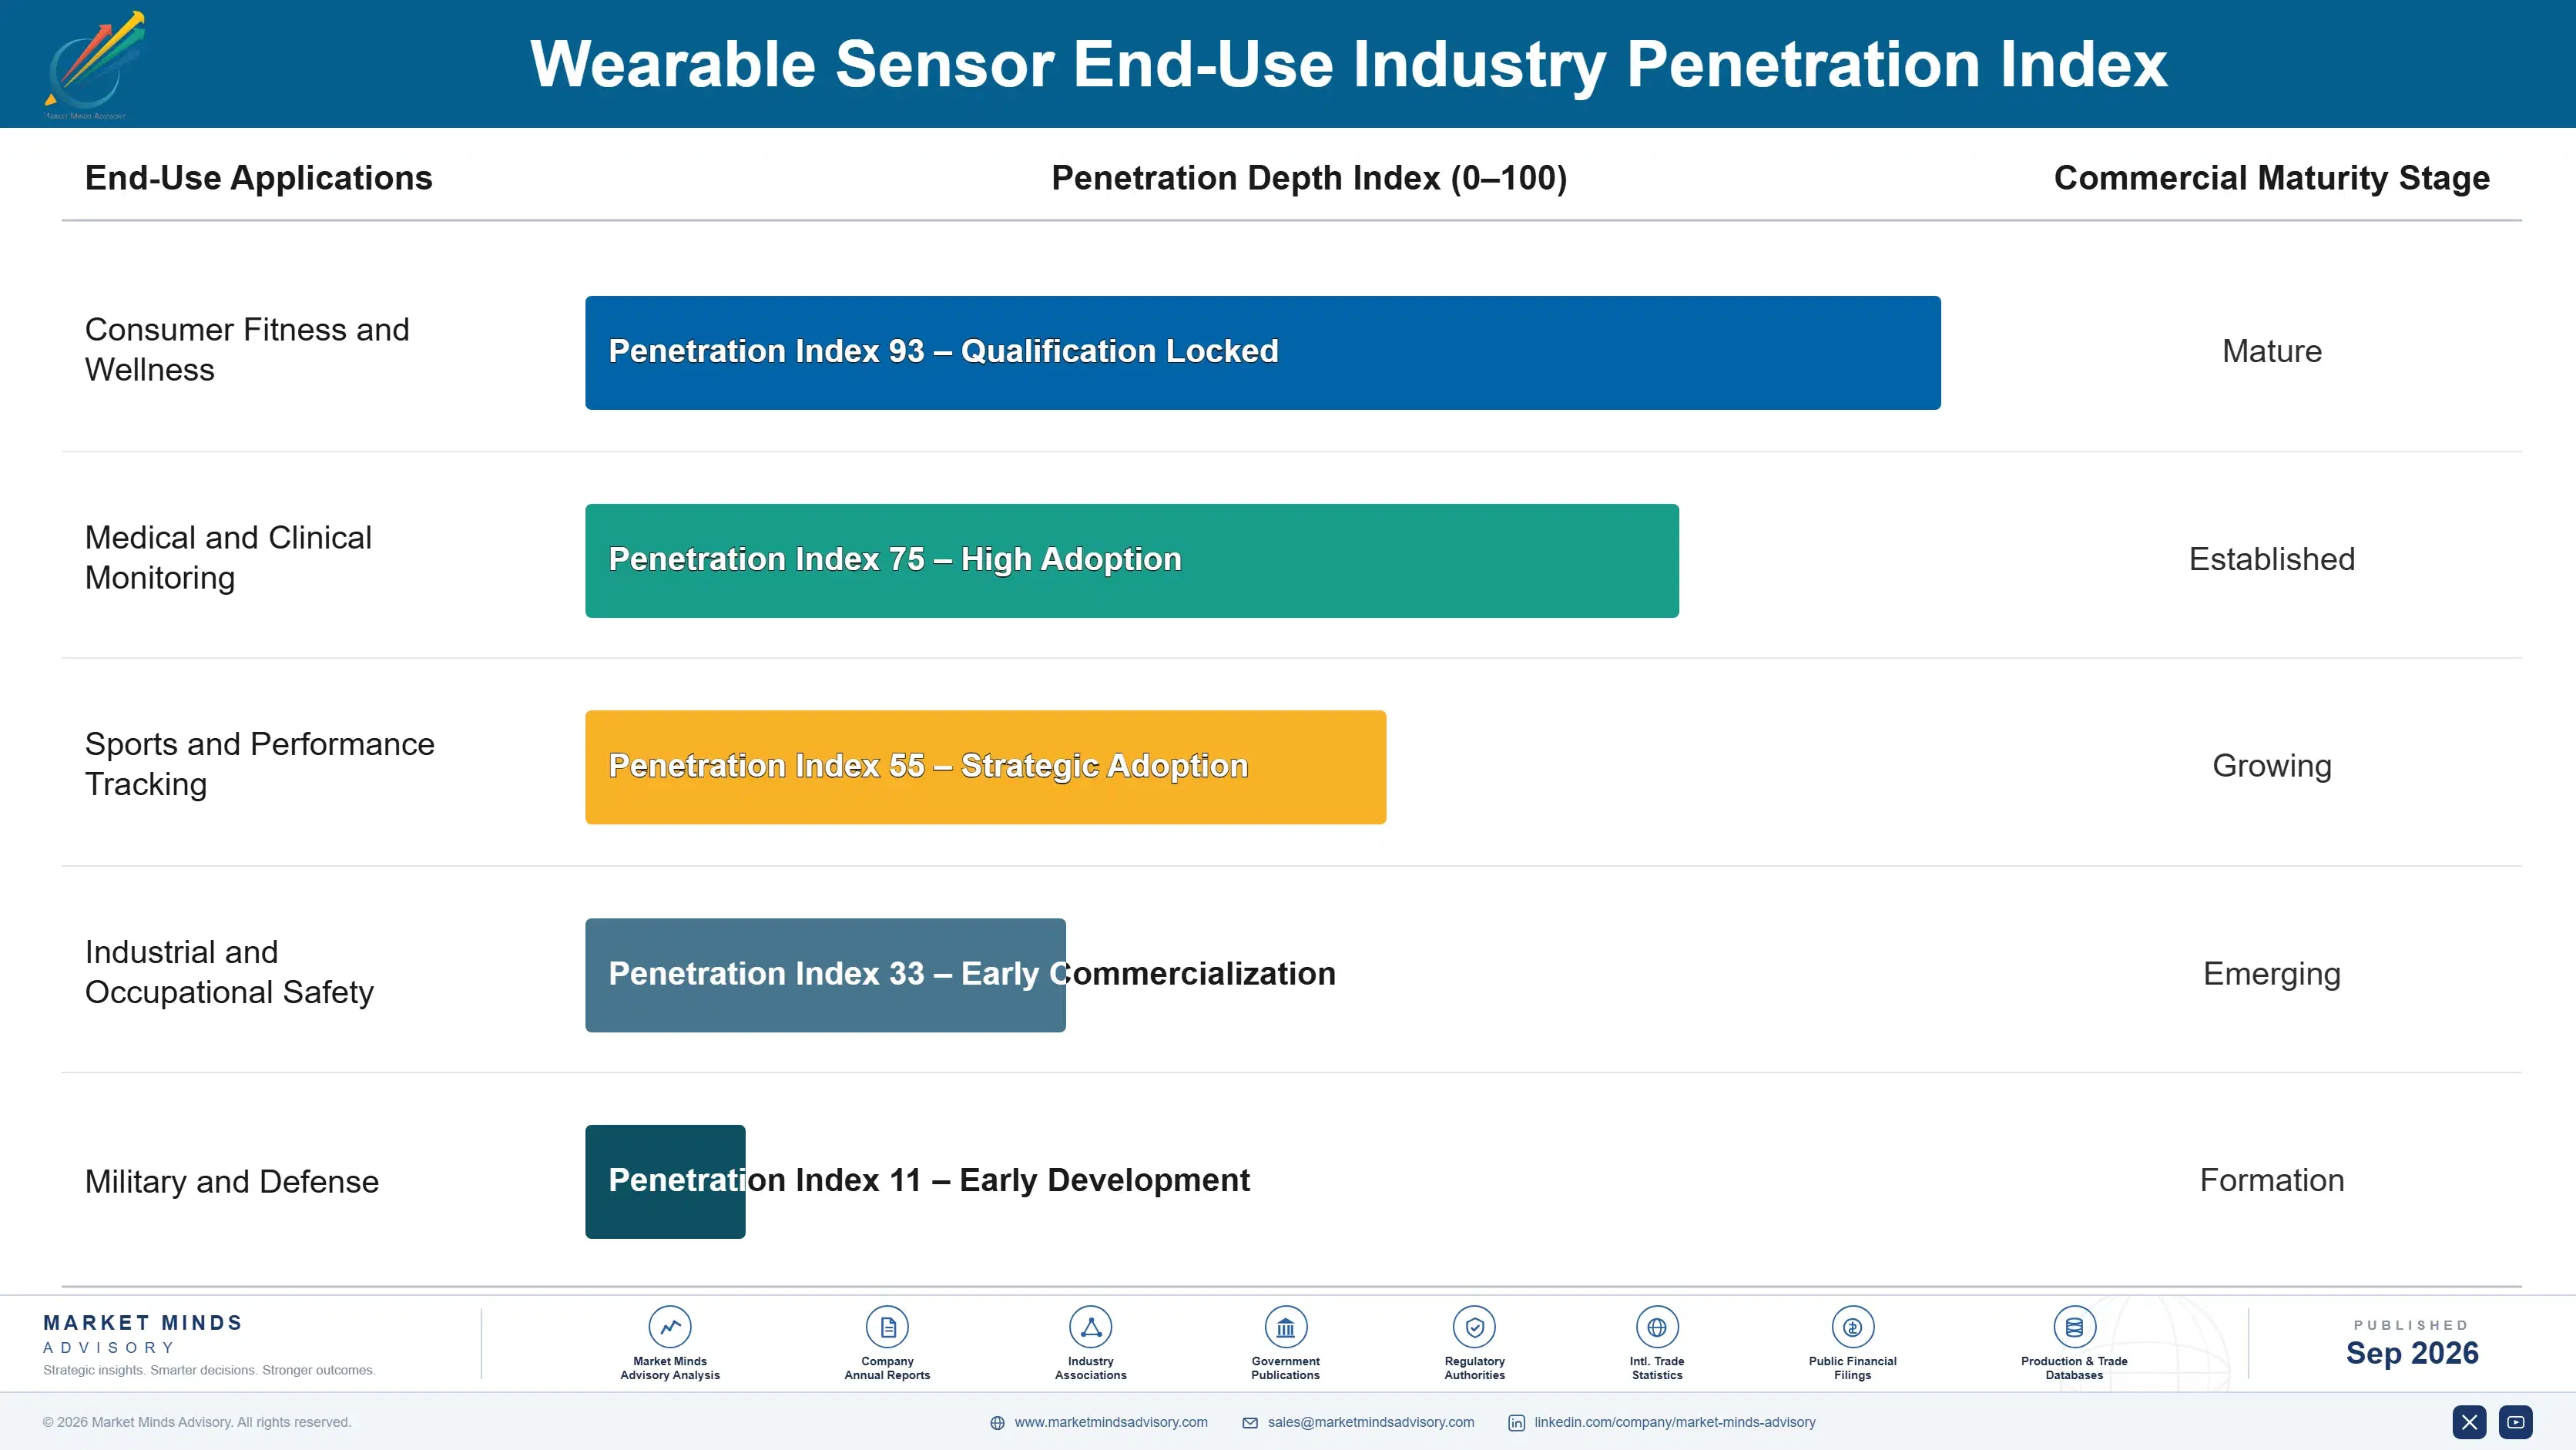
Adoption depth varies meaningfully by end-use vertical across the device category and price tier. Premium smartwatches embed the deepest sensor suites, often including five or more distinct sensor types spanning motion, biometric, and environmental categories, while basic fitness bands typically use only motion and heart rate sensing capability. Medical-grade wearables show the fastest-growing adoption depth, layering chemical biosensors atop traditional motion and biometric capability entirely.

Buyer profiles are shifting generationally as digitally native hardware engineering teams replace veteran component procurement specialists who once prioritized cost above all other selection criteria and considerations. Younger buyers expect integrated reference designs and rapid prototyping support by default, pushing component makers to prioritize software and firmware support over the pure hardware specifications that once defined competitive advantage in this market.
wearable-sensor-market-end-use-penetration-index-1788503397058

Priorities for Sensor Component Investors

These are among the four positions where our research anticipates prominent divergence between winners and laggards over the coming forecast period. Each is grounded in the demand model, the regulatory perimeter, and the announced capacity pipeline.
01 / BIOSENSING INVESTMENT PRIORITY

Prioritize Chemical Biosensing Over Motion Sensing Breadth

Component makers that under-invest in chemical biosensing capability will lose design wins to rivals offering documented glucose and lactate monitoring accuracy ahead of tightening medical device regulatory scrutiny worldwide and across every jurisdiction. Analog Devices and Sensirion already lead decisively on this dimension, and the gap compounds each design cycle as satisfied device makers expand attachment scope into adjacent biosensing categories and product lines. Smaller suppliers should concentrate engineering resources narrowly on biosensing depth rather than chasing broad, undifferentiated motion sensing parity across every device category.
02 / REFERENCE DESIGN DEVELOPMENT PRIORITY

Build Reference Design Depth Before Demand Peaks

Reference design licensing increasingly separates leading component suppliers from commodity competitors, since device makers value platforms offering proven multi-sensor fusion capability without lengthy custom integration delays or extensive engineering rework each time requirements shift. Suppliers lacking meaningful reference design depth face a widening disadvantage as leaders expand licensing wins through targeted algorithm investment across multiple device categories and price tiers. Acting early to build genuine reference design depth costs considerably less than catching up after rivals lock in exclusive device maker partnerships for good.
03 / MASS-MARKET DEFENSE STRATEGY

Defend Mass-Market Accounts Against Low-Cost Entrants

Low-cost Asian challengers are targeting mass-market fitness band makers with cheaper commodity motion sensors, directly threatening the account base that established suppliers depend on for stable recurring revenue growth each fiscal year across the industry. Established suppliers must respond with competitive volume pricing and simplified integration paths rather than assuming premium brand relationships alone will protect their broader market position over the coming decade. Losing mass-market share now weakens future upsell potential considerably across the account base and narrows the addressable pipeline.
04 / FOUNDRY CAPACITY DISCIPLINE

Secure Foundry Partnerships to Protect Margins

Component makers competing for scarce leading-edge foundry capacity without differentiated supplier relationships face meaningful margin compression as fabrication costs rise faster than unit pricing can absorb without triggering device maker pushback at contract renewal negotiations each cycle. Long-term capacity reservation agreements and multi-foundry sourcing strategies protect gross margins meaningfully over multi-year planning horizons across the entire deployed product portfolio and every sensor category offered. Component makers that delay this discipline risk ceding pricing power entirely to better-capitalized competitors within a relatively short number of years going forward from today.

Engagement Snapshot From the Field

A live engagement with an industry participant carrying material or product regulatory and market exposure ahead of a defining policy shift, showing how our research translates into a defensible multi-year portfolio strategy.
MARKET MINDS ADVISORY · CLIENT ENGAGEMENT SUMMARY
Wearable Sensor Producer Strategic Portfolio Review and Transition Roadmap 2026·Investment Scenario on Wearable Sensor Exposure Evaluation 2025-26
CLIENT PROFILE
The client is a mid-tier fitness wearable brand generating roughly 180 million dollars in annual revenue (client-reported, unverified by MMA), shipping approximately 2.5 million units annually across entry-level and mid-range price tiers globally. The client historically sourced motion sensors from a single supplier but sought to add biometric sensing capability to compete with premium rivals.
STRATEGIC CHALLENGE
The client faced pressure from premium competitors offering comprehensive biometric monitoring while its product line remained limited to basic step counting and sleep tracking. Leadership needed an independent evaluation of biometric sensor suppliers before committing to a costly product redesign given limited internal sensor engineering expertise and a compressed development timeline.
MMA APPROACH
MMA conducted a structured evaluation spanning five biometric sensor suppliers, benchmarking accuracy performance, power consumption, reference design completeness, and total component cost against the client's target price point and existing manufacturing partnerships. The engagement combined technical benchmarking, supplier capability scoring, and quantitative modeling of total landed cost across production volume scenarios.
KEY FINDINGS
  1. Two of five evaluated suppliers offered complete reference designs bundling sensor silicon and validated algorithms, reducing projected engineering integration time substantially compared to component-only alternatives.
  2. Optical heart rate sensor accuracy varied by nearly 15 percent across evaluated suppliers when tested against clinical-grade reference equipment under realistic movement conditions.
  3. Total component cost per unit varied by almost 40 percent across evaluated suppliers once reference design licensing fees and volume discount tiers were factored into realistic annual shipment projections.
  4. The client's existing manufacturing partner already maintained a qualified relationship with one evaluated supplier, potentially accelerating production timeline by several months if selected.
CLIENT PROFILE
The client is a mid-tier fitness wearable brand generating roughly 180 million dollars in annual revenue (client-reported, unverified by MMA), shipping approximately 2.5 million units annually across entry-level and mid-range price tiers globally. The client historically sourced motion sensors from a single supplier but sought to add biometric sensing capability to compete with premium rivals.
STRATEGIC CHALLENGE
The client faced pressure from premium competitors offering comprehensive biometric monitoring while its product line remained limited to basic step counting and sleep tracking. Leadership needed an independent evaluation of biometric sensor suppliers before committing to a costly product redesign given limited internal sensor engineering expertise and a compressed development timeline.
MMA APPROACH
MMA conducted a structured evaluation spanning five biometric sensor suppliers, benchmarking accuracy performance, power consumption, reference design completeness, and total component cost against the client's target price point and existing manufacturing partnerships. The engagement combined technical benchmarking, supplier capability scoring, and quantitative modeling of total landed cost across production volume scenarios.
KEY FINDINGS
  1. Two of five evaluated suppliers offered complete reference designs bundling sensor silicon and validated algorithms, reducing projected engineering integration time substantially compared to component-only alternatives.
  2. Optical heart rate sensor accuracy varied by nearly 15 percent across evaluated suppliers when tested against clinical-grade reference equipment under realistic movement conditions.
  3. Total component cost per unit varied by almost 40 percent across evaluated suppliers once reference design licensing fees and volume discount tiers were factored into realistic annual shipment projections.
  4. The client's existing manufacturing partner already maintained a qualified relationship with one evaluated supplier, potentially accelerating production timeline by several months if selected.
RECOMMENDED STRATEGY
Phase 1: Phase 1 (Months 1 to 2): Select the top-scoring supplier and finalize reference design licensing terms for the new product line. Phase 2: Phase 2 (Months 3 to 6): Integrate the biometric sensor module and validate accuracy performance against clinical benchmark equipment thoroughly. Phase 3: Phase 3 (Months 7 to 9): Complete manufacturing qualification and launch the new biometric-enabled product line to market successfully worldwide.
OUTCOME
The client launched its biometric-enabled product line within the original nine-month timeline, achieving accuracy performance within 3 percent of premium competitor devices (client-reported, unverified by MMA). Leadership credited the structured supplier evaluation with avoiding a costly accuracy shortfall that internal engineering staff had initially underestimated.

Frequently Asked Questions

Foundational context covering the market sizes, CAGR, scope, country, region and competition that inform every finding below. This section is provided to cover basics and most often pre-purchase conversations, answered from the MMA Primary Research Dataset.

What is the current size of the Wearable Sensor Market?

The Wearable Sensor Market reached 26.5 billion dollars in base year 2025. Growth is driven by chemical biosensing adoption and expanding medical-grade wearable capability worldwide.

How large will the Wearable Sensor Market be by 2036?

The market is projected to reach 79.47 billion dollars by 2036, representing a 2.71 times expansion over the 2026 base value of 29.28 billion dollars across the ten-year forecast window.

What is the CAGR for the Wearable Sensor Market 2026 to 2036?

The market is forecast to grow at a 10.5 percent compound annual growth rate between 2026 and 2036, with bull and bear scenarios ranging from 9.3 to 11.7 percent respectively.

Which segment is growing fastest?

Chemical and Biosensors leads at 17.2 percent CAGR, roughly 1.64 times the overall market rate, driven by continuous glucose monitoring expansion into mainstream consumer wearables.

Who are the major companies in the Wearable Sensor Market?

STMicroelectronics, Bosch Sensortec, Analog Devices, TDK, and Texas Instruments lead the field, together holding a CR5 of 46 percent given substantial semiconductor design expertise required.

Which country is growing fastest?

India leads at 14.0 percent CAGR, driven by rapid smartphone-adjacent wearable adoption and affordable fitness band penetration across price-sensitive consumer segments and smaller cities nationwide.

Report Segmentation Architecture

The full report scope spans multiple orthogonal segmentation dimensions, with cross-tabulated demand data provided for each dimension pair. Coverage extends further to regional breakdowns, trend trajectories, and the competitive detail needed to support segment-level decision-making.

By Primary Market Dimension

  • Motion and Inertial Sensors
  • Biometric and Physiological Sensors
  • Temperature and Environmental Sensors
  • Optical and Photoplethysmography Sensors
  • Pressure and Force Sensors
  • Chemical and Biosensors

By End-Use Industry

  • Consumer Fitness and Wellness
  • Medical and Clinical Monitoring
  • Sports and Performance Tracking
  • Industrial and Occupational Safety
  • Military and Defense

By Commercial Dimension

  • Consumer Electronics Brands
  • Medical Device Manufacturers
  • Original Design Manufacturers
  • Enterprise Wellness Programs

By Region

  • North America
  • Western Europe
  • East Asia
  • South Asia and Pacific
  • Latin America
  • Middle East and Africa
  • Eastern Europe

Scope, Methodology, and Coverage

Every figure in this report is reproducible from documented input assumptions. The scope below maps the historical period, the forecast horizon, the segmentation dimensions, and the countries covered, alongside the underlying primary and qualitative methodology.
Historical Period
2020 to 2025
Forecast Period
2026 to 2036
Base Year
2025 (USD billions; MMA Primary Research Dataset, September 2026)
Market Definition
The Wearable Sensor Market comprises sensor components embedded in wrist-worn, ear-worn, and body-worn consumer and medical devices for motion, biometric, and environmental data capture. It excludes complete wearable devices, smartphone-embedded sensors, and standalone medical diagnostic equipment entirely.
Quantitative Units
USD billions (current prices); market share percentages; compound annual growth rates
Segmentation Dimensions
By Primary Market Dimension; By End-Use Industry; By Commercial Dimension; By Region
Regions Covered
North America, Western Europe, East Asia, South Asia and Pacific, Latin America, Middle East and Africa, Eastern Europe
Countries Covered
USA, China, Germany, France, UK, Japan, South Korea, India, Australia, Canada, Brazil, Mexico, Indonesia, Vietnam, Thailand, Malaysia, UAE, Saudi Arabia, South Africa, Nigeria, Turkey, Poland, Netherlands, Italy, Spain, Sweden, Switzerland, Argentina, Colombia, Singapore, and additional markets relevant to this sector
Key Companies Profiled
STMicroelectronics NV, Bosch Sensortec GmbH, Analog Devices Inc, TDK Corporation, Texas Instruments Incorporated, Knowles Corporation, ams OSRAM AG, NXP Semiconductors NV, Infineon Technologies AG, Murata Manufacturing Co Ltd, Broadcom Inc, Qualcomm Incorporated, Sensirion AG, MEMSIC Semiconductor Corporation, ROHM Co Ltd, Panasonic Corporation, Vishay Intertechnology Inc, Sensata Technologies Holding plc, Honeywell International Inc, Renesas Electronics Corporation
Quantitative Methodology
Primary survey, n=3,800 respondents, Q4 2025, six countries; demand-side model with trade association cross-validation
Qualitative Methodology
47 expert interviews, Q4 2025; applied to validate demand model assumptions, identify emerging dynamics, and assess competitive positioning
Report Format
PDF and XLSX data workbook (Word format preview document)
Publisher
Market Minds Advisory
Report Code
MMA-2026-TEC-729
Published
September 2026
Contact
sales@marketmindsadvisory.com | www.marketmindsadvisory.com

Purchase the full Wearable Sensor Market Report (2026 to 2036).

This report delivers a comprehensive assessment of the global Wearable Sensor Market, covering demand drivers, competitive dynamics, and regional manufacturing patterns across component makers and device brands worldwide. It includes detailed segmentation analysis, five-year and ten-year forecast scenarios, and vendor competitive profiles. Twenty leading component suppliers are profiled, spanning semiconductor giants and specialized biosensor startups across every major sensing technology category and price tier. Buyers receive quantified input cost exposure, portfolio tier economics, and strategic recommendations tailored to supplier investment and device maker procurement decisions alike.
Twenty vendor competitive profiles and positioning analysis
Ten-year base, bull, and bear forecast scenarios
Seven-region demand and growth trend analysis
Six-segment MECE market breakdown and sizing
Input cost exposure and mitigation pathways
Portfolio tier and margin economics modeling

Built For The People Who Decide

From boardroom strategy to bench-side execution, this report is read cover-to-cover by leaders shaping the next decade of their industry, turning demand scenarios, market dynamics and valuation benchmarks into decisions.
CXOs/ Presidents/ VPs/ Managers
M&A and Corporate Development
Strategy Teams and R&D Heads
Procurement and Product Directors
Regulatory and Compliance Leaders
Investor Relations and Equity Analysts