Market Minds Advisory
Wearable Computing Devices Market

Wearable Computing Devices Market: Wearable Computing Devices Market. Continuous Health Monitoring Reshapes Consumer Electronics Demand

Consumers demanding continuous health metrics beyond step counts while insurers dangle premium discounts for verified activity data are colliding as manufacturers race to certify medical-grade sensors fast enough to blur the line with regulated devices.

Lead Analyst

Published

September 2026

Make Smarter Decisions with Customized Research Insights

Request a free sample report and evaluate market opportunities, growth trends, and competitive dynamics relevant to your business needs.

2025 MARKET VALUE$68.5BMarket Size 2025
2036 FORECAST VALUE$303.8BBase Case , 2026 to 2036
CAGR 2026 TO 203614.5 %Bull 15.8% / Bear 13.2%
INCREMENTAL OPPORTUNITY$225.3BNet 10- year value creation
EXPANSION MULTIPLE3.87x2036 value over 2026 base
Strategic Levers
M&A Pipeline
Regional Outlook
Country Rankings
Competitive Intelligence
Segmental Deep-dive
Call-Us : 91 93563 13602

Executive Snapshot and Market Trajectory.

Wearable manufacturers are pushing sensor capability well past step counting into continuous glucose trending and blood oxygen monitoring, forcing regulatory bodies to draw sharper lines between consumer wellness devices and regulated medical instruments. This shift is reshaping product certification pathways across nearly every major device manufacturer.
Health insurers offering premium discounts tied to verified activity data are pulling consumer purchase decisions toward wearables that integrate cleanly with insurer wellness programs, and South Asian markets are adopting wearables fastest as rising middle-class disposable income meets increasing health awareness. Smart ring form factors are separately driving demand as consumers who resist wrist-worn devices for aesthetic or comfort reasons adopt a less visible alternative offering similar sensing capability.
A handful of major consumer electronics brands still dominate wearable sales given their existing smartphone platform integration advantages, but specialist health-focused startups are entering with sensor accuracy claims that established brands struggle to match quickly, changing who counts as a credible competitor. Regulatory scrutiny over health claims made by consumer wearables is forcing manufacturers to navigate a genuinely more complex approval landscape. Vendors combining design polish and clinical accuracy increasingly win the largest retail partnerships.
Market Definition
This report covers wrist-worn, ring-form, and other body-worn computing devices with integrated sensors for health monitoring, fitness tracking, and connectivity, measured on a global unit and revenue basis across consumer and enterprise markets. It excludes implantable medical devices and hearables that function purely as audio accessories without dedicated sensor arrays.
Base Year Value
$68.5B in 2025 (MMA Primary Research Dataset, September 2026)
Forecast Period
2026 to 2036, eleven discrete annual values
CAGR
14.5% base case. Bull 15.8%. Bear 13.2%.
Fastest Growth Segment
Smart Rings and Continuous Health Monitors: 22.0% CAGR
Fastest Growth Country
India: 22.5% CAGR
Fastest Growth Region
South Asia and Pacific: 16.8% CAGR
Largest Region
East Asia: 30% of 2025 global value
Market Leaders
Apple, Samsung, Garmin, Fitbit (Google), Xiaomi
Primary Survey
n=3,800 procurement and R&D decision-makers, Q4 2025, six countries
Methodology
Demand-side build-up, cross-validated against public data, 47 expert interviews

Wearable Computing Market Forecast Scenarios

wearable-computing-devices-market-size-forecast-scenario-1788419109575
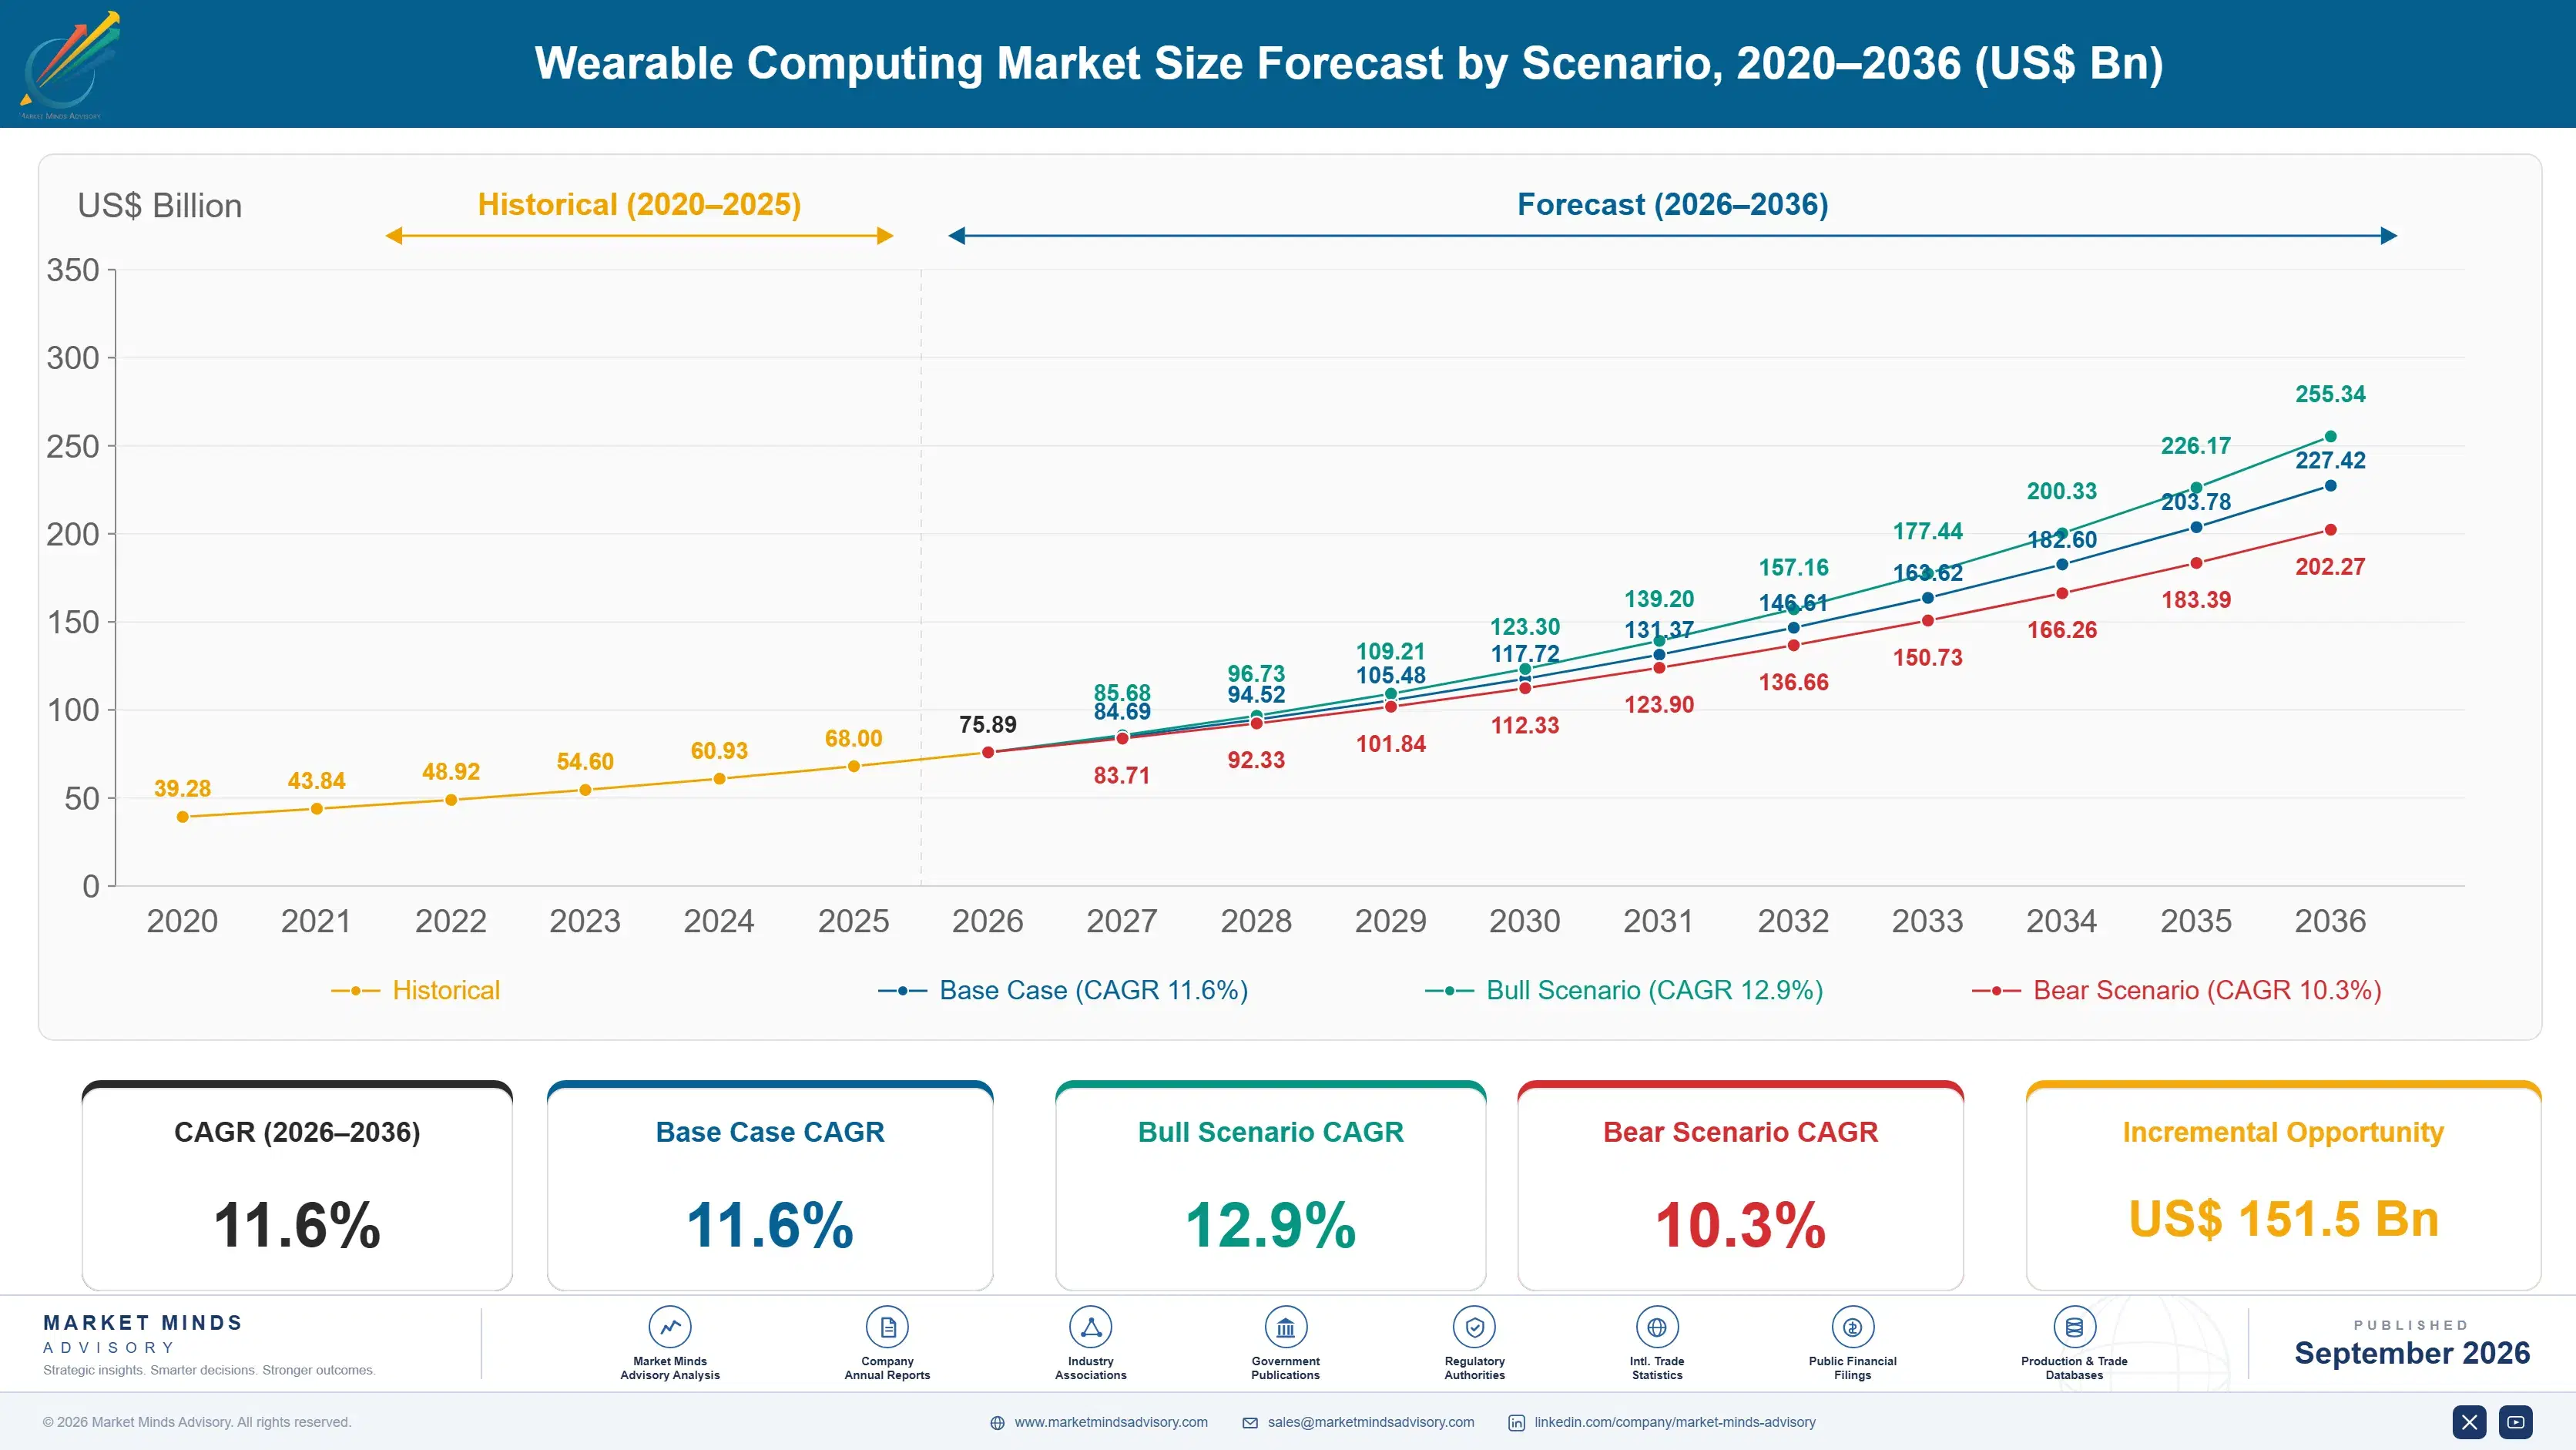
Wearable computing grew steadily between 2020 and 2025 as smartwatch adoption matured and fitness tracking became mainstream, though the historical growth rate of 10.7 percent understated a sharper acceleration once health insurers began subsidizing continuous monitoring devices directly in the final two years. Smart ring adoption barely existed at the start of this period. Few vendors anticipated the shift moving quite this fast.
The base case rests on three commercial mechanisms: insurers and employers expanding subsidized device programs that fund continuous health monitoring at scale, miniaturized biosensor technology enabling smart rings and patches previously impractical, and East Asian manufacturers driving component costs down faster than expected across the supply chain. Together these sustain strong double-digit growth through the forecast period even as smartwatch growth itself moderates considerably each year. Vendors slow on any one front risk ceding share quickly.
The bull case assumes faster-than-expected insurer adoption of continuous monitoring reimbursement pulls forward demand across multiple device categories simultaneously and ahead of schedule this cycle. The bear case centers on data privacy regulation and battery supply constraints, which could slow deployment timelines and push cautious employers back toward simpler fitness tracking instead. Either scenario reshapes priorities meaningfully.

Wearables Become Health Platforms, Not Fitness Trackers

Wearable manufacturers are no longer selling a fitness accessory, they are selling a continuous health monitoring platform, and that shift is rewriting who counts as a credible supplier to consumers and increasingly to insurers and employers. A manufacturer without clinically validated sensor accuracy cannot win a contract that now requires demonstrating measurement precision comparable to dedicated medical instruments.
MARKET CONCENTRATION62% CR5Top five brands hold most global wearable device revenue
AVERAGE SELLING PRICE$220 per smartwatch unitPrice varies widely between entry-level and premium device tiers
TOP MANUFACTURING COUNTRY SHAREChina, 55% of global outputSingle country dominates worldwide wearable device assembly capacity
HEALTH SENSOR PENETRATION68% of new units include SpO2Share of new devices shipping with blood oxygen sensing capability
AVERAGE REPLACEMENT CYCLETwo to three years per deviceTypical interval between consumer wearable device upgrade purchases
SUBSCRIPTION ATTACH RATE30% of premium device ownersPortion of owners paying for a companion health analytics subscription
Brands that historically sold basic step-counting devices are being squeezed out unless they add clinically credible health sensors, since consumers increasingly demand accuracy claims that basic accelerometer-only devices cannot support. Several smaller device makers have already exited direct consumer sales entirely, choosing instead to license their hardware designs to larger brands that already own the retail distribution relationship.
Medical device companies are moving directly into consumer wearable-adjacent sensing technology, competing with traditional consumer electronics brands who never built clinical validation capability, creating a market where neither pure consumer electronics nor pure medical device positioning is defensible alone anymore. Retailers and insurers increasingly evaluate brands on sensor accuracy validation almost as closely as design and battery life, a criterion that barely mattered in procurement decisions a decade ago when step counting alone was considered a sufficient feature set.
"Nobody buys a step counter anymore, they buy a device that tells them something might be wrong before they feel it. The step count was never the point."
Practice Lead, Consumer Health Technology · MMA Consumer and Enterprise Wearable Hardware Technology Practice · September 2026

Market Trends

Continuous Glucose Monitoring Nears Mainstream Consumer Wearables

Manufacturers are racing to bring non-invasive continuous glucose monitoring capability into mainstream consumer wearables, a feature previously confined to dedicated medical devices requiring skin-penetrating sensors and prescription access. Early non-invasive prototypes have demonstrated accuracy within 15 percent of laboratory reference standards in controlled trials, though regulatory clearance for consumer marketing claims remains pending in most major markets. This capability, once cleared, would represent the largest single feature addition to the category since heart rate monitoring became standard, potentially triggering a broad upgrade cycle across the installed base. Investors are watching this regulatory pathway closely for early signals.
Market Impact: Programs cover over 10 million members
Smart Rings Capture Consumers Resistant to Wrist-Worn Devices

Smart ring form factors are capturing a meaningful share of new wearable purchases among consumers who resist wrist-worn devices for aesthetic, comfort, or workplace dress code reasons, expanding the category's addressable population beyond traditional smartwatch buyers. Smart ring shipments have grown past 3 million units annually, still a small fraction of total wearable volume but growing considerably faster than the broader category average. This form factor shift is forcing established smartwatch brands to develop competing ring products rather than ceding this emerging niche entirely to specialist startups. Battery life constraints remain the primary engineering hurdle for this smaller form factor.
Market Impact: Over 500 million live with diabetes

Market Opportunities and Growth Drivers

Employer and Insurer Wellness Programs Subsidize Purchases

Employers and health insurers are increasingly subsidizing wearable device purchases or offering premium discounts tied to verified activity data, effectively lowering the consumer purchase price and expanding the addressable buyer population. Several major insurers now offer wearable-linked wellness programs covering millions of enrolled members, creating a distribution channel that operates independently of traditional retail purchasing decisions. This subsidy dynamic is pulling adoption into demographic segments that would not otherwise have purchased a wearable device at full retail price. Vendors partnering directly with insurers increasingly gain distribution advantages competitors lacking similar partnerships cannot easily replicate.
Market Impact: Delays extend 12 to 18 months

Rising Chronic Disease Prevalence Drives Monitoring Demand

Rising global prevalence of diabetes, hypertension, and cardiovascular conditions is driving consumer interest in continuous monitoring devices that can flag early warning signs between formal medical checkups. Over 500 million people globally live with diabetes alone, representing a substantial addressable population for glucose-adjacent wearable monitoring capability as the technology matures toward consumer accessibility. Healthcare systems facing capacity constraints increasingly view consumer wearables as a complementary early-warning tool rather than a replacement for clinical monitoring. Vendors positioning devices specifically for chronic disease management increasingly differentiate from purely fitness-oriented competitors in marketing and retail placement.
Market Impact: Battery life drops 30 percent

Market Restraints and Challenges

Regulatory Uncertainty Slows Health Feature Rollout

Consumer wearable manufacturers face genuine uncertainty over which health monitoring claims trigger medical device regulatory classification, since the line between wellness feature and diagnostic claim varies by jurisdiction and continues shifting as regulators respond to new sensor capabilities. The root cause is that regulatory frameworks were written before continuous consumer health monitoring existed at this sophistication, leaving genuine ambiguity in classification. This forces manufacturers to either delay launches pending clarity or accept compliance risk. Manufacturers mitigate this by engaging regulators early in development rather than seeking approval only after a design is finalized.
Market Impact: Accuracy reaches within 15 percent

Battery Life Constraints Limit Sensor Feature Density

Adding more continuous health sensors to a compact wearable device directly increases power consumption, forcing manufacturers to make difficult tradeoffs between feature richness and the battery life consumers expect from a daily-wear device. The underlying cause is that battery energy density has improved much more slowly than sensor and processing capability over the past decade, creating a persistent engineering constraint. This forces manufacturers to disable some continuous monitoring features by default, activating them only during specific tracked activities rather than truly continuously. Manufacturers mitigate this by developing lower-power sensor variants optimized for always-on background monitoring.
Market Impact: Shipments surpass 3 million units
3 additional market trends, 4 additional growth drivers, and 3 additional restraints and challenges are covered in the full report. Contact sales@marketmindsadvisory.com to access the complete intelligence.

Segment CAGR and Growth Architecture

The wearable computing devices market splits across five technology-defined segments spanning form factor, sensor capability, and application across consumer and enterprise use cases. Smart rings and continuous health monitors lead growth as consumers seek less visible, more medically capable devices, while traditional smartwatches still represent the largest installed base by unit count across the broader consumer market worldwide.
wearable-computing-devices-market-market-share-analysis-1788419110115

Smart Rings and Continuous Health Monitors

Smart rings and continuous health monitors pack sensor arrays into a compact ring or patch form factor, capturing consumers who resist wrist-worn devices for aesthetic, workplace, or comfort reasons while still delivering continuous heart rate, sleep, and temperature tracking capability. This format has gained particular traction among consumers who tried and abandoned smartwatches due to bulk or notification fatigue, representing a genuinely incremental addressable population rather than pure cannibalization of smartwatch sales. Growth here outpaces every other segment because the category is expanding from a small base while smartwatch growth has matured toward steady replacement demand. Vendors entering this format earliest with proven sensor accuracy are capturing the largest share of this expanding addressable population.
CAGR 22.0%

Traditional Smartwatches

Traditional smartwatches remain the largest segment by installed unit count, covering the wrist-worn devices with display screens and broad application platforms that have defined the category since its mainstream introduction roughly a decade ago. This format benefits from deep integration with smartphone operating systems and app platforms that newer form factors have not yet fully replicated. Growth here is comparatively modest since the installed base is already large and mature, with most new spending going toward replacement of aging devices rather than first-time category adoption among new consumers. Vendors serving this segment compete primarily on platform breadth and app availability rather than the specialized sensor depth that differentiates newer form factors.
CAGR 10.5%
Full segment breakdown across 6 segments available in the complete report.

Regional Architecture and Country Demand Map

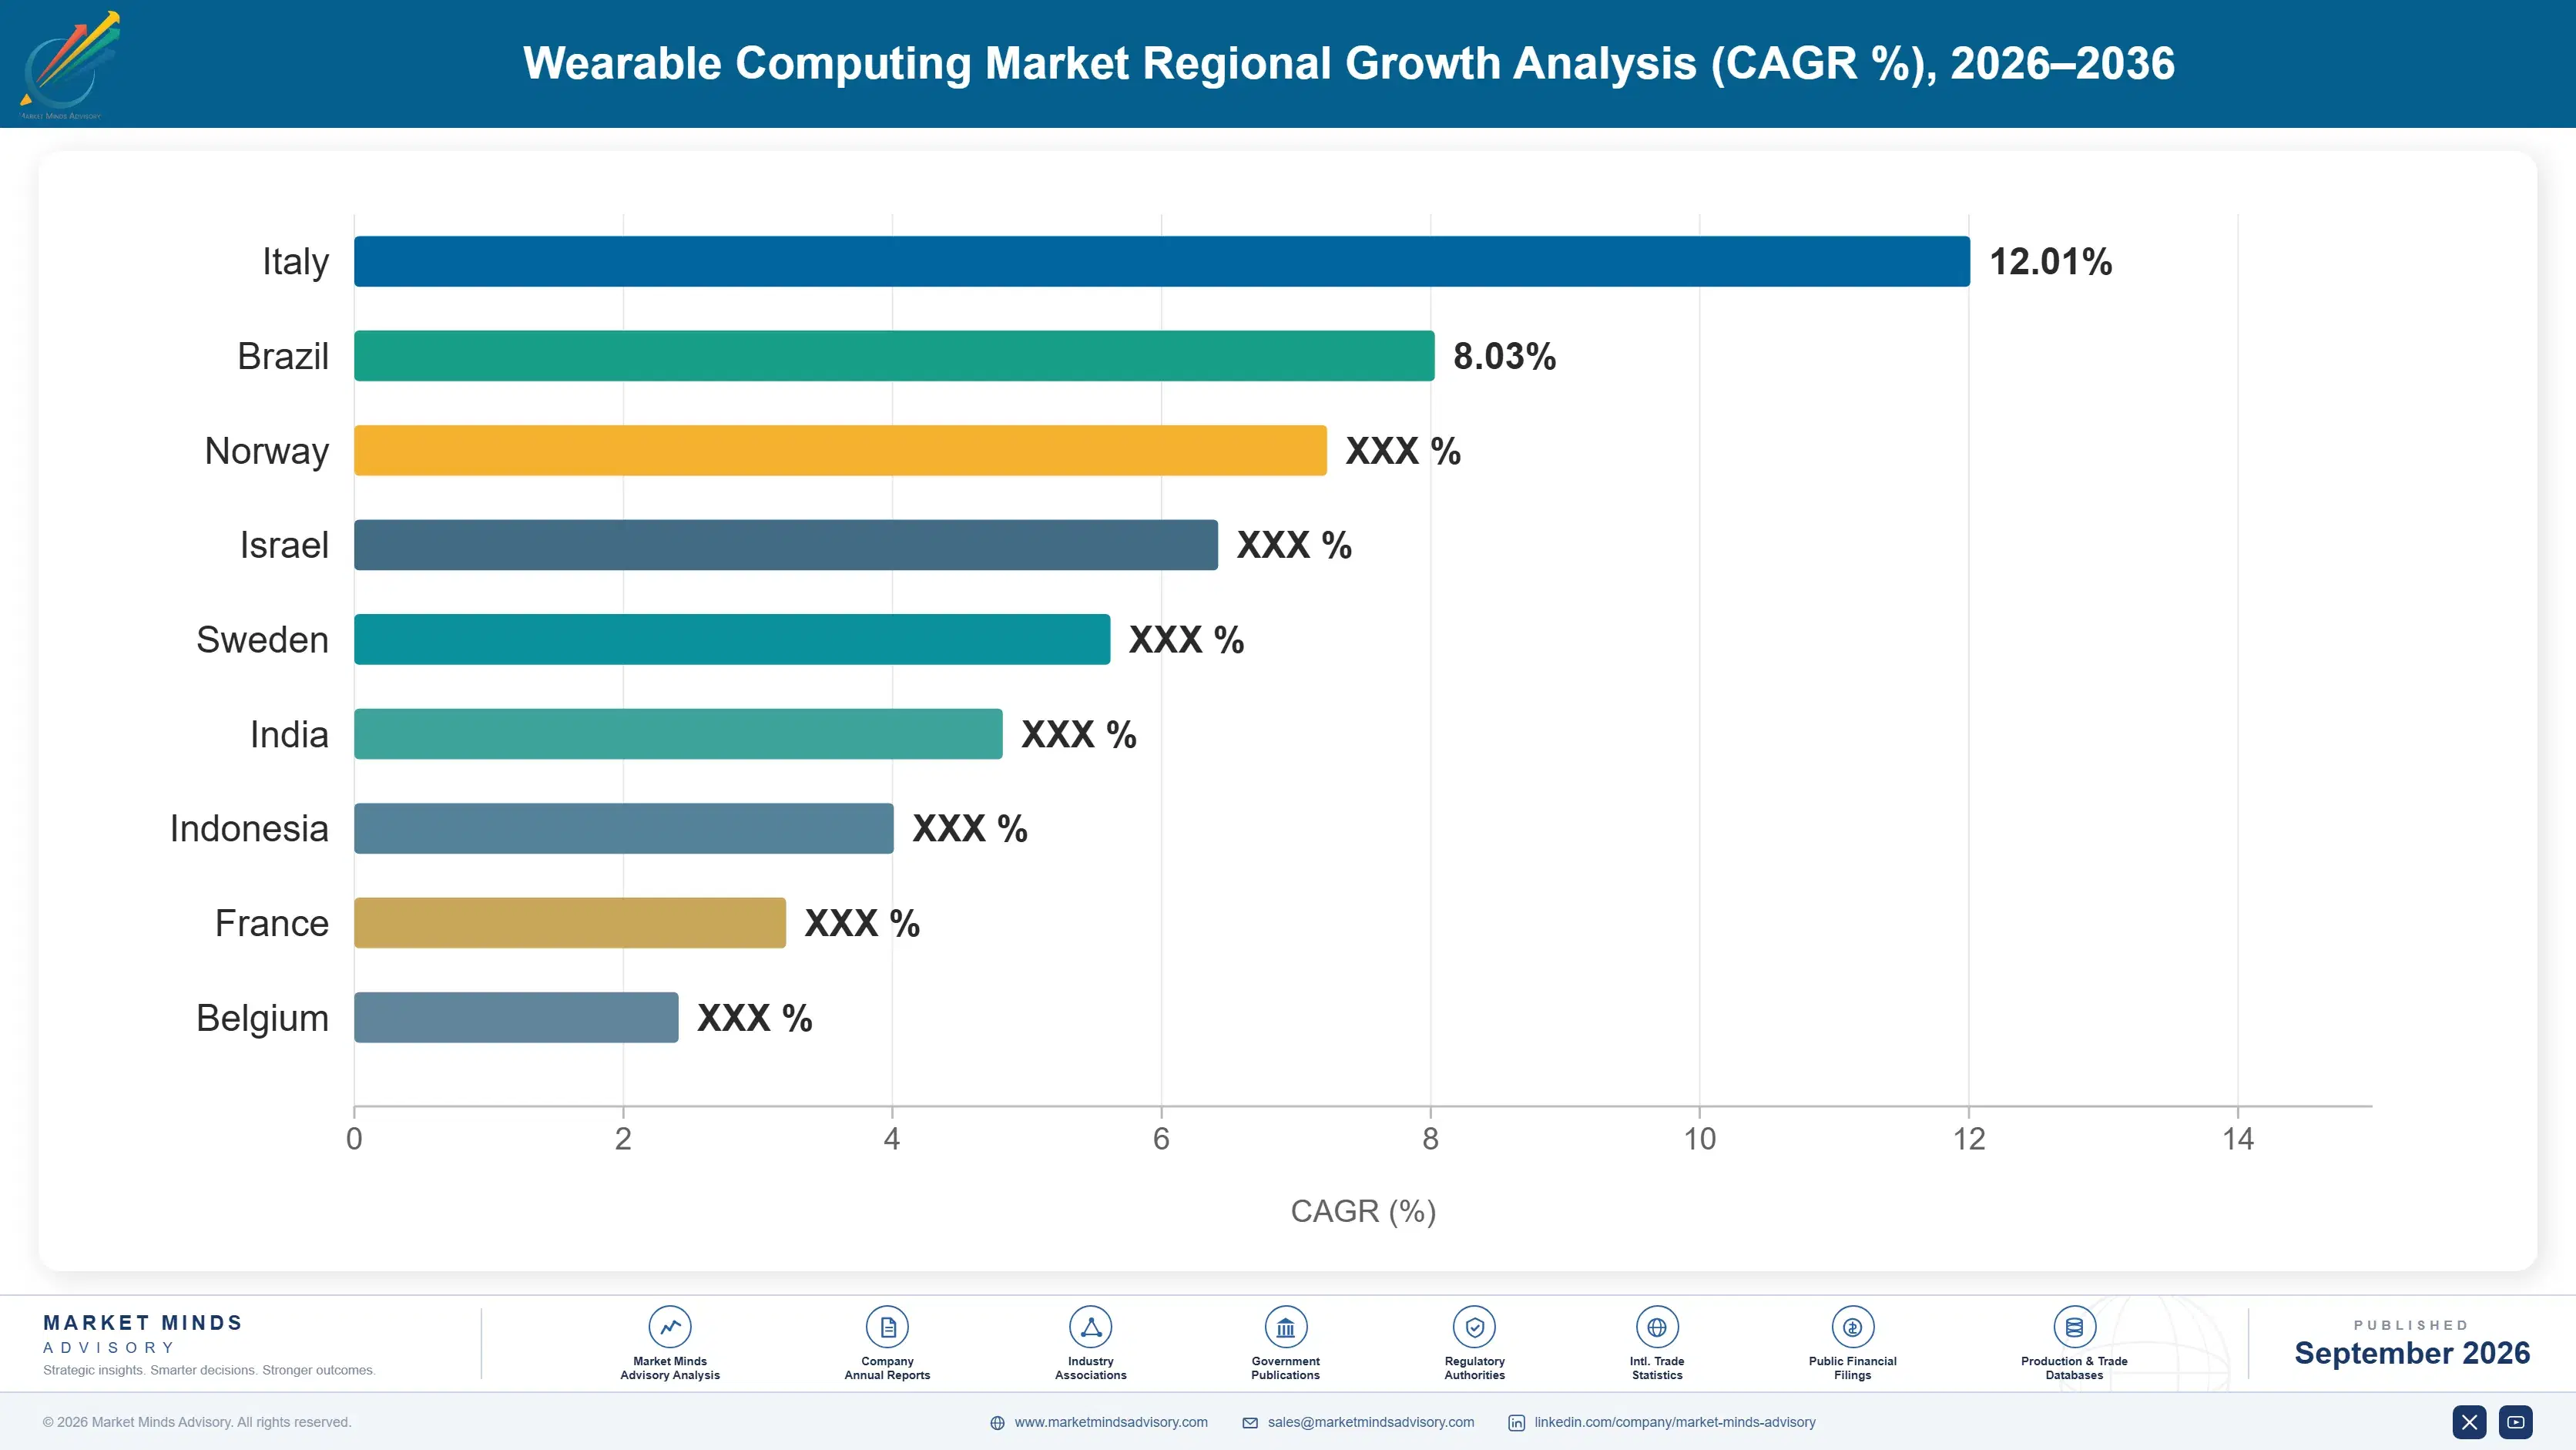
East Asia leads global unit revenue on the strength of China's dominant manufacturing base and rapidly growing domestic brands, while North America holds a strong secondary share tied to premium device vendor headquarters concentration. South Asia and Pacific grows fastest as India's middle class expands wearable adoption.

North America

Premium device vendor headquarters concentration defines North America's share more than raw unit volume alone. Apple and Google's Fitbit both book the majority of their global wearable revenue through United States entities, capturing outsized value per unit given their premium pricing positioning relative to the broader global market. Health insurer and employer wellness program partnerships are particularly well developed in this region, creating a distribution channel largely absent from most other markets. Canada's smaller consumer base follows a similar adoption pattern, concentrated among the same major global brands active domestically. Corporate wellness program adoption at large employers continues expanding, adding a meaningful institutional demand channel distinct from pure retail sales.
Share: 24% | CAGR: 14.8% (2026 to 2036)

Western Europe

Western Europe's growth trails the global rate mainly because the region's wearable market matured earlier than most emerging markets, leaving a smaller pool of first-time buyers relative to fast-growing regions still building initial adoption. Germany and France continue showing strong premium device demand tied to high disposable income and health-conscious consumer segments. The United Kingdom's National Health Service has explored wearable data integration into preventive care programs, a policy direction that could meaningfully expand institutional demand if adopted more broadly across the health system. Scandinavian markets show particularly strong per-capita adoption tied to high health consciousness and strong existing digital infrastructure. Italy and Spain follow at a somewhat slower adoption pace overall.
Share: 19% | CAGR: 13.0% (2026 to 2036)
Regional intelligence for 5 additional markets available in the complete report: East Asia, South Asia and Pacific, Latin America, Middle East and Africa, Eastern Europe. Contact sales@marketmindsadvisory.com.
wearable-computing-devices-market-country-cagr-analysis-1788419110627

Where Wearable Brands Can Still Add Margin

Commoditizing basic fitness tracking and thinning hardware margins are pushing brands toward adjacent revenue lines that ride on top of the same consumer relationship rather than the device unit sale itself. Four levers stand out as genuinely additive to core revenue rather than cannibalistic of it, each drawing on data or reach the brand already has.

Selling Premium Health Analytics Subscription Tiers

Brands with rich sensor data can package advanced health insights, personalized coaching, and trend analysis as a premium subscription layered on top of the base device purchase, converting a one-time hardware sale into a recurring revenue relationship. Consumers increasingly accept subscription pricing for genuinely differentiated insight rather than raw data display alone, mirroring the broader software-as-a-service pricing model already accepted in other consumer technology categories. Brands offering this capability report subscription attach rates above 30 percent among premium device owners, a durable margin layer largely uncorrelated with new unit sales.
Market Impact: Subscription attach rates now exceed 30 percent share

Partnering With Insurers on Verified Wellness Programs

Brands with verified activity tracking capability can partner directly with health insurers to power wellness discount programs, capturing referral revenue and long-term device loyalty from an institutional channel operating independently of retail purchasing decisions. This partnership model locks in a longer-duration customer relationship than a one-time device sale would provide, since insurer program participation often requires continued device use. Brands offering this capability report partnership revenue reaching 5 to 8 percent of total company revenue within three years of program launch. Regulatory data-sharing agreements with insurers require careful privacy structuring most brands must build from scratch.
Market Impact: Partnership revenue reaches 5 to 8 percent share

Selling Extended Warranty and Accidental Damage Protection

Wearable devices carry sensitive electronics and displays vulnerable to accidental damage during daily wear, creating a genuine market for extended warranty programs that brands increasingly package as a paid add-on at the point of sale. Consumers value this because unplanned device failure interrupts continuous health tracking, a genuine loss for users who have integrated the device into daily routines. Attach rates above 20 percent among premium device buyers are now achievable for brands with sufficient claims data to price the coverage accurately. Building accurate claims pricing requires years of failure-rate data most newer brands have not yet accumulated.
Market Impact: Attach rates now exceed a 20 percent mark

Selling Enterprise Fleet Programs for Corporate Wellness

Brands that build dedicated enterprise sales teams can sell bulk device fleets directly to large employers launching corporate wellness initiatives, capturing volume revenue distinct from individual consumer retail sales channels. This enterprise channel has proven especially valuable given multi-year contract terms and predictable bulk replacement cycles tied to employee onboarding schedules rather than individual consumer discretionary timing. Vendors offering this capability report enterprise contract values reaching over 2 million dollars for the largest employer deployments. Building this sales capability requires account management expertise most consumer-focused brands historically never developed internally.
Market Impact: Largest contracts reach over 2 million dollars each

Who Controls the Margin Pool

Global unit revenue concentrates heavily, with the top five brands together holding roughly 62 percent share on a unit revenue basis, the consistent yardstick applied throughout this assessment. Apple and Samsung sit well ahead of the next tier, backed by deep smartphone platform integration that newer entrants cannot easily replicate. The gap between these leaders and mid-tier challengers like Garmin remains wide enough that near-term ranking changes at the top look unlikely.
Current activity centers on health sensor expansion and subscription bundling rather than pure price competition on basic fitness tracking. Brands are racing to add clinically credible health monitoring features simultaneously across product lines, since consumers increasingly refuse to purchase devices limited to step counting alone. Several mid-tier players have pursued smart ring acquisitions specifically to capture the emerging alternative form factor segment.

Emerging pressure comes from specialist health technology startups entering with sensor accuracy claims that established consumer electronics brands struggle to match quickly. Ranking shifts are most likely in the mid-tier, where brands lacking credible health sensor roadmaps risk losing share to faster-moving specialists. The very top of the market remains comparatively stable, protected by scale and platform lock-in built over years.
wearable-computing-devices-market-company-positioning-matrix-1788419111146

Competitive Moat and Risk Dimensions

APPLE

Moat: Deep iOS Platform Integration

Apple Watch's tight integration with iPhone and the broader iOS platform creates switching costs that pure hardware competitors cannot easily replicate, since customers would need to abandon their entire smartphone platform to switch away. This lock-in effect compounds with every additional connected Apple device a customer owns.
APPLE

Risk: Premium Pricing Limits Volume Growth

Apple's premium pricing strategy caps its addressable volume in price-sensitive emerging markets where domestic brands offering comparable core features at a fraction of the price are capturing first-time buyers that Apple cannot reach at its current price positioning. Emerging market volume growth will increasingly determine long-term unit share more than premium market saturation ever will.
XIAOMI

Moat: Aggressive Price-to-Feature Positioning

Xiaomi's ability to deliver competitive sensor features at price points well below premium Western brands has made it a dominant force in price-sensitive emerging markets, particularly across South and Southeast Asia where affordability drives purchase decisions. This positioning strategy has proven especially effective in markets where per-capita income limits premium device affordability.
XIAOMI

Risk: Weaker Premium Brand Perception

Xiaomi's value positioning limits its ability to compete for premium market share where brand perception and perceived build quality matter as much as raw feature specifications, constraining its margin expansion potential in developed markets. Building stronger brand equity would require sustained marketing investment that thinner margins make genuinely difficult to fund.

Players Tracked

Prominent Players

Apple
Samsung
Garmin
Fitbit (Google)
Xiaomi

Other Key Players

Huawei
Amazfit (Zepp Health)
Whoop
Oura
Fossil Group
Withings
Polar Electro
Suunto
Coros
Honor
Realme
OnePlus
Ultrahuman
Circular
Movano Health

Recent Developments

FEBRUARY 2026

Apple Adds Blood Pressure Trend Monitoring Feature

Apple added blood pressure trend monitoring capability to its latest smartwatch generation, expanding its health sensor suite beyond heart rate and blood oxygen tracking into a feature category previously requiring dedicated medical devices. The feature requires regulatory clearance in several markets before full commercial rollout can proceed.
Signal: Major consumer brands are absorbing features once exclusive to dedicated medical monitoring devices. broadly across the industry.
OCTOBER 2025

Samsung Launches Dedicated Smart Ring Product Line

Samsung launched a dedicated smart ring product line targeting consumers who previously avoided wrist-worn devices, expanding its wearable portfolio beyond the Galaxy Watch line into the fastest-growing form factor segment. Pricing was set competitively against existing standalone smart ring startup products already on the market.
Signal: Established smartwatch brands are moving quickly to avoid ceding the smart ring segment entirely to startups.
MAY 2025

Garmin Acquires Health Data Analytics Startup

Garmin completed the acquisition of a smaller health data analytics startup, adding personalized coaching and insight capability to its existing hardware portfolio rather than relying solely on basic data display for users. Financial terms of the acquisition were not disclosed publicly by either company involved.
Signal: Vertical integration into analytics software is becoming a competitive necessity for hardware-focused wearable brands. overall. today.

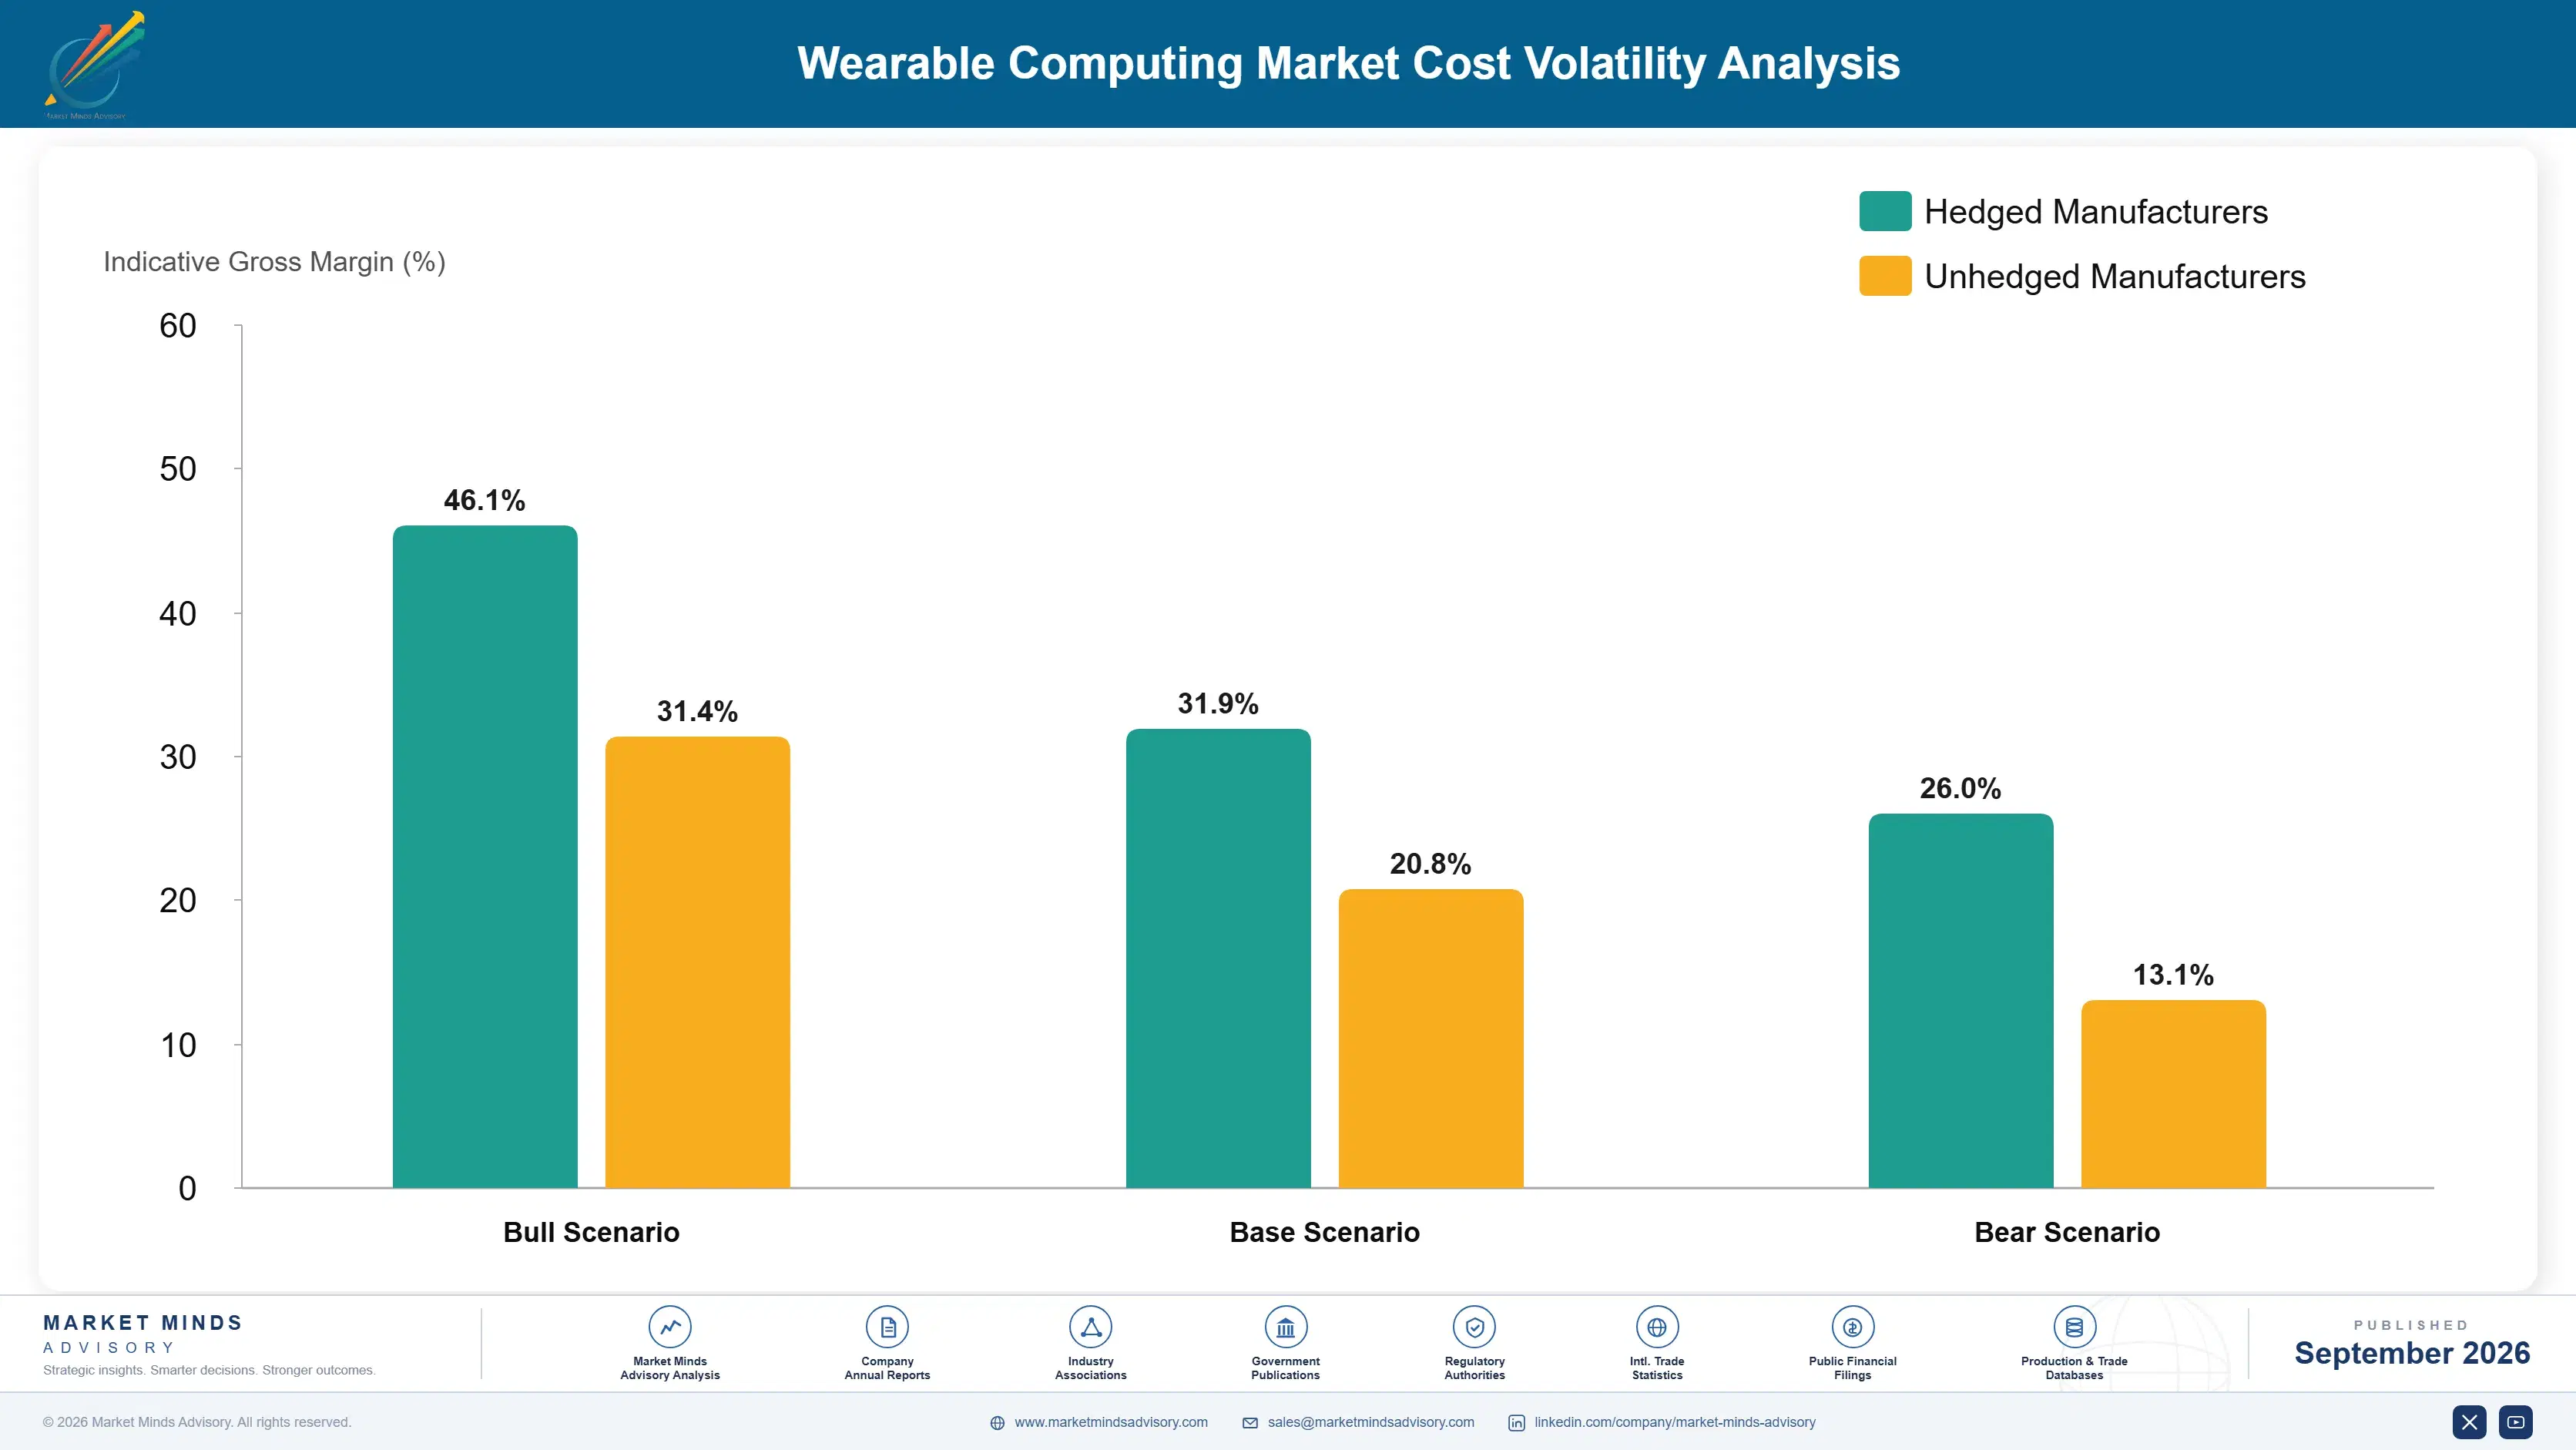
Sensor Component and Display Cost Exposure

Health sensor modules and display components account for roughly 32 to 40 percent of a typical wearable device's cost of goods sold, sourced primarily from specialized semiconductor and display foundries in Taiwan, South Korea, and Japan. Battery and processing components add a further 18 to 24 percent, sourced from a mix of established consumer electronics supply chains.
A 2021 semiconductor shortage, documented in Apple's 2022 annual report as a material supply constraint, delayed wearable device production for several quarters and forced multiple brands to prioritize their highest-margin premium models first. Samsung's 2023 annual report similarly cited component sourcing challenges as a driver behind its decision to diversify its supplier base across multiple semiconductor foundries. These renegotiations became a recurring supply chain planning exercise across the broader wearable manufacturing category.

Smaller brands face a genuine disadvantage here because they lack the purchasing volume to secure priority component allocation from constrained suppliers during shortage periods, unlike larger brands with long-term supply agreements. Brands based in regions without domestic semiconductor fabrication face additional exposure, since they cannot easily substitute alternate component sources the way a diversified global brand can.
wearable-computing-devices-market-cost-volatility-analysis-1788419111341

Dual-Sourcing Critical Sensor Components

Brands are increasingly qualifying two or more component suppliers for critical sensors so a single-source shortage cannot halt production entirely. This adds validation cost but has become close to standard practice among brands shipping meaningful device volume. Brands serving large retail contracts increasingly treat dual-sourcing as a resilience requirement rather than an optional engineering choice made independently.

Long-Term Component Purchase Agreements

Locking in multi-year purchase commitments with semiconductor and display suppliers secures priority allocation during shortage periods and more predictable unit pricing, trading flexibility for supply security that smaller brands without scale often cannot negotiate. This approach requires substantial upfront capital commitment years ahead of actual production need, a tradeoff favoring well-capitalized brands over smaller rivals.

Vertical Integration Into Chip Design

Some larger brands have built internal chip design capability, reducing dependence on external suppliers for critical processing components, though this requires substantial upfront capital investment most smaller brands cannot justify at their current scale. This capability also shortens design iteration cycles, since internal teams can move faster than negotiating changes with external chip vendors.

Portfolio Architecture for Margin Defence

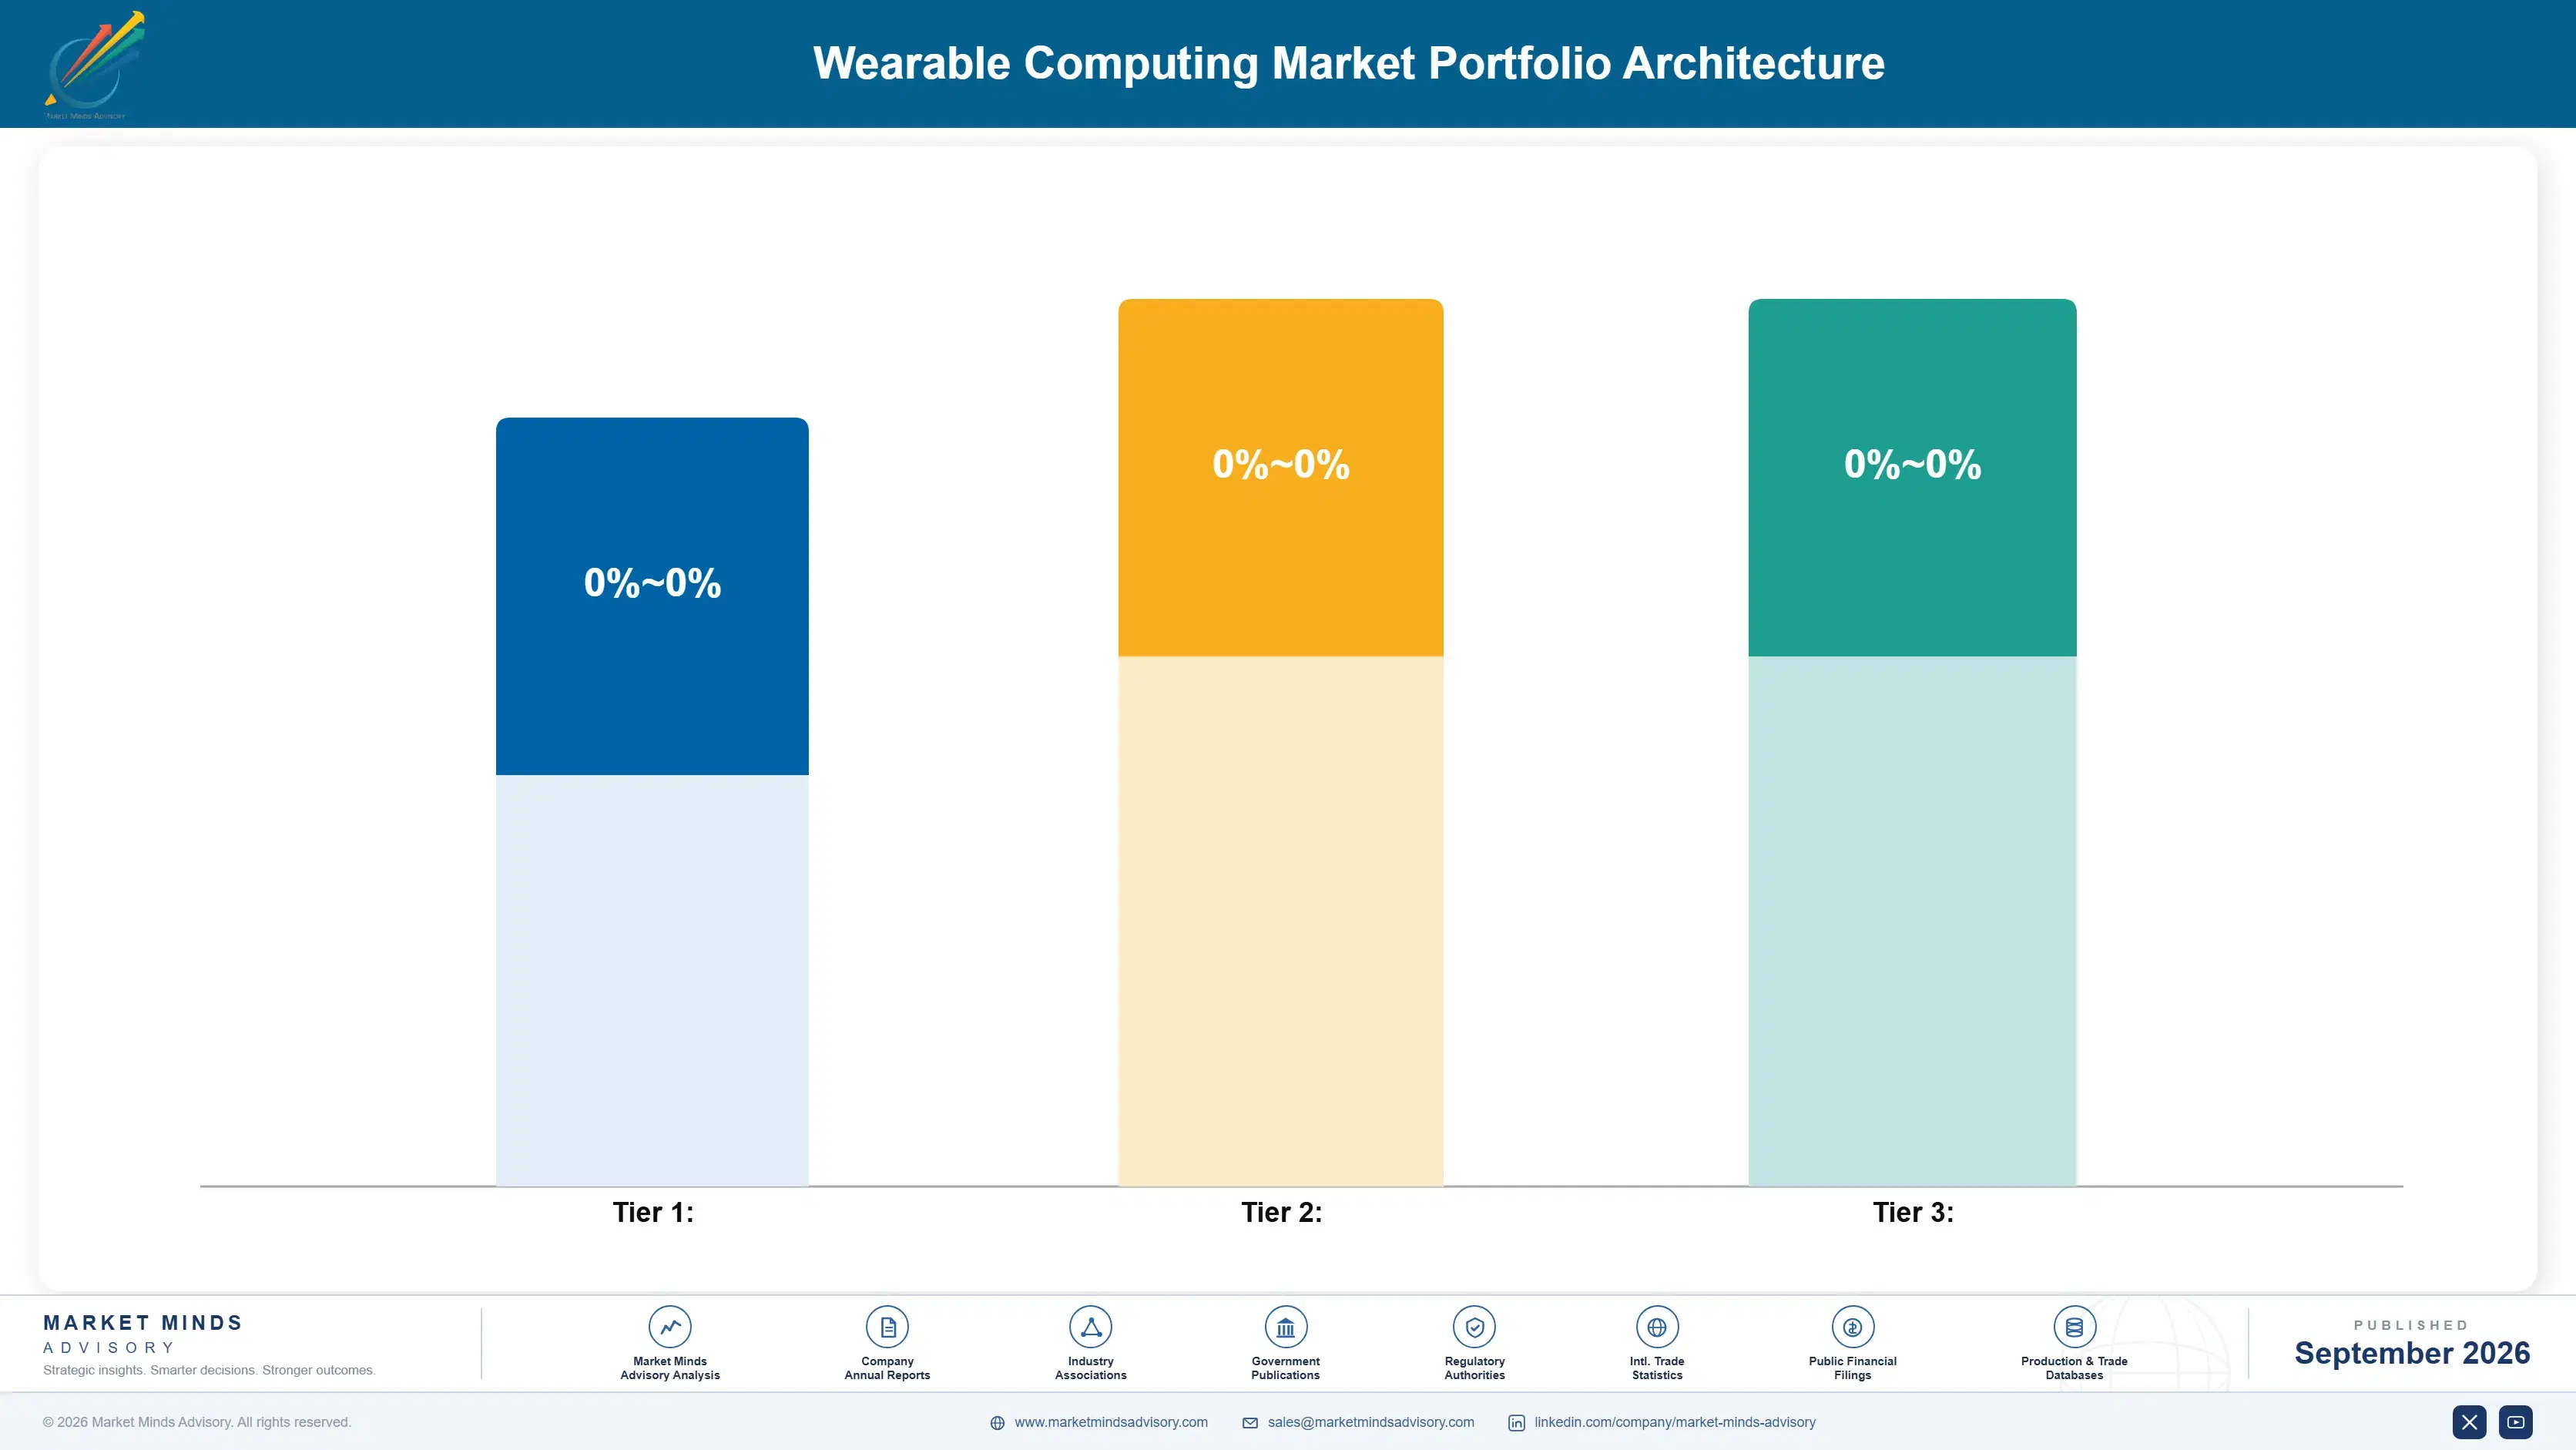
Wearable brands operate across a widening tier structure as basic fitness tracking commoditizes and higher-margin health analytics and insurance partnerships concentrate pricing power elsewhere in the stack. Volume-tier basic trackers now carry gross margins compressed by intense price competition, while premium health-focused platforms retain meaningfully stronger pricing. Portfolio strategy increasingly determines profitability more than raw unit shipment volume across the brand landscape.
The tension between chasing unit volume and defending premium health positioning defines strategic choice across the industry. Brands competing purely on hardware price find margin eroding faster than their cost base can adjust, while brands segmenting customers by subscription and insurance partnership uptake are protecting margin even as basic device pricing compresses. This divergence is reshaping how brands allocate engineering and marketing investment across their consumer base.

High-value margin pools concentrate in health analytics subscriptions, insurer partnerships, and enterprise wellness programs sold as standalone offerings rather than bundled features. These pools grow faster than core hardware revenue because they scale with data and relationships a brand already owns rather than requiring incremental unit shipments, making them the most defensible source of margin expansion available today. Brands without such a plan risk the commodity tier over time.

Volume / Commodity-Adjacent

Basic fitness trackers and entry-level smartwatches sold to price-sensitive consumers where unit cost is the primary purchase driver and switching cost remains modest across brands. Consumers in this tier churn readily toward whichever brand offers the lowest visible price.
Gross Margin: 10 to 16%

Premium / Certified

Premium smartwatches bundled with health analytics subscriptions and dedicated platform integration for consumers who value insight depth over marginal hardware cost savings. These consumers typically renew subscriptions annually, reducing acquisition cost per dollar of recurring revenue.
Gross Margin: 24 to 34%

Sustainability / Regulatory / Next-Generation

Clinically validated health sensors, insurer partnership programs, and enterprise wellness fleet contracts built to meet emerging regulatory and institutional demands, commanding premium pricing while scarce. Brands here often price on a subscription basis tied to insight depth rather than pure hardware specifications.
Gross Margin: 28 to 40%
wearable-computing-devices-market-portfolio-architecture-1788419111838

High-value Sub-segments and Strategic Watch-out

Premium Health Analytics Subscriptions

High-value, high-growth pool as consumers pay premium pricing for personalized health insight beyond raw data, rewarding brands who build effective analytics products earliest with durable recurring revenue locked in ahead of rivals. Brands absent from this capability risk losing the most engaged, highest-lifetime-value customers to faster-moving specialists.

Insurer and Employer Wellness Partnerships

High-value, moderate-growth pool constrained by data-sharing regulatory complexity in most jurisdictions, but delivering strong margin once a brand has built credible institutional partnership infrastructure and trust. Expansion here depends heavily on how quickly a brand can build a credible institutional reputation in a competitive field.

Basic Fitness Trackers and Entry Smartwatches

Volume core segment carrying the bulk of unit shipments but facing steady margin compression as feature parity spreads and commoditized pricing erodes differentiation across most basic offerings. Consolidation among smaller entry-level brands is likely as scale becomes the primary way to defend thinning margin. thins.

Smart Ring and Alternative Form Factor Expansion

Strategic watch-out segment where shifting consumer preference and form factor innovation could rapidly change the competitive map, rewarding brands with flexible sensor miniaturization capability already built. A sudden shift in consumer preference toward any single form factor could reroute meaningful demand quickly. quite suddenly indeed.

Recurring Revenue Across the Device Lifecycle

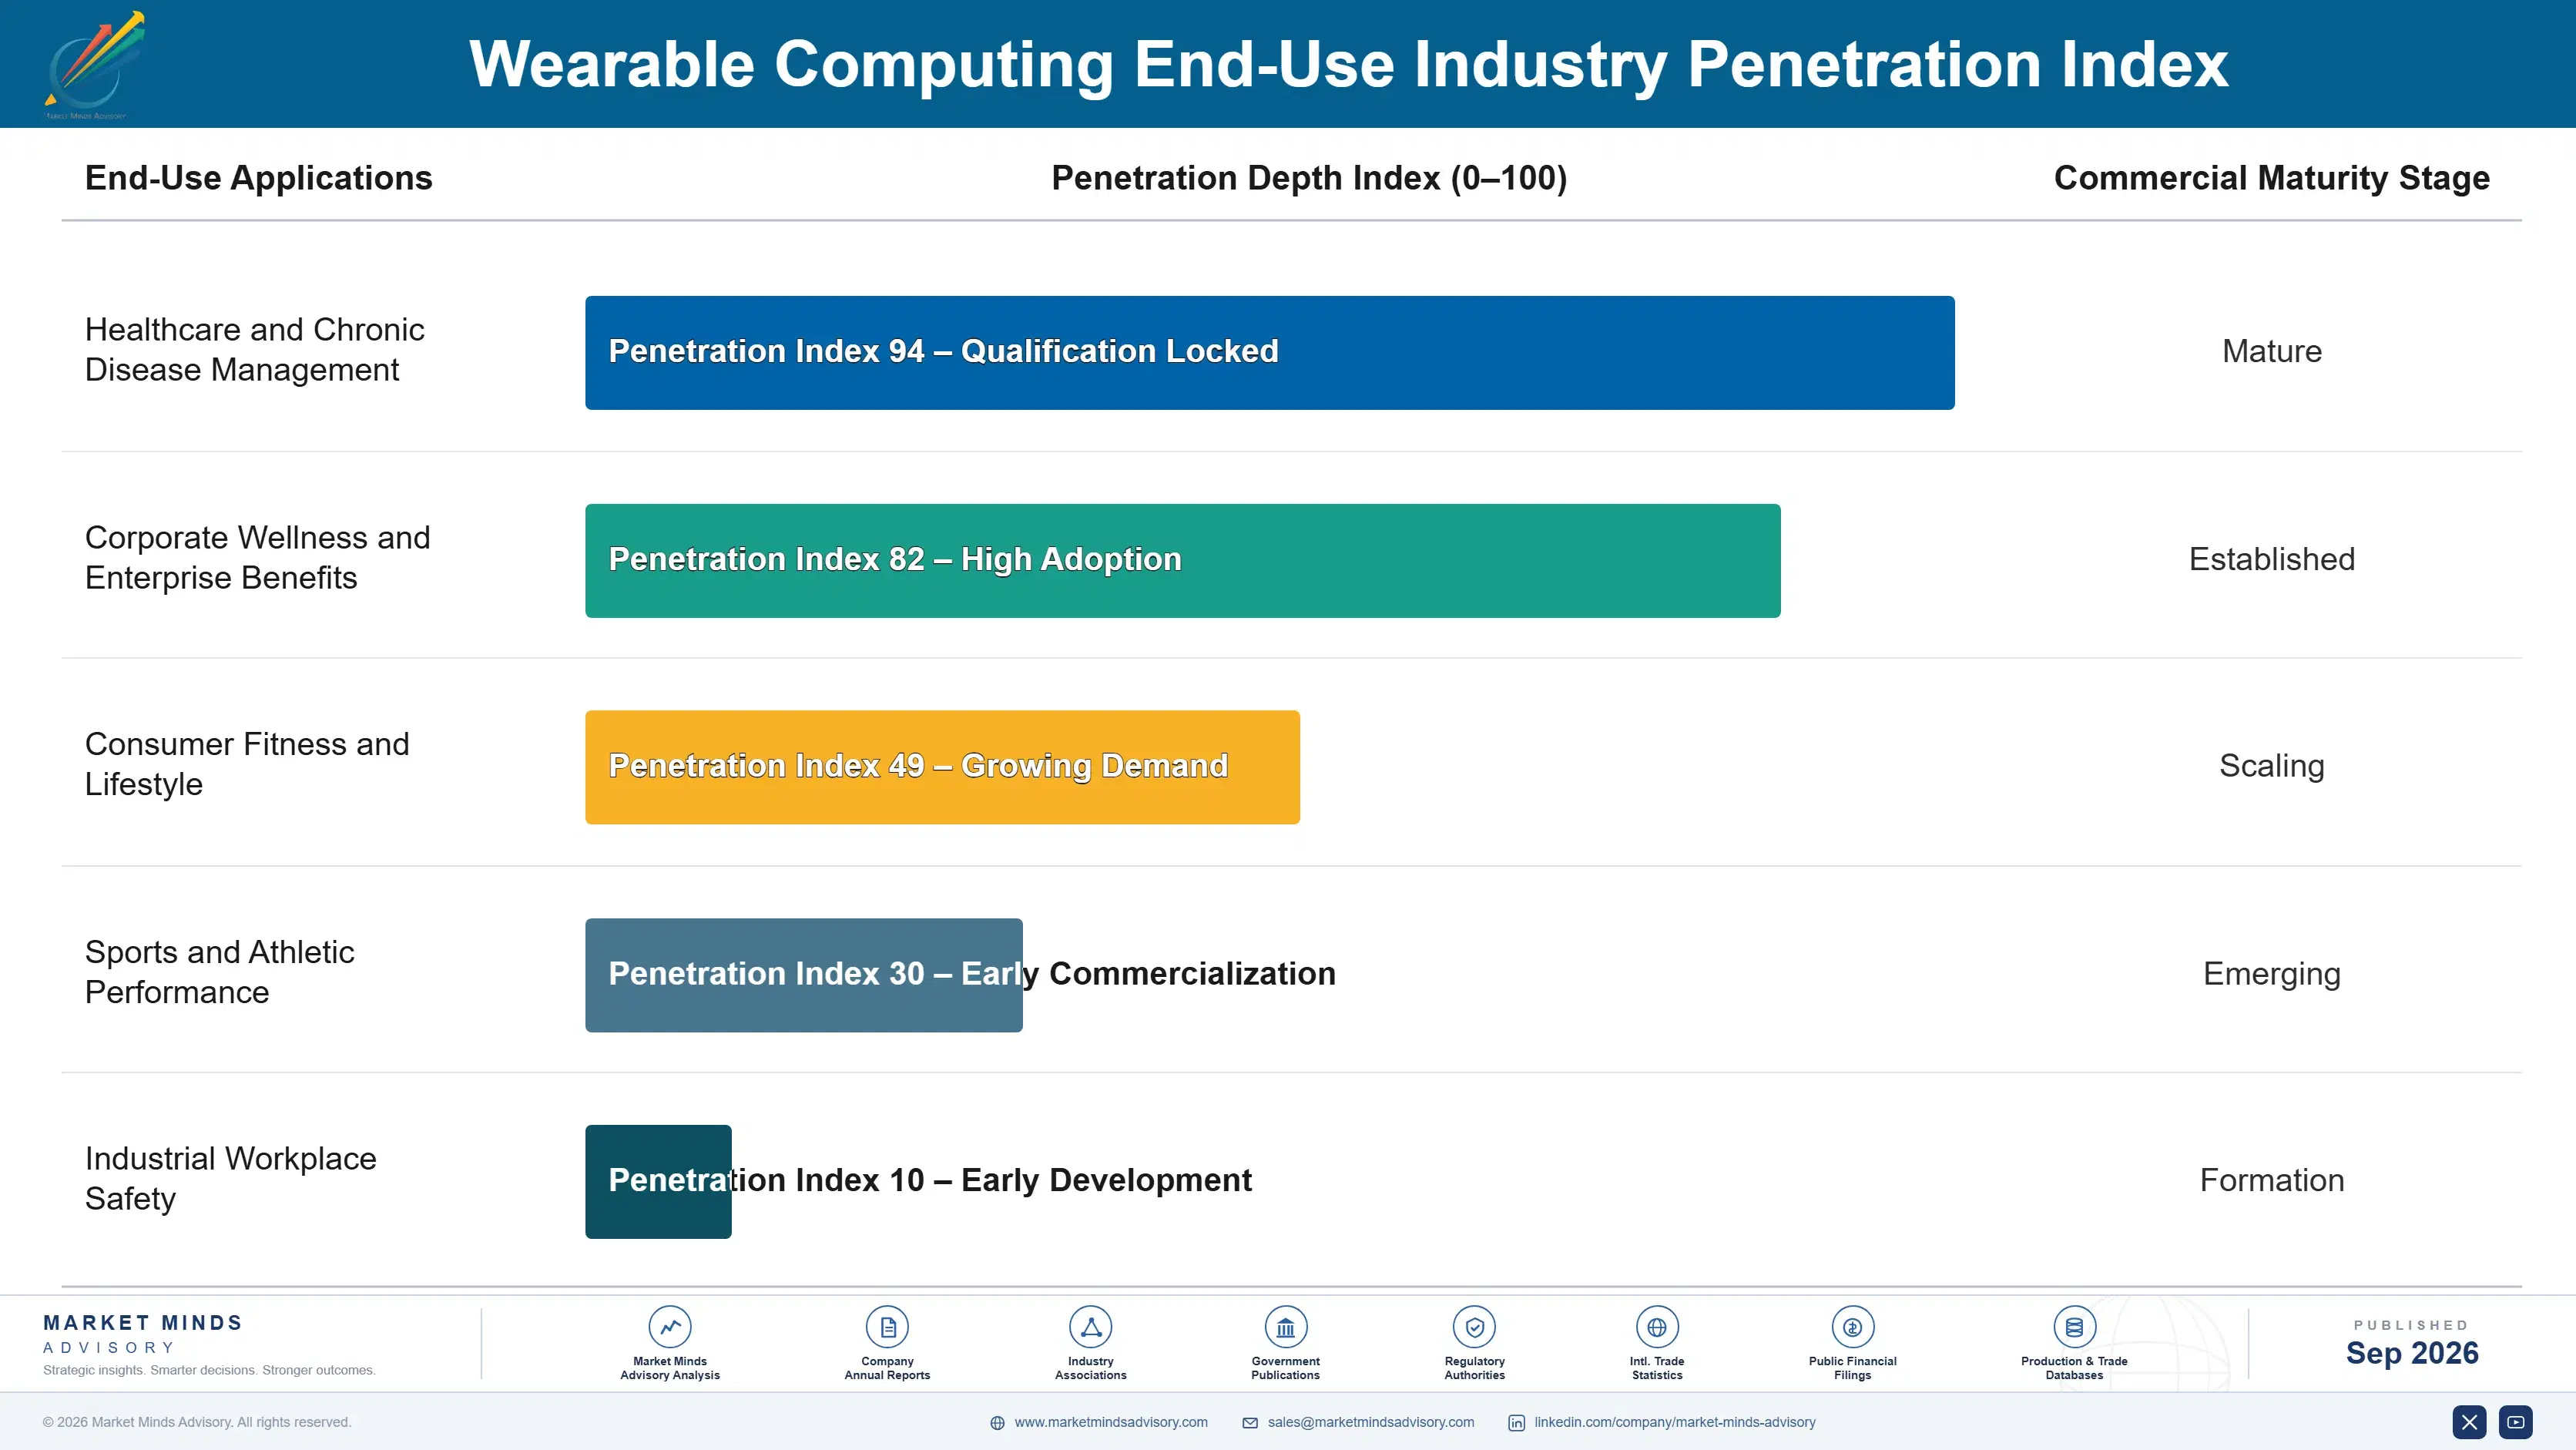
Brand revenue behaves like an annuity once a consumer subscribes to a health analytics tier, since switching brands requires abandoning accumulated historical health data and retraining on a new app interface, a cost most engaged users avoid unless service quality deteriorates. This stickiness means brands earn recurring subscription revenue for years after the initial device purchase, with almost no incremental sales cost.
Adoption depth varies sharply by end-use vertical. Health-conscious premium consumers adopt advanced monitoring features quickly since personal health insight directly affects daily behavior and purchase satisfaction, while price-sensitive mass-market buyers integrate more slowly due to cost sensitivity stretching upgrade timelines past several years. Enterprise wellness buyers sit at a different pace entirely, since adoption depends on employer program budgets and procurement cycles.

Buyer profiles are shifting generationally as younger consumers, raised on continuous digital feedback loops, replace an older generation comfortable with periodic health checkups and manual tracking. Younger buyers expect wearable data to integrate directly with broader health and fitness apps from day one, treating a standalone device without platform connectivity as an outdated concept. This generational turnover is accelerating adoption of connected, subscription-integrated devices faster than pricing alone would predict.
wearable-computing-devices-market-end-use-penetration-index-1788419112317

Where MMA Sees the Real Bets

These are among the four positions where our research anticipates prominent divergence between winners and laggards over the coming forecast period. Each is grounded in the demand model, the regulatory perimeter, and the announced capacity pipeline.
01 / HEALTH SENSOR PRIORITY

Invest in clinically credible sensors before differentiation narrows further

Brands relying only on basic fitness tracking are already losing premium retail shelf space to rivals who invested early and consistently in clinically validated health sensors. This gap widens every quarter a brand delays investment, since consumers increasingly treat sensor accuracy as a baseline purchase requirement rather than a premium feature. MMA firmly views sensor credibility as the clearest predictor of which brands defend premium pricing over the next severalears, more so than raw design polish or brand recognition alone ever could.
02 / SUBSCRIPTION MONETIZATION BUILD

Package health analytics as a standard recurring subscription now

Brands increasingly need recurring revenue to offset commoditizing hardware margins across the entire category, and those with rich sensor data are clearly best positioned to package genuinely differentiated insight as a paid ongoing subscription service. Brands without this capability are steadily ceding margin to rivals who can demonstrate measurable health outcome improvement through their own platforms. MMA firmly expects the subscription-monetization gap to widen further still as more and more consumers gain real experience comparing brand analytics quality directly across competing platforms.
03 / INSURER PARTNERSHIP POSITIONING

Build insurer and employer wellness partnerships ahead of competitors

Insurer and employer wellness programs clearly represent a genuinely durable, quite valuable institutional demand channel entirely distinct from individual consumer retail purchasing decisions and cycles. Brands building genuinely dedicated, well-resourced partnership infrastructure right now are positioning well ahead of the broader, accelerating industry shift toward comprehensive institutional distribution channels and buyer relationships. MMA very firmly regards early partnership positioning as a meaningfully lower risk than simply waiting for the institutional channel to fully mature and competition to intensify quite sharply.
04 / ALTERNATIVE FORM FACTOR INVESTMENT

Develop smart ring products before the segment consolidates further

Smart rings are steadily capturing consumers who never adopted smartwatches at all in the first place, representing genuinely incremental addressable demand rather than pure cannibalization of existing smartwatch product lines. Brands that delay market entry risk ceding this rapidly expanding segment entirely to specialist startups and other early-moving competitors already firmly active. MMA very strongly and quite clearly advises treating alternative form factor development as a standing product priority rather than a reactive afterthought bolted on once competitors already lead.

Engagement Snapshot From the Field

A live engagement with an industry participant carrying material or product regulatory and market exposure ahead of a defining policy shift, showing how our research translates into a defensible multi-year portfolio strategy.
MARKET MINDS ADVISORY · CLIENT ENGAGEMENT SUMMARY
Wearable Computing Devices Producer Strategic Portfolio Review and Transition Roadmap 2026·Investment Scenario on Wearable Computing Devices Exposure Evaluation 2025-26
CLIENT PROFILE
The client is a regional health insurer serving roughly 1.2 million members, seeking to launch a wearable-linked wellness discount program to reduce claims costs tied to preventable chronic conditions. Its existing wellness offerings relied on self-reported activity logs with low member participation and no independent verification of actual physical activity levels. The insurer's board required data-backed evidence before approving broader subsidy budgets.
STRATEGIC CHALLENGE
The insurer faced skepticism from actuarial and compliance teams over whether a wearable program could demonstrate measurable claims cost reduction sufficient to justify subsidizing device costs for participating members. Leadership needed a pilot program design that could prove value within one plan year before committing to broader member-wide rollout. Actuarial sign-off required a clearly defined measurement methodology from the outset.
MMA APPROACH
MMA conducted a competitive review of existing insurer wearable programs alongside interviews with the insurer's actuarial and member engagement teams, then benchmarked three wearable brand partnership models against verified data quality and member participation rates. The engagement produced a phased pilot design targeting a defined member cohort with elevated chronic disease risk factors.
KEY FINDINGS
  1. Verified wearable activity data correlated with a measurable reduction in emergency room visits among the pilot cohort members. across the entire pilot cohort overall.
  2. Member participation rates in wearable-linked programs ran roughly 40 percent higher than self-reported activity log programs previously offered. combined across the full pilot period.
  3. Two of three wearable brands evaluated already offered established insurer data integration APIs, reducing technical implementation timeline significantly. quite considerably for the program.
  4. Member retention within the health plan improved modestly among wearable program participants compared to the broader member population overall. notably higher than expected initially.
CLIENT PROFILE
The client is a regional health insurer serving roughly 1.2 million members, seeking to launch a wearable-linked wellness discount program to reduce claims costs tied to preventable chronic conditions. Its existing wellness offerings relied on self-reported activity logs with low member participation and no independent verification of actual physical activity levels. The insurer's board required data-backed evidence before approving broader subsidy budgets.
STRATEGIC CHALLENGE
The insurer faced skepticism from actuarial and compliance teams over whether a wearable program could demonstrate measurable claims cost reduction sufficient to justify subsidizing device costs for participating members. Leadership needed a pilot program design that could prove value within one plan year before committing to broader member-wide rollout. Actuarial sign-off required a clearly defined measurement methodology from the outset.
MMA APPROACH
MMA conducted a competitive review of existing insurer wearable programs alongside interviews with the insurer's actuarial and member engagement teams, then benchmarked three wearable brand partnership models against verified data quality and member participation rates. The engagement produced a phased pilot design targeting a defined member cohort with elevated chronic disease risk factors.
KEY FINDINGS
  1. Verified wearable activity data correlated with a measurable reduction in emergency room visits among the pilot cohort members. across the entire pilot cohort overall.
  2. Member participation rates in wearable-linked programs ran roughly 40 percent higher than self-reported activity log programs previously offered. combined across the full pilot period.
  3. Two of three wearable brands evaluated already offered established insurer data integration APIs, reducing technical implementation timeline significantly. quite considerably for the program.
  4. Member retention within the health plan improved modestly among wearable program participants compared to the broader member population overall. notably higher than expected initially.
RECOMMENDED STRATEGY
Phase 1: Phase 1 (Months 1-4): launch the pilot program with the defined elevated-risk member cohort and selected wearable brand partner. promptly. Phase 2: Phase 2 (Months 5-9): evaluate pilot claims and engagement data, then refine program design before broader rollout begins. carefully and thoroughly. Phase 3: Phase 3 (Months 10-12): expand the program to the full eligible member base based on validated pilot outcomes. fully and formally.
OUTCOME
The insurer completed pilot program launch within thirteen weeks, ahead of the sixteen-week target (client-reported, unverified by MMA). Pilot cohort claims costs declined measurably within two quarters of program launch, supporting the case for broader rollout (client-reported, unverified by MMA). The insurer has since expanded the wearable program to two additional member cohorts (client-reported, unverified by MMA).

Frequently Asked Questions

Foundational context covering the market sizes, CAGR, scope, country, region and competition that inform every finding below. This section is provided to cover basics and most often pre-purchase conversations, answered from the MMA Primary Research Dataset.

What is the current size of the Wearable Computing Devices Market?

The Wearable Computing Devices Market reached 68.5 billion dollars in 2025, the report's base year for all forecast calculations. This figure covers smartwatches, smart rings, and other body-worn computing devices globally.

How large will the Wearable Computing Devices Market be by 2036?

The market is projected to reach 303.76 billion dollars by 2036, roughly 3.87 times its 2026 starting value. That growth reflects continuous health monitoring adoption and expanding insurer wellness programs.

What is the CAGR for the Wearable Computing Devices Market 2026 to 2036?

The market is forecast to grow at a 14.5 percent compound annual rate between 2026 and 2036. Bull and bear scenarios range from 15.8 percent to 13.2 percent respectively.

Which segment is growing fastest?

Smart rings and continuous health monitors lead growth at 22.0 percent CAGR, roughly 1.52 times the overall market rate. Consumers seeking less visible, more capable devices are driving this expansion.

Who are the major companies in the Wearable Computing Devices Market?

Apple, Samsung, Garmin, Fitbit, and Xiaomi lead the market on a unit revenue basis. Together these five brands hold roughly 62 percent combined market share.

Which country is growing fastest?

India leads country-level growth at 22.5 percent CAGR, driven by its rapidly expanding middle class and increasingly affordable domestic wearable brands. Rising health awareness is accelerating adoption further.

Report Segmentation Architecture

The full report scope spans multiple orthogonal segmentation dimensions, with cross-tabulated demand data provided for each dimension pair. Coverage extends further to regional breakdowns, trend trajectories, and the competitive detail needed to support segment-level decision-making.

By Primary Market Dimension

  • Smart Rings and Continuous Health Monitors
  • Traditional Smartwatches
  • Fitness Bands
  • Smart Glasses and Hearables
  • Enterprise and Industrial Wearables

By End-Use Industry

  • Consumer Fitness and Wellness
  • Healthcare and Chronic Disease Management
  • Corporate Wellness Programs
  • Sports and Athletic Performance
  • Enterprise and Industrial

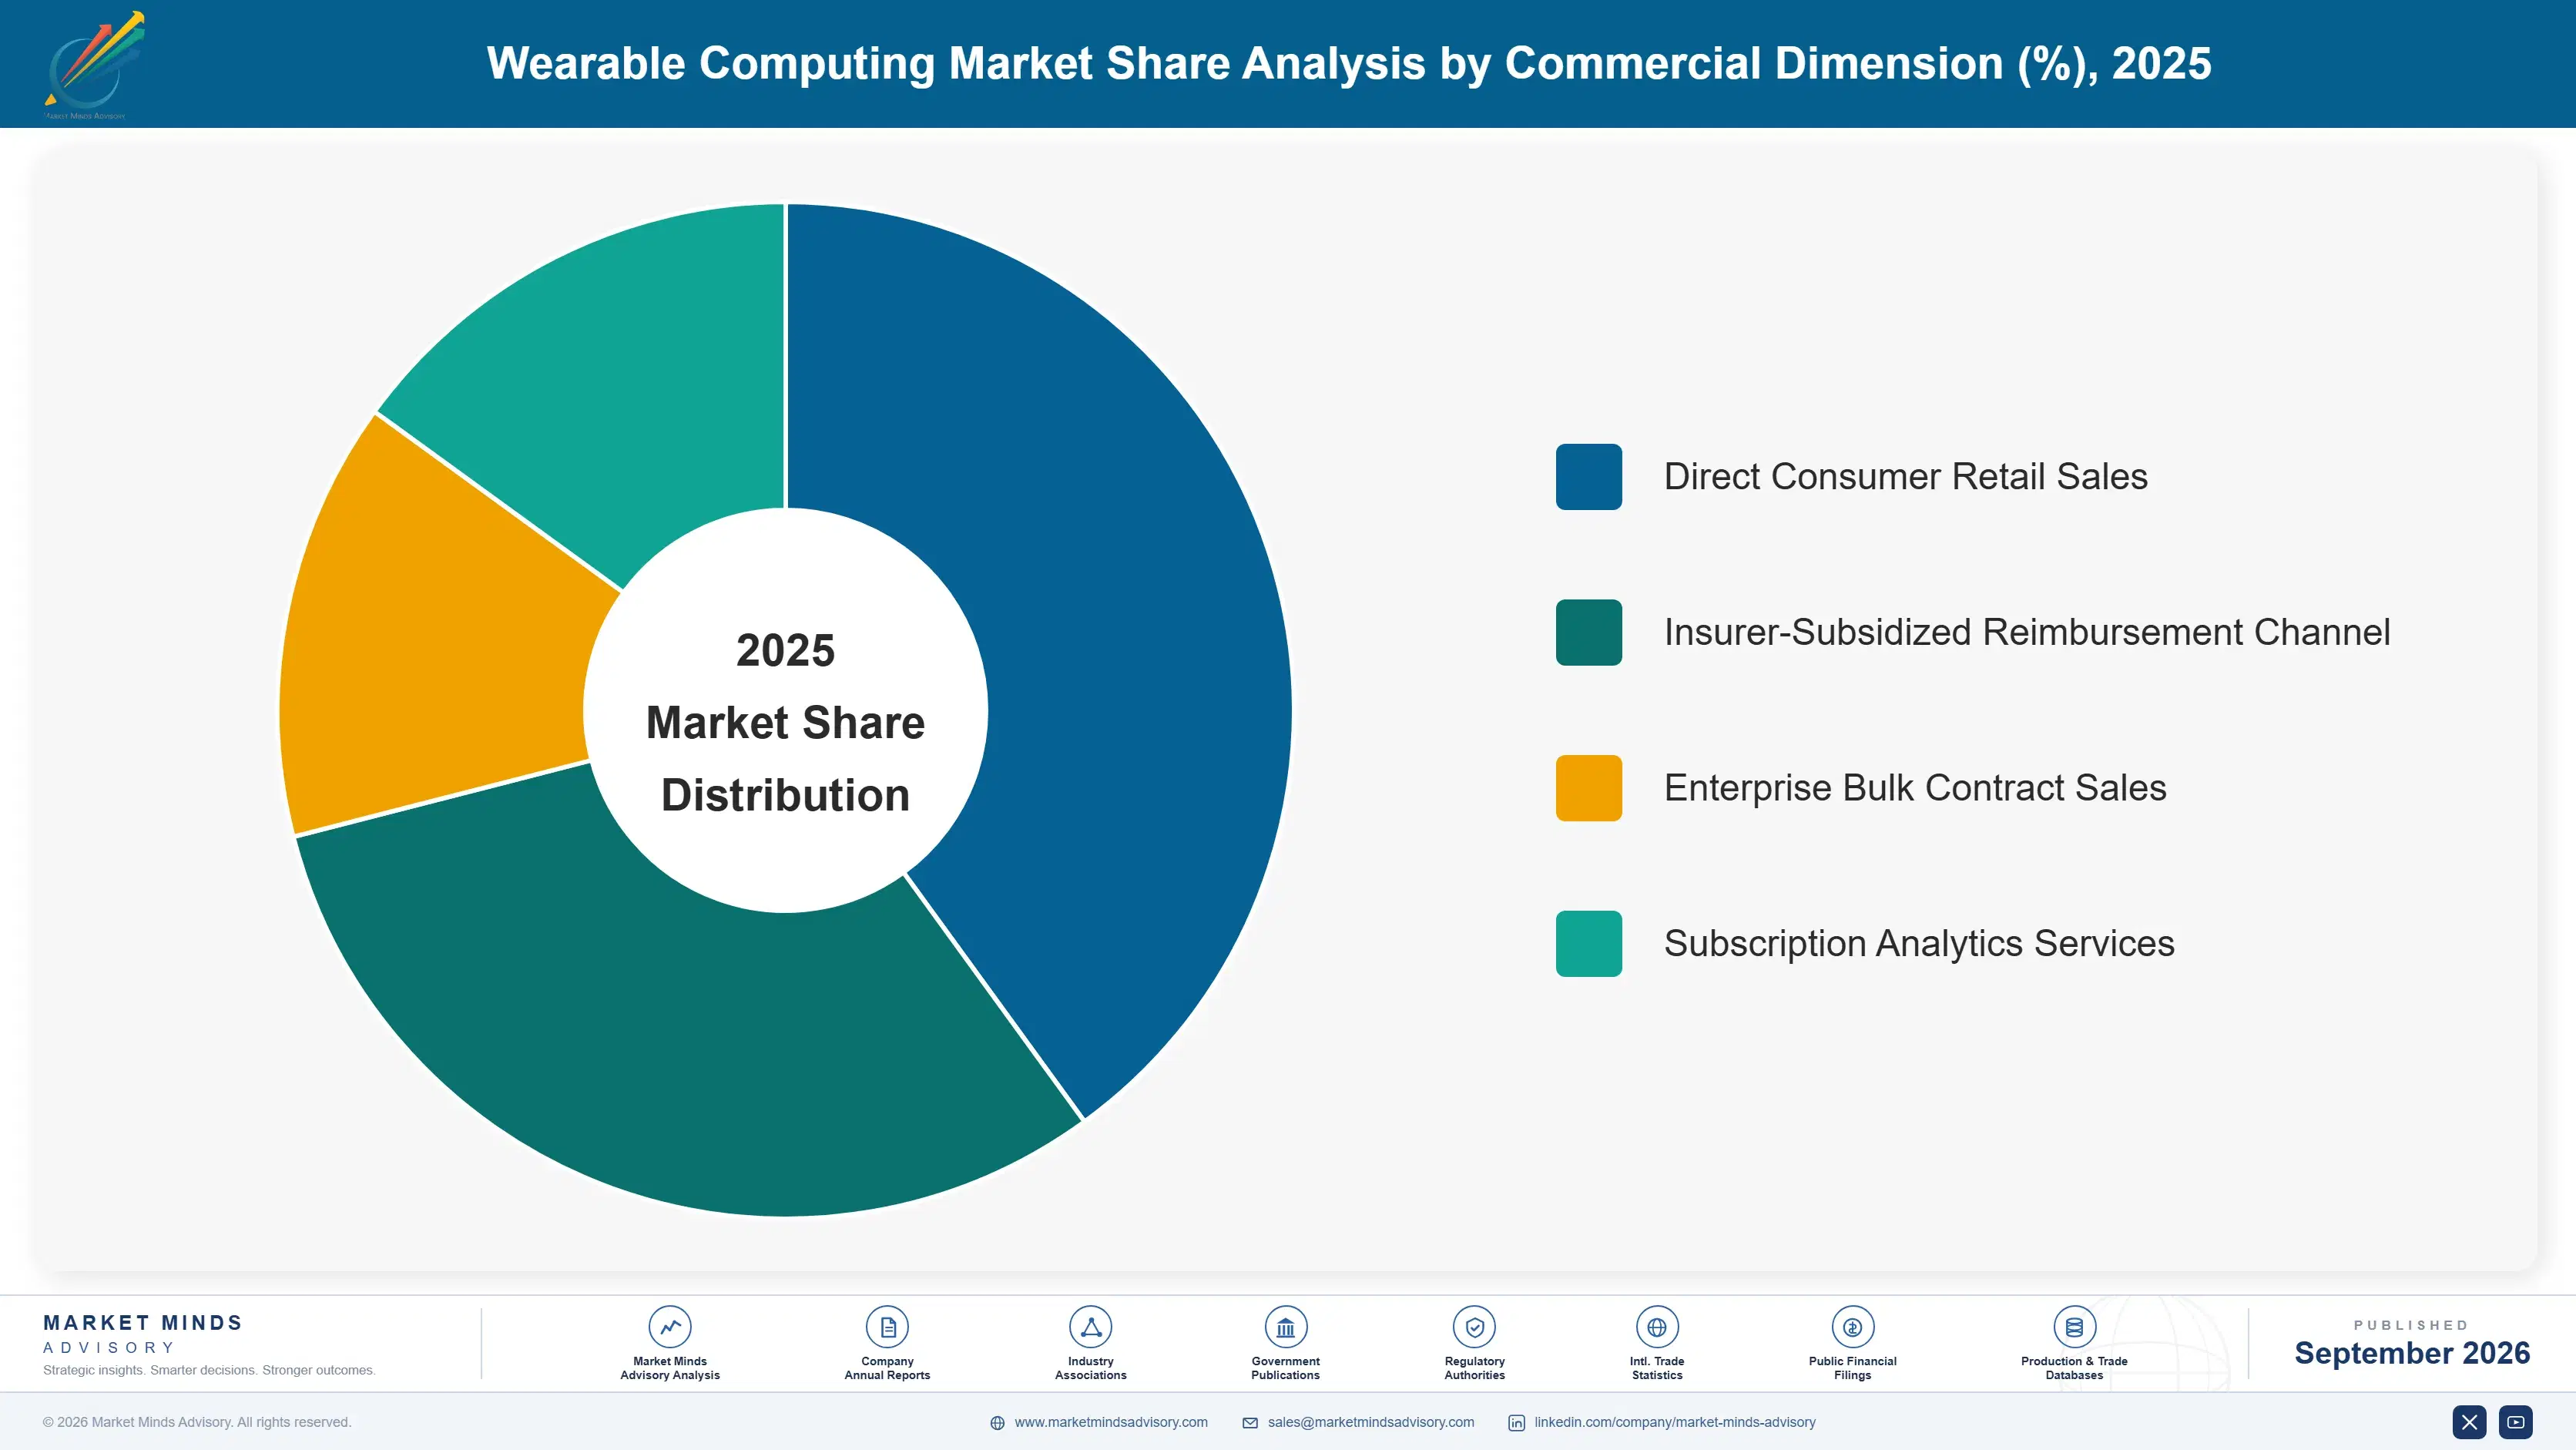
By Commercial Dimension

  • Individual Consumer Retail
  • Health Insurer Partnership Programs
  • Enterprise Wellness Fleet Contracts
  • Sports and Fitness Institutions

By Region

  • North America
  • Western Europe
  • East Asia
  • South Asia and Pacific
  • Latin America
  • Middle East and Africa
  • Eastern Europe

Scope, Methodology, and Coverage

Every figure in this report is reproducible from documented input assumptions. The scope below maps the historical period, the forecast horizon, the segmentation dimensions, and the countries covered, alongside the underlying primary and qualitative methodology.
Historical Period
2020 to 2025
Forecast Period
2026 to 2036
Base Year
2025 (USD billions; MMA Primary Research Dataset, September 2026)
Market Definition
This report covers wrist-worn, ring-form, and other body-worn computing devices with integrated sensors for health monitoring, fitness tracking, and connectivity, measured on a global unit and revenue basis across consumer and enterprise markets. It excludes implantable medical devices and hearables that function purely as audio accessories without dedicated sensor arrays.
Quantitative Units
USD billions, global market size and forecast
Segmentation Dimensions
Product/technology type, end-use industry, commercial/customer dimension, region
Regions Covered
North America, Western Europe, East Asia, South Asia and Pacific, Latin America, Middle East and Africa, Eastern Europe
Countries Covered
United States, China, Germany, France, United Kingdom, Japan, South Korea, India, Canada, Brazil, Mexico, Indonesia, Vietnam, Thailand, Malaysia, United Arab Emirates, Saudi Arabia, South Africa, Nigeria, Turkey, Poland, Netherlands, Italy, Spain, Sweden, Switzerland, Argentina, Colombia, Australia, Singapore, and additional markets relevant to this sector
Key Companies Profiled
Apple, Samsung, Garmin, Fitbit (Google), Xiaomi, Huawei, Amazfit (Zepp Health), Whoop, Oura, Fossil Group, Withings, Polar Electro, Suunto, Coros, Honor, Realme, OnePlus, Ultrahuman, Circular, Movano Health
Quantitative Methodology
Primary survey, n=3,800 respondents, Q4 2025, six countries; demand-side model with trade association cross-validation
Qualitative Methodology
47 expert interviews, Q4 2025; applied to validate demand model assumptions, identify emerging dynamics, and assess competitive positioning
Report Format
PDF and XLSX data workbook (Word format preview document)
Publisher
Market Minds Advisory
Report Code
MMA-2026-TEC-136
Published
September 2026
Contact
sales@marketmindsadvisory.com | www.marketmindsadvisory.com

Purchase the full Wearable Computing Devices Market Report (2026 to 2036).

This report delivers a comprehensive analysis of the global Wearable Computing Devices Market, covering market sizing, segmentation, and regional dynamics through 2036. It profiles the competitive landscape across twenty leading brands, benchmarked on a consistent unit revenue basis. Regional analysis spans all seven major world regions, quantifying share and growth rate differences driven by manufacturing, health, and consumer adoption factors. The report also examines revenue diversification strategies, input cost exposure, and portfolio economics shaping brand profitability. A dedicated case study illustrates practical implementation lessons for insurers pursuing wellness program launches.
Ten-year market size and CAGR forecast through 2036
Five-segment MECE market breakdown with growth rates
Seven-region share and growth rate analysis
Twenty-company competitive benchmarking on unit revenue basis
Revenue diversification strategy analysis across four commercial levers
Anonymized client implementation case study with outcomes

Built For The People Who Decide

From boardroom strategy to bench-side execution, this report is read cover-to-cover by leaders shaping the next decade of their industry, turning demand scenarios, market dynamics and valuation benchmarks into decisions.
CXOs/ Presidents/ VPs/ Managers
M&A and Corporate Development
Strategy Teams and R&D Heads
Procurement and Product Directors
Regulatory and Compliance Leaders
Investor Relations and Equity Analysts