

Market Minds Advisory
Water-Soluble Fertilizer Market

Water-Soluble Fertilizer Market: Sold As Nutrition, Bought As An Irrigation Decision

Nobody installs drip irrigation for the fertiliser, and once it is installed the wrong salt will block the emitters, which makes this a hardware driven market wearing a crop nutrition label.

Lead Analyst

Published

September 2026

Make Smarter Decisions with Customized Research Insights

Request a free sample report and evaluate market opportunities, growth trends, and competitive dynamics relevant to your business needs.

2025 MARKET VALUE$16.4BMarket Size 2025
2036 FORECAST VALUE$33.8BBase Case , 2026 to 2036
CAGR 2026 TO 20366.8 %Bull 8.0% / Bear 5.6%
INCREMENTAL OPPORTUNITY$16.3BNet 10- year value creation
EXPANSION MULTIPLE1.93x2036 value over 2026 base
Strategic Levers
M&A Pipeline
Regional Outlook
Country Rankings
Competitive Intelligence
Segmental Deep-dive
Call-Us : 91 93563 13602

Executive Snapshot and Market Trajectory

This is sold as a fertiliser and bought as an irrigation decision. Nobody installs drip for the nutrition; they install it for the water, and soluble product follows because the wrong salt will block an emitter system that cost thousands per hectare. Hardware installed determines the addressable market.
That inversion explains why irrigation subsidy programmes move this category further than fertiliser prices ever do. India grows at 11.4%, faster than any market covered, on micro-irrigation schemes rather than on nutrition policy. Micronutrient chelates grow fastest at 10.2%, half again the market rate, because decades of nitrogen, phosphorus and potassium only fertilisation depleted soil zinc, iron and boron measurably. Nutrition policy barely matters here.
Competition is fragmented, with the top five holding 31% of production capacity across global specialists, Chinese producers and regional blenders. The defensible position is purity rather than analysis, since a grade leaving insoluble residue destroys the emitters it passes through and an ammonia producer cannot simply decide to make one. China holds 31% of demand on national water and fertiliser integration policy. Policy rather than agronomy set that position, which is unusual for a fertiliser.
Market Definition
Fully water-soluble fertiliser grades applied through irrigation systems or as foliar sprays, covering water-soluble NPK blends, potassium nitrate, calcium nitrate, monoammonium and monopotassium phosphate, micronutrient chelates and specialty acids. Measured at manufacturer selling value. Conventional granular and bulk fertilisers, controlled release coated products, bulk liquid nitrogen solutions, biostimulants and irrigation hardware are excluded from scope.
Base Year Value
$16.4B in 2025 (MMA Primary Research Dataset, August 2026)
Forecast Period
2026 to 2036, eleven discrete annual values
CAGR
6.8% base case. Bull 8.0%. Bear 5.6%.
Fastest Growth Segment
Micronutrient Chelates: 10.2% CAGR
Fastest Growth Country
India: 11.4% CAGR
Fastest Growth Region
South Asia and Pacific: 9.0% CAGR
Largest Region
East Asia: 31% of 2025 global value
Market Leaders
Yara International, ICL Group, Haifa Group, K+S, Nutrien. Source: MMA Primary Research Dataset, July 2026.
Primary Survey
n=3,800 procurement and R&D decision-makers, Q4 2025, six countries
Methodology
Demand-side build-up, cross-validated against public data, 47 expert interviews

Water-Soluble Fertilizer Market Forecast Scenarios

water-soluble-fertilizer-market-trends-size-forecast-scenario-1787664844599
The five years to 2025 tracked irrigation hardware installation rather than crop nutrition demand, which is the pattern this category has always followed. Micro-irrigation expanded across India, China and parts of Latin America under subsidy programmes, and soluble fertiliser demand followed the pipe. The 5.8% historical rate also absorbed a severe input cost disruption that pushed prices well above trend for two seasons before they corrected.
The 6.8% base case rests on three mechanisms. Irrigation subsidy programmes keep expanding fertigated area, with India growing at 11.4% and China pursuing national water and fertiliser integration targets. Micronutrient chelates grow at 10.2% as soil depletion from decades of macronutrient only fertilisation becomes measurable in yield response. And protected cultivation keeps expanding, taking 38% of category volume onto systems that cannot use anything else. Three mechanisms, none of them agronomic.
The 8.0% bull case turns on nutrient runoff regulation tightening in a major agricultural jurisdiction, since fertigation delivers around 42% better nutrient use efficiency than broadcast application and regulation would convert an economic argument into a compliance one. The 5.6% bear case is input cost: ammonia, potash and phosphate pricing moves this category, and growers defer soluble purchases first.

The Fertiliser The Pipe Chooses

The purchase decision happens before the fertiliser is considered at all. A grower installs drip or micro-sprinkler irrigation for water security, water cost or yield consistency, and once that system exists the fertiliser choice is made for them, because anything leaving insoluble residue will block emitters that cost thousands of dollars per hectare to install. Fertigated area, not nutrient demand, sets the size of this market.
TOP FIVE CONCENTRATION31%Combined production capacity held by the leading suppliers
FERTIGATED CROPLAND SHARE17%Irrigated area receiving nutrients through the irrigation system
PRICE PREMIUM OVER GRANULAR3.4xCost per nutrient unit against conventional bulk products
INSOLUBLE RESIDUE LIMIT0.1%Maximum tolerated before emitter blockage risk becomes material
PROTECTED CULTIVATION SHARE38%Category volume consumed under greenhouse and tunnel production
NUTRIENT EFFICIENCY GAIN42%Improvement against broadcast application on comparable irrigated crops
That makes the specification that matters solubility and purity rather than analysis. Two products can carry identical nitrogen, phosphorus and potassium numbers while one dissolves completely and the other leaves a residue that ends an irrigation system's working life early. Growers pay roughly 3.4 times the cost per nutrient unit of conventional granular for that difference, which is a striking premium for chemistry that delivers the same elements.
The premium is also what makes the category defensible. An ammonia producer can make urea at scale and cannot simply decide to produce a chloride free, low insoluble, fully soluble grade at consistent purity, since that is a different manufacturing problem involving different feedstock quality and different process control. Commodity fertiliser economics and soluble grade economics have far less in common than the shared word suggests.
"Growers do not buy this because they read the analysis on the bag. They buy it because a blocked emitter costs more to replace than a decade of premium fertiliser, and everybody who has cleaned a drip line already knows that."
Director, Crop Nutrition and Agricultural Inputs Practice · MMA Agriculture and Crop Inputs Practice · August 2026

Market Trends

Micronutrient Depletion Becomes Measurable In Yield Response

Decades of nitrogen, phosphorus and potassium focused fertilisation drew down soil zinc, iron, boron and manganese across intensively cropped regions, and the deficiency now shows in yield response rather than only in soil tests. Chelated forms are the only practical route to deliver these elements through an emitter, since unchelated metal salts precipitate in irrigation water and block exactly what they pass through. Micronutrient chelates grow at 10.2% against a market rate of 6.8%, the fastest segment in the category. Calcareous soils requiring EDDHA iron carry the highest value per hectare of anything sold here.
Market Impact: India grows at 11.4% annually

Protected Cultivation Expands Where Nothing Else Can Be Used

Greenhouse, tunnel and soilless production already accounts for 38% of category volume, and those systems cannot use granular fertiliser at all because there is no soil buffer and no mechanism to apply it. Expansion of protected area across China, the Netherlands, Spain, Mexico and increasingly India therefore converts directly into soluble demand with no substitution risk whatsoever. Nutrient recipes here are crop stage specific and change several times through a season, which favours suppliers offering formulation support alongside product. It also produces considerably stickier customer relationships than field crop supply ever does.
Market Impact: Efficiency gain reaches 42% against broadcast

Market Opportunities and Growth Drivers

Micro-Irrigation Subsidy Programmes Expand Fertigated Area

Indian micro-irrigation subsidy schemes have driven drip and sprinkler installation across horticulture and sugarcane, and soluble fertiliser demand follows the hardware because emitters cannot pass anything else safely. India grows at 11.4%, faster than any market covered. Chinese water and fertiliser integration policy pursues similar targets at considerably larger scale, tying irrigation efficiency and fertiliser reduction objectives together in one programme. Suppliers positioned with irrigation equipment integrators rather than with agricultural retailers capture demand at the point the decision is genuinely made. Retail arrives a full season after that decision is taken.
Market Impact: Premium reaches 3.4 times granular cost

Nutrient Use Efficiency Turns Economic Argument Into Compliance

Fertigation delivers roughly 42% better nutrient use efficiency than broadcast application on comparable irrigated crops, because nutrients arrive at the root zone in solution and in the quantity the crop can take up. That has been an economic argument for thirty years and growers weighed it against a price premium of about 3.4 times per nutrient unit. Nitrate runoff regulation across European and North American catchments increasingly converts that trade into a compliance requirement, which removes the grower's discretion in the calculation entirely. Documentation replaces judgement as the basis for application.
Market Impact: Only 17% of irrigated area fertigated

Market Restraints and Challenges

Price Premium Defers Purchase Before Anything Else Does

Soluble grades cost around 3.4 times per nutrient unit what conventional granular does, which makes them the first line growers cut when commodity prices fall or input costs rise. The root cause is manufacturing: purity, solubility and chloride control require feedstock quality and process discipline that bulk fertiliser production does not carry. Commercially this produces demand that swings harder than the underlying cropped area ever does. Suppliers respond with season long supply agreements and with blends trading some purity for price, which protects volume and erodes the premium. That trade rarely ends well.
Market Impact: Fastest segment growing at 10.2%

Irrigation Hardware Installation Rate Caps Addressable Demand

Only around 17% of irrigated cropland receives nutrients through the irrigation system, and no fertiliser marketing changes that number because it depends on capital installed in the field. The root cause is that drip and micro-sprinkler systems require investment growers make for water reasons, on timelines set by subsidy availability and water pricing rather than by nutrition. Commercially this means demand growth is imported from an adjacent industry entirely. Suppliers respond by working alongside irrigation integrators and by supporting subsidy applications, which influences timing without changing it. Timing is all anybody controls.
Market Impact: Protected systems take 38% of volume
4 additional market trends, 3 additional growth drivers, and 2 additional restraints and challenges are covered in the full report. Contact sales@marketmindsadvisory.com to access the complete intelligence.

Segment CAGR and Growth Architecture

Segmentation follows product chemistry, since chemistry determines solubility behaviour, compatibility in the tank, which crops and soils it suits, and what manufacturing capability a supplier needs. Six chemistries cover the category as traded. Growth tracks nutrient deficiencies that are becoming binding rather than the volumes that macronutrients still command. Deficiency, not tonnage, sets the pace.
water-soluble-fertilizer-market-trends-market-share-analysis-1787664845199

Micronutrient Chelates

Zinc, iron, manganese, copper and boron delivered in chelated form using EDTA, DTPA, EDDHA or amino acid complexes that keep the metal in solution through an irrigation line. At 10.2% this is the fastest growing chemistry, half again the market rate of 6.8%, and soil depletion rather than fashion explains it. Decades of macronutrient focused fertilisation drew these elements down across intensively cropped regions until deficiency began showing in yield rather than only in soil tests. Unchelated metal salts precipitate in irrigation water and block emitters, so chelation is not a premium option here but the only practical delivery route available. Suppliers without chelation capability watch this demand pass to somebody who has it.
CAGR 10.2%

Calcium Nitrate

Highly soluble calcium and nitrate nitrogen source used heavily in protected cultivation and in fruit and vegetable production where calcium related disorders determine marketable yield. Growth of 8.6% is second fastest in the category, driven by quality rather than by tonnage. Blossom end rot, tipburn and poor fruit firmness are calcium problems that show up in the packhouse rather than the field, and a rejected consignment costs far more than the fertiliser ever did. Compatibility is the technical constraint, since calcium and phosphate or sulphate cannot share a stock tank without precipitating and blocking the system. Formulation support therefore matters as much as the product, which favours suppliers carrying agronomic capability.
CAGR 8.6%
Full segment breakdown across 6 segments available in the complete report.

Regional Architecture and Country Demand Map

East Asia holds 31%, above the standard band, on Chinese national water and fertiliser integration policy and the largest protected cultivation area anywhere. North America follows at 22% and Western Europe at 20%. India grows fastest at 11.4%. Hardware installation rather than nutrition demand sets the pace.

North America

Californian and Pacific Northwest permanent crops carry much of this 22% share, where drip irrigation is standard practice on almonds, pistachios, grapes and berries and where water cost makes efficiency a survival question rather than an optimisation one. Florida and Mexico adjacent protected vegetable production adds substantial volume on the same logic. Nitrate management regulation in several catchments is converting the efficiency argument into a compliance requirement, which removes grower discretion from the decision. Canadian greenhouse production is concentrated and technically sophisticated. Growth of 5.8% reflects a mature fertigated base expanding gradually rather than any new installation wave. Water cost rather than nutrition economics is what carries adoption across this region.
Share: 22% | CAGR: 5.8% (2026 to 2036)

Western Europe

Dutch, Spanish and Italian protected cultivation anchors this 20% share, with the Netherlands operating the most technically advanced soilless production anywhere and Spanish greenhouse horticulture the largest by area. Nitrate directive requirements across the region have made nutrient accounting mandatory rather than advisory, which favours precise fertigation over broadcast application directly. Southern European water scarcity reinforces the same conclusion from a different direction entirely. Supplier competition here runs on formulation support and agronomic service as much as on product. Growth of 5.2% is the lowest of the seven regions and reflects a fertigated base already close to fully developed. Nutrient accounting obligations are doing work that price signals never managed here.
Share: 20% | CAGR: 5.2% (2026 to 2036)
Regional intelligence for 5 additional markets available in the complete report: East Asia, South Asia and Pacific, Latin America, Middle East and Africa, Eastern Europe. Contact sales@marketmindsadvisory.com.
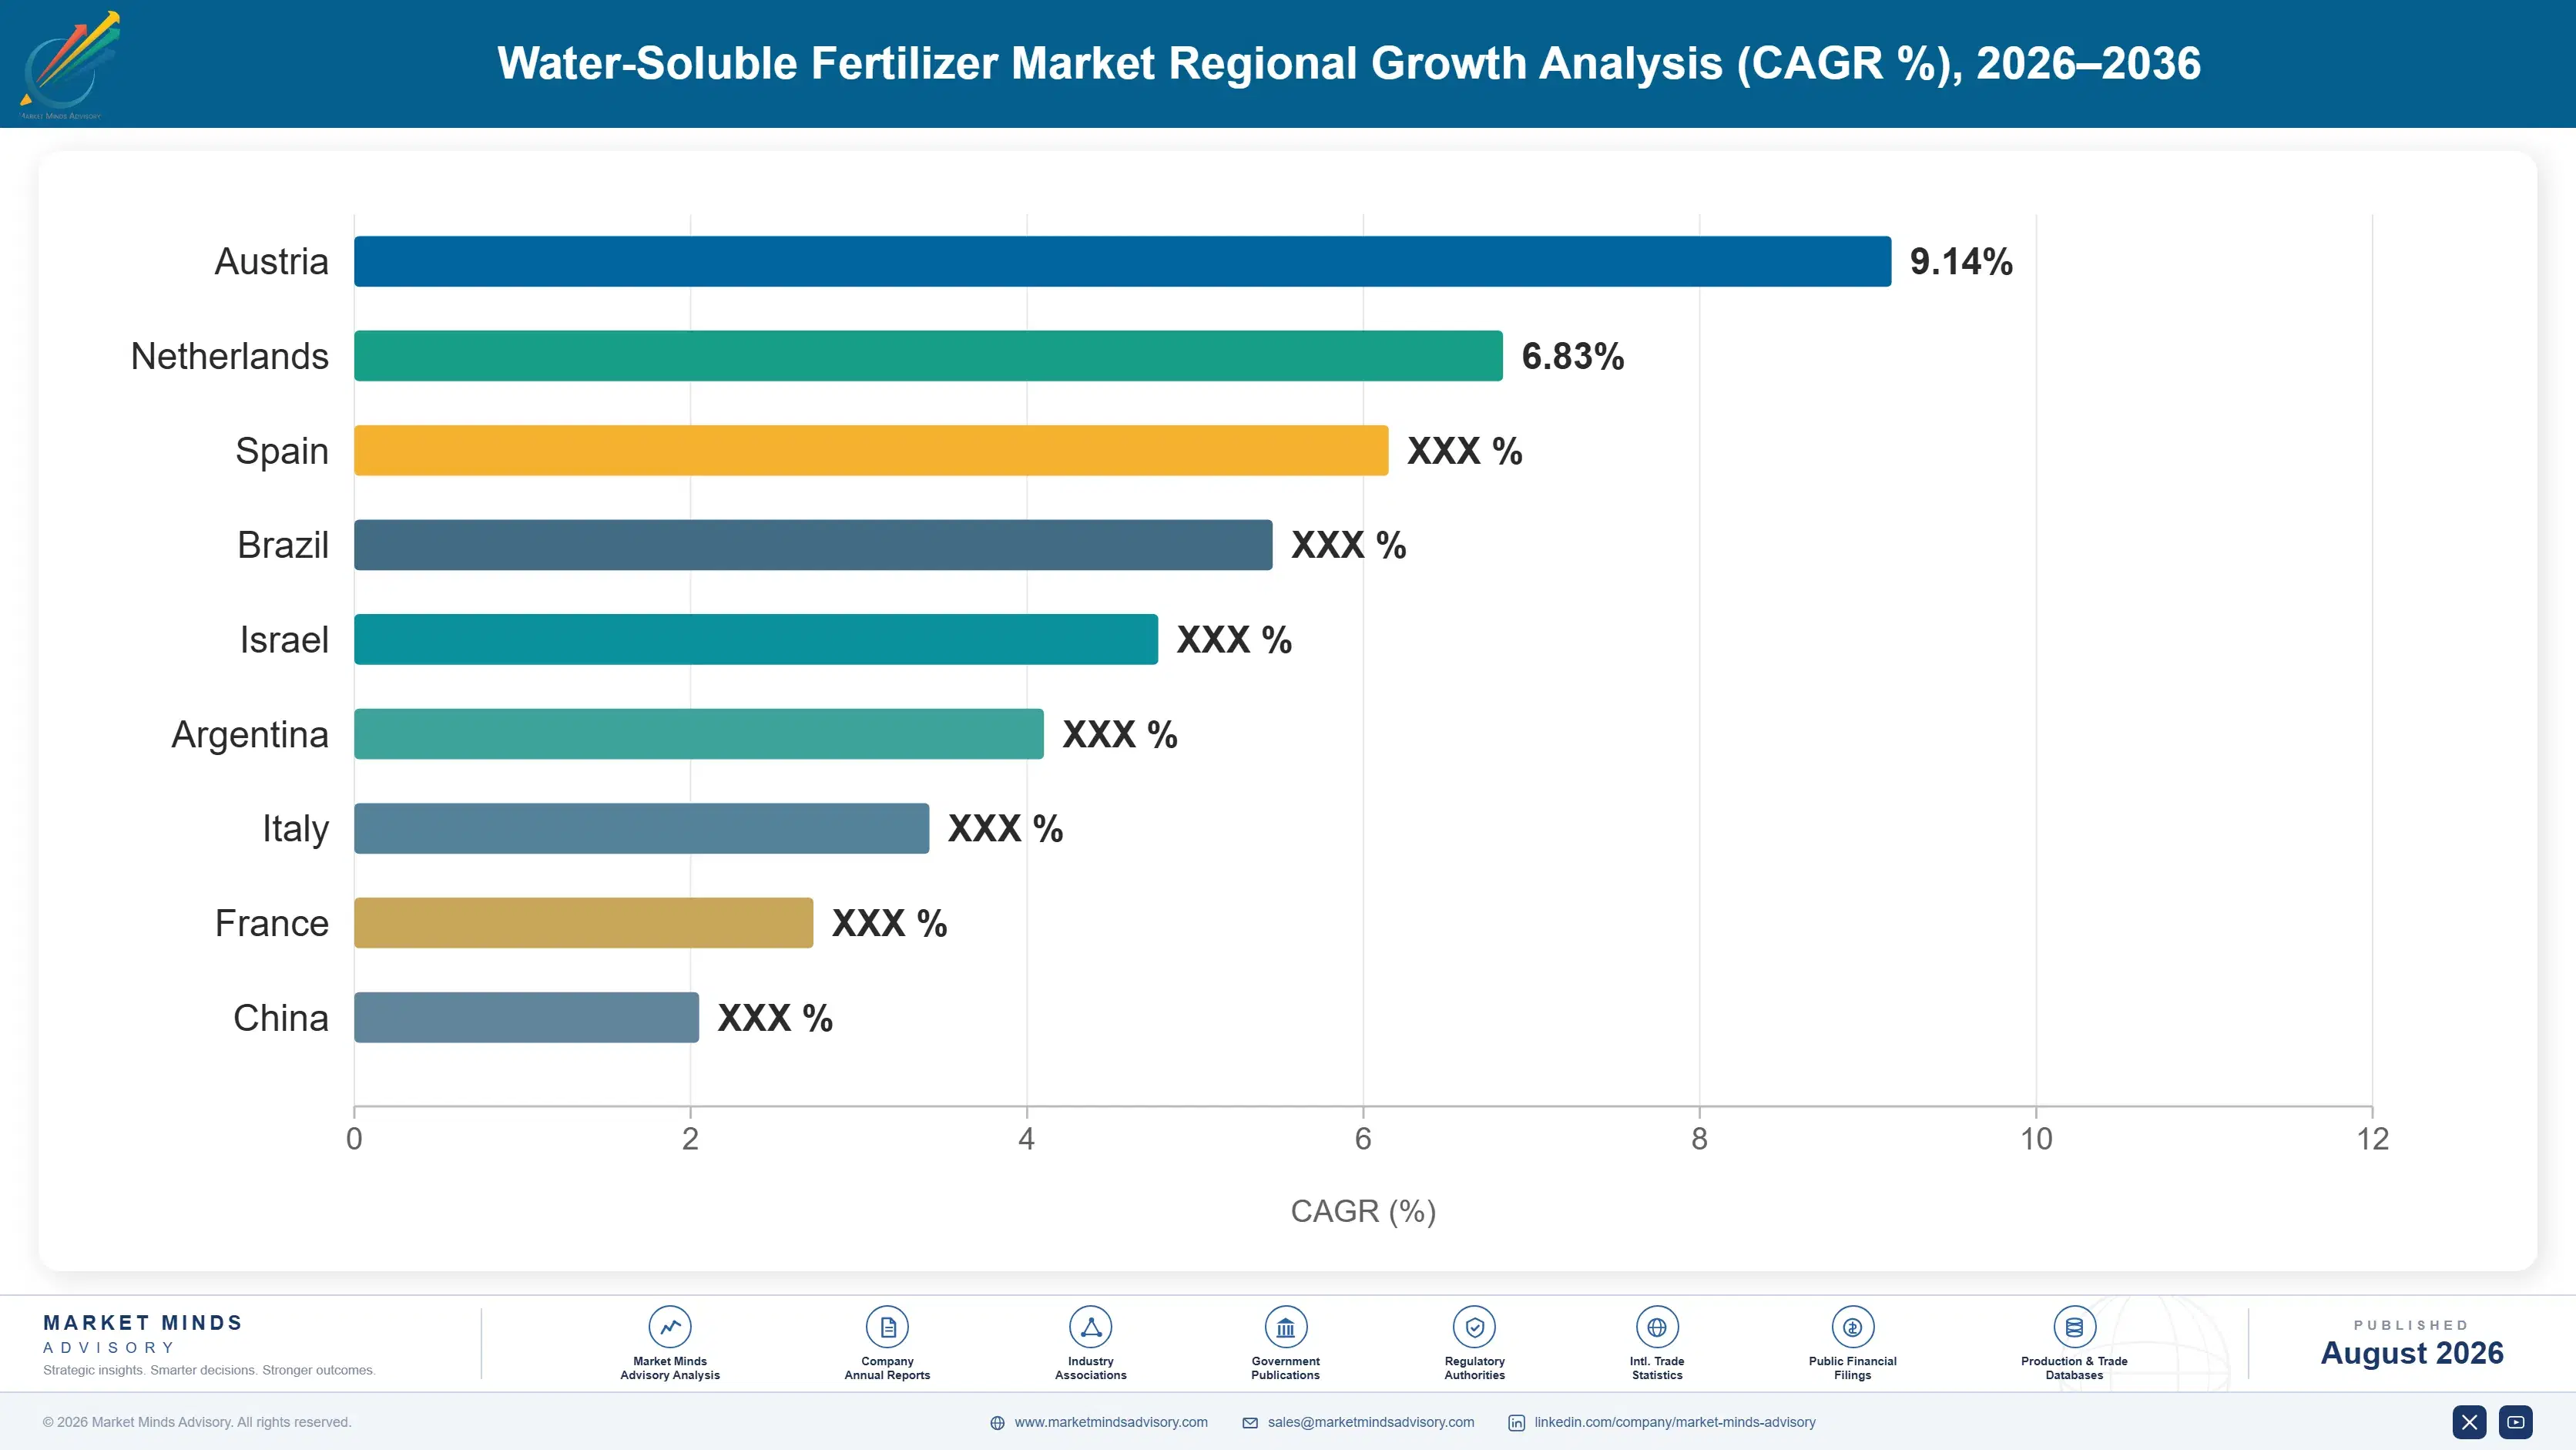
water-soluble-fertilizer-market-trends-country-cagr-analysis-1787664845713

Where This Category Actually Earns

Nothing here is won on nutrient analysis, because two products carrying identical numbers can behave completely differently in an emitter. Value accrues to whoever reaches the grower when the irrigation system is specified, whoever controls purity, whoever can chelate micronutrients properly, and whoever times subsidy programmes. Four routes carry weight and none is a nutrition argument.

Follow The Irrigation Hardware Not The Crop

The purchase decision is effectively made when a grower installs drip or micro-sprinkler irrigation, because emitters costing thousands of dollars per hectare cannot safely pass anything leaving residue. Only around 17% of irrigated cropland is fertigated, so addressable demand is set by hardware installed rather than by nutrition requirement. Suppliers positioned alongside irrigation integrators and system designers reach the grower at the point the decision is genuinely taken, while those selling through agricultural retail arrive after it. Channel position here matters considerably more than product specification does. Retail arrives after the decision.
Market Impact: Reaches the 17% fertigated area before retail does

Sell Solubility Specification Rather Than Nutrient Analysis

Two grades carrying identical nitrogen, phosphorus and potassium numbers can behave entirely differently in an irrigation line, and the one leaving insoluble residue shortens the working life of the system it passes through. That difference is why growers accept roughly 3.4 times the cost per nutrient unit of conventional granular. Suppliers competing on analysis are competing on the specification that does not matter, while those competing on residue, chloride content and tank compatibility hold a position an ammonia producer cannot simply decide to enter. Purity rather than chemistry is the actual barrier.
Market Impact: Defends the 3.4 times premium over conventional granular

Build Micronutrient Chelate Capability Ahead Of Demand

Micronutrient chelates grow at 10.2% against a market rate of 6.8%, the fastest chemistry in the category, because decades of macronutrient focused fertilisation drew soil zinc, iron and boron down until deficiency began appearing in yield. Chelation chemistry is a genuinely different manufacturing capability from salt blending, and EDDHA iron for calcareous soils carries the highest value per hectare of anything sold here. Suppliers building that capability before the deficiency becomes obvious to growers hold pricing power that blenders entering later will not have. Blenders entering later find the pricing already set.
Market Impact: Captures the fastest growing chemistry at 10.2% annually

Position Where Subsidy Programmes Fund Drip Installation

Indian micro-irrigation subsidy schemes and Chinese water and fertiliser integration policy expand fertigated area on timelines set by government budgets rather than by grower economics, and India grows at 11.4% as a direct consequence. Suppliers supporting subsidy applications and working with approved system integrators are present when the hardware goes in, which is when the fertiliser relationship forms. Arriving a season later means competing against an incumbent whose product the grower already knows will not block the emitters. Government budget cycles rather than crop economics set the timing that matters here.
Market Impact: Captures the 11.4% Indian growth rate through 2036

Who Controls the Margin Pool

Concentration is low for a chemical category. The top five hold 31% of production capacity, the basis applied consistently throughout this section, across a field mixing global specialists, integrated fertiliser producers, Chinese volume manufacturers and regional blenders serving local crop patterns. Yara International leads on capacity breadth and agronomic service reach, and the gap to challengers reflects distribution and formulation support rather than any chemistry advantage that could not be replicated.
Competition runs on three fronts. Global specialists compete on purity specification and agronomic service in high value horticulture, which is where the premium survives. Chinese producers compete on cost in the largest single national market and increasingly on export. And regional blenders compete on crop specific formulation and local relationships, which is a genuinely defensible position at small scale.

Rankings will move with chelation capability and irrigation channel access rather than with macronutrient capacity, since the fastest growing chemistry requires manufacturing that salt blenders do not hold. The other pressure point is input cost pass through, which favours integrated producers holding their own ammonia, nitric acid or potash over blenders buying every input at market.
water-soluble-fertilizer-market-trends-company-positioning-matrix-1787664846246

Competitive Moat and Risk Dimensions

YARA INTERNATIONAL

Moat: Integrated Nitrogen Production Base

Owning ammonia and nitric acid production upstream of calcium nitrate and soluble nitrogen grades gives cost position and supply security that a blender buying inputs at market cannot match through any period of volatility. Agronomic service reach across major horticultural regions reinforces that, since formulation support is what protects premium pricing.
YARA INTERNATIONAL

Risk: European Gas Cost Exposure

European ammonia production is directly exposed to gas pricing that moved several times above historical norms during the last disruption, forcing curtailments across the industry. That exposure sits against competitors producing in regions with cheaper energy, and it arrives at exactly the moments when growers are most inclined to defer premium purchases anyway.
ICL GROUP

Moat: Potash And Phosphate Integration

Upstream potash and phosphate positions feeding soluble grade production give input security and cost advantage in chemistries where feedstock purity determines whether the finished product is fit for an emitter at all. Specialty formulation depth built across decades in a market that invented fertigation reinforces the technical position considerably.
ICL GROUP

Risk: Concentrated Regional Production

Production concentrated in a small number of locations carries geopolitical and logistics exposure that more distributed competitors do not face, in a category where delivery reliability into a growing season matters as much as price. A supply interruption during a planting window costs a customer relationship rather than a single order.

Players Tracked

Prominent Players

Yara International
ICL Group
Haifa Group
K+S
Nutrien

Other Key Players

Coromandel International
SQM
EuroChem Group
OCI Global
Kingenta Ecological Engineering
Stanley Agriculture Group
Sinofert Holdings
Grupa Azoty
Van Iperen International
Deepak Fertilisers and Petrochemicals
Omex Agrifluids
Valagro
Hebei Monband Water Soluble Fertilizer
AgroLiquid
Migao Corporation

Recent Developments

FEBRUARY 2025

Indian producer expands water-soluble capacity against subsidy demand

An Indian fertiliser producer expanded water-soluble grade capacity to serve demand growing at 11.4% annually, faster than any market covered. The investment was organic capacity expansion rather than any acquisition, and it follows micro-irrigation subsidy installation rather than any change in crop nutrition policy. Hardware leads and product follows.
Signal: Capacity follows irrigation hardware installation, which is set by government budgets rather than by agronomy or crop prices
MAY 2025

Chelate producer commissions EDDHA capacity for calcareous soils

A specialty producer commissioned additional EDDHA iron chelate capacity serving calcareous soil regions where unchelated iron precipitates and blocks emitters. Micronutrient chelates grow at 10.2%, the fastest chemistry in the category, and EDDHA carries the highest value per hectare of anything traded here. Manufacturing capability decides who participates.
Signal: Chelation is a different manufacturing capability from salt blending and it is where the growth sits
SEPTEMBER 2025

Nitrate catchment rules tighten nutrient accounting for irrigated growers

Catchment level nitrate regulation tightened nutrient accounting obligations for irrigated growers in a major agricultural jurisdiction, requiring documented application rather than estimated. Fertigation delivers roughly 42% better nutrient use efficiency than broadcast application, which turns an economic preference into a compliance route. Documentation replaces estimation across the catchment.
Signal: Regulation removes grower discretion from a calculation that a price premium had previously governed on its own

What Soluble Grade Purity Costs

Ammonia and nitric acid account for roughly 34% of cost of goods across nitrogen bearing grades, with potash and phosphate feedstock contributing another 27% and energy carrying most of the remainder. Feedstock purity requirements sit above bulk fertiliser standards, since insoluble content that is irrelevant in a granular product blocks emitters in a soluble one. European ammonia and North American potash supply are the principal origins.
European ammonia curtailment demonstrated the exposure directly, as gas prices reaching several times historical norms made production uneconomic and forced plant shutdowns across the continent. IEA gas price data recorded the movement and fertiliser producer annual reports documented the curtailments and the pass through that followed. Soluble grade buyers absorbed increases at exactly the point growers were most inclined to defer a product already costing 3.4 times granular per nutrient unit.

Exposure divides by integration rather than by scale. Producers owning ammonia, nitric acid or potash upstream pass cost movements through their own system, while blenders buying every input at market carry the full swing and cannot hedge it. The blender model works in stable input markets and struggles in volatile ones, which is where consolidation pressure comes from.
water-soluble-fertilizer-market-trends-cost-volatility-analysis-1787664846444

Secure feedstock purity specification rather than lowest input price

Insoluble content that is irrelevant in a granular product blocks the emitters a soluble grade passes through, which makes feedstock purity a product specification rather than a procurement preference. Buying to the cheapest specification saves money per tonne and creates a warranty exposure worth far more. Suppliers who have learned this the expensive way audit feedstock rather than trusting certificates.

Contract season long supply ahead of the planting window

Growers defer soluble purchases before anything else when input costs rise, which makes demand swing considerably harder than cropped area does. Season long supply agreements agreed before planting fix volume and price on both sides and remove the deferral decision from the season. The concession is pricing flexibility, given up in exchange for volume certainty that manufacturing planning genuinely needs.

Integrate upstream where a single feedstock dominates cost

Blenders buying ammonia, nitric acid, potash and phosphate at market carry the full cost swing with no hedge available to them. Integration into whichever feedstock dominates a given product line converts that exposure into an internal transfer price. It is capital intensive and it is the explanation for why consolidation pressure rises every time input markets turn volatile.

Portfolio Architecture for Margin Defence

Margin architecture divides on manufacturing difficulty rather than on nutrient content. Commodity soluble NPK blends earn least, since blending is accessible to anybody with a mixer and buyers compare on price per nutrient unit. Purity controlled straight grades earn better, because feedstock quality and process discipline are genuine barriers. Chelated micronutrients earn best, since chelation chemistry is a different capability entirely and EDDHA iron carries the highest value per hectare traded.
The tension runs between volume and specification. Blends carry tonnage, factory utilisation and dealer relationships, and they invite price comparison that erodes the premium the category depends on. Straight grades and chelates carry margin on much smaller volumes. A supplier holding both is defending a premium argument in one part of the portfolio while undermining it in another, which is uncomfortable and largely unavoidable.

High value pools concentrate in chelated micronutrients at 10.2% and in protected cultivation formulation support, neither of which is a tonnage position. Everything selling standard blends competes against Chinese producers in the largest market and regional blenders everywhere else. The businesses worth building are those where the manufacturing capability is genuinely hard to acquire and the grower cannot verify the difference until the emitters block.

Standard Soluble NPK Blends

Blended soluble grades sold on price per nutrient unit through agricultural retail and dealer channels. Blending is accessible to any operator with a mixer, which keeps differentiation minimal and invites direct price comparison everywhere.
Gross Margin: 16-20%

Purity Controlled Straight Grades

Calcium nitrate, potassium nitrate and phosphate grades manufactured to residue and chloride specifications that protect emitter systems. Feedstock quality and process discipline are genuine barriers to entry rather than marketing positions.
Gross Margin: 30-34%

Chelated Micronutrients And Compliance Programmes

Chelated micronutrient products and documented nutrient programmes serving catchment compliance requirements. The range is wide because EDDHA iron for calcareous soils carries margins well above other chelate chemistries. Compliance documentation adds further value.
Gross Margin: 42-48%
water-soluble-fertilizer-market-trends-portfolio-architecture-1787664846957

High-value Sub-segments and Strategic Watch-out

Micronutrient Chelates

Fastest growing chemistry at 10.2% as soil depletion from decades of macronutrient fertilisation shows in yield rather than only soil tests. Chelation is a genuinely different manufacturing capability from blending, which is what keeps the margin defensible against later entrants. Later entrants find the position already taken.
Gross Margin: 44-50%

Calcium Nitrate

Second fastest at 8.6% and driven by fruit quality rather than tonnage, since calcium disorders show up in the packhouse where a rejected consignment costs multiples of the fertiliser. Tank compatibility with phosphate and sulphate remains the practical constraint on use. Packhouse economics drive this segment.
Gross Margin: 28-32%

Water-Soluble NPK Blends

Growing at 6.2% and carrying the largest tonnage in the category, which makes it the volume core rather than the growth story. Competition is direct on price per nutrient unit against Chinese producers and regional blenders in every market. Price per nutrient unit is the only comparison made.
Gross Margin: 16-20%

Urea Phosphate and Specialty Acids

Growing at only 4.4% and used mainly for line cleaning and pH management rather than as a primary nutrient source. Demand tracks installed irrigation maintenance requirements, which grow slowly and predictably regardless of crop economics anywhere. Line maintenance rather than crop nutrition determines the volume sold.
Gross Margin: 22-26%

How Fertigation Demand Repeats

An irrigation system installed today runs for a decade and buys soluble fertiliser every season it operates, which makes each installation an annuity rather than a sale. That is why channel position at installation matters: the supplier present at specification starts a relationship the grower has little reason to change, since a product proven not to block the emitters carries a switching risk no price saving offsets.
Stickiness varies by production system. Protected cultivation and soilless growing cannot use anything else and consume 38% of category volume on recipes that change several times a season, which makes those customers both captive and demanding of formulation support. Permanent crops fertigate reliably across decades. Field crop fertigation is the least sticky, since growers there retain granular as a fallback and defer soluble purchases first when input costs rise.

The buyer is shifting from agronomist to compliance manager in regulated catchments. Nutrient accounting obligations turn an application decision into a documented one, and fertigation's 42% efficiency advantage over broadcast becomes a compliance route rather than an economic preference. That changes who signs off, what evidence a supplier provides, and how much of the sale rests on documentation rather than agronomy.
water-soluble-fertilizer-market-trends-end-use-penetration-index-1787664847454

Where This Category Rewards Focus

These are among the four positions where our research anticipates prominent divergence between winners and laggards over the coming forecast period. Each is grounded in the demand model, the regulatory perimeter, and the announced capacity pipeline.
01 / IRRIGATION CHANNEL ACCESS

Be there when the system is specified

The fertiliser decision is effectively made when a grower installs drip or micro-sprinkler irrigation, because emitters costing thousands of dollars per hectare cannot safely pass anything that leaves residue behind. Only around 17% of irrigated cropland is fertigated, which means addressable demand is set by hardware installed rather than by any nutrition requirement. Suppliers reaching the grower through irrigation integrators arrive at the decision point, while those selling through agricultural retail arrive a full season after it has already been made.
02 / PURITY SPECIFICATION CONTROL

Analysis is the specification that does not matter

Two grades carrying identical nitrogen, phosphorus and potassium numbers can behave completely differently in an irrigation line, and the one leaving insoluble residue quietly shortens the working life of everything downstream of it. Growers accept roughly 3.4 times the cost per nutrient unit of conventional granular precisely for that difference. Competing on analysis means competing on the number that does not decide anything, while residue, chloride content and tank compatibility are what an ammonia producer cannot simply choose to deliver.
03 / MICRONUTRIENT CHELATION CAPABILITY

The deficiency is arriving whether growers notice or not

Decades of macronutrient focused fertilisation drew soil zinc, iron, boron and manganese down across intensively cropped regions until deficiency began showing in yield rather than only in soil tests. Unchelated metal salts precipitate in irrigation water and block emitters, so chelation is the only practical delivery route rather than a premium option. That chemistry is a genuinely different manufacturing capability from salt blending, which is why the segment grows at 10.2% with margins that blenders entering later cannot reach at all.
04 / SUBSIDY PROGRAMME TIMING

Government budgets set this market's installation rate

Indian micro-irrigation subsidy schemes and Chinese water and fertiliser integration policy expand fertigated area on timelines determined by government budget cycles rather than by grower economics or fertiliser pricing. India grows at 11.4%, faster than any market covered, entirely as a consequence of that hardware installation. Suppliers supporting subsidy applications and working with approved integrators are present when the pipe goes in, and everybody arriving afterwards competes against a proven incumbent whose product the grower already trusts not to block anything.

Engagement Snapshot From the Field

A live engagement with an industry participant carrying material or product regulatory and market exposure ahead of a defining policy shift, showing how our research translates into a defensible multi-year portfolio strategy.
MARKET MINDS ADVISORY · CLIENT ENGAGEMENT SUMMARY
Water-Soluble Fertilizer Producer Strategic Portfolio Review and Transition Roadmap 2026·Investment Scenario on Water-Soluble Fertilizer Exposure Evaluation 2025-26
CLIENT PROFILE
A specialty fertiliser producer manufacturing water-soluble NPK blends and straight grades for horticultural markets across Western Europe and Latin America. Annual revenue was approximately 240 million dollars (client-reported, unverified by MMA), predominantly blended products sold through agricultural retail and dealer channels. No chelated micronutrient capability existed anywhere in the product range at that point in time.
STRATEGIC CHALLENGE
Blend margins had compressed for four consecutive seasons against Chinese imports and regional blenders, and management was considering capacity expansion to defend volume. Growers were increasingly asking for micronutrient programmes the company could not supply and were being referred elsewhere. Nobody had established where the referred business actually ended up going.
MMA APPROACH
MMA traced the client's referred micronutrient enquiries to their eventual suppliers and measured what those growers subsequently bought. Chelate manufacturing entry was costed against blending capacity expansion. Forty-seven expert interviews with growers, irrigation integrators and agronomists established how the supplier decision is genuinely made, alongside quantitative survey work across six countries.
KEY FINDINGS
  1. Growers referred elsewhere for micronutrients moved roughly 40% of their blend purchasing to the same supplier within two seasons, so the referral was losing far more than the enquiry.
  2. Irrigation integrators influenced the initial fertiliser supplier choice in 6 of every 10 new installations, and the client had no relationship with any of them at all.
  3. Chelate manufacturing entry required 18 months and capital the blending expansion would have consumed, at roughly 2.5 times the gross margin per tonne.
  4. Blend capacity expansion modelled a return below the client's own hurdle rate in 4 of the 6 scenarios tested, including the most optimistic pricing case.
CLIENT PROFILE
A specialty fertiliser producer manufacturing water-soluble NPK blends and straight grades for horticultural markets across Western Europe and Latin America. Annual revenue was approximately 240 million dollars (client-reported, unverified by MMA), predominantly blended products sold through agricultural retail and dealer channels. No chelated micronutrient capability existed anywhere in the product range at that point in time.
STRATEGIC CHALLENGE
Blend margins had compressed for four consecutive seasons against Chinese imports and regional blenders, and management was considering capacity expansion to defend volume. Growers were increasingly asking for micronutrient programmes the company could not supply and were being referred elsewhere. Nobody had established where the referred business actually ended up going.
MMA APPROACH
MMA traced the client's referred micronutrient enquiries to their eventual suppliers and measured what those growers subsequently bought. Chelate manufacturing entry was costed against blending capacity expansion. Forty-seven expert interviews with growers, irrigation integrators and agronomists established how the supplier decision is genuinely made, alongside quantitative survey work across six countries.
KEY FINDINGS
  1. Growers referred elsewhere for micronutrients moved roughly 40% of their blend purchasing to the same supplier within two seasons, so the referral was losing far more than the enquiry.
  2. Irrigation integrators influenced the initial fertiliser supplier choice in 6 of every 10 new installations, and the client had no relationship with any of them at all.
  3. Chelate manufacturing entry required 18 months and capital the blending expansion would have consumed, at roughly 2.5 times the gross margin per tonne.
  4. Blend capacity expansion modelled a return below the client's own hurdle rate in 4 of the 6 scenarios tested, including the most optimistic pricing case.
RECOMMENDED STRATEGY
Phase 1: Phase one: abandon blend capacity expansion, which cleared the hurdle rate in only 2 of 6 scenarios tested including optimistic pricing. Phase 2: Phase two: enter chelate manufacturing over 18 months, at roughly 2.5 times blend gross margin per tonne and stopping the referral leakage. Phase 3: Phase three: build irrigation integrator relationships, since integrators influence supplier choice in 6 of every 10 new fertigation installations nationally.
OUTCOME
The client cancelled the blending expansion and commissioned chelate capacity instead, which reached planned utilisation ahead of schedule against demand its own sales team had been referring away. Integrator relationships produced a materially higher share of new installation business, and blend volume stabilised as bundled supply rather than as a standalone product (client-reported, unverified by MMA).

Frequently Asked Questions

Foundational context covering the market sizes, CAGR, scope, country, region and competition that inform every finding below. This section is provided to cover basics and most often pre-purchase conversations, answered from the MMA Primary Research Dataset.

What is the current size of the Water-Soluble Fertilizer Market?

The market was valued at 16.4 billion dollars in 2025, covering fully soluble grades applied through irrigation systems and foliar sprays worldwide. It reaches an estimated 17.52 billion dollars during 2026.

How large will the Water-Soluble Fertilizer Market be by 2036?

MMA forecasts 33.83 billion dollars by 2036, an increase of 16.31 billion dollars over the 2026 base. That represents an expansion multiple of 1.93 times across the forecast period.

What is the CAGR for the Water-Soluble Fertilizer Market 2026 to 2036?

The base case compound annual growth rate is 6.8%, with a bull case of 8.0% and a bear case of 5.6%. Nutrient runoff regulation and input cost volatility separate those two scenarios.

Which segment is growing fastest?

Micronutrient chelates grow at 10.2%, half again the market rate of 6.8%, because soil depletion now shows in yield and chelation is the only delivery route. Calcium nitrate follows at 8.6%.

Who are the major companies in the Water-Soluble Fertilizer Market?

Yara International, ICL Group, Haifa Group, K+S and Nutrien lead on production capacity across global specialty and integrated positions. Together they account for 31% of the global market.

Which country is growing fastest?

India grows fastest at 11.4%, because micro-irrigation subsidy schemes keep expanding drip and sprinkler installation, and soluble fertiliser demand follows the hardware rather than any nutrition policy.

Report Segmentation Architecture

The full report scope spans multiple orthogonal segmentation dimensions, with cross-tabulated demand data provided for each dimension pair. Coverage extends further to regional breakdowns, trend trajectories, and the competitive detail needed to support segment-level decision-making.

By Product Chemistry

  • Water-Soluble NPK Blends
  • Potassium Nitrate
  • Calcium Nitrate
  • Monoammonium and Monopotassium Phosphate
  • Micronutrient Chelates
  • Urea Phosphate and Specialty Acids

By End-Use Industry

  • Field Crops
  • Fruit and Orchard Production
  • Vegetable and Protected Cultivation
  • Plantation and Tree Crops
  • Turf and Ornamental Horticulture
  • Hydroponic and Soilless Production

By Commercial Dimension

  • Direct Grower Supply
  • Agricultural Retail and Dealer
  • Irrigation Equipment Integrator
  • Cooperative Procurement
  • Export and Trading
  • Contract Blending Supply

By Region

  • North America
  • Western Europe
  • East Asia
  • South Asia and Pacific
  • Latin America
  • Middle East and Africa
  • Eastern Europe

Scope, Methodology, and Coverage

Every figure in this report is reproducible from documented input assumptions. The scope below maps the historical period, the forecast horizon, the segmentation dimensions, and the countries covered, alongside the underlying primary and qualitative methodology.
Historical Period
2020 to 2025
Forecast Period
2026 to 2036
Base Year
2025 (USD billions; MMA Primary Research Dataset, August 2026)
Market Definition
Fully water-soluble fertiliser grades applied through drip, micro-sprinkler and pivot irrigation systems or as foliar sprays, covering water-soluble NPK blends, potassium nitrate, calcium nitrate, monoammonium and monopotassium phosphate, micronutrient chelates, and urea phosphate and specialty acids, measured at manufacturer selling value worldwide. Conventional granular and bulk fertilisers, controlled release coated products, bulk liquid nitrogen solutions, biostimulants, soil amendments and irrigation hardware itself are excluded from scope entirely.
Quantitative Units
USD billions (manufacturer selling value); tonnes; USD per tonne by chemistry
Segmentation Dimensions
Product chemistry; end-use industry; commercial dimension; region
Regions Covered
North America, Western Europe, East Asia, South Asia and Pacific, Latin America, Middle East and Africa, Eastern Europe
Countries Covered
United States, Canada, Mexico, United Kingdom, Netherlands, Spain, Italy, France, Germany, China, Japan, South Korea, India, Australia, Thailand, Vietnam, Brazil, Chile, Peru, Israel, Saudi Arabia, Poland
Key Companies Profiled
Yara International, ICL Group, Haifa Group, K+S, Nutrien, Coromandel International, SQM, EuroChem Group, OCI Global, Kingenta Ecological Engineering, Stanley Agriculture Group, Sinofert Holdings, Grupa Azoty, Van Iperen International, Deepak Fertilisers and Petrochemicals, Omex Agrifluids, Valagro, Hebei Monband Water Soluble Fertilizer, AgroLiquid, Migao Corporation
Quantitative Methodology
Primary survey, n=3,800 respondents, Q4 2025, six countries; demand-side model with trade association cross-validation
Qualitative Methodology
47 expert interviews, Q4 2025; applied to validate demand model assumptions, identify emerging dynamics, and assess competitive positioning
Report Format
PDF and XLSX data workbook (Word format preview document)
Publisher
Market Minds Advisory
Report Code
MMA-2026-AGR-207
Published
August 2026
Contact
sales@marketmindsadvisory.com | www.marketmindsadvisory.com

Purchase the full Water-Soluble Fertilizer Market Report (2026 to 2036).

The full report treats water-soluble fertiliser as a category whose addressable market is set by irrigation hardware installed rather than by crop nutrition demand, and follows the consequences of that inversion through channel, pricing and product strategy. It sizes all six chemistries independently through 2036, models fertigated area against subsidy programme timelines by country, and quantifies the purity specification that separates a soluble grade from a granular one. Regional chapters cover all seven regions, with Chinese policy driven demand assessed separately from grower economics elsewhere. Competitive profiling covers 20 participants on one consistent capacity measure.
Six product chemistries sized independently through 2036
Fertigated area modelled against national subsidy programme timelines
Purity specification benchmarked against conventional granular fertiliser standards
Chelation manufacturing capability assessed across every profiled participant
Input cost pass through modelled by upstream integration position
Twenty participants profiled on one consistent capacity measure

Built For The People Who Decide

From boardroom strategy to bench-side execution, this report is read cover-to-cover by leaders shaping the next decade of their industry, turning demand scenarios, market dynamics and valuation benchmarks into decisions.
CXOs/ Presidents/ VPs/ Managers
M&A and Corporate Development
Strategy Teams and R&D Heads
Procurement and Product Directors
Regulatory and Compliance Leaders
Investor Relations and Equity Analysts