Market Minds Advisory
Water Softener Market

Water Softener Market: Water Softener Market. Smart Controls, Salt-Free Conditioning, and Brine Discharge Rules Reshape Hard Water Treatment.

Water softeners protect pipes and appliances from scale, but brine discharge rules, valve and resin costs, dealer economics, and buyer doubts about salt-free claims decide which manufacturers turn hard water into repeat service revenue.

Lead Analyst

Published

September 2026

Make Smarter Decisions with Customized Research Insights

Request a free sample report and evaluate market opportunities, growth trends, and competitive dynamics relevant to your business needs.

2025 MARKET VALUE$3.6BMarket Size 2025
2036 FORECAST VALUE$6.4BBase Case , 2026 to 2036
CAGR 2026 TO 20365.4 %Bull 6.7% / Bear 4.1%
INCREMENTAL OPPORTUNITY$2.6BNet 10- year value creation
EXPANSION MULTIPLE1.69x2036 value over 2026 base
Strategic Levers
M&A Pipeline
Regional Outlook
Country Rankings
Competitive Intelligence
Segmental Deep-dive
Call-Us : 91 93563 13602

Executive Snapshot and Market Trajectory.

Water softeners are bought once and remembered every time a kettle stays clean. Hard water leaves scale on pipes, heaters, and glass, and a softener turns that chronic annoyance into a purchase most households make only after the damage is visible. The best manufacturers sell prevention and keep the customer
Smart and connected softeners grow fastest, because flow monitoring, salt alerts, and remote service cut running cost and give dealers a reason to keep the customer, while salt-free scale conditioners follow as brine discharge rules tighten. North America holds the largest share, since United States hard water, large homes, and dealer networks concentrate the installed base, with Western Europe and East Asia following. India leads country growth. Hardness sets need. Rules set format.
The industry is moderately concentrated, with global water treatment groups, appliance makers, and many regional dealers competing on efficiency, reliability, and installer relationships. Brine discharge rules, valve and resin costs, and housing cycles shape products and margins, while reverse osmosis systems and whole-home filters crowd the same water quality budgets. Majors own brands. Dealers own customers. Regulators cut old designs. Buyers reward reliability over novelty.
Market Definition
Water softeners comprise point-of-entry and point-of-use equipment that reduces water hardness through ion exchange, salt-free scale conditioning, magnetic or electronic descaling, or combined filtration and softening, including smart and connected units, portable and cartridge softeners, and commercial systems for hotels, restaurants, and light industry, sold through dealers, retail, and online channels. The scope excludes municipal softening plants, boiler feedwater systems for large industry, and standalone drinking water filters.
Base Year Value
$3.6B in 2025 (MMA Primary Research Dataset, September 2026)
Forecast Period
2026 to 2036, eleven discrete annual values
CAGR
5.4% base case. Bull 6.7%. Bear 4.1%.
Fastest Growth Segment
Smart and Connected Softeners: 9.2% CAGR
Fastest Growth Country
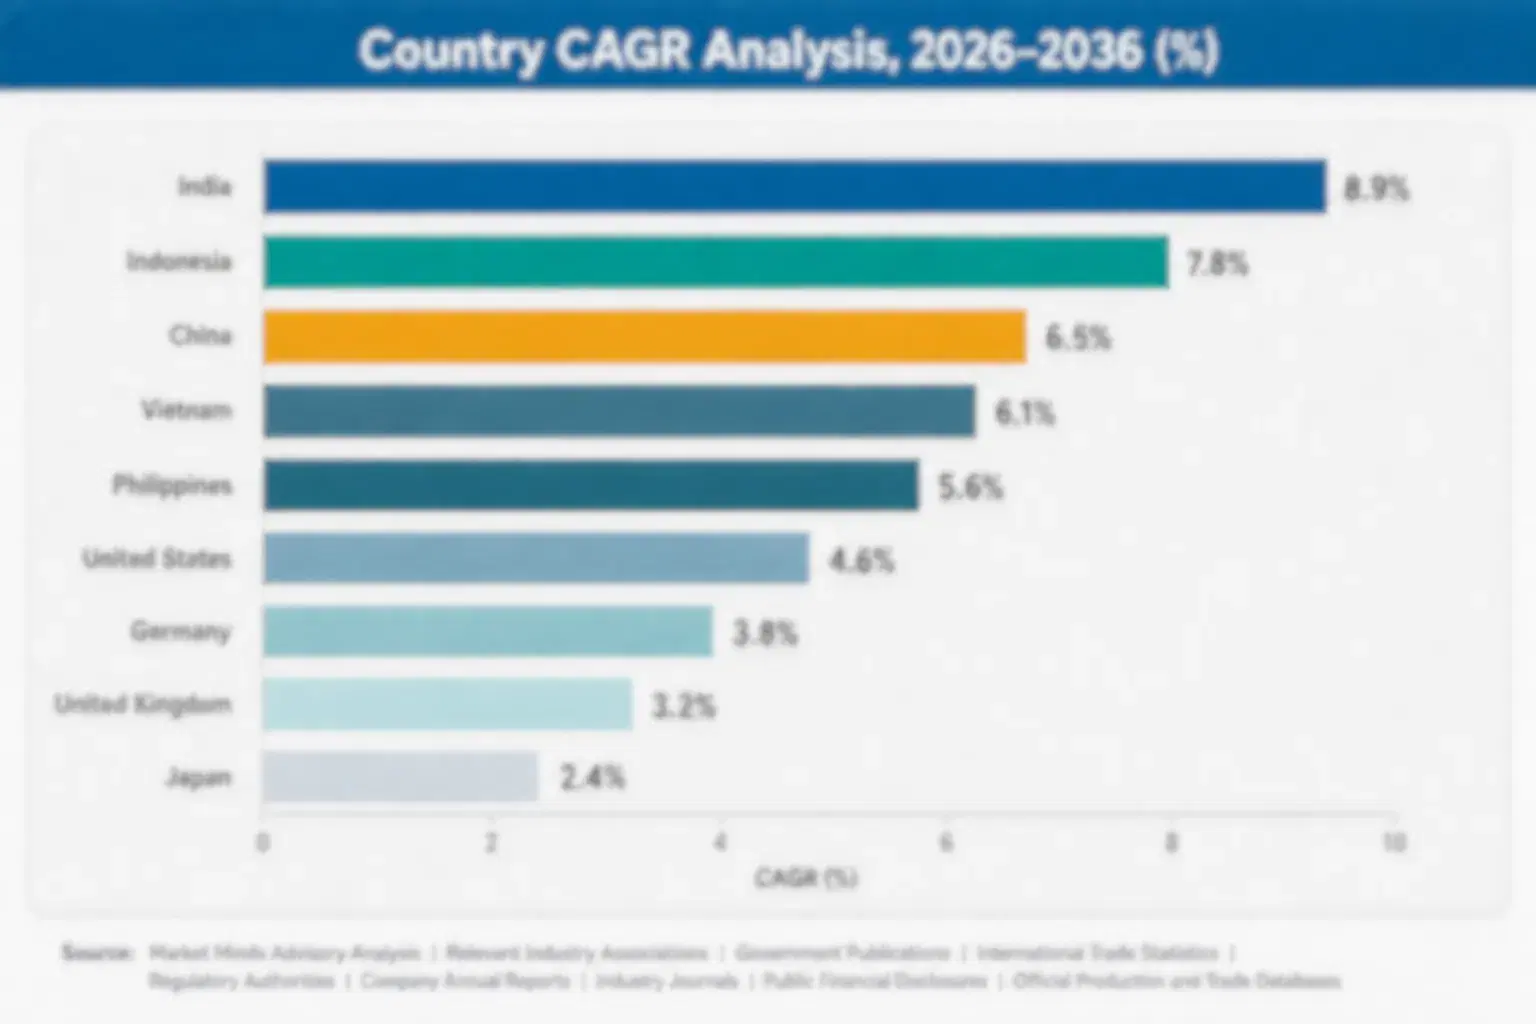
India: 9.0% CAGR
Fastest Growth Region
South Asia and Pacific: 7.5% CAGR
Largest Region
North America: 36% of 2025 global value
Market Leaders
Pentair, Culligan International, Kinetico, Watts Water Technologies, BWT. Source: MMA Analysis, company annual reports.
Primary Survey
n=3,800 procurement and R&D decision-makers, Q4 2025, six countries
Methodology
Demand-side build-up, cross-validated against public data, 47 expert interviews

Water Softener Market Forecast Scenarios

water-softener-market-size-forecast-scenario-1789799326197
From 2020 to 2025, water softeners moved from a dealer-driven replacement product to a connected home appliance category. Housing renovation, hard water awareness, and remote work at home widened demand, while valve, resin, and freight costs spiked in 2022 and squeezed margins. Growth ran slightly below today's pace, and price rises supplied part of the reported value gain. Service coverage decides renewal.
The base case rests on three commercial mechanisms. First, smart and connected softeners gain share as flow monitoring and remote service cut running cost and lock in dealer relationships. Second, salt-free conditioners and combined filtration systems grow where brine discharge rules limit salt-based units. Third, India, China, and the Gulf add volume as housing growth and hard water awareness expand. Each mechanism compounds slowly, and none needs a breakout year. Manufacturers plan capacity and dealer support around
The bull case needs certification bodies to recognise salt-free performance claims, which would let manufacturers sell conditioners with confidence and convert doubters into buyers. The bear case is a weak housing market combined with tighter brine bans, which would delay replacement, squeeze margins, and push dealers toward cheaper filtration products. Margins follow scale and discipline.

Efficiency, Dealer Reach, and Discharge Rules Decide Softener Winners

Water softeners cover several methods. Ion exchange units pass hard water through resin beads that swap calcium and magnesium for sodium or potassium, then regenerate with brine, while salt-free conditioners alter scale into a form that does not stick. Magnetic and electronic descalers use fields or pulses, and combined systems pair softening with carbon or reverse osmosis filtration.
MARKET CONCENTRATION40% CR5Leading five manufacturers hold a moderate combined share
RESIDENTIAL SHARE71%Portion of value sold for household installation and use
REPLACEMENT DEMAND SHARE58%Portion of value driven by replacing existing units
VALVE COST SHARE24%Portion of cost of goods taken by valves and controls
AVERAGE SERVICE LIFE12 yearsTypical operating life of a household softener unit
AVERAGE INSTALLED PRICE$1,800Typical installed price of a whole-home softener unit
Efficiency and dealer reach decide value. Buyers judge softeners by how well they remove scale, how much salt and water they waste, and how easily service is arranged, so a manufacturer needs reliable valves and a trained installer network. Premium brands use demand-regenerating controls and fine-mesh resin, while volume brands use timer valves for cost. Manufacturers with dealer loyalty, warranty performance, and clear efficiency data win because a unit that fails at
Buyers judge softeners on results, installed price, running cost, and service support. Homeowners want a unit that fits the utility room and lowers appliance wear, while dealers and plumbers want margin, training, and parts availability. Price sensitivity is moderate, since a softener is a long-lived home investment, which pushes manufacturers toward financing, service plans, and smart controls that show savings in salt, water.
"A water softener is a rare appliance that gets more valuable the longer it works, and the industry has been slow to sell that annuity. The winners will price the unit as an entry ticket and earn the profit in service, salt, and monitoring. Dealer economics and discharge rules, not technology, are the constraints most makers underrate."
Senior Analyst, Industrial and Building Products Practice · MMA Residential and Commercial Water Softening Equipment Practice · September 2026

Market Trends

Smart Softeners Cut Running Cost and Lock In Service

Manufacturers now sell softeners with flow meters, wireless connectivity, salt-level sensors, and app alerts, using demand-based regeneration to cut salt and water use by 30% to 50% compared with timer units. Dealers use remote diagnostics to book service before failures, and homeowners see savings in the app. Connected units sell at 20% to 50% above standard models, and service plans add recurring revenue. Producers that secure data and avoid cloud outages win trust, and retailers give shelf space beside smart home products. The trend broadens softeners beyond hard water regions and supports dealer loyalty.
Market Impact: scale cuts heater life 25-50%

Salt-Free Conditioners Grow Where Brine Discharge Rules Tighten

Municipalities in California, Texas, Germany, and other regions limit or ban salt-based softener discharge into wastewater systems, and salt-free scale conditioners and template-assisted crystallisation units offer a compliant alternative. These products need no salt or electricity in many designs, and buyers value low maintenance and no brine waste. Conditioners sell at prices near ion exchange units, and performance data and certification support adoption. Producers that publish independent test results and warranty terms win trial, and dealers use conditioners to keep sales in restricted areas while meeting local rules. Margins follow scale and discipline.
Market Impact: India softener demand grows 9%+ yearly

Market Opportunities and Growth Drivers

Hard Water Damage and Appliance Protection Sustain Softener Demand

Households in the United States, Germany, the United Kingdom, and the Gulf face hard water that shortens the life of water heaters, dishwashers, and pipes, and repair bills push owners toward softeners. Homebuilders, renovators, and insurers increasingly specify treatment in new homes and upgrades. Producers that offer efficient units, financing, and installation support win trial, and softeners help homeowners protect appliances worth many times the price of a unit. Repeat purchase follows because a unit that lasts a decade is replaced with the same brand when service and warranty have been good.
Market Impact: chloride limits apply in 20+ regions

Housing Growth Extends Softeners Into India and China

India, China, Vietnam, Saudi Arabia, and the United Arab Emirates have seen water treatment equipment grow as housing expands, incomes rise, and hard water awareness spreads through e-commerce and dealer networks. Global groups use distribution networks to launch premium units, and local manufacturers adapt capacity, pricing, and installation models to local homes, since apartments and compact utility spaces need smaller units. Producers that adapt product, price, and service win volume, and emerging markets offset flatter demand in mature countries across the forecast period. Dealers review lines every season. Warranty performance protects repeat purchase.
Market Impact: valves, resin, and tanks take 58%

Market Restraints and Challenges

Brine Discharge Rules and Salt Scrutiny Limit Ion Exchange Sales

Municipalities and water utilities in several regions restrict chloride discharge from household softeners, and health groups question sodium intake from softened water for people on restricted diets. The root cause is wastewater treatment limits and environmental rules that were not designed around household equipment. Manufacturers respond with efficient regeneration, potassium chloride options, salt-free conditioners, and clearer health guidance, though these steps raise cost, reduce salt sales, and confuse buyers, and small dealers cannot always meet local rules in every service territory. Cost control separates leaders from followers. Clear performance data builds buyer trust.
Market Impact: smart units cut salt use 30-50%

Valve, Resin, and Electronics Costs Squeeze Manufacturer Margins

Valves and controls take about 24% of cost of goods, resin and media a further 14%, and tanks and plastics 20%, and each can move sharply within a year. Supply is concentrated among a small group of valve and resin makers, and electronics depend on global chip supply. The root cause is component concentration and commodity exposure. Mitigations include forward contracts, dual sourcing, design simplification, and regional assembly, though small manufacturers cannot secure long contracts and dealers resist price rises, so margin recovery lags cost increases by several months. Small makers feel every cost swing.
Market Impact: brine limits apply in 20+ regions
3 additional market trends, 2 additional growth drivers, and 4 additional restraints and challenges are covered in the full report. Contact sales@marketmindsadvisory.com to access the complete intelligence.

Segment CAGR and Growth Architecture

Water softeners are segmented by treatment technology and control level, which shows where efficiency demand, regulation, and pricing power sit. Six segments cover salt-based ion exchange softeners, smart and connected softeners, salt-free scale conditioners, magnetic and electronic descalers, combined filtration and softening systems, and portable and cartridge softeners. Two segments grow fastest on different drivers. Service coverage decides renewal.
water-softener-market-market-share-analysis-1789799326462

Smart and Connected Softeners

Smart and connected softeners are the fastest-growing segment, at 9.2% a year, about 1.70 times the overall market rate. Homeowners want lower running cost and fewer service surprises, and demand-based regeneration, flow monitoring, and app alerts cut salt and water use by 30% to 50%. Prices sit 20% to 50% above standard units, and service plans add recurring revenue. Data security and installer skill are the main constraints, since connectivity fails when set-up is poor, so manufacturers train dealers and simplify onboarding. Dealers add remote diagnostics, and manufacturers with strong dealer networks win replacement demand from owners who want a unit that manages itself and reports faults early. Margins follow scale and discipline.
CAGR 9.2%

Salt-Free Scale Conditioners

Salt-free scale conditioners grow at 7.8% a year, because brine discharge rules limit ion exchange in several regions, and template-assisted crystallisation units turn hardness minerals into a form that does not stick to surfaces. Units need no salt and little maintenance, and buyers value no brine waste. Performance claims are the main constraint, since conditioners reduce scale but do not remove hardness, so independent test data and certification decide trust. Manufacturers with clear warranties and dealer training win restricted areas and apartment blocks, and combined filtration packages keep buyers returning for cartridges without heavy advertising budgets. Dealers review lines every season. Warranty performance protects repeat purchase. Cost control separates leaders from followers.
CAGR 7.8%
Full segment breakdown across 6 segments available in the complete report.

Regional Architecture and Country Demand Map

Water softener value follows water hardness, housing stock, and dealer networks. North America leads through United States hard water and installed base, Western Europe follows through German and French demand, South Asia and Pacific grows fastest through India, and East Asia holds a below-band share despite rising Chinese sales.

North America

North America holds 36% share, above its usual band, because the United States has very hard water across large regions, large homes with utility rooms, and dense dealer networks that concentrate the installed base and replacement demand, and the United States alone accounts for most regional sales. Pentair, Culligan International, Kinetico, Watts Water Technologies, and EcoWater Systems lead, and dealers, home centres, and online retailers carry the range. Canada adds cold-climate replacement demand. Growth runs slightly below the global rate as the base matures. North America and Western Europe hold the top two positions because both combine hard water, high home ownership, and mature dealer and service networks. Clear performance data builds buyer trust.
Share: 36% | CAGR: 5.2% (2026 to 2036)

Western Europe

Western Europe holds 24% share, with Germany, France, the United Kingdom, Italy, and Spain leading through hard water in large regions, high housing standards, and strong plumbing trades. BWT, Judo Wasseraufbereitung, Grünbeck Wasseraufbereitung, Pentair, and Culligan compete for dealer and plumber loyalty, and salt-free conditioners and dishwasher-integrated systems add variety. Brine discharge rules in some German and Nordic regions push efficient and salt-free designs. Growth stays below the global rate because the base is mature, housing turnover is slow, and buyers accept scale, though smart controls and combined systems lift value beyond volume. Installer shortages restrain volume. Small makers feel every cost swing. Dealer reach compounds over time. Buyers reward reliability over novelty.
Share: 24% | CAGR: 4.1% (2026 to 2036)
Regional intelligence for 5 additional markets available in the complete report: East Asia, South Asia and Pacific, Latin America, Middle East and Africa, Eastern Europe. Contact sales@marketmindsadvisory.com.
water-softener-market-country-cagr-analysis-1789799326749

Four Margin Routes for Water Softener Manufacturers

Margin in water softeners comes from smart service plans, salt-free product lines, component supply security, and dealer economics rather than unit volume alone. The routes below apply to global water treatment groups, appliance makers, and regional manufacturers, and each can start inside one planning cycle, with clear measures in gross margin points, dealer retention, and service revenue per unit.

Attaching Connected Service Plans to Every Smart Softener Sold

Smart softeners sell at 20% to 50% above standard units, and connected service plans add recurring revenue that lifts lifetime margin per household. Manufacturers that bundle monitoring, salt delivery, and remote diagnostics report gross margin gains of 5 to 8 points on connected lines and dealer retention above 85%. Dealers should train technicians on the app, offer annual plans, and price salt delivery to cover route cost. Small manufacturers can start with one service tier and one region. Contracts should fix data ownership and outage terms, and firms should track churn by plan so that each release improves
Market Impact: connected plans lift lifetime margin by 5-8 points

Building Salt-Free Ranges for Brine Restricted Regions

Salt-free conditioners keep sales alive where brine discharge is limited, and manufacturers that publish independent test data and warranty terms win dealers and homeowners who would otherwise skip treatment. Conditioners sell at prices near ion exchange units, and combined filtration packages add cartridge revenue of $80 to $150 a year. Manufacturers that certify performance, train dealers on honest claims, and bundle filters report volume gains of 12% to 20% in restricted areas. Small firms can start with one certified model and one municipality, and should track complaints so that each label teaches the next.
Market Impact: salt-free ranges add 12-20% volume in restricted areas

Contracting Valves and Resin Early to Stabilise Costs and Supply

Valves, controls, resin, and tanks take about 58% of cost of goods, and prices can move 15% to 30% within a year when commodity, chip, or freight markets tighten. Manufacturers that sign 12-month forward contracts, dual-source valve heads from two suppliers, and hold safety stock of resin and controllers cut cost swings by roughly half. Dealers accept price changes slowly, so contracts matter more than list price increases, and stable supply lets manufacturers hold gross margin near 34% across ranges. Manufacturers that skip contracts pay 10% more in volatile years and risk missing peak season deliveries.
Market Impact: forward contracts halve cost swings and hold 34% margin

Financing and Training Dealers to Lift Installed Base Conversion

Dealers convert only a share of hard water leads because installed prices near $1,800 deter buyers, and financing plans, trained technicians, and clear efficiency data lift conversion by 15% to 30%. Manufacturers that offer dealer financing, technician certification, and lead sharing report volume gains of 10% to 18% in supported territories without cutting unit margin. Small firms can start with one financing partner and one training course. Manufacturers should track conversion by dealer so that support follows results, and reward dealers that keep service customers through annual plans. Small makers feel every cost swing.
Market Impact: dealer support lifts conversion 15-30% across all territories

Who Controls the Margin Pool

The water softener industry is moderately concentrated, with a CR5 of 40%, and many regional manufacturers, dealer brands, and private label suppliers sit outside the leading five. This assessment measures participants on estimated softener sales value, held constant across all players. Pentair leads through its Fleck and Pentair brands and dealer distribution, while Culligan International, Kinetico, Watts Water Technologies, and BWT follow, with a clear gap between the
Competition runs on four dimensions today: efficiency and reliability, dealer network strength, smart features, and price per installed unit. Global groups win on brand, valve technology, and financing, while regional manufacturers win on local water knowledge and installer relationships. Retail and online sellers copy standard timer softeners quickly, so premiums outside smart, salt-free, and combined ranges erode within a year, and price competition appears at home centre resets

Emerging pressure comes from reverse osmosis systems, whole-home filters, and appliance-integrated conditioners, which compete for the same water quality budgets. Rankings shift where a manufacturer wins a certification, secures a builder programme, or signs a service partnership. Regional manufacturers in India, China, and Germany can move up quickly, since local water knowledge matters more than global scale.
water-softener-market-company-positioning-matrix-1789799327023

Competitive Moat and Risk Dimensions

PENTAIR

Moat: Valve Technology and Dealer Reach

Pentair makes valve heads, tanks, and controls under Fleck and other brands, and it sells through dealers, plumbers, and distributors across North America and Europe. Its valve technology, dealer training, and parts availability give it reliable performance and pricing power, and its scale in components lowers cost per unit against smaller rivals and private label suppliers.
PENTAIR

Risk: Housing Cycle and Component Exposure

Pentair depends on housing renovation and new build cycles, so weak home sales cut volume quickly. Valve, resin, and electronics costs squeeze margins, and brine rules limit ion exchange demand in some regions, while smart competitors and appliance makers challenge its dealer channel with connected products and direct online sales.
CULLIGAN INTERNATIONAL

Moat: Service Network and Brand Trust

Culligan International sells softeners, filtration systems, and bottled water services through a large network of dealers and company-owned outlets. Its brand recognition, service technicians, and recurring salt and cartridge sales give it stable revenue and customer relationships, and its financing programmes convert buyers who would otherwise delay a purchase.
CULLIGAN INTERNATIONAL

Risk: Dealer Economics and Digital Pressure

Culligan relies on dealer networks whose margins are squeezed by installer shortages and component costs, so weak dealers can cut reach. Online retailers and appliance makers offer lower-priced units, and salt-free and smart entrants challenge its ion exchange focus, while brine rules and salt scrutiny reduce demand for regenerated systems.

Players Tracked

Prominent Players

Pentair
Culligan International
Kinetico
Watts Water Technologies
BWT

Other Key Players

EcoWater Systems
Whirlpool Corporation
Clack Corporation
Hague Water Conditioning
Xylem
Grundfos
Judo Wasseraufbereitung
Grünbeck Wasseraufbereitung
Haier Group
Midea Group
Eureka Forbes
Kent RO Systems
Aquasana
Atlas Filtri
Morton Salt

Recent Developments

JANUARY 2026

Pentair Launches Connected Softener Range With Salt Monitoring and Remote Service

Pentair launched a connected softener range with salt monitoring, flow tracking, and remote diagnostics for dealers in North America and Europe. It is a product launch, and it tests whether valve makers can lock in dealer loyalty through data and service. Sales volumes were not disclosed.
Signal: Confirms that leading manufacturers now compete on connected service and dealer retention rather than resin and valve specifications alone.
FEBRUARY 2026

Culligan International Expands Salt-Free Conditioner Range for Brine Restricted Regions

Culligan International expanded its salt-free conditioner range for regions that restrict brine discharge, adding certified units and filtration bundles for apartments and homes. It is a range extension, not an acquisition, and it tests whether service networks can keep customers where salt-based units are limited. Volume targets were not
Signal: Suggests service-led manufacturers are using salt-free products to retain customers in regions with brine discharge limits.
MARCH 2026

BWT Signs Valve Supply Agreement to Secure Softener Components in Europe

BWT signed a supply agreement with a valve producer to secure controls and resin for its European softener production, after component costs rose. It is a supply agreement, not an acquisition, and it tests whether long contracts can stabilise costs and delivery. Contract volumes were not disclosed.
Signal: Shows European manufacturers are locking in component supply to protect margins and delivery in softener production.

What Drives Water Softener Production Costs

Valve heads and controls account for roughly 24% of cost of goods, tanks and plastics about 20%, resin and media about 14%, electronics about 10%, and labour, assembly, and freight about 22%. Valve castings come from a few specialist makers in North America and Asia, resin from chemical groups in Europe and the United States, and electronics from global chip suppliers.
The clearest recent shock came from components and freight. Pentair reported in its annual reports that material, freight, and labour costs rose across 2022 and 2023, and the International Energy Agency reported that energy prices spiked across the same period. Manufacturers raised prices by 6% to 12%, simplified designs, and cut promotions, which squeezed gross margin by several points until contracts reset in the following year. Dealer reach compounds over time.

The competitive disadvantage falls on small manufacturers, which buy valves and resin in small lots at spot prices and cannot secure fixed contracts. Large groups sign component and resin contracts, own assembly capacity, and spread costs across many products. Exposure also varies by geography, since European makers face energy and labour costs while Asian and Latin American makers face import duties, freight.
water-softener-market-cost-volatility-analysis-1789799327344

Signing Valve, Resin, and Electronics Contracts for Twelve Months

Manufacturers sign forward contracts for valves, resin, and electronics for 12 months, consolidate orders across product lines, and dual-source key components. Forward contracts cut cost swings by roughly half, though they need volume commitments and working capital that only larger manufacturers usually provide. Terms usually run one year, delivery reliability matters, and buyers should approve early.

Simplifying Designs and Standardising Platforms to Cut Component Cost

Manufacturers standardise valve platforms, reduce part counts, and share controllers across softener families to cut material and inventory cost. Simpler designs reduce component cost per unit by 5% to 10% and speed dealer training. The main risk is loss of differentiation, so premium brands keep smart features on shared platforms. Sales data guides the mix.

Using Contract Assemblers to Avoid Capital Costs and Handle Peaks

Small manufacturers use contract assemblers rather than buying equipment, avoiding capital costs of $1 million or more. Contract assembly adds cost per unit but lowers risk and handles spring and summer peaks. The main challenge is scheduling, since slots fill early in the year, so manufacturers book capacity months ahead and agree penalties for late delivery.

Portfolio Architecture for Margin Defence

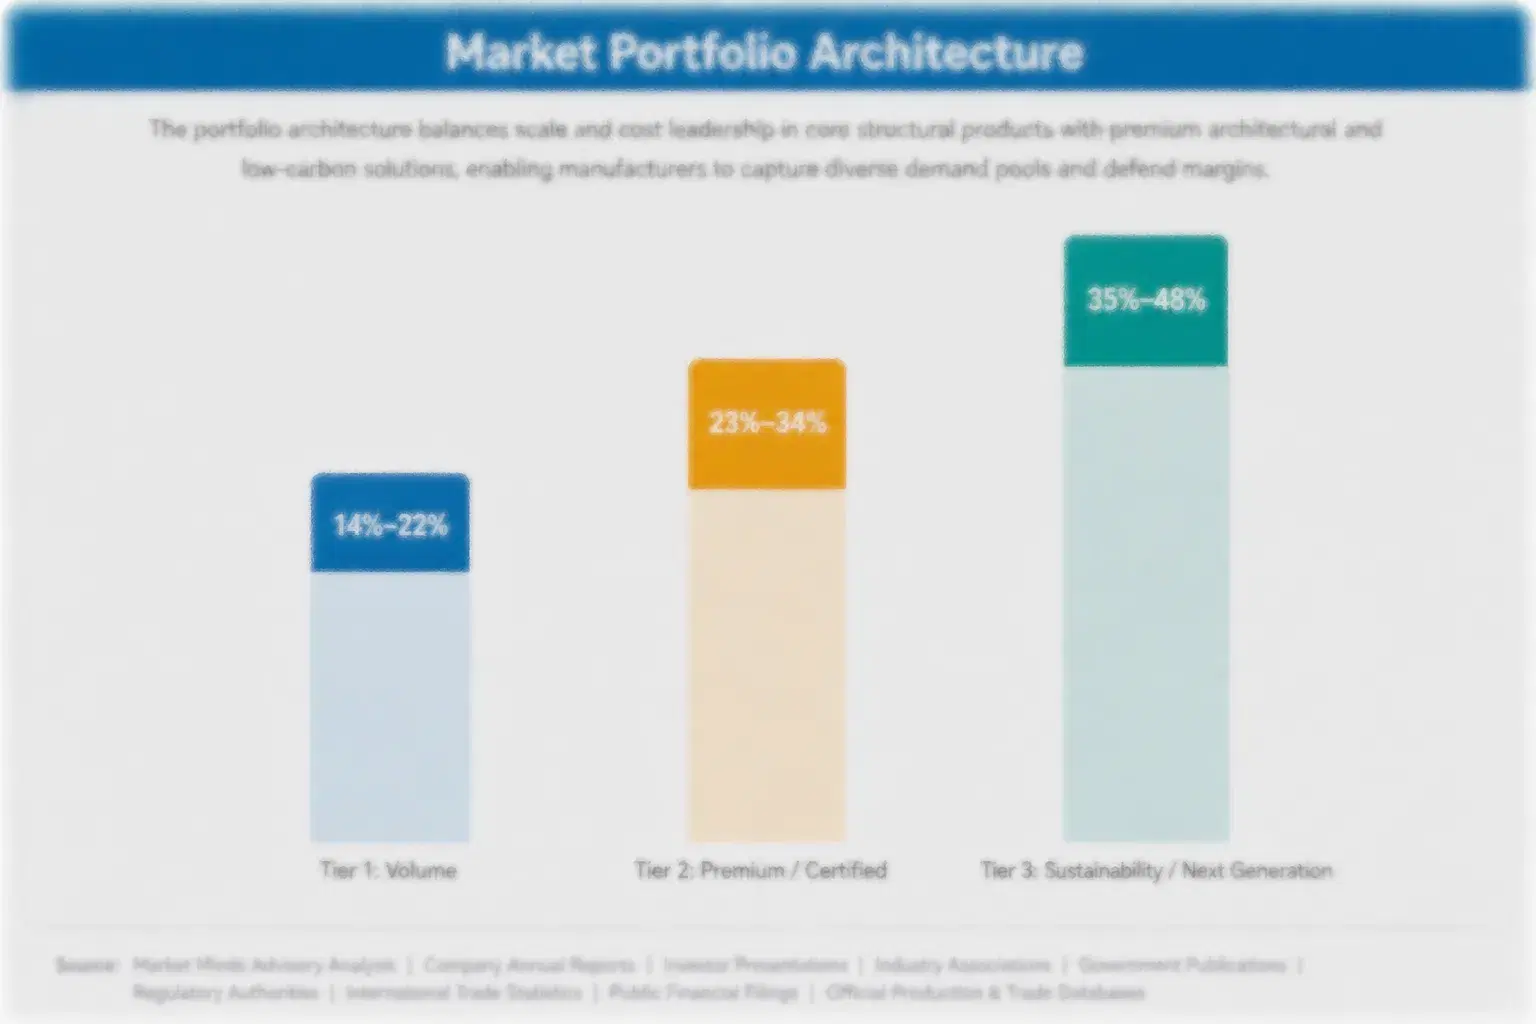
Margins run from thin returns on basic timer softeners sold through home centres and online retail to strong returns on smart connected units, certified salt-free ranges, and combined filtration systems sold through dealers with service plans. Three tiers separate volume products, certified premium lines, and next-generation formats, and each tier draws on different buyer groups, component sources, and channel terms.
The tension between volume and premium is sharp. Volume lines protect assembly utilisation and retailer relationships but face constant price pressure from online sellers and private label, while premium lines earn higher margins on smaller volumes and depend on efficiency data, dealer training, and service networks. Manufacturers that run only volume struggle to fund innovation, while manufacturers that run only premium lack the scale to hold home centre space and component pricing.

High-value pools concentrate in smart connected softeners, certified salt-free conditioners, and combined filtration systems sold through dealers with service plans. They gather where buyers pay for efficiency, compliance, or service certainty rather than unit price. Builders, hotels, and commercial laundries add further value, since these buyers ask for reliable delivery, consistent performance, and clear documentation, and they reorder without shopping on price.

Volume / Commodity-Adjacent Tier

Basic timer-based ion exchange softeners and private label units sold through home centres and online retail, with thin margins, component and freight cost exposure, and constant price competition, where buyers switch on price, warranty terms, and delivery speed.
Gross Margin: 20%-30%

Premium / Certified Tier

Premium demand-regenerating softeners with certified efficiency, fine-mesh resin, and dealer installation, sold through plumbers, dealers, and builders that require reliable parts supply, clear documentation, and stable service support across seasons and warranty periods.
Gross Margin: 34%-46%

Sustainability / Regulatory / Next-Generation Tier

Smart connected softeners, certified salt-free conditioners, and combined filtration systems built on demand control, low brine output, and service plans, sold through dealers and builders to buyers who pay premiums for compliance, efficiency, and remote support.
Gross Margin: 38%-54%
water-softener-market-portfolio-architecture-1789799327551

High-value Sub-segments and Strategic Watch-out

Smart and Connected Softeners

Smart and connected softeners combine the fastest growth with strong pricing, since buyers pay 20% to 50% premiums for salt savings, monitoring, and service certainty. Dealer training and data security limit competition, and manufacturers with strong networks win replacement demand. Recurring service revenue compounds across ownership.
Gross Margin: 38%-54%

Salt-Free Scale Conditioners

Salt-free scale conditioners deliver solid growth and healthy pricing, since buyers in brine restricted regions value no salt and low maintenance. Independent test data and certification form the entry barrier, and manufacturers with honest claims win dealer and builder listings. Filter bundles scale revenue steadily. Service coverage decides renewal.
Gross Margin: 34%-50%

Salt-Based Ion Exchange Softeners

Salt-based ion exchange softeners form the volume core, sold through dealers, home centres, and online retail at moderate margins. Growth is steady, at about 4.6% a year, as replacement demand and hard water awareness expand. Component cost, salt rules, and price competition decide profit, and manufacturers use the segment
Gross Margin: 20%-32%

Magnetic and Electronic Descalers

Magnetic and electronic descalers are the strategic watch-out, since independent tests often fail to confirm performance claims, regulators challenge marketing, and growth trails the market at about 3.8% a year. Manufacturers should test claims before scaling, because refunds and retailer delisting can erode margin quickly. Service coverage decides renewal.
Gross Margin: 24%-38%

Why Softener Buyers Keep Purchasing

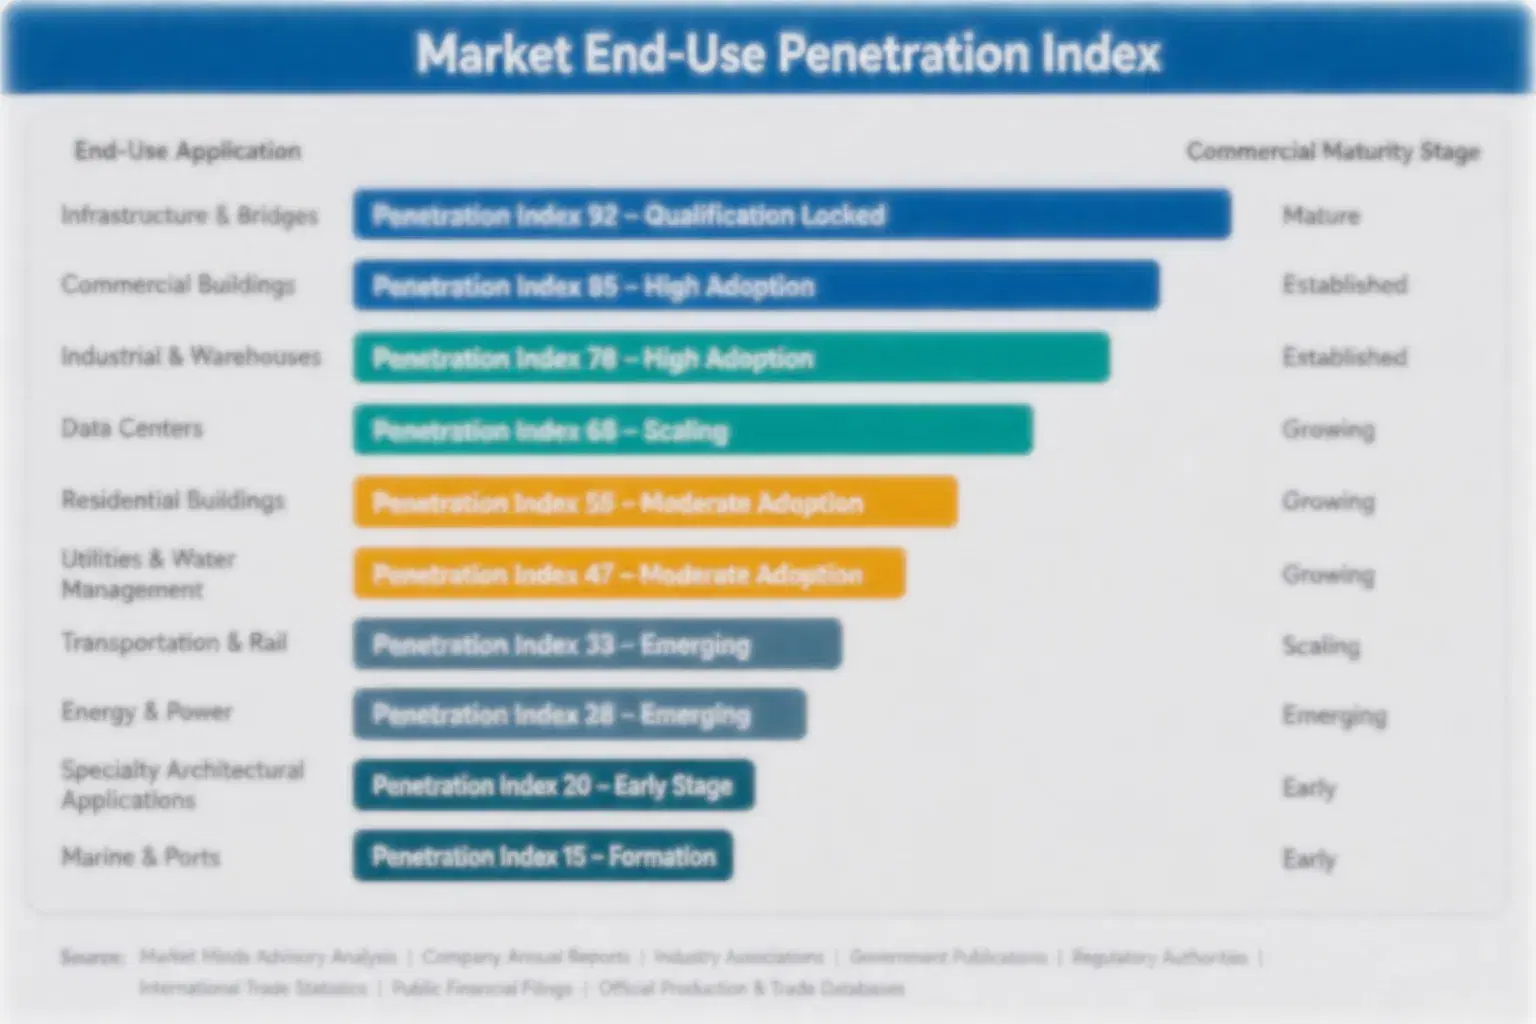
Water softener demand behaves like an annuity of hard water homes. Owners replace a failing unit with the same brand when service and warranty have been good, and salt, cartridges, and annual plans add recurring revenue between purchases. Dealers use service history to fix replacement calls, and builders use past supply to fix specifications, so successful manufacturers earn steadier volume than launches driven by novelty alone.
Adoption stickiness differs by end-use vertical. Single-family homes in hard water regions are the deepest, since owners build habits around salt delivery and service visits and change only when performance fails. Hotels and laundries are almost as loyal, because downtime is costly and service contracts repeat. Apartments and rentals are shallower and switch on price, while builders follow specification cycles that run for several

Buyer profiles are shifting between generations. Older homeowners choose softeners for appliance protection and trust dealers and established brands, while younger buyers care about salt use, app control, and water waste. Environmentally minded households add a third group that wants salt-free and low-brine options. Manufacturers that publish efficiency data and use online reviews for installer ratings win younger buyers and
water-softener-market-end-use-penetration-index-1789799327738

MMA Verdict on Water Softener Strategy

These are among the four positions where our research anticipates prominent divergence between winners and laggards over the coming forecast period. Each is grounded in the demand model, the regulatory perimeter, and the announced capacity pipeline.
01 / CONNECTED SERVICE STRATEGY

Attach Service Plans to Smart Softeners Before Retailers Commoditise Them

Smart and connected softeners grow at 9.2% a year, about 1.70 times the market rate, and they sell at 20% to 50% above standard units, so connected service plans lift lifetime margin per household by five to eight points. Winners bundle monitoring, salt delivery, and remote diagnostics, and train dealers before rivals do. Manufacturers that wait will find replacement calls allocated, and owners will already be loyal to competing service plans in hard water regions across North America and Europe.
02 / SALT-FREE RANGE STRATEGY

Build Certified Salt-Free Ranges Before Brine Bans Shrink Ion Exchange Sales

Salt-free scale conditioners grow at 7.8% a year, and brine discharge rules in more than 20 regions limit ion exchange sales, so certified conditioners and filter bundles deliver volume gains of 12% to 20% in restricted areas. Manufacturers should publish independent test data, train dealers on honest claims, and bundle cartridges. Those that oversell scale prevention will face refunds and delisting, and the premium that funds innovation will erode as retailers and global groups copy the format across dealers, retail, and online channels.
03 / COMPONENT SUPPLY STRATEGY

Contract Valves and Resin Early to Protect Margin Against Shocks

Valves, controls, resin, and tanks take about 58% of cost of goods, and shocks in commodity, chip, or freight markets can lift prices by 15% to 30% within a year, so unhedged manufacturers face margin squeezes and missed deliveries. Manufacturers should sign 12-month contracts, dual-source valve heads, and hold safety stock of resin and controllers. Those that buy only on the spot market will lose dealer trust and margin during volatile years, and premium brands will lose the supply security that supports their prices.
04 / DEALER CONVERSION STRATEGY

Finance and Train Dealers to Lift Conversion of Hard Water Leads

Dealers convert only a share of hard water leads because installed prices near $1,800 deter buyers, and financing plans and trained technicians lift conversion by 15% to 30%. Manufacturers should offer dealer financing, technician certification, and lead sharing, and reward dealers that keep annual service customers. Those that rely only on retail listings will miss volume gains of 10% to 18% in supported territories, and rivals with dealer programmes will take the installed base and the replacement calls in hard water regions.

Engagement Snapshot From the Field

A live engagement with an industry participant carrying material or product regulatory and market exposure ahead of a defining policy shift, showing how our research translates into a defensible multi-year portfolio strategy.
MARKET MINDS ADVISORY · CLIENT ENGAGEMENT SUMMARY
Water Softener Producer Strategic Portfolio Review and Transition Roadmap 2026·Investment Scenario on Water Softener Exposure Evaluation 2025-26
CLIENT PROFILE
The client is a mid-sized North American water treatment manufacturer with annual sales near USD 260 million (client-reported, unverified by MMA), two plants, and a portfolio led by timer-based softeners, filters, and valves sold through dealers, home centres, and online retail. It had no connected range, limited salt-free products, and heavy exposure to component costs and brine discharge rules.
STRATEGIC CHALLENGE
Dealer margins were falling, online sellers were cutting prices, and municipalities were tightening brine rules. Management needed to decide whether to invest in a connected range, salt-free conditioners, or dealer financing, with limited capital and only one plant able to run new controller platforms. Rivals were already moving into connected softeners. Margins follow scale and discipline.
MMA APPROACH
MMA analysed sales and cost data across 45 products, interviewed 12 dealer owners, eight home centre buyers, and six valve suppliers, and ran a homeowner survey on smart features, salt use, and price preferences across three regions. It modelled margin by segment and channel, tested component cost scenarios, and ranked investments by payback period and execution risk.
KEY FINDINGS
  1. A connected softener range with service plans could reach 12% of sales within three years at margins 10 points above the core range (client-reported, unverified by MMA).
  2. Certified salt-free conditioners could add 6% of sales in brine restricted regions at prices near ion exchange units, using existing valve platforms and one test programme.
  3. Twelve-month valve and resin contracts covering 65% of volume could cut cost swings by about half in a volatile year, protecting peak season delivery.
  4. Dealer financing and technician certification could lift lead conversion by 20% within two years and add 5% of sales through existing dealers. Dealers review lines every season.
CLIENT PROFILE
The client is a mid-sized North American water treatment manufacturer with annual sales near USD 260 million (client-reported, unverified by MMA), two plants, and a portfolio led by timer-based softeners, filters, and valves sold through dealers, home centres, and online retail. It had no connected range, limited salt-free products, and heavy exposure to component costs and brine discharge rules.
STRATEGIC CHALLENGE
Dealer margins were falling, online sellers were cutting prices, and municipalities were tightening brine rules. Management needed to decide whether to invest in a connected range, salt-free conditioners, or dealer financing, with limited capital and only one plant able to run new controller platforms. Rivals were already moving into connected softeners. Margins follow scale and discipline.
MMA APPROACH
MMA analysed sales and cost data across 45 products, interviewed 12 dealer owners, eight home centre buyers, and six valve suppliers, and ran a homeowner survey on smart features, salt use, and price preferences across three regions. It modelled margin by segment and channel, tested component cost scenarios, and ranked investments by payback period and execution risk.
KEY FINDINGS
  1. A connected softener range with service plans could reach 12% of sales within three years at margins 10 points above the core range (client-reported, unverified by MMA).
  2. Certified salt-free conditioners could add 6% of sales in brine restricted regions at prices near ion exchange units, using existing valve platforms and one test programme.
  3. Twelve-month valve and resin contracts covering 65% of volume could cut cost swings by about half in a volatile year, protecting peak season delivery.
  4. Dealer financing and technician certification could lift lead conversion by 20% within two years and add 5% of sales through existing dealers. Dealers review lines every season.
RECOMMENDED STRATEGY
Phase 1: Phase 1 (Months 1-6): Sign valve and resin contracts, launch dealer financing, and start connected softener trials with 20 dealers in two regions. Phase 2: Phase 2 (Months 7-18): Launch the connected range nationally and start salt-free conditioners in brine restricted regions with independent test data. Phase 3: Phase 3 (Months 19-30): Reduce low-margin retail volume, expand controller and assembly capacity, and add dealers in two new territories, reviewing margin quarterly.
OUTCOME
Within 30 months, connected and salt-free products reached 19% of sales, launch costs were recovered, and gross margin improved by five points (client-reported, unverified by MMA). The client added 90 dealers and service plan subscriptions across 12,000 homes, while builders named it a preferred supplier for water treatment.

Frequently Asked Questions

Foundational context covering the market sizes, CAGR, scope, country, region and competition that inform every finding below. This section is provided to cover basics and most often pre-purchase conversations, answered from the MMA Primary Research Dataset.

What is the current size of the Water Softener Market?

The global water softener market was valued at $3.6 billion in 2025. Growth is supported by hard water awareness, replacement demand, and smart and salt-free formats across residential and commercial channels.

How large will the Water Softener Market be by 2036?

The market is projected to reach $6.4 billion by 2036, up from $3.8 billion in 2026. The increase of $2.6 billion reflects smart ranges, salt-free products, and emerging market volume.

What is the CAGR for the Water Softener Market 2026 to 2036?

The market is forecast to grow at a 5.4% CAGR from 2026 to 2036. The bull case reaches 6.7% and the bear case 4.1%, depending on housing activity and brine discharge rules.

Which segment is growing fastest?

Smart and Connected Softeners is the fastest-growing segment at 9.2% CAGR, roughly 1.70 times the overall market rate. Salt-Free Scale Conditioners follows as the second-fastest segment at 7.8% CAGR each year.

Who are the major companies in the Water Softener Market?

Major companies include Pentair, Culligan International, Kinetico, Watts Water Technologies, and BWT. EcoWater Systems, Whirlpool Corporation, Xylem, Haier Group, Grünbeck Wasseraufbereitung, and regional dealers also hold meaningful positions.

Which country is growing fastest?

India is the fastest-growing country at a 9.0% CAGR, driven by housing growth, hard water awareness, and online appliance retail. China and Vietnam follow through new housing and rising incomes.

Report Segmentation Architecture

The full report scope spans multiple orthogonal segmentation dimensions, with cross-tabulated demand data provided for each dimension pair. Coverage extends further to regional breakdowns, trend trajectories, and the competitive detail needed to support segment-level decision-making.

By Primary Market Dimension

  • Salt-Based Ion Exchange Softeners
  • Smart and Connected Softeners
  • Salt-Free Scale Conditioners
  • Magnetic and Electronic Descalers
  • Combined Filtration and Softening Systems
  • Portable and Cartridge Softeners

By End-Use Industry

  • Single-Family Homes
  • Multi-Family Housing
  • Hotels and Hospitality
  • Restaurants and Laundries
  • Light Industry and Healthcare

By Commercial Dimension

  • Water Treatment Dealers
  • Plumbers and Contractors
  • Home Centres and Retail
  • Builders and Developers
  • Online and Direct-to-Consumer

By Region

  • North America
  • Western Europe
  • East Asia
  • South Asia and Pacific
  • Latin America
  • Middle East and Africa
  • Eastern Europe

Scope, Methodology, and Coverage

Every figure in this report is reproducible from documented input assumptions. The scope below maps the historical period, the forecast horizon, the segmentation dimensions, and the countries covered, alongside the underlying primary and qualitative methodology.
Historical Period
2020 to 2025
Forecast Period
2026 to 2036
Base Year
2025 (USD billions; MMA Primary Research Dataset, September 2026)
Market Definition
Water softeners comprise point-of-entry and point-of-use equipment that reduces water hardness through ion exchange, salt-free scale conditioning, magnetic or electronic descaling, or combined filtration and softening, including smart and connected units, portable and cartridge softeners, and commercial systems for hotels, restaurants, and light industry, sold through dealers, home centres, builders, and online channels. The scope excludes municipal softening plants, boiler feedwater systems for large industry, and standalone drinking water filters.
Quantitative Units
USD billions (manufacturer and dealer sales value); million units for installed base references
Segmentation Dimensions
By Treatment Technology and Control Level; By End-Use Setting; By Commercial Dimension; By Region
Regions Covered
North America, Western Europe, East Asia, South Asia and Pacific, Latin America, Middle East and Africa, Eastern Europe
Countries Covered
United States, Canada, Mexico, Germany, France, United Kingdom, Italy, Spain, Poland, China, Japan, South Korea, India, Australia, Brazil, Saudi Arabia, United Arab Emirates, South Africa, and additional markets relevant to this sector
Key Companies Profiled
Pentair, Culligan International, Kinetico, Watts Water Technologies, BWT, EcoWater Systems, Whirlpool Corporation, Clack Corporation, Hague Water Conditioning, Xylem, Grundfos, Judo Wasseraufbereitung, Grünbeck Wasseraufbereitung, Haier Group, Midea Group, Eureka Forbes, Kent RO Systems, Aquasana, Atlas Filtri, Morton Salt
Quantitative Methodology
Primary survey, n=3,800 respondents, Q4 2025, six countries; demand-side model with trade association cross-validation
Qualitative Methodology
47 expert interviews, Q4 2025; applied to validate demand model assumptions, identify emerging dynamics, and assess competitive positioning
Report Format
PDF and XLSX data workbook (Word format preview document)
Publisher
Market Minds Advisory
Report Code
MMA-2026-CON-405
Published
September 2026
Contact
sales@marketmindsadvisory.com | www.marketmindsadvisory.com

Purchase the full Water Softener Market Report (2026 to 2036).

The full report delivers a detailed assessment of global water softeners through 2036, covering segment, regional, and country forecasts, competitive benchmarking of leading manufacturers, and input cost analysis. It combines MMA primary research, including a six-country survey of 3,800 respondents and 47 expert interviews, with public trade and company data. Analysts also model component cost paths, brine rule scenarios, and connected adoption. Clients receive segment margin ranges, channel maps, and a case study on portfolio strategy. Dealer and builder contact frameworks are also included for negotiation planning.
Ten-year segment and regional demand forecasts
Valve, resin, and electronics price tracking
Competitive benchmarking of top twenty softener manufacturers
Brine discharge and certification rule tracker
Regional demand mechanism comparative analysis included
Quarterly primary survey data update access

Built For The People Who Decide

From boardroom strategy to bench-side execution, this report is read cover-to-cover by leaders shaping the next decade of their industry, turning demand scenarios, market dynamics and valuation benchmarks into decisions.
CXOs/ Presidents/ VPs/ Managers
M&A and Corporate Development
Strategy Teams and R&D Heads
Procurement and Product Directors
Regulatory and Compliance Leaders
Investor Relations and Equity Analysts