

Market Minds Advisory
Water Purifier Bottle Market

Water Purifier Bottle Market: Water Purifier Bottle Market: A Filter Is Not A Purifier, Nothing Tells You When It Stops Working, And Some Get Worse With Use, 2026 to 2036

Only about 19% of volume achieves the virus reduction the word purifier implies. Just 8% of products indicate when a filter is exhausted, and 23% of owners replace on schedule.

Lead Analyst

Published

September 2026

Make Smarter Decisions with Customized Research Insights

Request a free sample report and evaluate market opportunities, growth trends, and competitive dynamics relevant to your business needs.

2025 MARKET VALUE$1.3BMarket Size 2025
2036 FORECAST VALUE$3.2BBase Case , 2026 to 2036
CAGR 2026 TO 20368.6 %Bull 9.8% / Bear 7.4%
INCREMENTAL OPPORTUNITY$1.8BNet 10- year value creation
EXPANSION MULTIPLE2.29x2036 value over 2026 base
Strategic Levers
M&A Pipeline
Regional Outlook
Country Rankings
Competitive Intelligence
Segmental Deep-dive
Call-Us : 91 93563 13602

Executive Snapshot and Market Trajectory.

A filter removes bacteria and protozoa. A purifier removes viruses as well, and only about 19% of category volume achieves that. The two words are used interchangeably on packaging, and a buyer choosing a bottle for travel cannot tell which one they have bought. The distinction matters where travel happens.
UV-C LED sterilising bottles grow at 12.9%, half again the market rate of 8.6%, because ultraviolet dose handles viruses that carbon and most hollow-fibre media do not. Multi-stage purifier bottles follow at 11.2%. Gravity and squeeze hybrid bottles grow slowest of the six technologies at 5.9%, and activated carbon still carries the largest share of units. Only about 34% of products across the category hold third-party performance certification rather than an internal laboratory claim.
East Asia holds 30% of demand and manufactures nearly all of it, with Indian growth of 14.6% leading every market covered on intermittent piped supply that makes point-of-use treatment a daily requirement. Around 8% of products indicate when a filter is exhausted, and 23% of owners replace at the specified interval. Roughly 17% of used units show microbial growth inside the housing, which makes some dirtier than the water.
Market Definition
This market covers portable drinking bottles with integrated water treatment, including activated carbon filter bottles, hollow-fibre microfiltration bottles, UV-C LED sterilising bottles, ion-exchange and resin filter bottles, multi-stage purifier bottles, and gravity and squeeze hybrid bottles. It excludes unfiltered reusable bottles, countertop and under-sink purifiers, gravity bag and backpacking filter systems, water treatment chemicals and tablets, and municipal or industrial treatment equipment.
Base Year Value
$1.3B in 2025 (MMA Primary Research Dataset, September 2026)
Forecast Period
2026 to 2036, eleven discrete annual values
CAGR
8.6% base case. Bull 9.8%. Bear 7.4%.
Fastest Growth Segment
UV-C LED Sterilising Bottles: 12.9% CAGR
Fastest Growth Country
India: 14.6% CAGR
Fastest Growth Region
South Asia and Pacific: 10.6% CAGR
Largest Region
East Asia: 30% of 2025 global value
Market Leaders
LifeStraw, Katadyn Group, Brita Group, Larq, and Grayl lead the field. Source: MMA Primary Research Dataset, July 2026.
Primary Survey
n=3,800 procurement and R&D decision-makers, Q4 2025, six countries
Methodology
Demand-side build-up, cross-validated against public data, 47 expert interviews

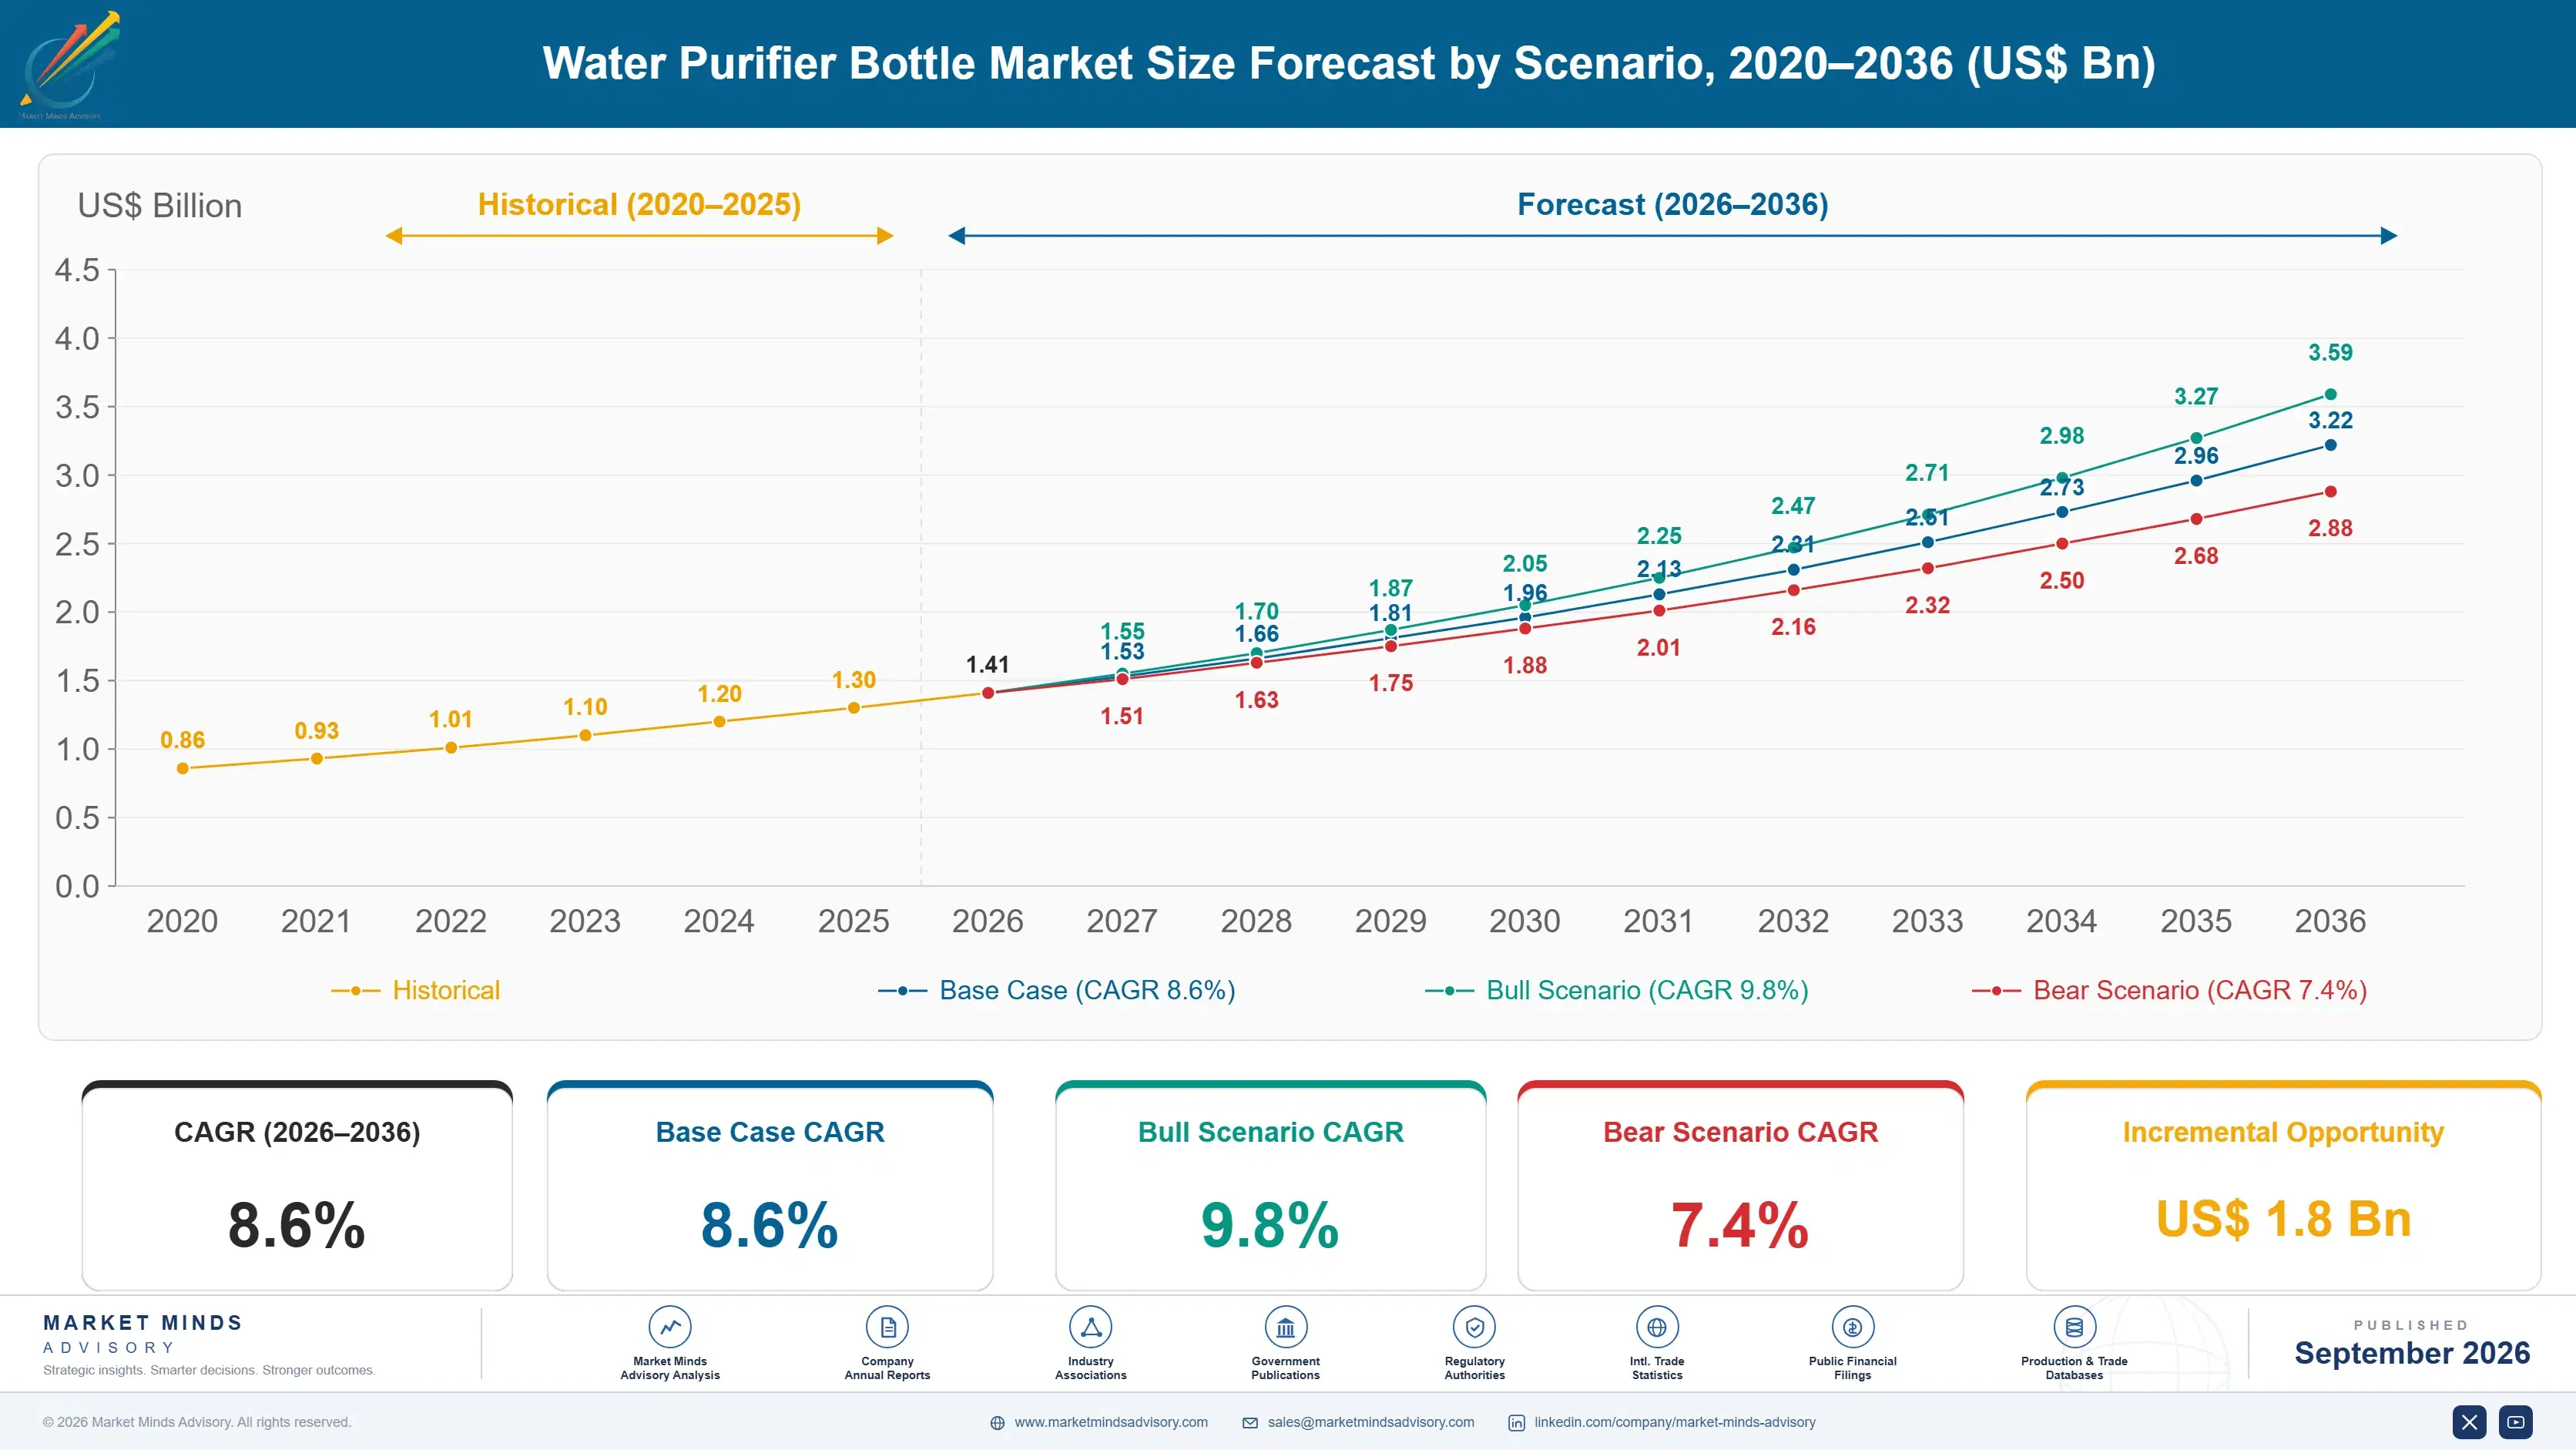
Water Purifier Bottle Market Forecast Scenarios

water-purifier-bottle-market-size-forecast-scenario-1790019298313
Growth from 2020 to 2025 ran at 7.5% and came from two directions that barely overlap. Outdoor and travel demand in Western markets bought hollow-fibre and multi-stage products for genuine pathogen removal, while urban Asian demand bought carbon bottles largely for taste and for reassurance about piped supply. UV-C LED products arrived late in the period as component costs fell far enough to make them commercially viable.
The base case at 8.6% rests on three mechanisms. UV-C LED keeps taking share as component costs fall and as buyers learn that carbon does nothing for pathogens. Indian and Southeast Asian demand expands on intermittent piped supply, with Indian growth at 14.6% leading every country covered. And multi-stage products keep displacing single-technology bottles among travellers who have read what each medium actually removes. None depends on certification rates rising.
The bull case at 9.8% depends on end-of-life indication becoming standard, which would convert an unmanaged consumable into a scheduled replacement and roughly double filter revenue per unit. The bear case at 7.4% is terminology: an advertising authority ruling on purifier claims would affect around 81% of current volume rather than reprice it. That volume is filtration, not purification.

Filter, Purifier, And The Gap

In water treatment the words filter and purifier mean different things. A filter removes bacteria and protozoa by pore size; a purifier also removes viruses, which are small enough to pass most membranes and require ultraviolet dose, chemical treatment, or a much tighter medium. Around 19% of category volume achieves virus reduction. The rest is sold with the two words used more or less interchangeably on the front of a pack.
TOP FIVE CONCENTRATION27%Share of category revenue held by the leading manufacturers
VIRUS CAPABLE VOLUME SHARE19%Volume achieving the virus reduction that purifier terminology implies
FILTER REPLACEMENT COMPLIANCE23%Owners replacing filters at the interval their manual specifies
END OF LIFE INDICATION8%Products carrying any indicator showing the filter is exhausted
THIRD PARTY CERTIFICATION RATE34%Products holding independent certification rather than only internal testing
BIOFILM DETECTION RATE17%Used units showing microbial growth within the housing or filter
Activated carbon carries the largest share of units and does essentially nothing for pathogens at all. It removes chlorine, improves taste, and adsorbs some organic compounds, which is a genuine benefit and an entirely different one. Taste improvement is immediate and reads as purification, which is why carbon bottles sell to people who believe they are protected.
Then the part nobody designs for. About 8% of products carry any indication that a filter is exhausted, and 23% of owners replace at the specified interval, so most bottles run past end of life without announcing it. Flow rate drops and people squeeze harder. Worse, a wet carbon block at room temperature is a reasonable growth medium, and 17% of used units show microbial growth inside the housing.
"A filter is not a purifier, the pack rarely tells you which one you bought, and nothing on most of these bottles tells you when the thing stopped working. A meaningful share of them are dirtier inside than the water people are treating."
Practice Director, Consumer Durables and Outdoor Equipment · MMA Consumer Appliances and Outdoor Equipment Practice · September 2026

Market Trends

Ultraviolet Dose Handles What Membranes Let Through

UV-C LED sterilising bottles grow at 12.9%, fastest of the six technologies, because ultraviolet inactivation works on viruses that pore-size filtration does not stop. Component costs have fallen far enough that the format has moved from a specialist item into mainstream travel retail. The caveat rarely printed is dose dependence: inactivation requires sufficient exposure time and reasonably clear water, and turbidity shields organisms from the light. Products marketed on a flat percentage figure without that condition are describing laboratory conditions rather than field ones. A particulate pre-filter stage removes most of the objection and very few architectures include one.
Market Impact: Country grows at 14.6%

Multi-Stage Displaces The Single Technology Formats

Multi-stage purifier bottles grow at 11.2% as buyers who have read what each medium removes stop treating one technology as sufficient. Carbon handles taste and chemicals, hollow fibre handles bacteria and protozoa, and ultraviolet or a tighter membrane handles viruses, and no single stage covers all three. The commercial consequence is a higher unit price and a more complex consumable, since a multi-stage product has more than one thing to replace on more than one schedule. Very few manage that scheduling for the user. Consumable revenue should be highest here and frequently is not, because nothing prompts the replacement purchase.
Market Impact: Technology grows at 12.9%

Market Opportunities and Growth Drivers

Intermittent Piped Supply Creates Daily Demand

India grows at 14.6%, faster than any country covered, because intermittent piped supply means households store water and stored water recontaminates. That turns point-of-use treatment into a daily domestic requirement rather than a travel accessory, which is a completely different purchase pattern from the Western outdoor market. South Asia and Pacific holds 17% of world demand on that basis. Price points sit far below world averages and the mix skews toward carbon and basic hollow-fibre formats accordingly. Certification rates across the region are the lowest anywhere covered, so the buyers with greatest need have least verifiable information.
Market Impact: Only 8% indicate exhaustion

Component Cost Decline Opens Ultraviolet To Mainstream

UV-C LED emitter costs have fallen substantially as the technology found volume in unrelated consumer and industrial applications, and portable water treatment has inherited that curve without contributing to it. A format that was a specialist product five years ago now reaches mainstream travel and commuter retail at prices that were impossible before. Battery life and charging convenience have improved alongside. That combination is what moved ultraviolet from a niche technology into the category's fastest growing one. Manufacturers specifying emitters already at scale in those applications capture that curve, while those commissioning bespoke parts forfeit it entirely.
Market Impact: About 17% show growth

Market Restraints and Challenges

Nothing Tells The Owner The Filter Stopped Working

About 8% of products carry any end-of-life indication and 23% of owners replace at the specified interval, and the root cause is that exhaustion is invisible: a spent filter still passes water, just more slowly. Commercially this suppresses consumable revenue and leaves users unprotected while believing otherwise. Manufacturers respond with volume counters, colour-change media, connected reminders tied to a purchase account, and flow restrictors that stop the bottle working rather than degrading quietly. Flow restriction is the version that works, because it stops the product rather than letting it fail quietly.
Market Impact: Segment grows at 12.9%

Wet Media At Room Temperature Grows Biofilm

Around 17% of used units show microbial growth within the housing or filter, and the root cause is that a damp carbon block or membrane held at ambient temperature between uses is a reasonable growth substrate. Commercially this is the category's most uncomfortable finding, since a proportion of these products become dirtier than the water they treat. Manufacturers respond with silver or antimicrobial media, with drying-friendly housing geometry, and with explicit between-use handling guidance. Occasional users storing a damp filter between trips carry the highest exposure, which is the opposite of what most people would assume about frequency of use.
Market Impact: Segment grows at 11.2%
3 additional market trends, 4 additional growth drivers, and 2 additional restraints and challenges are covered in the full report. Contact sales@marketmindsadvisory.com to access the complete intelligence.

Segment CAGR and Growth Architecture

Segmentation follows treatment technology across six categories: activated carbon filter bottles, hollow-fibre microfiltration bottles, UV-C LED sterilising bottles, ion-exchange and resin filter bottles, multi-stage purifier bottles, and gravity and squeeze hybrid bottles. End-use setting, price tier, and certification status are treated as separate dimensions entirely. Countertop purifiers, gravity bag systems, and treatment tablets fall outside the defined scope entirely.
water-purifier-bottle-market-market-share-analysis-1790019298853

UV-C LED Sterilising Bottles

UV-C LED bottles grow at 12.9%, half again the market rate of 8.6%, and they are the only single technology in the category that addresses viruses without a very tight membrane. Emitter costs have fallen on volumes generated by unrelated applications, which moved the format from specialist to mainstream travel retail within a few years. The technical caveat is dose dependence: inactivation needs adequate exposure time and reasonably clear water, and turbid water shields organisms from the light entirely. Products quoting a flat reduction percentage without stating turbidity conditions are describing a laboratory. Battery management is the other design constraint most manufacturers underestimate. A pre-filter stage addresses the turbidity objection directly.
CAGR 12.9%

Multi-Stage Purifier Bottles

Multi-stage purifier bottles grow at 11.2% by combining media that each handle a different problem, since no single technology covers taste, bacteria, protozoa, and viruses together. Carbon addresses chlorine and organics, hollow fibre addresses larger pathogens, and ultraviolet or a tighter membrane addresses the viral fraction. The commercial complication is the consumable: a multi-stage product has several elements exhausting on several different schedules, and almost none of them manage that for the owner. Unit prices are the highest in the category and consumable revenue should be too, though poor replacement compliance means it frequently is not. Buyers reaching this segment have usually read what each medium removes, which makes them more demanding about certification.
CAGR 11.2%
Full segment breakdown across 6 segments available in the complete report.

Regional Architecture and Country Demand Map

Regional shares reflect where water purifier bottles are purchased rather than where they are manufactured. Two regions sit outside the standard bands, for reasons named in their own paragraphs and summarised below for operator review. Water quality and buying rationale vary enormously between them, and each paragraph names the mechanism.

East Asia

Nearly all of the world's water purifier bottles are manufactured here, and Chinese and Korean domestic demand has grown into a substantial market in its own right rather than only an export base. Growth of 9.6% runs above the world rate. Chinese purchasing is driven largely by taste and by reassurance about piped supply rather than by pathogen concern, which keeps carbon formats dominant. Japanese and Korean demand skews toward higher specification multi-stage and ultraviolet products. Domestic brands increasingly sell directly rather than supplying Western labels, compressing margin across the field considerably. Ultraviolet adoption is rising fastest in Korea and Japan, where buyers distinguish between taste treatment and pathogen treatment more readily than elsewhere in the region.
Share: 30% | CAGR: 9.6% (2026 to 2036)

North America

Outdoor, travel, and emergency preparedness demand carries most of the regional market, and buyers here are more likely than anywhere to understand what each medium actually removes. Growth of 7.9% runs a little under the world rate. Third-party certification is held more often and asked for more often here than in any other region, though the rate is still only a third of products. Unit prices are the highest of any region, which lifts value share above the region's share of units. Advertising authorities have begun examining purifier terminology. Outdoor retail staff correct misinformation at the point of sale, which is part of why certification is asked for here. Mass retail does not correct anything.
Share: 23% | CAGR: 7.9% (2026 to 2036)
Regional intelligence for 5 additional markets available in the complete report: Western Europe, South Asia and Pacific, Latin America, Middle East and Africa, Eastern Europe. Contact sales@marketmindsadvisory.com.
water-purifier-bottle-market-country-cagr-analysis-1790019299380

Where Bottle Makers Build Position

Four commercial moves matter in a category where the category name overstates what most products do, nothing tells an owner when protection ended, and a share of units grow their own contamination. Each converts an unmanaged risk into a designed feature that also happens to pay. None of the four requires a new treatment technology.

Build End Of Life Indication Into Every Product

Only about 8% of products indicate filter exhaustion and 23% of owners replace on schedule, which leaves consumable revenue unrealised and users unprotected simultaneously. Manufacturers fitting volume counters, colour-change media, or flow restriction that stops the bottle rather than degrading quietly report consumable revenue 2.8 times higher per unit sold. The component cost is small against the recurring revenue it creates, and it is the rare intervention that improves safety and margin at once. Manufacturers have effectively designed a razor without a blade sale and then wondered why unit economics look thin.
Market Impact: Raises consumable revenue per unit 2.8 times higher

State Which Word Applies To This Product

Around 19% of volume achieves the virus reduction the word purifier implies, and packaging across the field uses filter and purifier as though they meant the same thing. Manufacturers stating the distinction plainly, with the organism classes each product handles, report return rates 2.2 times lower and materially better review sentiment. Buyers who understand what they bought do not feel misled when it performs as designed. Advertising authorities are beginning to examine exactly this language. Stating the organism classes handled is more useful to a buyer than any percentage figure.
Market Impact: Cuts product return rates 2.2 times lower overall

Engineer The Housing To Dry Between Uses

About 17% of used units show microbial growth within the housing or filter, because damp media at ambient temperature is a workable growth substrate. Manufacturers designing drying-friendly geometry, adding antimicrobial media, and giving explicit between-use guidance report contamination rates 3.4 times lower in field testing. This is the category's most uncomfortable finding and the one least often designed for. Solving it costs housing geometry rather than a new technology, which makes the omission harder to justify. Occasional users storing damp filters between trips carry the highest exposure, which is the group most manufacturers assume is lowest risk.
Market Impact: Cuts field contamination rates 3.4 times lower overall

Hold Independent Certification Rather Than Internal Testing

Only about 34% of products hold third-party performance certification, and a consumer standing in a shop cannot distinguish independently verified performance from a manufacturer's own laboratory claim. Manufacturers holding recognised certification report price realisation 1.9 times higher in outdoor and travel channels where buyers ask the question. Certification cost is a fraction of a product development budget. Its absence is why genuinely good products compete on price against claims nobody verified at all. Buyers in outdoor and travel channels ask the question directly, while mass retail buyers do not yet and increasingly will as terminology scrutiny spreads.
Market Impact: Raises achieved price realisation to 1.9 times higher

Who Controls the Margin Pool

Concentration is very low. Five manufacturers hold 27% of category revenue, measured consistently on that basis across all participants, and the remainder divides between outdoor equipment specialists, household filtration brands, consumer electronics groups entering through ultraviolet, and a very large Chinese manufacturing base increasingly selling under its own labels rather than supplying others. The leader to challenger gap is wide in certified products and almost absent in basic carbon formats.
Competition currently turns on three dimensions: ultraviolet dose engineering and battery management, where genuine capability separates products that work in field conditions; consumable management, since replacement compliance decides both safety and recurring revenue; and certification position, which is the only signal a buyer can verify at the point of sale. Price decides in mass retail, which still accounts for the large majority of units moved across every region covered here.

Pressure builds from two directions at once. Chinese manufacturers hold the cost base and are moving into direct selling with their own brands. Purifier terminology is attracting advertising scrutiny. Rankings will shift toward manufacturers holding certification and end-of-life indication rather than housing design and channel position. Manufacturers holding only basic carbon volume are the most exposed of anyone here.
water-purifier-bottle-market-company-positioning-matrix-1790019299902

Competitive Moat and Risk Dimensions

LIFESTRAW

Moat: Hollow Fibre And Field Credibility

Deep hollow-fibre membrane capability combined with credibility earned in humanitarian and field deployment gives a performance position that consumer channel entrants cannot claim. That field record is verified by organisations with no commercial interest in the outcome, which is a considerably stronger signal than any laboratory claim.
LIFESTRAW

Risk: Limited Virus Capable Range

Hollow-fibre membranes stop bacteria and protozoa and let viruses through, which means much of the range sits in the 81% of volume that does not do what the category name implies. Extending into genuine virus capability requires ultraviolet or membrane technology the position was not built around.
LARQ

Moat: Ultraviolet Integration And Design

Early integration of UV-C LED into a mainstream consumer bottle format established a position in the category's fastest growing technology before component costs made it broadly accessible. Battery management and dose control are genuinely difficult to execute well and separate working products from ones that only work in a laboratory.
LARQ

Risk: Dose Depends On Water Clarity

Ultraviolet inactivation requires reasonably clear water, and turbidity shields organisms from the light in exactly the conditions where treatment matters most. A product marketed on a flat reduction figure carries a claim exposure that a pre-filter stage would remove but that the current architecture does not address.

Players Tracked

Prominent Players

LifeStraw
Katadyn Group
Brita Group
Larq
Grayl

Other Key Players

Sawyer Products
Cascade Designs
Aquasana
Koninklijke Philips
Xiaomi
Panasonic Holdings
Waterdrop
Epic Water Filters
Clearly Filtered
Astrea
Water-to-Go
Purewell
Sagan Life
Ningbo Qianyao
Guangdong Aquapure

Recent Developments

FEBRUARY 2026

LifeStraw Adds Volume-Based End Of Life Indication Across Its Range

LifeStraw introduced volume-counting end-of-life indication across its bottle products, restricting flow once a filter reaches its rated capacity. The design stops the product rather than allowing it to degrade quietly past its useful life. Rated capacity is now printed on the product rather than only in the manual.
Signal: Stopping the bottle protects the user and creates the replacement sale. Silent degradation loses the sale and the protection together.
SEPTEMBER 2025

Larq Adds Pre-Filter Stage To Ultraviolet Bottle Architecture

Larq introduced a particulate pre-filter ahead of the ultraviolet stage across its range, addressing the turbidity shielding that reduces inactivation in field conditions. Performance figures are now published with stated turbidity conditions attached. The pre-filter is user-replaceable on a schedule separate from the emitter itself.
Signal: Stating the condition is more defensible than quoting a flat percentage. Turbidity was the unstated condition behind every published figure.
MAY 2025

Katadyn Acquires Antimicrobial Housing Technology Business

Katadyn Group completed an acquisition of a business developing antimicrobial and drying-friendly housing for portable filtration. The transaction was an outright acquisition rather than a joint venture or minority stake, with biofilm findings cited as the rationale. Housing design staff transferred with the business under agreed terms.
Signal: Biofilm is finally being treated as a design problem rather than user error. Geometry rather than technology solves this.

What A Purifier Bottle Costs

Three cost groups dominate. Bottle body, cap, seals, and tooling run 28% to 36% of cost of goods sold, and the eight-point range separates stainless and premium polymer bodies from basic ones. Filter media and cartridge assembly take 26% to 34%, rising sharply for hollow-fibre and multi-stage products. Electronics, emitter, and battery account for 22% to 30% in ultraviolet models and nothing at all in passive ones.
Engineering polymer and stainless steel pricing moved through 2024 and 2025 on industrial demand and freight together, and United States Geological Survey mineral commodity summaries documented the metal movements across the period. Several manufacturers described the resulting margin pressure in their annual reports. Ultraviolet emitter costs fell sharply across the same window on volumes generated by unrelated consumer and industrial applications. The two moved in opposite directions.

The competitive disadvantage mechanism runs through certification rather than through component cost. A brand serving many markets carries performance certification and materials compliance testing in each of them, while a Chinese direct seller entering one or two carries a fraction of that burden on comparable hardware. Exposure therefore varies by market breadth rather than by scale, and mid-sized Western brands selling everywhere are the most squeezed.
water-purifier-bottle-market-cost-volatility-analysis-1790019300108

Design One Platform Across Certification Regimes

Performance and materials requirements differ enough between markets that separate variants are often developed for each, multiplying tooling and testing cost. A single platform engineered to the strictest regime and certified once across markets converts a repeated compliance burden into a volume position, which is the only lever that materially moves this line. Certification cost falls per market served.

Specify Emitters At Consumer Category Volumes

Ultraviolet emitter costs are falling because unrelated consumer and industrial categories consume them at volumes portable water treatment never will approach. Specifying components already at scale in those applications rather than bespoke parts captures a cost curve this industry contributes nothing to and can otherwise only watch from the outside. Bespoke parts forfeit a curve this industry does not drive.

Build Consumable Revenue Into The Unit Economics

Replacement filters carry considerably better margin than the bottle and currently go unsold because owners do not know when to buy them. Treating end-of-life indication as a revenue mechanism rather than a safety feature changes the case for the component entirely, and it pays for itself within the first replacement cycle. The component pays for itself inside one replacement cycle.

Portfolio Architecture for Margin Defence

Margin follows verified performance and consumable capture rather than treatment technology. Basic carbon bottles compete close to commodity terms against Chinese direct sellers using identical media. Hollow-fibre products earn modestly on genuine pathogen performance. Certified multi-stage products earn well because a buyer can verify what they do, and ultraviolet systems with end-of-life management earn most, on the unit and on the recurring element together.
The tension between volume and premium runs through what the buyer can check. A shopper comparing two bottles sees similar claims, similar capacities, and a price difference, so price decides. A traveller who has read what each medium removes, and who asks whether the product is certified and how they will know when the filter is done, finds very few products that answer and pays substantially more for the ones that do.

High-value pools concentrate in certified multi-stage products, in ultraviolet systems with pre-filtration and stated turbidity conditions, and in any architecture that manages its own consumable schedule. Where the product is a basic carbon bottle sold on capacity and taste improvement, media are identical across the field and Chinese manufacturers hold the cost position outright.

Volume / Commodity-Adjacent

Basic activated carbon and simple squeeze bottles sold on capacity, taste improvement, and price. The ten-point range reflects sourcing position and channel cost rather than any performance capability a buyer could verify before purchase.
Gross Margin: 26% to 36%

Premium / Certified

Hollow-fibre and ion-exchange bottles holding third-party performance certification and stating the organism classes they address. The twelve-point range separates independently verified performance from products relying on internal laboratory claims alone.
Gross Margin: 42% to 54%

Sustainability / Regulatory / Next-Generation

Certified multi-stage and ultraviolet systems with pre-filtration, stated turbidity conditions, and managed end-of-life indication. The sixteen-point range reflects dose engineering and consumable management, neither assembled quickly. Buyers here verify what they are told before purchase.
Gross Margin: 58% to 74%
water-purifier-bottle-market-portfolio-architecture-1790019300619

High-value Sub-segments and Strategic Watch-out

Managed Consumable Ultraviolet Systems

Highest value in the category, earning on the unit and on a replacement cycle the product actually prompts. The sixteen-point range reflects dose engineering and battery management, which separate field performance from laboratory performance entirely. Very few architectures currently prompt their own replacement purchase at all.
Gross Margin: 60% to 76%

Certified Multi-Stage Purifier Bottles

High value where independent certification lets a buyer verify what the product removes rather than trusting a claim. The fourteen-point range reflects certification breadth across markets, since schemes differ and each one costs separately to obtain. Buyers here ask the certification question before they buy.
Gross Margin: 50% to 64%

Hollow-Fibre Field Grade Bottles

Volume core with genuine bacteria and protozoa performance and no virus capability whatsoever. The twelve-point range reflects membrane quality and housing design, with biofilm resistance increasingly deciding which products survive field review. Field credibility earned by third parties beats any laboratory claim. That signal is scarce.
Gross Margin: 42% to 54%

Basic Activated Carbon Bottles

The strategic watch-out. Identical media across the field, no pathogen performance at all, and terminology now attracting advertising scrutiny. The ten-point range reflects sourcing and channel position, with nothing else defending it. Taste improvement is genuinely real and pathogen protection is completely absent from it.
Gross Margin: 24% to 34%

How This Demand Repeats

The consumable is where this category's economics should sit and largely does not. A filter has a rated capacity and reaches it whether or not anybody notices, and with 8% of products indicating exhaustion and 23% of owners replacing on schedule, most of that revenue never arrives. Manufacturers have effectively designed a razor without a blade sale, and then wondered why unit economics look thin relative to household filtration.
Replacement behaviour differs sharply by use case. A daily domestic user in a market with intermittent supply reaches rated capacity in weeks and notices flow dropping, which prompts a purchase even without indication. An occasional traveller uses a bottle a few times a year, never reaches capacity, and stores a damp filter between trips, which is exactly the condition that produces the biofilm findings.

The buyer is shifting toward people who have read what each technology removes, particularly in outdoor and travel channels where the distinction matters and misinformation gets corrected publicly. That buyer asks about certification and about end-of-life indication, and a manufacturer with neither is answering a different question. Domestic urban buyers in Asia are not yet asking, and increasingly will.
water-purifier-bottle-market-end-use-penetration-index-1790019301153

Where This Market Rewards

These are among the four positions where our research anticipates prominent divergence between winners and laggards over the coming forecast period. Each is grounded in the demand model, the regulatory perimeter, and the announced capacity pipeline.
01 / END OF LIFE INDICATION

A spent filter still passes water

Only about 8% of products carry any end-of-life indication and 23% of owners replace at the specified interval, which leaves consumable revenue unrealised and users unprotected at the same time. Manufacturers fitting volume counters, colour-change media, or flow restriction that stops the bottle rather than letting it degrade report consumable revenue 2.8 times higher per unit sold. The component cost is small against the recurring revenue it creates for the manufacturer, and the industry has effectively designed a razor without ever selling anybody a blade.
02 / TERMINOLOGY CLARITY DISCIPLINE

Say which word applies here

Around 19% of category volume achieves the virus reduction the word purifier implies, while packaging across the field treats filter and purifier as interchangeable descriptions of the same thing. Manufacturers stating the distinction plainly, with the organism classes each product handles, report return rates 2.2 times lower and materially better review sentiment. Buyers who understand what they bought do not feel misled when the product performs exactly as designed, and stating organism classes is more useful than a percentage, since it tells a buyer where to use it.
03 / BIOFILM HOUSING DESIGN

Some get dirtier with use

About 17% of used units show microbial growth within the housing or filter, because damp media held at ambient temperature between uses is a perfectly workable growth substrate. Manufacturers designing drying-friendly geometry, adding antimicrobial media, and giving explicit handling guidance report contamination rates 3.4 times lower in field testing. Solving it costs housing geometry rather than any new technology, which makes the widespread omission difficult to justify, and occasional users storing damp filters carry the highest exposure rather than the lowest.
04 / INDEPENDENT CERTIFICATION POSITION

Nobody can check a claim

Only about 34% of products hold third-party performance certification, so a consumer in a shop cannot distinguish independently verified performance from a manufacturer's own laboratory figure on a box. Manufacturers holding recognised certification report price realisation 1.9 times higher in outdoor and travel channels where buyers actually ask. Certification costs a fraction of a product development budget, and its absence makes good products compete against unverified claims, and outdoor and travel buyers ask the question directly while mass retail buyers do not yet.

Engagement Snapshot From the Field

A live engagement with an industry participant carrying material or product regulatory and market exposure ahead of a defining policy shift, showing how our research translates into a defensible multi-year portfolio strategy.
MARKET MINDS ADVISORY · CLIENT ENGAGEMENT SUMMARY
Water Purifier Bottle Producer Strategic Portfolio Review and Transition Roadmap 2026·Investment Scenario on Water Purifier Bottle Exposure Evaluation 2025-26
CLIENT PROFILE
An outdoor equipment brand with water treatment revenue near USD 54 million (client-reported, unverified by MMA) across North America and Western Europe. Return rates on its bottle range had risen for three consecutive years and replacement filter sales sat far below the attach rate the business plan had assumed at launch. No returned unit had been opened or cultured.
STRATEGIC CHALLENGE
The commercial team read the low filter attach rate as a distribution problem and had proposed expanding replacement filter retail placement. Nobody had asked whether owners knew when to replace, and no product in the range carried any indication that a filter had reached its rated capacity. Awareness had never been tested in any market.
MMA APPROACH
MMA coded three years of return reasons and reviews, surveyed owners on replacement behaviour and awareness, cultured a stratified sample of returned units for microbial growth, and modelled outcomes under retail expansion, end-of-life indication, and housing redesign options. Returns were coded by measured cause rather than by the customer's description, so the two datasets could be compared honestly.
KEY FINDINGS
  1. A clear majority of owners did not know their filter had a rated capacity at all, and most had never replaced one in products they had owned for over a year.
  2. Returns coded as reduced flow were overwhelmingly filters at or past rated capacity, which the products had no way of communicating to anybody.
  3. Microbial culture found growth in a meaningful proportion of returned units, concentrated in bottles used occasionally and stored damp between trips. Frequent daily users showed considerably less.
  4. Retail expansion modelling showed placement was not the constraint, because owners with a shop in front of them still did not know they needed a filter.
CLIENT PROFILE
An outdoor equipment brand with water treatment revenue near USD 54 million (client-reported, unverified by MMA) across North America and Western Europe. Return rates on its bottle range had risen for three consecutive years and replacement filter sales sat far below the attach rate the business plan had assumed at launch. No returned unit had been opened or cultured.
STRATEGIC CHALLENGE
The commercial team read the low filter attach rate as a distribution problem and had proposed expanding replacement filter retail placement. Nobody had asked whether owners knew when to replace, and no product in the range carried any indication that a filter had reached its rated capacity. Awareness had never been tested in any market.
MMA APPROACH
MMA coded three years of return reasons and reviews, surveyed owners on replacement behaviour and awareness, cultured a stratified sample of returned units for microbial growth, and modelled outcomes under retail expansion, end-of-life indication, and housing redesign options. Returns were coded by measured cause rather than by the customer's description, so the two datasets could be compared honestly.
KEY FINDINGS
  1. A clear majority of owners did not know their filter had a rated capacity at all, and most had never replaced one in products they had owned for over a year.
  2. Returns coded as reduced flow were overwhelmingly filters at or past rated capacity, which the products had no way of communicating to anybody.
  3. Microbial culture found growth in a meaningful proportion of returned units, concentrated in bottles used occasionally and stored damp between trips. Frequent daily users showed considerably less.
  4. Retail expansion modelling showed placement was not the constraint, because owners with a shop in front of them still did not know they needed a filter.
RECOMMENDED STRATEGY
Phase 1: Phase one: cancel the retail expansion and fit volume-based end-of-life indication that restricts flow across every product in the range. Phase 2: Phase two: redesign housing geometry so the filter and chamber dry between uses, and publish explicit between-trip handling guidance. Publish the guidance on the product itself. Phase 3: Phase three: code returns by measured cause rather than by customer description, across the whole water treatment range. Report both codings to the commercial team quarterly.
OUTCOME
Replacement filter sales rose to several times their prior level within three quarters and flow-related returns fell sharply (client-reported, unverified by MMA). Retail placement was never expanded. Measured cause coding is now standard across the brand's whole equipment portfolio. Microbial findings on returned units fell substantially after the housing redesign shipped.

Frequently Asked Questions

Foundational context covering the market sizes, CAGR, scope, country, region and competition that inform every finding below. This section is provided to cover basics and most often pre-purchase conversations, answered from the MMA Primary Research Dataset.

What is the current size of the Water Purifier Bottle Market?

The market was worth USD 1.3 billion in 2025 and stands at USD 1.4 billion in 2026. Value covers portable bottles with integrated water treatment at manufacturer selling price.

How large will the Water Purifier Bottle Market be by 2036?

MMA forecasts USD 3.2 billion by 2036, an increase of USD 1.8 billion across the forecast period. That represents 2.29 times the 2026 base of USD 1.4 billion.

What is the CAGR for the Water Purifier Bottle Market 2026 to 2036?

The base case compound annual growth rate is 8.6%, with a bull case at 9.8% and a bear case at 7.4%. Historical growth from 2020 to 2025 ran at 7.5%.

Which segment is growing fastest?

UV-C LED sterilising bottles grow at 12.9%, half again the market rate of 8.6%. Ultraviolet dose handles viruses that carbon and most membranes let straight through.

Who are the major companies in the Water Purifier Bottle Market?

LifeStraw, Katadyn Group, Brita Group, Larq and Grayl lead the field. Together they hold only 27% of category revenue, with Chinese manufacturers increasingly selling under their own labels.

Which country is growing fastest?

India grows at 14.6%, because intermittent piped supply means households store water and stored water recontaminates. That makes treatment a daily requirement rather than a travel purchase.

Report Segmentation Architecture

The full report scope spans multiple orthogonal segmentation dimensions, with cross-tabulated demand data provided for each dimension pair. Coverage extends further to regional breakdowns, trend trajectories, and the competitive detail needed to support segment-level decision-making.

By Treatment Technology

  • Activated Carbon Filter Bottles
  • Hollow-Fibre Microfiltration Bottles
  • UV-C LED Sterilising Bottles
  • Ion-Exchange and Resin Filter Bottles
  • Multi-Stage Purifier Bottles
  • Gravity and Squeeze Hybrid Bottles

By End-Use Industry

  • Outdoor and Backcountry Use
  • Travel and International Tourism
  • Daily Urban and Commuter Use
  • Household Point-of-Use Treatment
  • Emergency Preparedness and Disaster Relief
  • Institutional and Humanitarian Deployment

By Commercial Dimension

  • Outdoor Specialist Retail
  • Direct to Consumer Online
  • Mass Grocery and Hypermarket
  • Travel Retail and Airport Channels
  • Institutional and Tender Supply
  • Cross-Border Online Marketplaces

By Region

  • East Asia
  • North America
  • Western Europe
  • South Asia and Pacific
  • Latin America
  • Middle East and Africa
  • Eastern Europe

Scope, Methodology, and Coverage

Every figure in this report is reproducible from documented input assumptions. The scope below maps the historical period, the forecast horizon, the segmentation dimensions, and the countries covered, alongside the underlying primary and qualitative methodology.
Historical Period
2020 to 2025
Forecast Period
2026 to 2036
Base Year
2025 (USD billions; MMA Primary Research Dataset, September 2026)
Market Definition
This market covers portable drinking bottles with integrated water treatment, across activated carbon filter bottles, hollow-fibre microfiltration bottles, UV-C LED sterilising bottles, ion-exchange and resin filter bottles, multi-stage purifier bottles, and gravity and squeeze hybrid bottles. It excludes unfiltered reusable bottles, countertop and under-sink purifiers, gravity bag and backpacking filter systems, water treatment chemicals and tablets, and municipal or industrial treatment equipment.
Quantitative Units
USD billions, revenue at manufacturer selling price
Segmentation Dimensions
Treatment technology, end-use setting, commercial dimension, region
Regions Covered
East Asia, North America, Western Europe, South Asia and Pacific, Latin America, Middle East and Africa, Eastern Europe
Countries Covered
China, Japan, South Korea, Taiwan, India, Indonesia, Bangladesh, Vietnam, Thailand, Philippines, Australia, United States, Canada, Mexico, Germany, France, United Kingdom, Switzerland, Italy, Spain, Netherlands, Poland, Czechia, Brazil, Peru, Colombia, Chile, Saudi Arabia, United Arab Emirates, South Africa
Key Companies Profiled
LifeStraw, Katadyn Group, Brita Group, Larq, Grayl, Sawyer Products, Cascade Designs, Aquasana, Koninklijke Philips, Xiaomi, Panasonic Holdings, Waterdrop, Epic Water Filters, Clearly Filtered, Astrea, Water-to-Go, Purewell, Sagan Life, Ningbo Qianyao, Guangdong Aquapure
Quantitative Methodology
Primary survey, n=3,800 respondents, Q4 2025, six countries; demand-side model with trade association cross-validation
Qualitative Methodology
47 expert interviews, Q4 2025; applied to validate demand model assumptions, identify emerging dynamics, and assess competitive positioning
Report Format
PDF and XLSX data workbook (Word format preview document)
Publisher
Market Minds Advisory
Report Code
MMA-2026-CON-621
Published
September 2026
Contact
sales@marketmindsadvisory.com | www.marketmindsadvisory.com

Purchase the full Water Purifier Bottle Market Report (2026 to 2036).

The full report sizes the water purifier bottle market across six treatment technologies, seven regions, and thirty countries, with forecasts to 2036 under base, bull, and bear cases. It separates volume that achieves virus reduction from volume that does not, measures end-of-life indication and replacement compliance across the field, and reports microbial growth findings in used units. Competitive analysis covers twenty participants evaluated consistently on category revenue, with detailed treatment of ultraviolet dose engineering and certification position. Consumable economics and certification cost by market breadth are analysed throughout. Primary research includes 3,800 survey responses and 47 expert interviews.
Six treatment technologies sized and forecast separately
Twenty participants evaluated on category revenue consistently
Virus capable volume separated from filtration-only volume
End-of-life indication and replacement compliance measured across the field
Microbial growth findings reported from used unit testing
Third-party certification rates assessed by market and channel

Built For The People Who Decide

From boardroom strategy to bench-side execution, this report is read cover-to-cover by leaders shaping the next decade of their industry, turning demand scenarios, market dynamics and valuation benchmarks into decisions.
CXOs/ Presidents/ VPs/ Managers
M&A and Corporate Development
Strategy Teams and R&D Heads
Procurement and Product Directors
Regulatory and Compliance Leaders
Investor Relations and Equity Analysts