Market Minds Advisory
Water and Wastewater Treatment Chemicals Market

Water and Wastewater Treatment Chemicals Market: Specialty Chemistry for Compliance-Driven Water and Wastewater Treatment

Tightening discharge regulations, expanding industrial water reuse mandates, and rising membrane-based treatment adoption are pushing municipal utilities and industrial operators toward specialty coagulants and biocides engineered for stricter compliance across regions.

Lead Analyst

Bilal Shaikh

Published

September 2026

Make Smarter Decisions with Customized Research Insights

Request a free sample report and evaluate market opportunities, growth trends, and competitive dynamics relevant to your business needs.

2025 MARKET VALUE$38.4BMarket Size 2025
2036 FORECAST VALUE$76.0BBase Case , 2026 to 2036
CAGR 2026 TO 20366.4 %Bull 7.7% / Bear 5.2%
INCREMENTAL OPPORTUNITY$35.1BNet 10- year value creation
EXPANSION MULTIPLE1.86x2036 value over 2026 base
Strategic Levers
M&A Pipeline
Regional Outlook
Country Rankings
Competitive Intelligence
Segmental Deep-dive
Call-Us : 91 93563 13602

Executive Snapshot and Market Trajectory

Municipal utilities and industrial dischargers are replacing generic coagulants with engineered specialty chemistries as effluent limits tighten faster than pipe and plant upgrades can keep pace across most regulated markets worldwide, reshaping supplier selection criteria and procurement timelines along the way for buyers everywhere.
Industrial water reuse programmes, semiconductor fabrication expansion, and desalination capacity additions are concentrating demand in membrane-compatible antiscalants and biocides, while municipal budgets constrain volume growth in mature coagulant and flocculant categories across North America and Western Europe simultaneously. Asian municipal build-out and Middle Eastern desalination investment are together absorbing a growing share of specialty chemistry supply, shifting the center of commercial gravity away from legacy Western demand pools that dominated the category for decades.
Competitive intensity centers on formulation chemistry and regulatory approval speed rather than price, since utilities increasingly specify chemistries by discharge permit compatibility. Regional manufacturing scale-up in East Asia and tightening PFAS-related restrictions on legacy chemistries are reshaping which suppliers can bid on new contracts, rewarding formulators who can document compliance pathways ahead of competitors still relying on older chemistries facing eventual regulatory restriction across major jurisdictions worldwide.
Market Definition
This market covers specialty and commodity chemicals formulated for potable water treatment, municipal wastewater treatment, and industrial process water and effluent treatment, including coagulants, flocculants, disinfectants, corrosion and scale inhibitors, pH adjusters, and membrane-specific chemistries. It excludes water treatment equipment, membrane hardware, and digital monitoring platforms sold independently of chemical formulations.
Base Year Value
$38.4B in 2025 (MMA Primary Research Dataset, August 2026)
Forecast Period
2026 to 2036, eleven discrete annual values
CAGR
6.4% base case. Bull 7.7%. Bear 5.2%.
Fastest Growth Segment
Specialty Membrane Treatment Chemicals: 9.8% CAGR
Fastest Growth Country
India: 9.5% CAGR
Fastest Growth Region
South Asia and Pacific: 8.5% CAGR
Largest Region
East Asia: 28% of 2025 global value
Market Leaders
Ecolab, Kemira, SUEZ (Veolia Water Technologies), BASF, and Solenis. Source: MMA Analysis based on company annual reports.
Primary Survey
n=3,800 procurement and R&D decision-makers, Q4 2025, six countries
Methodology
Demand-side build-up, cross-validated against public data, 47 expert interviews

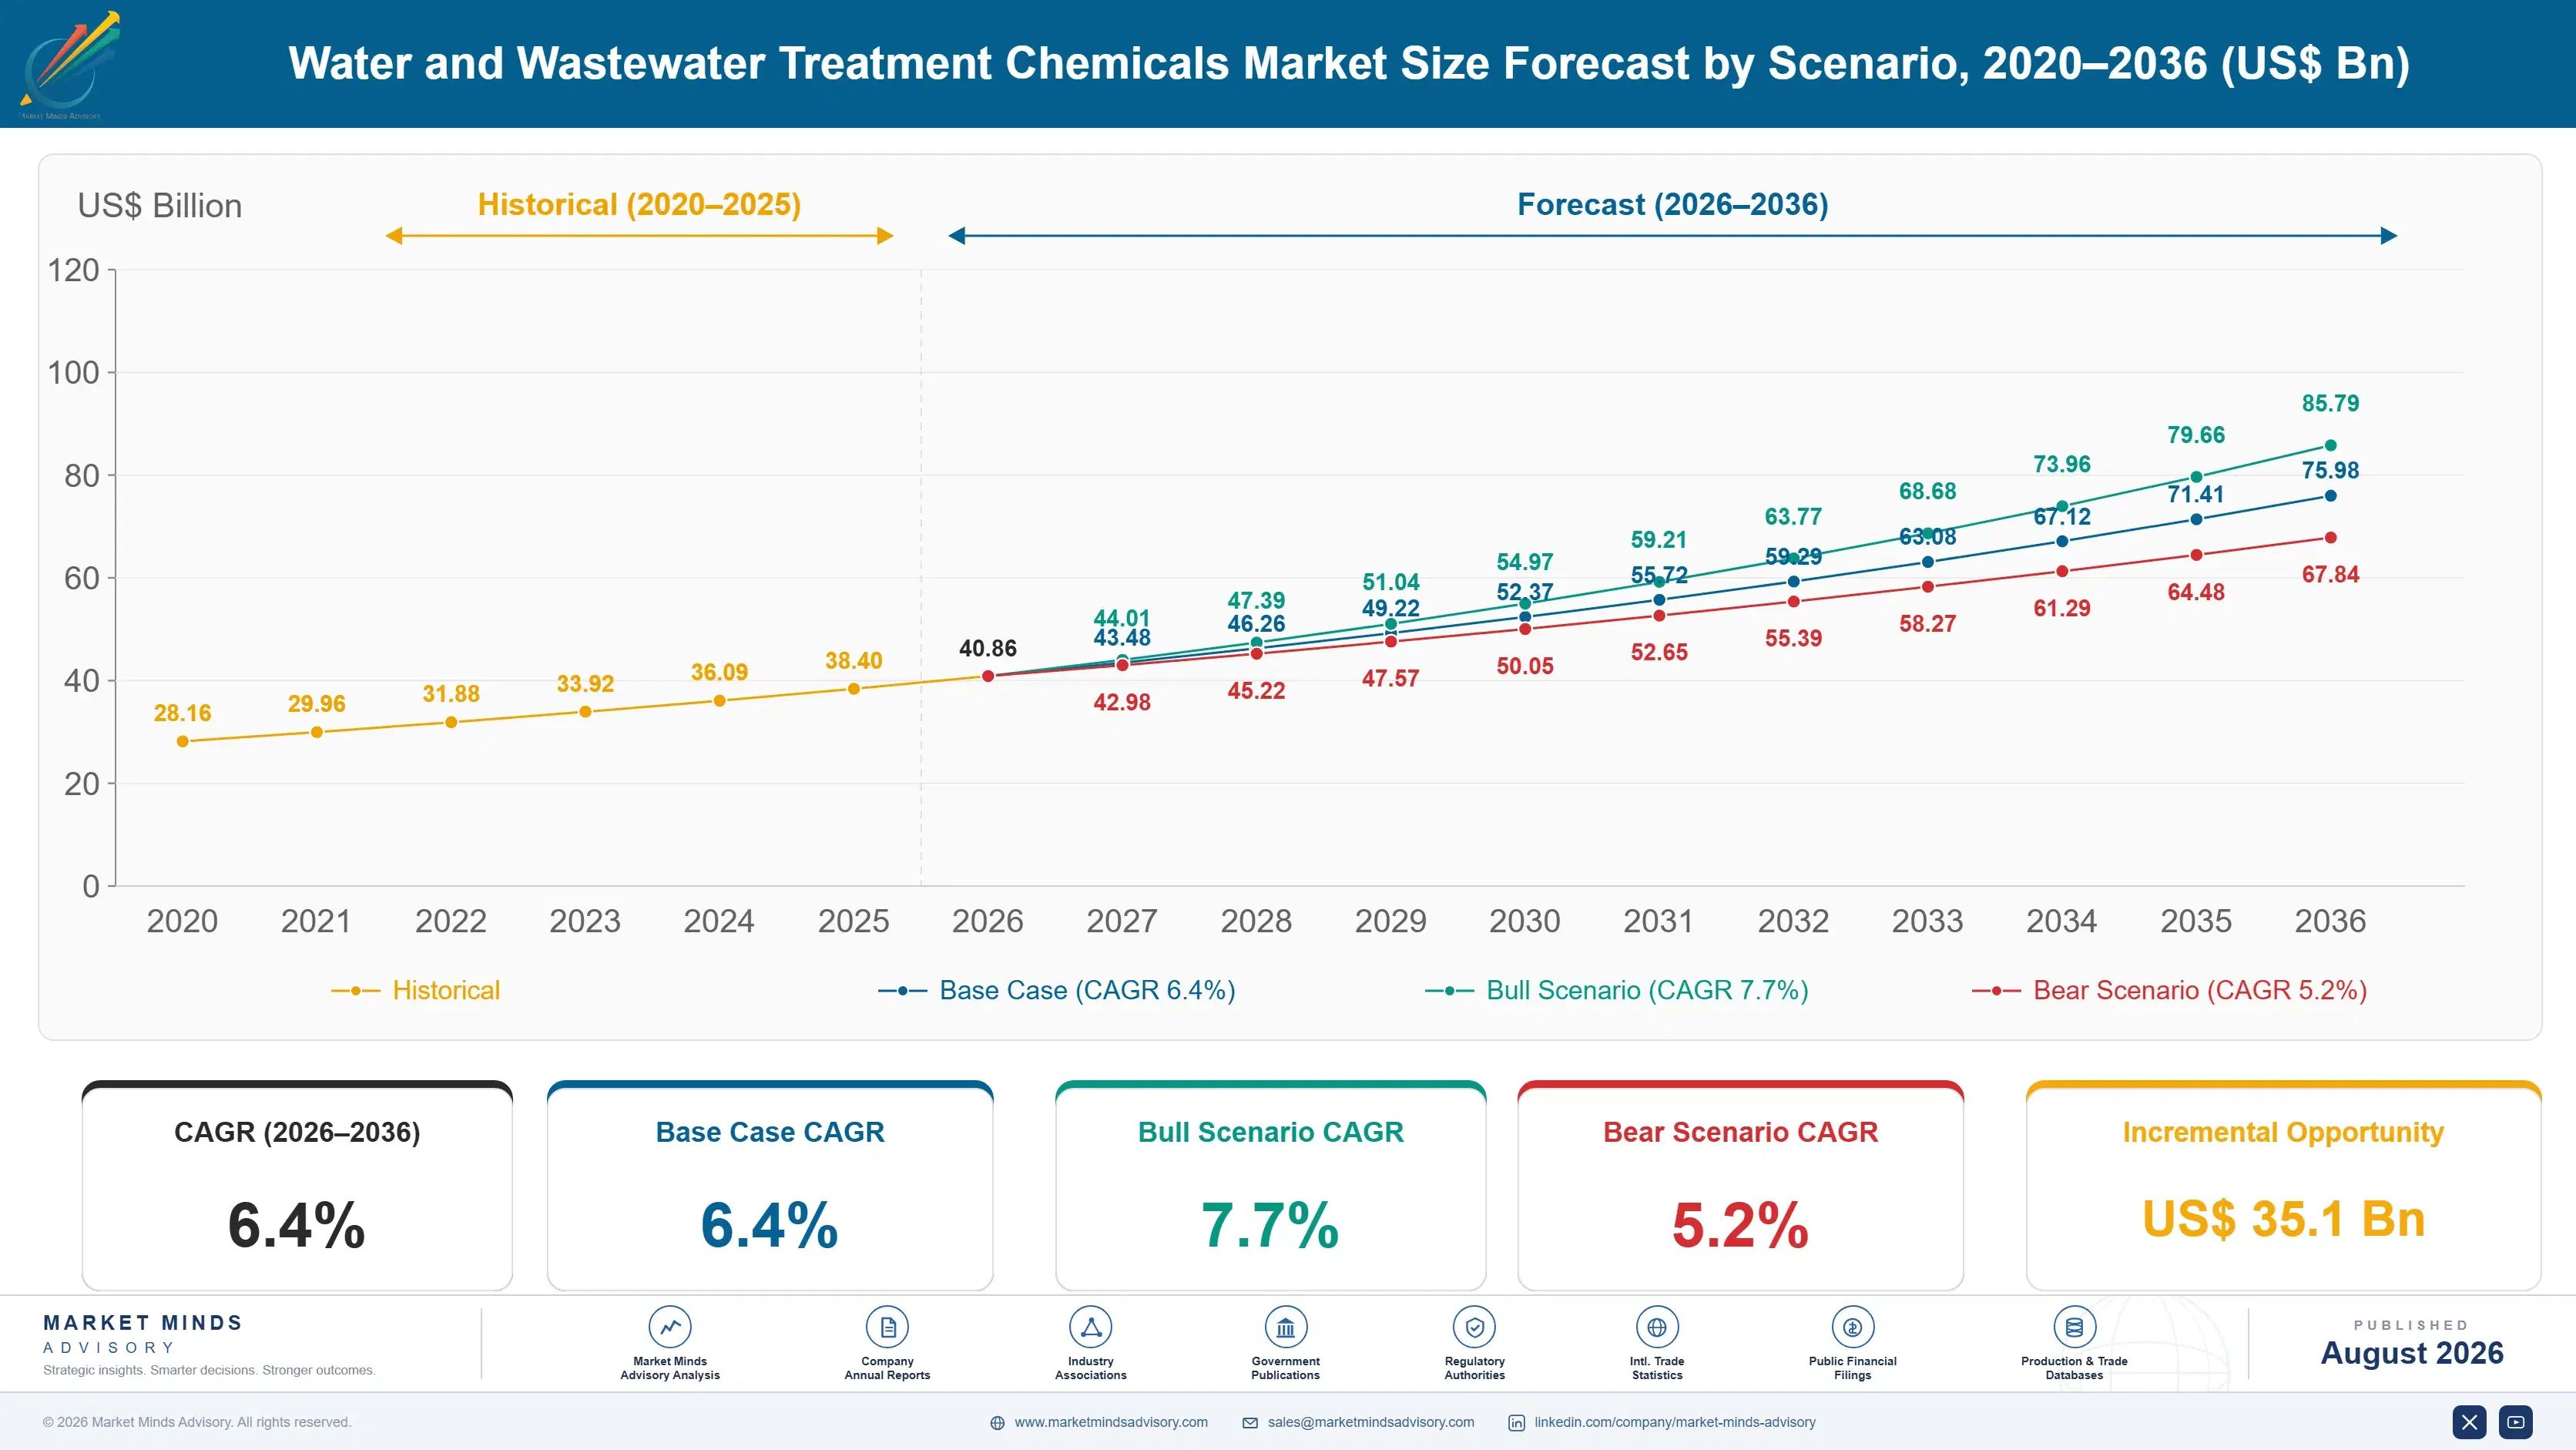
Water and Wastewater Treatment Chemicals Market Forecast Scenarios

water-and-wastewater-treatment-chemicals-size-forecast-scenario-1787310964351
Between 2020 and 2025 the market grew steadily as post-pandemic industrial capacity utilisation recovered and utilities resumed deferred maintenance chemical purchasing, with growth concentrated in Asian municipal infrastructure build-out and North American PFAS remediation pilot programmes gaining early commercial traction across multiple states and provinces during this recovery period, a trajectory implying roughly 5.7% historical annual growth over the period.
The base case assumes continued growth anchored in three commercial mechanisms: mandatory effluent permit renewals forcing chemistry upgrades, semiconductor and data center water reuse installations scaling into full commercial volume, and municipal utilities in South Asia and Southeast Asia commissioning new treatment capacity to meet urban population growth. Together these mechanisms sustain demand even where municipal capital budgets remain constrained, with regulatory deadlines providing a durable floor under specialty chemistry volume growth through the entire forecast period regardless of macroeconomic conditions.
A bull scenario centers on accelerated PFAS phase-out regulation forcing faster-than-expected reformulation cycles across North America and the European Union, lifting specialty chemical volumes sharply. The bear case involves prolonged municipal budget austerity delaying planned plant upgrades, which would push several announced capacity expansions beyond 2030 and dampen near-term specialty chemistry order volumes across affected municipal accounts.

Regulatory Compliance as the Primary Demand Engine

Water scarcity, aging municipal infrastructure, and expanding industrial water reuse obligations are converging to push both public utilities and private manufacturers toward higher-performance treatment chemistries, even where overall water consumption volumes are flat or declining across mature economies. Chemistry specification is becoming a procurement discipline in its own right rather than an afterthought, with dedicated technical teams now involved in decisions once handled by generalist
MARKET CONCENTRATION (CR5)32%moderately fragmented supplier base spanning all major regions
AVERAGE SELLING PRICE TREND+3.1% p.a.specialty chemistries commanding a steady annual pricing premium
TOP PRODUCING REGION SHAREEast Asia, 28%largest manufacturing and consumption base found globally today
CAPACITY UTILISATION78%healthy utilisation levels supporting continued new capital investment
FEEDSTOCK SHARE OF COGS54%petrochemical and mineral inputs dominate total production cost base
MUNICIPAL VS INDUSTRIAL SPLIT58% / 42%municipal demand still exceeds total industrial purchasing volume overall
Commercial activity increasingly rewards suppliers who can demonstrate discharge permit compatibility and regulatory approval speed over suppliers competing purely on unit price, a shift that favors integrated formulators with dedicated regulatory affairs teams and established relationships with environmental agencies across multiple jurisdictions and procurement authorities worldwide. Smaller regional distributors are finding it progressively harder to compete for large municipal and industrial contracts without comparable capability, pushing consolidation across the smaller end of the supplier base.
Over the next decade, PFAS-related restrictions, semiconductor fabrication expansion, and desalination capacity growth in water-stressed regions will determine which chemistry categories capture the fastest incremental revenue pools within this market, separating suppliers who invested early in compliance capability from those still catching up on reformulation timelines and regulatory documentation across their broader product portfolios.
"The chemistry that wins the next contract cycle isn't the cheapest, it's the one that already has the discharge permit paperwork done. Utilities have stopped experimenting."
Director, Industrial Chemicals and Materials Practice · MMA Chemicals and Materi

Market Trends

PFAS Phase-Out Rules Forcing Chemistry Redesign

US EPA's PFAS drinking water standard, finalized with compliance deadlines through 2029, and parallel European Union restrictions under REACH are forcing utilities and industrial dischargers to replace legacy fluorinated surfactants and certain scale inhibitor formulations. Roughly 6,700 US public water systems must demonstrate compliance pathways, creating sustained near-term demand for reformulated coagulant and specialty treatment chemistries that meet the new detection and removal thresholds without relying on restricted fluorinated intermediates across municipal contracts nationwide, a shift already visible in recent procurement tender specifications. Suppliers lacking a documented reformulation roadmap risk losing qualification renewals entirely.
Market Impact: Adds 190 million new connections
Industrial Water Reuse Mandates Expanding Fastest in Semiconductors

Semiconductor fabrication expansion tied to national CHIPS-style incentive programmes across the United States, Japan, and South Korea is driving ultrapure water reuse installations that require specialty membrane-compatible antiscalants and biocides at volumes far exceeding conventional municipal treatment chemistry demand per facility. New fabs commissioned since 2023 typically specify closed-loop water reuse rates above 75%, requiring continuous chemical dosing programmes that did not exist at comparable scale five years ago across most semiconductor manufacturing regions, a shift reshaping supplier qualification requirements industry-wide. Suppliers without dedicated technical service teams struggle to win these high-volume qualification contracts.
Market Impact: Adds 15M m3 daily capacity

Market Opportunities and Growth Drivers

Municipal Infrastructure Renewal Programmes Across South Asia

India's Jal Jeevan Mission and related state-level urban water infrastructure programmes are commissioning new treatment plants at a pace that requires sustained chemical procurement growth well above GDP trend lines. Government capital allocations for water and sanitation infrastructure have risen consistently since 2021, and roughly 190 million rural and peri-urban households are targeted for piped water connections by the late 2020s, each requiring baseline coagulation, disinfection, and corrosion control chemistry that most existing facilities do not yet have installed, creating a large addressable base of first-time chemical buyers. Early distribution relationships let suppliers capture outsized long-term volume.
Market Impact: Delays $890 million planned upgrade

Desalination Capacity Growth Across Water-Stressed Regions

Desalination capacity additions across Saudi Arabia, the United Arab Emirates, and other Middle Eastern markets are creating durable demand for antiscalant and membrane-cleaning chemistries specific to reverse osmosis operations. Regional governments have announced desalination capacity targets exceeding 15 million cubic meters per day by the early 2030s, and each new facility signs multi-year chemical supply contracts that lock in specialty antiscalant volumes well beyond typical municipal coagulant purchasing cycles across comparable freshwater treatment plants operating in less water-stressed regions. Suppliers without regional production presence near these facilities face meaningfully longer delivery lead times and higher logistics costs.
Market Impact: Compresses margins by 3.4 percentag

Market Restraints and Challenges

Municipal Capital Budget Constraints Delaying Plant Upgrades

Many municipal utilities, particularly in Western Europe and parts of North America, face capital budget constraints that delay planned treatment plant upgrades even where regulatory deadlines are approaching. The root cause is aging rate-setting structures that require lengthy public approval processes before utilities can raise water rates to fund capital projects, a process that commonly takes two to four years. Some utilities are pursuing public-private partnership financing and phased compliance extensions from regulators to spread capital outlays across longer timeframes while still meeting minimum interim treatment standards required under current permits.
Market Impact: Adds $2.1 billion reformulation dem

Volatile Petrochemical Feedstock Pricing Compressing Margins

Coagulant and polymer flocculant production depends heavily on petrochemical intermediates whose pricing has grown more volatile since 2022 due to refinery capacity shifts and natural gas price swings in key producing regions. The root cause is thin global capacity buffers for key monomers, leaving suppliers exposed to sharp cost swings that are difficult to pass through immediately under fixed-price municipal contracts. Several producers are exploring feedstock diversification and longer-term hedging arrangements to reduce quarter-to-quarter margin volatility across their specialty coagulant product lines and broader industrial chemistry portfolios. This dynamic increasingly separates vertically integrated producers from smaller spot-market-dependent formulators.
Market Impact: Adds 340 MGD reuse capacity
3 additional market trends, 3 additional growth drivers, and 3 additional restraints and challenges are covered in the full report. Contact sales@marketmindsadvisory.com to access the complete intelligence.

Segment CAGR and Growth Architecture

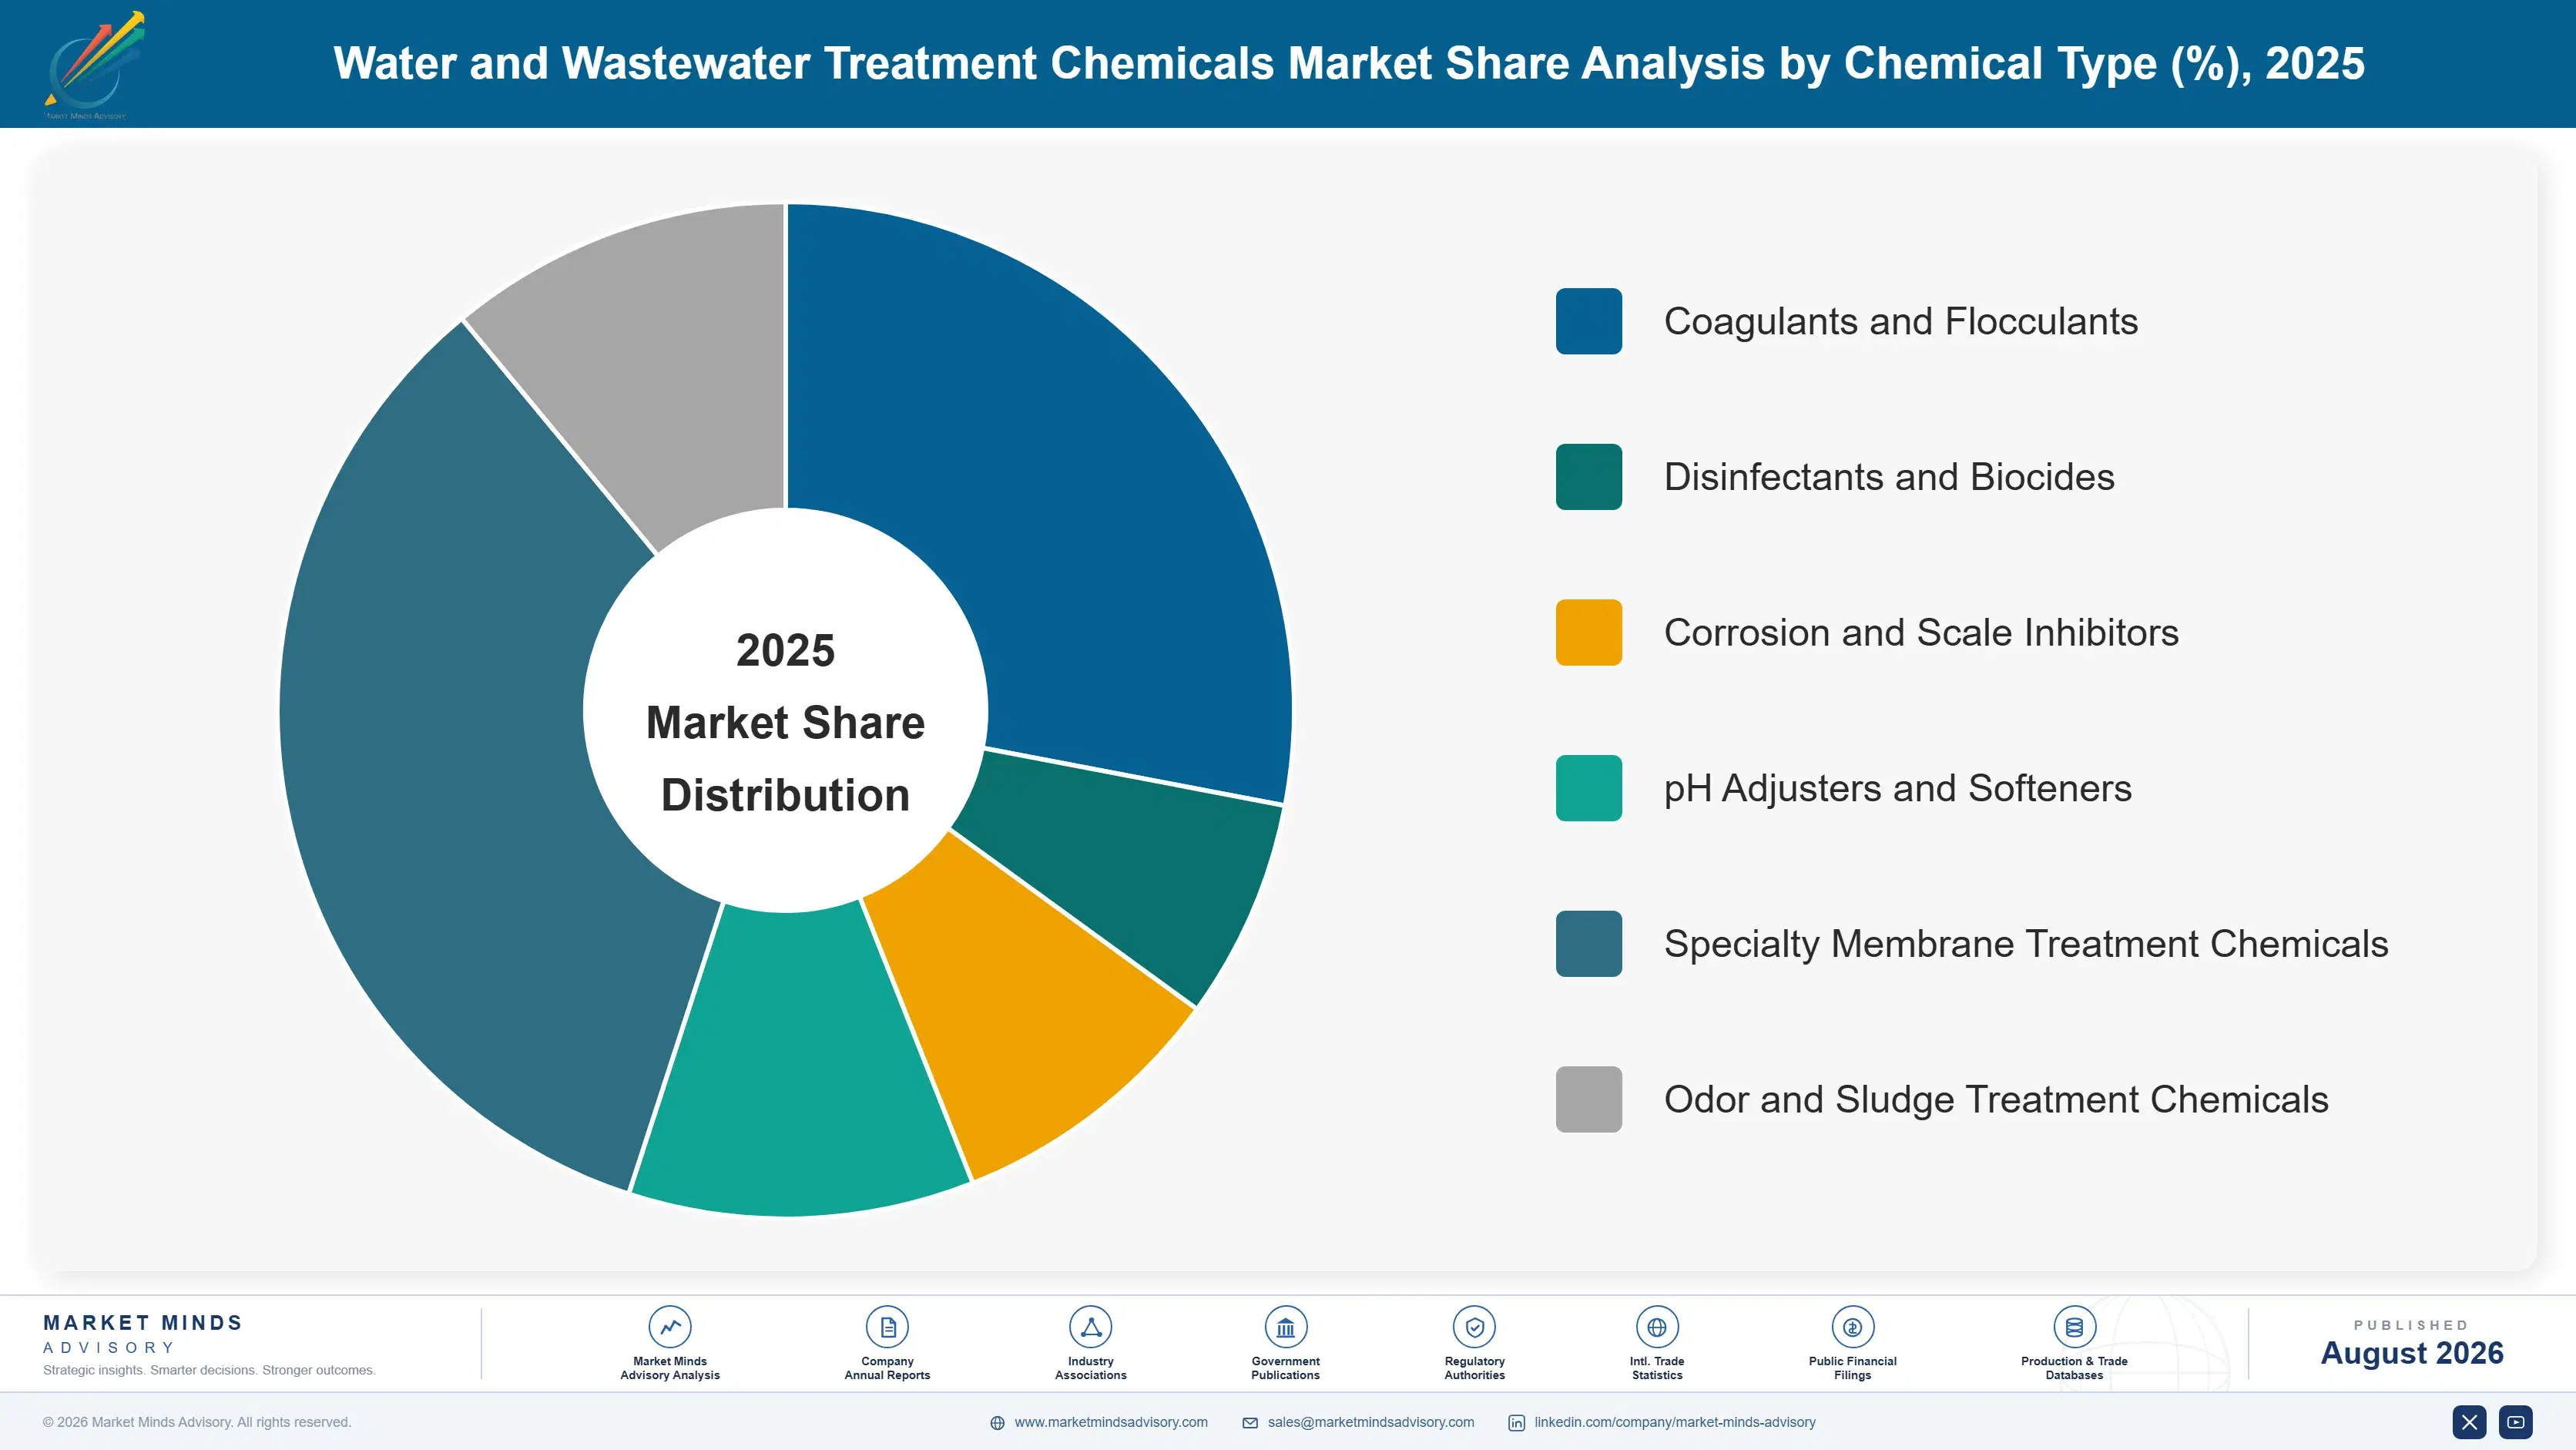
The market is segmented by chemical type, the classification that best reflects how utilities and industrial buyers actually specify and procure treatment chemistry, since purchasing decisions follow discharge permit and process compatibility requirements rather than end-use industry or distribution channel considerations across most contracts, regardless of buyer size, geography, or facility age and vintage.
water-and-wastewater-treatment-chemicals-market-share-analysis-1787310964891

Specialty Membrane Treatment Chemicals

Membrane-compatible antiscalants, biocides, and cleaning chemistries are the fastest-growing category as reverse osmosis desalination and industrial water reuse installations multiply across water-stressed and semiconductor-heavy regions. These chemistries require close compatibility testing with specific membrane materials, creating switching costs that favor incumbent suppliers with established qualification records. Demand is concentrated among desalination plant operators, semiconductor fabricators, and food and beverage processors running high-purity water loops. Pricing runs meaningfully above commodity coagulant chemistry given the formulation complexity and the regulatory testing burden required before a new chemistry can be approved for use in a qualified membrane system, and suppliers with deep technical service teams capture disproportionate share of new facility contracts across every major region.
CAGR 9.8%

Corrosion and Scale Inhibitors

Corrosion and scale inhibitor chemistries are growing quickly as industrial operators extend the service life of aging pipe networks and cooling water systems rather than replace them outright, a cost-driven preference that has intensified since capital costs for infrastructure replacement rose sharply after 2022. Power generation, refining, and heavy manufacturing facilities represent the largest buyer base, each running continuous dosing programmes calibrated to specific water chemistry and metal alloy combinations. Suppliers differentiate through formulation breadth covering diverse water hardness and pH conditions, plus onsite technical support that reduces unplanned downtime from scale buildup or pitting corrosion, both of which carry direct production loss costs that dwarf the chemical spend itself for most industrial buyers.
CAGR 8.1%
Full segment breakdown across 6 segments available in the complete report.

Regional Architecture and Country Demand Map

East Asia leads global demand on the strength of China's industrial and municipal treatment base, while South Asia and the Middle East post the fastest growth, driven respectively by infrastructure build-out and desalination capacity additions across the ten-year forecast period running through 2036 and beyond.

North America

Regulatory deadlines drive most incremental spending across this region. The US EPA's PFAS drinking water rule, with compliance staged through 2029, is forcing several thousand public water systems to qualify new coagulant and adsorption chemistries well ahead of typical replacement cycles. Industrial demand is concentrated in semiconductor fabrication clusters in Arizona, Texas, and New York, where new fabs specify closed-loop water reuse systems requiring continuous antiscalant and biocide dosing. Canadian demand grows more slowly, tracking municipal infrastructure renewal in Ontario and Quebec. Utilities across both countries increasingly favor suppliers who can document full regulatory compliance pathways rather than compete purely on unit chemical pricing, a shift that rewards larger integrated formulators with established regulatory affairs capability.
Share: 24% | CAGR: 6.0% (2026 to 2036)

Western Europe

Western Europe's growth trails the global average because its municipal treatment infrastructure is already largely built out, shifting demand toward chemistry upgrades rather than new capacity. REACH-driven restrictions on certain fluorinated and other legacy chemistries are forcing reformulation across Germany, France, and the Benelux countries, where utilities must qualify replacement chemistries against strict discharge permit standards. Industrial demand concentrates in Germany's chemical manufacturing belt and Rotterdam's petrochemical corridor, both requiring specialty corrosion inhibitors for process water loops. Southern European markets including Spain and Italy show relatively stronger growth tied to expanding desalination and water reuse projects addressing chronic regional water stress in agricultural and coastal tourism areas. Nordic markets round out regional demand with steady replacement chemistry purchasing tied to.
Share: 20% | CAGR: 4.9% (2026 to 2036)
Regional intelligence for 5 additional markets available in the complete report: East Asia, South Asia and Pacific, Latin America, Middle East and Africa, Eastern Europe. Contact sales@marketmindsadvisory.com.
water-and-wastewater-treatment-chemicals-country-cagr-analysis-1787310965415

Converting Regulatory Complexity Into Margin Advantage

Suppliers that treat regulatory compliance as a service rather than a cost center are capturing disproportionate share of new contracts across most regions studied. The levers below outline where formulation depth, technical service, and geographic proximity translate most directly into premium pricing and durable customer relationships across municipal and industrial accounts of every size and contract duration.

Bundling Regulatory Documentation With Chemistry Supply

Suppliers who pre-package discharge permit compliance documentation alongside their chemistry offering reduce a utility's internal regulatory workload substantially, creating a service advantage that pure commodity suppliers cannot match. This approach has let leading formulators command price premiums of 8 to 12% above standard coagulant pricing on municipal contracts requiring PFAS-related reformulation, since utilities value the reduced approval timeline and lower internal compliance burden more than marginal per-unit chemical cost differences across comparable product specifications. Utilities weigh reduced internal workload heavily when comparing otherwise similar chemistry bids from competing suppliers. Renewal talks now favor suppliers who quantify this time savings clearly.
Market Impact: Adds 8 to 12% pricing premium on ne

Expanding Technical Service Teams for Membrane Chemistry

Suppliers investing in dedicated field technical service teams for membrane-compatible chemistries are winning disproportionate share of new desalination and semiconductor reuse contracts, since these installations require ongoing dosing calibration that generic distributors cannot provide. Companies with established technical service capability report contract renewal rates above 90% on membrane chemistry accounts, compared to notably lower renewal rates among suppliers competing purely on unit price without dedicated onsite support capability across comparable facility types. This service-driven retention advantage compounds over multiple contract cycles as switching costs continue rising. Suppliers lacking this capability increasingly lose bids even at comparable base chemistry pricing levels.
Market Impact: Lifts contract renewal rates above

Localizing Production Near Fast-Growing Demand Clusters

Building regional blending and formulation capacity near semiconductor fabrication clusters and desalination hubs reduces logistics costs and delivery lead times, which matters disproportionately for chemistries requiring frequent replenishment. Suppliers with regional production announced capacity investments exceeding $400 million across new facilities near major fab clusters since 2023, positioning themselves to capture reuse chemistry demand before competitors without local manufacturing presence can establish comparable delivery reliability and shorter response times for urgent orders. Competitors without comparable regional footprint increasingly struggle to match delivery reliability on time-sensitive reuse contracts. New facility announcements give suppliers only a narrow window to build qualified capacity.
Market Impact: Requires roughly $400 million in ne

Developing PFAS-Free Reformulations Ahead of Deadlines

Suppliers who reformulate legacy fluorinated chemistries ahead of regulatory deadlines, rather than waiting for final compliance dates, are securing early qualification slots with utilities that must demonstrate compliance pathways well before 2029. Early movers have captured qualification approvals covering roughly 1,200 public water systems already, locking in multi-year supply relationships before slower competitors can complete their own reformulation and regulatory approval processes across comparable municipal accounts nationwide. This early positioning advantage compounds as remaining utilities rush to qualify suppliers closer to the deadline. Utilities value proven track records over promised future compliance capability when evaluating new supplier bids.
Market Impact: Secures roughly 1,200 early supplie

Who Controls the Margin Pool

This market carries moderate concentration, with the top five suppliers holding roughly 32% combined share on a revenue basis, leaving a long tail of regional formulators and distributors that compete mainly on price and local service responsiveness rather than chemistry innovation. The gap between the leading formulators and mid-tier challengers has widened as regulatory compliance capability becomes a harder barrier to replicate quickly. Smaller players increasingly seek acquisition rather tha
Current competitive activity centers on three dimensions: reformulating legacy fluorinated chemistries ahead of regulatory deadlines, expanding regional production capacity near fast-growing demand clusters in semiconductor manufacturing and desalination, and building digital dosing and monitoring services that bundle chemistry supply with ongoing technical support contracts. Suppliers pursuing all three simultaneously are pulling ahead of narrower competitors.

Emerging pressure comes from Asian regional formulators scaling production to serve domestic municipal and industrial demand at lower cost than multinational suppliers, gradually eroding share in commodity coagulant categories while multinational leaders retreat toward higher-margin specialty membrane and PFAS-compliant chemistry segments where technical differentiation still commands premium pricing. Rankings within the commodity tier are shifting fastest. Laggards risk ceding commodity volume to lower-cost regional rivals.
water-and-wastewater-treatment-chemicals-company-positioning-matrix-1787310965935

Competitive Moat and Risk Dimensions

ECOLAB

Moat: Integrated Service Model

Ecolab pairs its chemistry portfolio with an extensive field technical service network and digital dosing monitoring platforms, creating switching costs that pure chemistry suppliers cannot replicate easily. Its scale across industrial accounts gives it cross-selling access that smaller regional formulators generally lack today. Few competitors can match this combined breadth of service and chemistry depth at comparable scale.
ECOLAB

Risk: Slower Regional Price Response

Ecolab's premium-service business model leaves it comparatively slower to respond to aggressive price competition from regional Asian formulators in commodity coagulant categories, where technical service value is less differentiated. This exposes it to gradual share erosion in price-sensitive municipal contracts across developing markets where budget constraints outweigh the value of bundled technical service offerings.
KEMIRA

Moat: Deep Municipal Relationships

Kemira's decades-long focus on municipal water treatment chemistry gives it qualification records and long-standing procurement relationships with utilities across Europe and North America that newer entrants cannot quickly replicate. Its specialized coagulant and flocculant formulation expertise, combined with established regulatory affairs capability, positions it favorably for PFAS-related reformulation contracts requiring proven compliance track records across comparable jurisdictions.
KEMIRA

Risk: Limited Industrial Diversification

Kemira's relatively narrower exposure to fast-growing industrial categories like semiconductor water reuse and desalination antiscalants, compared to more diversified competitors, leaves it more dependent on municipal budget cycles that can be volatile and slower-growing than industrial demand, potentially constraining its ability to capture the fastest-growing revenue pools within this market over the coming decade.

Players Tracked

Prominent Players

Ecolab
Kemira
SUEZ (Veolia Water Technologies)
BASF
Solenis

Other Key Players

Kurita Water Industries
Suez Environnement
Feralco
SNF Group
Aditya Birla Chemicals
Thermax
Ion Exchange India
Lonza
Buckman Laboratories
Chembond Chemicals
GE Water (Veolia)
Xylem
AkzoNobel Specialty Chemicals
Solvay
Cabot Corporation

Recent Developments

MARCH 2026

Ecolab Expands PFAS-Free Coagulant Production

Ecolab commissioned a new specialty coagulant production line dedicated to PFAS-free formulations at its existing US manufacturing site, targeting municipal utilities facing the 2029 EPA compliance deadline. The expansion adds meaningful capacity aimed at replacement contracts for legacy fluorinated chemistry across several thousand public water systems.
Signal: PFAS reformulation capacity is quickly bec
SEPTEMBER 2025

Kemira Signs Long-Term Supply Agreement With Nordic Utility Group

Kemira signed a multi-year chemical supply agreement with a consortium of Nordic municipal utilities covering coagulant and disinfectant chemistry across several dozen treatment facilities. The agreement was a long-term supply contract, not an acquisition or joint venture, and includes provisions for future joint reformulation work.
Signal: Long-term supply agreements are steadily r
JANUARY 2026

SNF Group Acquires Specialty Flocculant Producer in Southeast Asia

SNF Group completed the acquisition of a mid-sized Southeast Asian flocculant producer, gaining regional manufacturing capacity to serve growing municipal and industrial demand across Vietnam, Indonesia, and Thailand. The transaction was structured as a full acquisition rather than a joint venture or minority equity stake in the target company.
Signal: Acquisitions of regional producers are acc

Petrochemical and Mineral Feedstock Exposure

Petrochemical intermediates including acrylamide monomer and aluminum-based coagulant precursors together represent roughly 54% of production cost of goods sold, with the remainder split across energy, packaging, and labor. Most acrylamide monomer supply originates from a concentrated set of Asian and North American petrochemical producers, creating exposure to regional feedstock disruptions. Aluminum-based precursor pricing has shown less volatility than organic monomer inputs recently.
Natural gas price spikes across Europe following supply disruptions in 2022 drove sharp increases in ammonia and downstream nitrogen-based flocculant input costs, a volatility event documented in the IEA's European gas market reports. Several European producers temporarily curtailed production during the peak of that period, tightening regional flocculant supply and lifting spot prices well above longer-term contract pricing for several consecutive quarters. Several producers reported multi-quarter margin compression directly tied to this feedstock disruption in their annual filings.

This exposure disadvantages smaller regional formulators lacking long-term feedstock hedging arrangements or vertically integrated production, since they must pass through input cost spikes immediately or absorb margin compression. Larger integrated producers with diversified feedstock sourcing and multi-year supply contracts weather volatility more smoothly, widening the competitive gap during disruption. Spot-market-dependent producers face the sharpest earnings volatility of all.
water-and-wastewater-treatment-chemicals-cost-volatility-analysis-1787310966132

Diversifying Acrylamide Monomer Sourcing Across Regions

Leading producers are qualifying secondary acrylamide suppliers across multiple regions to reduce dependence on any single feedstock source. This diversification effort has reduced average feedstock lead time volatility for several major coagulant and flocculant manufacturers over the past two years across comparable production facilities. This also shortens qualification timelines when a primary supplier faces disruption.

Locking Multi-Year Natural Gas Supply Contracts

Nitrogen-based flocculant producers exposed to natural gas as a feedstock input are locking multi-year supply contracts at fixed or collared pricing to shield production economics from spot market volatility. This approach has helped several European producers avoid the sharpest cost spikes experienced by spot-market-dependent competitors during recent gas price disruptions. Fixed pricing also simplifies budgeting for multi-year municipal contracts.

Shifting Toward Bio-Based Coagulant Alternatives

Several producers are investing in bio-based coagulant and flocculant chemistries derived from renewable feedstocks, reducing exposure to petrochemical price swings while also addressing growing customer preference for lower-carbon treatment chemistry options. Early commercial volumes remain modest but are growing steadily across municipal pilot programmes testing these alternative formulations. Regulatory incentives in several jurisdictions are improving the economics of these formulations.

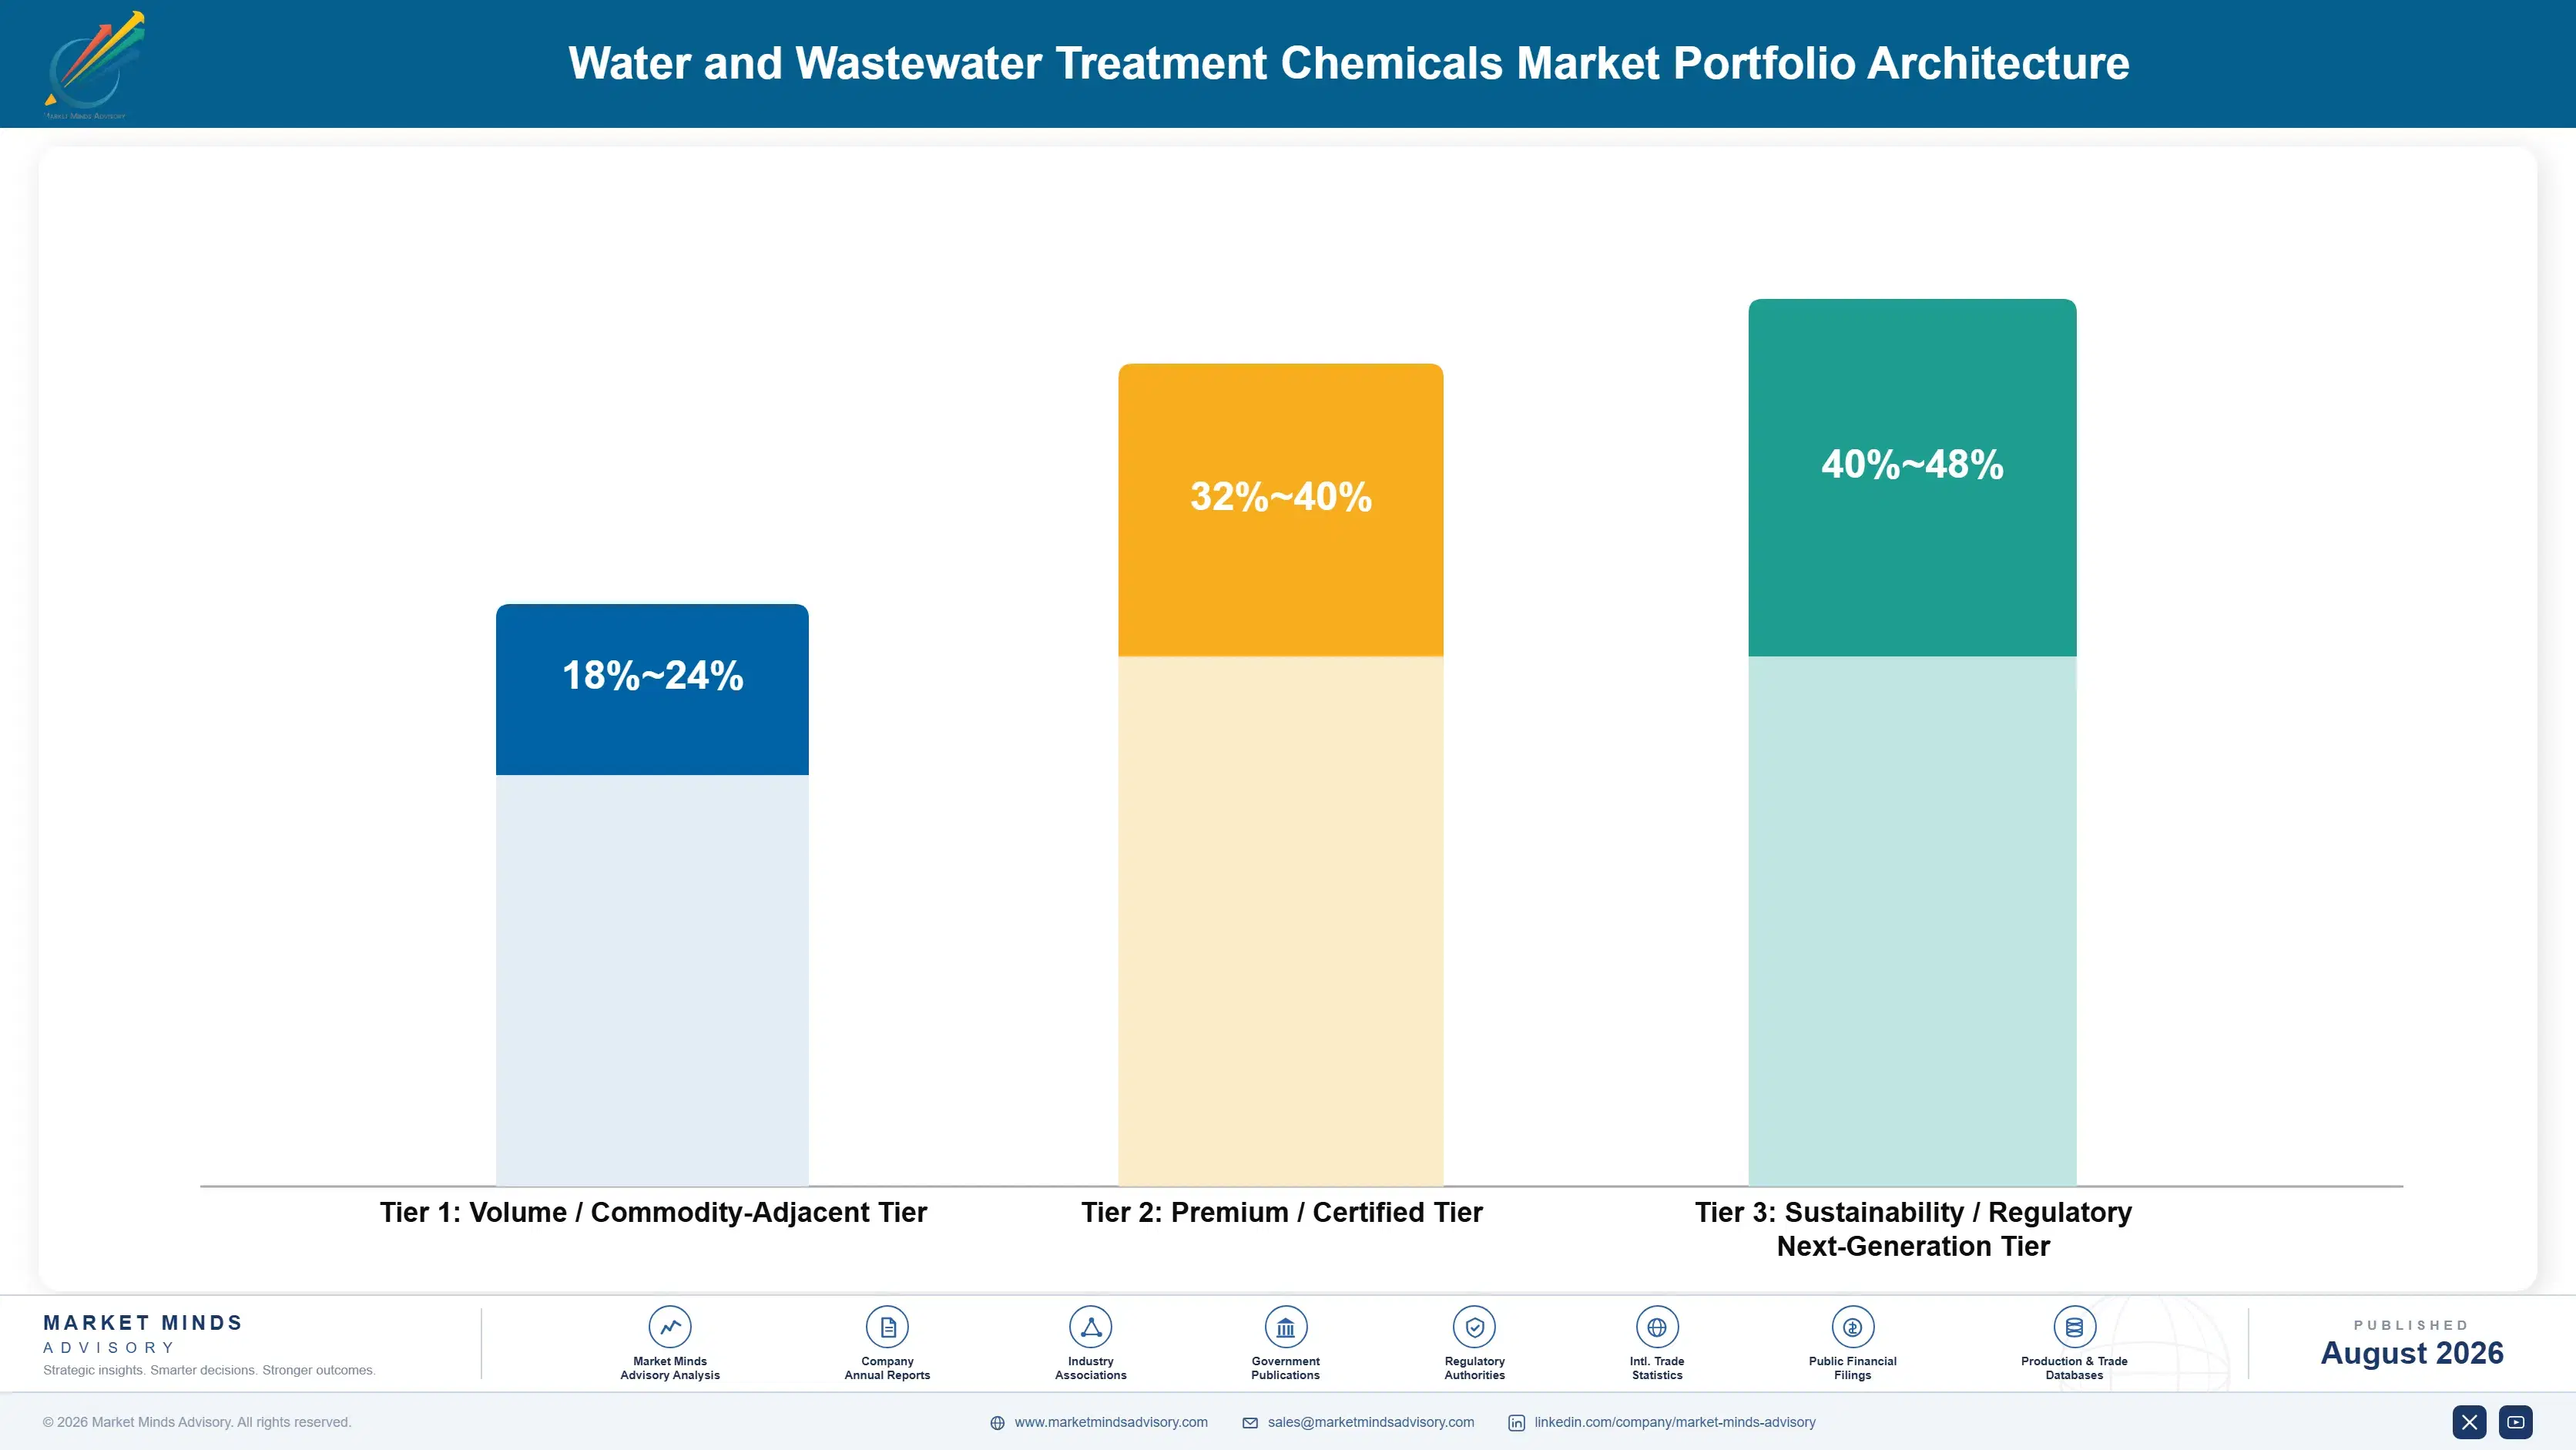
Portfolio Architecture for Margin Defence

Portfolio economics split across three tiers. Volume commodity-adjacent coagulants and flocculants carry thin margins driven by feedstock cost pass-through, while premium certified chemistries qualified for specific membrane systems or regulatory compliance programmes command meaningfully higher gross margins reflecting formulation complexity and switching costs built up over years of qualification testing and regulatory approval work.
The tension between volume and premium positioning defines supplier strategy. Commodity coagulant volume remains large but slow-growing and price-competitive, while premium PFAS-compliant and membrane-specific chemistries represent a smaller but much faster-growing and higher-margin pool that rewards suppliers with dedicated regulatory and technical service capability, forcing most large suppliers to run genuinely distinct commercial playbooks for each tier of their combined product portfolio. Very few suppliers execute both playbooks equally well at scale.

High-value margin pools concentrate specifically in membrane-compatible antiscalants, PFAS-free reformulated coagulants, and specialty biocides for semiconductor and desalination applications, where technical differentiation and regulatory approval barriers remain highest relative to commodity treatment chemistry categories. Suppliers that fail to build a credible position in at least one of these pools risk being squeezed from both directions as commodity margins compress further.

Volume / Commodity-Adjacent Tier

Standard coagulants and flocculants sold mainly on price to municipal and light industrial buyers, carrying thin, feedstock-sensitive margins and facing steady competitive pressure from lower-cost regional producers across most established markets.
Gross Margin: 18-24%

Premium / Certified Tier

Membrane-qualified antiscalants and disinfectants requiring formal compatibility testing and regulatory approval before use, commanding steadier premium pricing and benefiting from meaningful switching costs once a chemistry is qualified on a given system.
Gross Margin: 32-40%

Sustainability / Regulatory / Next-Generation Tier

PFAS-free reformulations and bio-based chemistries capturing early-mover regulatory compliance premiums ahead of mandatory deadlines, representing the fastest-growing tier even though absolute volumes remain smaller than the two more established tiers today.
Gross Margin: 40-48%
water-and-wastewater-treatment-chemicals-portfolio-architecture-1787310966625

High-value Sub-segments and Strategic Watch-out

Semiconductor Reuse Antiscalants

Highest-value, fastest-growing pool tied directly to semiconductor fab expansion, commanding premium pricing on technical differentiation and dedicated onsite service contracts across facilities requiring continuous ultrapure water reuse dosing programmes and rapid technical response. Contracts here typically run several years and carry the highest switching costs in the entire portfolio.
Gross Margin: 42-50%

Desalination Membrane Chemistry

High-value pool growing steadily alongside Middle Eastern and other desalination capacity additions, anchored in multi-year supply contracts with predictable renewal economics and comparatively lower customer acquisition costs once a supplier is initially qualified. Political and financing risk around large state-backed desalination projects remains the primary watch item for this segment.
Gross Margin: 38-45%

Municipal Coagulants and Flocculants

Largest volume core segment, price-competitive and feedstock-exposed, generating steady but comparatively low-margin revenue across mature municipal treatment contracts that still represent the majority of total industry chemical volume shipped each year globally. Consolidation pressure here is intensifying as regional low-cost producers expand capacity faster than demand growth.
Gross Margin: 18-24%

Legacy Fluorinated Chemistries

Strategic watch-out segment facing accelerating regulatory phase-out; suppliers still dependent on these product lines face shrinking addressable volume through the decade unless they complete reformulation work ahead of the tightening compliance deadlines now approaching. Suppliers that delay reformulation risk losing municipal qualification status entirely once compliance enforcement tightens further.
Gross Margin: 15-20%

Contract Renewal Economics and Compliance Cycles

Municipal and industrial treatment chemistry demand behaves like an annuity once a supplier is qualified on a given system, since switching suppliers requires re-validating chemistry compatibility against discharge permits, a process most utilities avoid unless forced by cost or performance failures that threaten continued compliance with their operating permits and broader environmental obligations to state and federal regulators.
Adoption stickiness varies meaningfully by end-use vertical. Semiconductor and pharmaceutical manufacturers show the deepest stickiness given strict process water specifications that make requalifying a new chemistry costly and time-consuming, while municipal utilities show moderate stickiness constrained by periodic competitive tendering requirements, and general industrial buyers show the least stickiness, frequently switching suppliers when short-term price differentials widen beyond typical contract thresholds set during the initial supplier qualification process.

A generational shift in buyer profiles is underway as utility procurement teams increasingly include dedicated regulatory compliance specialists rather than relying solely on operations staff, changing how suppliers must present technical and regulatory documentation during the qualification and renewal process across most large accounts and long-standing municipal relationships built over many years of continuous chemical supply and joint compliance planning.
water-and-wastewater-treatment-chemicals-end-use-penetration-index-1787310967115

Where Compliance Speed Beats Price

These are among the four positions where our research anticipates prominent divergence between winners and laggards over the coming forecast period. Each is grounded in the demand model, the regulatory perimeter, and the announced capacity pipeline.
01 / REGULATORY COMPLIANCE POSITIONING

Prioritize PFAS-free reformulation ahead of 2029 compliance deadlines

Suppliers who complete PFAS-free reformulation and secure early regulatory qualification before competitors will capture a disproportionate share of the roughly 6,700 US public water systems needing compliance pathways well before the 2029 EPA deadline. Waiting until the deadline approaches risks losing qualification slots to faster-moving competitors who have already built the necessary compliance track record across comparable municipal jurisdictions. Early movers can also charge modest premiums for documented compliance readiness that slower, less-prepared competitors cannot yet offer their municipal customers.
02 / GEOGRAPHIC CAPACITY EXPANSION

Build regional production capacity near semiconductor and desalination clusters

Localizing blending and formulation capacity near semiconductor fabrication clusters and desalination hubs reduces delivery lead times for chemistries requiring frequent replenishment, a meaningful competitive advantage over distant suppliers relying on longer, less predictable shipping routes. This positioning matters most in fast-growing regions like South Asia, Southeast Asia, and the Middle East, where new facility commissioning is outpacing existing regional chemical distribution infrastructure. Suppliers without local capacity risk losing contracts to regional formulators who can guarantee faster, more reliable delivery timelines.
03 / TECHNICAL SERVICE BUNDLING

Pair chemistry supply with dedicated technical service to defend renewal rates

Bundling technical service and digital dosing monitoring with chemistry supply creates switching costs that pure commodity suppliers cannot replicate, defending renewal rates above 90% on accounts with dedicated support and long-standing technical relationships. This approach matters most for membrane-compatible chemistries requiring ongoing calibration, where generic distributors lack the technical depth to compete effectively on equal footing. Suppliers without comparable service capability should expect gradual share erosion in accounts where competitors already offer bundled technical support at broadly comparable pricing levels.
04 / PORTFOLIO CAPITAL REBALANCING

Shift capital away from commodity coagulants toward specialty membrane chemistry

Commodity coagulant and flocculant categories face thinning margins from feedstock volatility and regional price competition, while specialty membrane and PFAS-compliant chemistries offer substantially higher and more durable margins across most facility types. Suppliers should redirect capital expenditure toward specialty production capacity and technical service capability rather than defending commodity volume share against lower-cost regional competitors undercutting largely on price alone. This rebalancing protects long-term profitability even if it means accepting some gradual commodity volume share loss in the nearer term.

Engagement Snapshot From the Field

A live engagement with an industry participant carrying material or product regulatory and market exposure ahead of a defining policy shift, showing how our research translates into a defensible multi-year portfolio strategy.
MARKET MINDS ADVISORY · CLIENT ENGAGEMENT SUMMARY
Water and Wastewater Treatment Chemicals Producer Strategic Portfolio Review and Transition Roadmap 2026·Investment Scenario on Water and Wastewater Treatment Chemicals Exposure Evaluation 2025-26
CLIENT PROFILE
The client is a regional municipal water utility group serving several mid-sized cities across the US Midwest, operating a combined treatment capacity in the range of 180 million gallons per day (client-reported, unverified by MMA). The utility group faced upcoming PFAS compliance deadlines across multiple treatment facilities and sought an independent chemistry supplier evaluation ahead of a multi-year procurement decision covering coagulant and specialty adsorption chemistry contracts.
STRATEGIC CHALLENGE
The utility group needed to select a chemistry supplier capable of delivering PFAS-compliant coagulant reformulations across facilities with varying raw water chemistry, while managing budget constraints that limited how quickly capital-intensive plant modifications could proceed. Existing supplier relationships lacked documented PFAS reformulation track records, creating uncertainty about which vendors could realistically meet compliance timelines.
MMA APPROACH
MMA conducted a comparative supplier capability assessment covering five candidate chemistry suppliers, evaluating regulatory qualification status, technical service capacity, and pricing structure across comparable contract volumes. The engagement included interviews with utility operations staff and review of supplier compliance documentation against the specific discharge permit requirements applicable to each treatment facility in the portfolio.
KEY FINDINGS
  1. Only two of five candidate suppliers had completed PFAS-free reformulation testing applicable to the utility's specific raw water chemistry profile. across all five candidate treatment facilities reviewed.
  2. Bundled technical service offerings reduced projected internal compliance staffing needs by an estimated 30% (client-reported, unverified by MMA). according to internal utility staffing projections.
  3. Price differentials between qualified suppliers narrowed to within 6% once regulatory documentation support was factored into total cost of ownership. once documentation review timelines were included.
  4. Two candidate suppliers lacked sufficient regional production capacity to guarantee delivery timelines matching the utility's compliance deadline schedule. within the utility's required compliance timeframe.
CLIENT PROFILE
The client is a regional municipal water utility group serving several mid-sized cities across the US Midwest, operating a combined treatment capacity in the range of 180 million gallons per day (client-reported, unverified by MMA). The utility group faced upcoming PFAS compliance deadlines across multiple treatment facilities and sought an independent chemistry supplier evaluation ahead of a multi-year procurement decision covering coagulant and specialty adsorption chemistry contracts.
STRATEGIC CHALLENGE
The utility group needed to select a chemistry supplier capable of delivering PFAS-compliant coagulant reformulations across facilities with varying raw water chemistry, while managing budget constraints that limited how quickly capital-intensive plant modifications could proceed. Existing supplier relationships lacked documented PFAS reformulation track records, creating uncertainty about which vendors could realistically meet compliance timelines.
MMA APPROACH
MMA conducted a comparative supplier capability assessment covering five candidate chemistry suppliers, evaluating regulatory qualification status, technical service capacity, and pricing structure across comparable contract volumes. The engagement included interviews with utility operations staff and review of supplier compliance documentation against the specific discharge permit requirements applicable to each treatment facility in the portfolio.
KEY FINDINGS
  1. Only two of five candidate suppliers had completed PFAS-free reformulation testing applicable to the utility's specific raw water chemistry profile. across all five candidate treatment facilities reviewed.
  2. Bundled technical service offerings reduced projected internal compliance staffing needs by an estimated 30% (client-reported, unverified by MMA). according to internal utility staffing projections.
  3. Price differentials between qualified suppliers narrowed to within 6% once regulatory documentation support was factored into total cost of ownership. once documentation review timelines were included.
  4. Two candidate suppliers lacked sufficient regional production capacity to guarantee delivery timelines matching the utility's compliance deadline schedule. within the utility's required compliance timeframe.
RECOMMENDED STRATEGY
Phase 1: Phase 1 (Months 1 to 3): Finalize supplier selection based on documented PFAS reformulation qualification and regional delivery capacity. Include regional delivery capacity as a formal scoring criterion. Phase 2: Phase 2 (Months 4 to 9): Pilot new chemistry across two treatment facilities with the most urgent compliance deadlines and varying raw water profiles. Phase 3: Phase 3 (Months 10 to 18): Scale successful pilot chemistry across remaining facilities while renegotiating multi-year supply pricing terms. Document results for future compliance planning cycles.
OUTCOME
The utility group selected a supplier offering bundled technical service and completed PFAS reformulation qualification across all facilities roughly eight months ahead of the compliance deadline. Estimated annual chemistry procurement costs came in approximately 4% below the prior supplier's pricing once volume commitments were finalized (client-reported, unverified by MMA), while internal compliance documentation workload dropped meaningfully.

Frequently Asked Questions

Foundational context covering the market sizes, CAGR, scope, country, region and competition that inform every finding below. This section is provided to cover basics and most often pre-purchase conversations, answered from the MMA Primary Research Dataset.

What is the current size of the Water and Wastewater Treatment Chemicals Market?

The market is valued at approximately $38.4 billion in 2025. Growth is driven by tightening discharge regulations and expanding industrial water reuse across major manufacturing regions.

How large will the Water and Wastewater Treatment Chemicals Market be by 2036?

The market is projected to reach approximately $75.98 billion by 2036. This reflects sustained demand from regulatory compliance and infrastructure expansion across the forecast period.

What is the CAGR for the Water and Wastewater Treatment Chemicals Market 2026 to 2036?

The market is forecast to grow at a compound annual growth rate of 6.4% between 2026 and 2036. Specialty membrane chemistries are growing considerably faster than the overall market average.

Which segment is growing fastest?

Specialty membrane treatment chemicals are growing fastest at approximately 9.8% CAGR, roughly 1.5 times the overall market rate. Growth is driven by desalination and semiconductor water reuse expansion.

Who are the major companies in the Water and Wastewater Treatment Chemicals Market?

Leading suppliers include Ecolab, Kemira, SUEZ (Veolia Water Technologies), BASF, and Solenis. Together these five hold roughly 32% combined market share, with a long tail of regional formulators making up the remainder.

Which country is growing fastest?

India is the fastest-growing major market at approximately 9.5% CAGR, driven by the Jal Jeevan Mission and related municipal infrastructure programmes. Southeast Asian markets follow closely behind.

Report Segmentation Architecture

The full report scope spans multiple orthogonal segmentation dimensions, with cross-tabulated demand data provided for each dimension pair. Coverage extends further to regional breakdowns, trend trajectories, and the competitive detail needed to support segment-level decision-making.

By Chemical Type

  • Coagulants and Flocculants
  • Disinfectants and Biocides
  • Corrosion and Scale Inhibitors
  • pH Adjusters and Softeners
  • Specialty Membrane Treatment Chemicals
  • Odor and Sludge Treatment Chemicals

By End-Use Industry

  • Municipal Utilities
  • Power Generation
  • Chemicals and Petrochemicals
  • Semiconductors and Electronics
  • Food and Beverage

By Commercial Dimension

  • Direct Utility Contracts
  • Industrial Distribution
  • Bundled Technical Service Agreements
  • Third-Party Distributors

By Region

  • North America
  • Western Europe
  • East Asia
  • South Asia and Pacific
  • Latin America
  • Middle East and Africa
  • Eastern Europe

Scope, Methodology, and Coverage

Every figure in this report is reproducible from documented input assumptions. The scope below maps the historical period, the forecast horizon, the segmentation dimensions, and the countries covered, alongside the underlying primary and qualitative methodology.
Historical Period
2020 to 2025
Forecast Period
2026 to 2036
Base Year
2025 (USD billions; MMA Primary Research Dataset, August 2026)
Market Definition
This report covers specialty and commodity chemicals formulated for potable water treatment, municipal wastewater treatment, and industrial process water and effluent treatment, including coagulants, flocculants, disinfectants, corrosion and scale inhibitors, pH adjusters, and membrane-specific chemistries. It excludes water treatment equipment, membrane hardware, and digital monitoring platforms sold independently of chemical formulations.
Quantitative Units
USD billions (current prices); metric tons where volume data is available
Segmentation Dimensions
By Chemical Type; By End-Use Industry; By Commercial Dimension; By Region
Regions Covered
North America, Western Europe, East Asia, South Asia and Pacific, Latin America, Middle East and Africa, Eastern Europe
Countries Covered
USA, China, Germany, France, UK, Japan, South Korea, India, Australia, Canada, Brazil, Mexico, Indonesia, Vietnam, Thailand, Malaysia, UAE, Saudi Arabia, South Africa, Nigeria, Turkey, Poland, Netherlands, Italy, Spain, Sweden, Switzerland, Argentina, Colombia, Singapore, and additional markets relevant to this sector
Key Companies Profiled
Ecolab, Kemira, SUEZ (Veolia Water Technologies), BASF, Solenis, Kurita Water Industries, Suez Environnement, Feralco, SNF Group, Aditya Birla Chemicals, Thermax, Ion Exchange India, Lonza, Buckman Laboratories, Chembond Chemicals, GE Water (Veolia), Xylem, AkzoNobel Specialty Chemicals, Solvay, Cabot Corporation
Quantitative Methodology
Primary survey, n=3,800 respondents, Q4 2025, six countries; demand-side model with trade association cross-validation
Qualitative Methodology
47 expert interviews, Q4 2025; applied to validate demand model assumptions, identify emerging dynamics, and assess competitive positioning
Report Format
PDF and XLSX data workbook (Word format preview document)
Publisher
Market Minds Advisory
Report Code
MMA-2026-CHM-101
Published
August 2026
Contact
sales@marketmindsadvisory.com | www.marketmindsadvisory.com

Purchase the full Water and Wastewater Treatment Chemicals Market Report (2026 to 2036).

The full report delivers detailed segment-level sizing across all six chemical type categories, country-level regional breakdowns for all seven regions, and in-depth competitive profiles covering twenty companies active in this market. It includes granular analysis of PFAS regulatory timelines by jurisdiction, feedstock cost sensitivity modeling, and supplier qualification pathway guidance for utilities navigating upcoming compliance deadlines. The report also profiles emerging bio-based and next-generation chemistry alternatives gaining early commercial traction. Buyers also receive access to underlying data tables and a dedicated analyst briefing call. Sample data tables are available on request before purchase.
Country-level sizing across thirty markets covered
PFAS regulatory timeline tracker by jurisdiction
Feedstock cost sensitivity modeling and tools
Twenty-company competitive benchmarking profiles included in full
Supplier qualification pathway guidance provided throughout
Dedicated analyst briefing call included at no cost

Built For The People Who Decide

From boardroom strategy to bench-side execution, this report is read cover-to-cover by leaders shaping the next decade of their industry, turning demand scenarios, market dynamics and valuation benchmarks into decisions.
CXOs/ Presidents/ VPs/ Managers
M&A and Corporate Development
Strategy Teams and R&D Heads
Procurement and Product Directors
Regulatory and Compliance Leaders
Investor Relations and Equity Analysts