Market Minds Advisory
Warehouse Robotics Market

Warehouse Robotics Market: A Building-Shaped Commitment With A Twenty-Year Payback

A commercial reading of fixed warehouse automation, where the system is designed into the building itself, throughput assumptions age badly, and picking the wrong item profile strands capital for two decades.

Lead Analyst

David Horsley

Published

September 2026

Make Smarter Decisions with Customized Research Insights

Request a free sample report and evaluate market opportunities, growth trends, and competitive dynamics relevant to your business needs.

2025 MARKET VALUE$22.7BMarket Size 2025
2036 FORECAST VALUE$73.0BBase Case , 2026 to 2036
CAGR 2026 TO 203611.2 %Bull 12.5% / Bear 9.9%
INCREMENTAL OPPORTUNITY$47.7BNet 10- year value creation
EXPANSION MULTIPLE2.89x2036 value over 2026 base
Strategic Levers
M&A Pipeline
Regional Outlook
Country Rankings
Competitive Intelligence
Segmental Deep-dive
Call-Us : 91 93563 13602

Executive Snapshot and Market Trajectory

Fixed warehouse automation is a bet on what a business will ship in twenty years. The racking, cranes, and conveyors are designed into the building around an assumed item profile and throughput, and neither of those holds still for anything like that long, as several retailers discovered expensively.
The market stands at USD 22.7 billion in 2025 and reaches USD 72.96 billion by 2036 at an 11.2% CAGR. Robotic piece picking systems grow fastest at 18.6%, about 1.66 times the overall rate, as grasping capability finally reached the item variety real warehouses actually contain. East Asia holds 29% of value on Chinese and Japanese installation volume, while India posts the quickest national growth at 19.4% on greenfield distribution construction alone.
Concentration is moderate, with the top five holding roughly 38% of installed system value and a substantial field of integrators beneath them. Two forces are now reshaping the field. Piece picking has finally crossed from demonstration into genuine production deployment after a decade of promises, and operators burned by rigid systems are specifying reconfigurability in ways that change what a supplier must actually deliver to win.
Market Definition
The warehouse robotics market covers fixed and semi-fixed automated systems installed within storage and fulfilment facilities, spanning automated storage and retrieval systems, robotic piece picking systems, palletising and depalletising robots, automated sortation and conveyance systems, and warehouse control and execution software supplied with them. Autonomous mobile robots navigating without fixed guidance, forklifts and manually operated handling equipment, racking sold without automation, warehouse management software sold standalone, and the buildings themselves are excluded.
Base Year Value
$22.7B in 2025 (MMA Primary Research Dataset, August 2026)
Forecast Period
2026 to 2036, eleven discrete annual values
CAGR
11.2% base case. Bull 12.5%. Bear 9.9%.
Fastest Growth Segment
Robotic Piece Picking Systems: 18.6% CAGR
Fastest Growth Country
India: 19.4% CAGR
Fastest Growth Region
South Asia and Pacific: 13.4% CAGR
Largest Region
East Asia: 29% of 2025 global value
Market Leaders
Daifuku, Dematic, SSI Schaefer, Knapp, Vanderlande. Source: MMA Analysis based on company annual reports.
Primary Survey
n=3,800 procurement and R&D decision-makers, Q4 2025, six countries
Methodology
Demand-side build-up, cross-validated against public data, 47 expert interviews

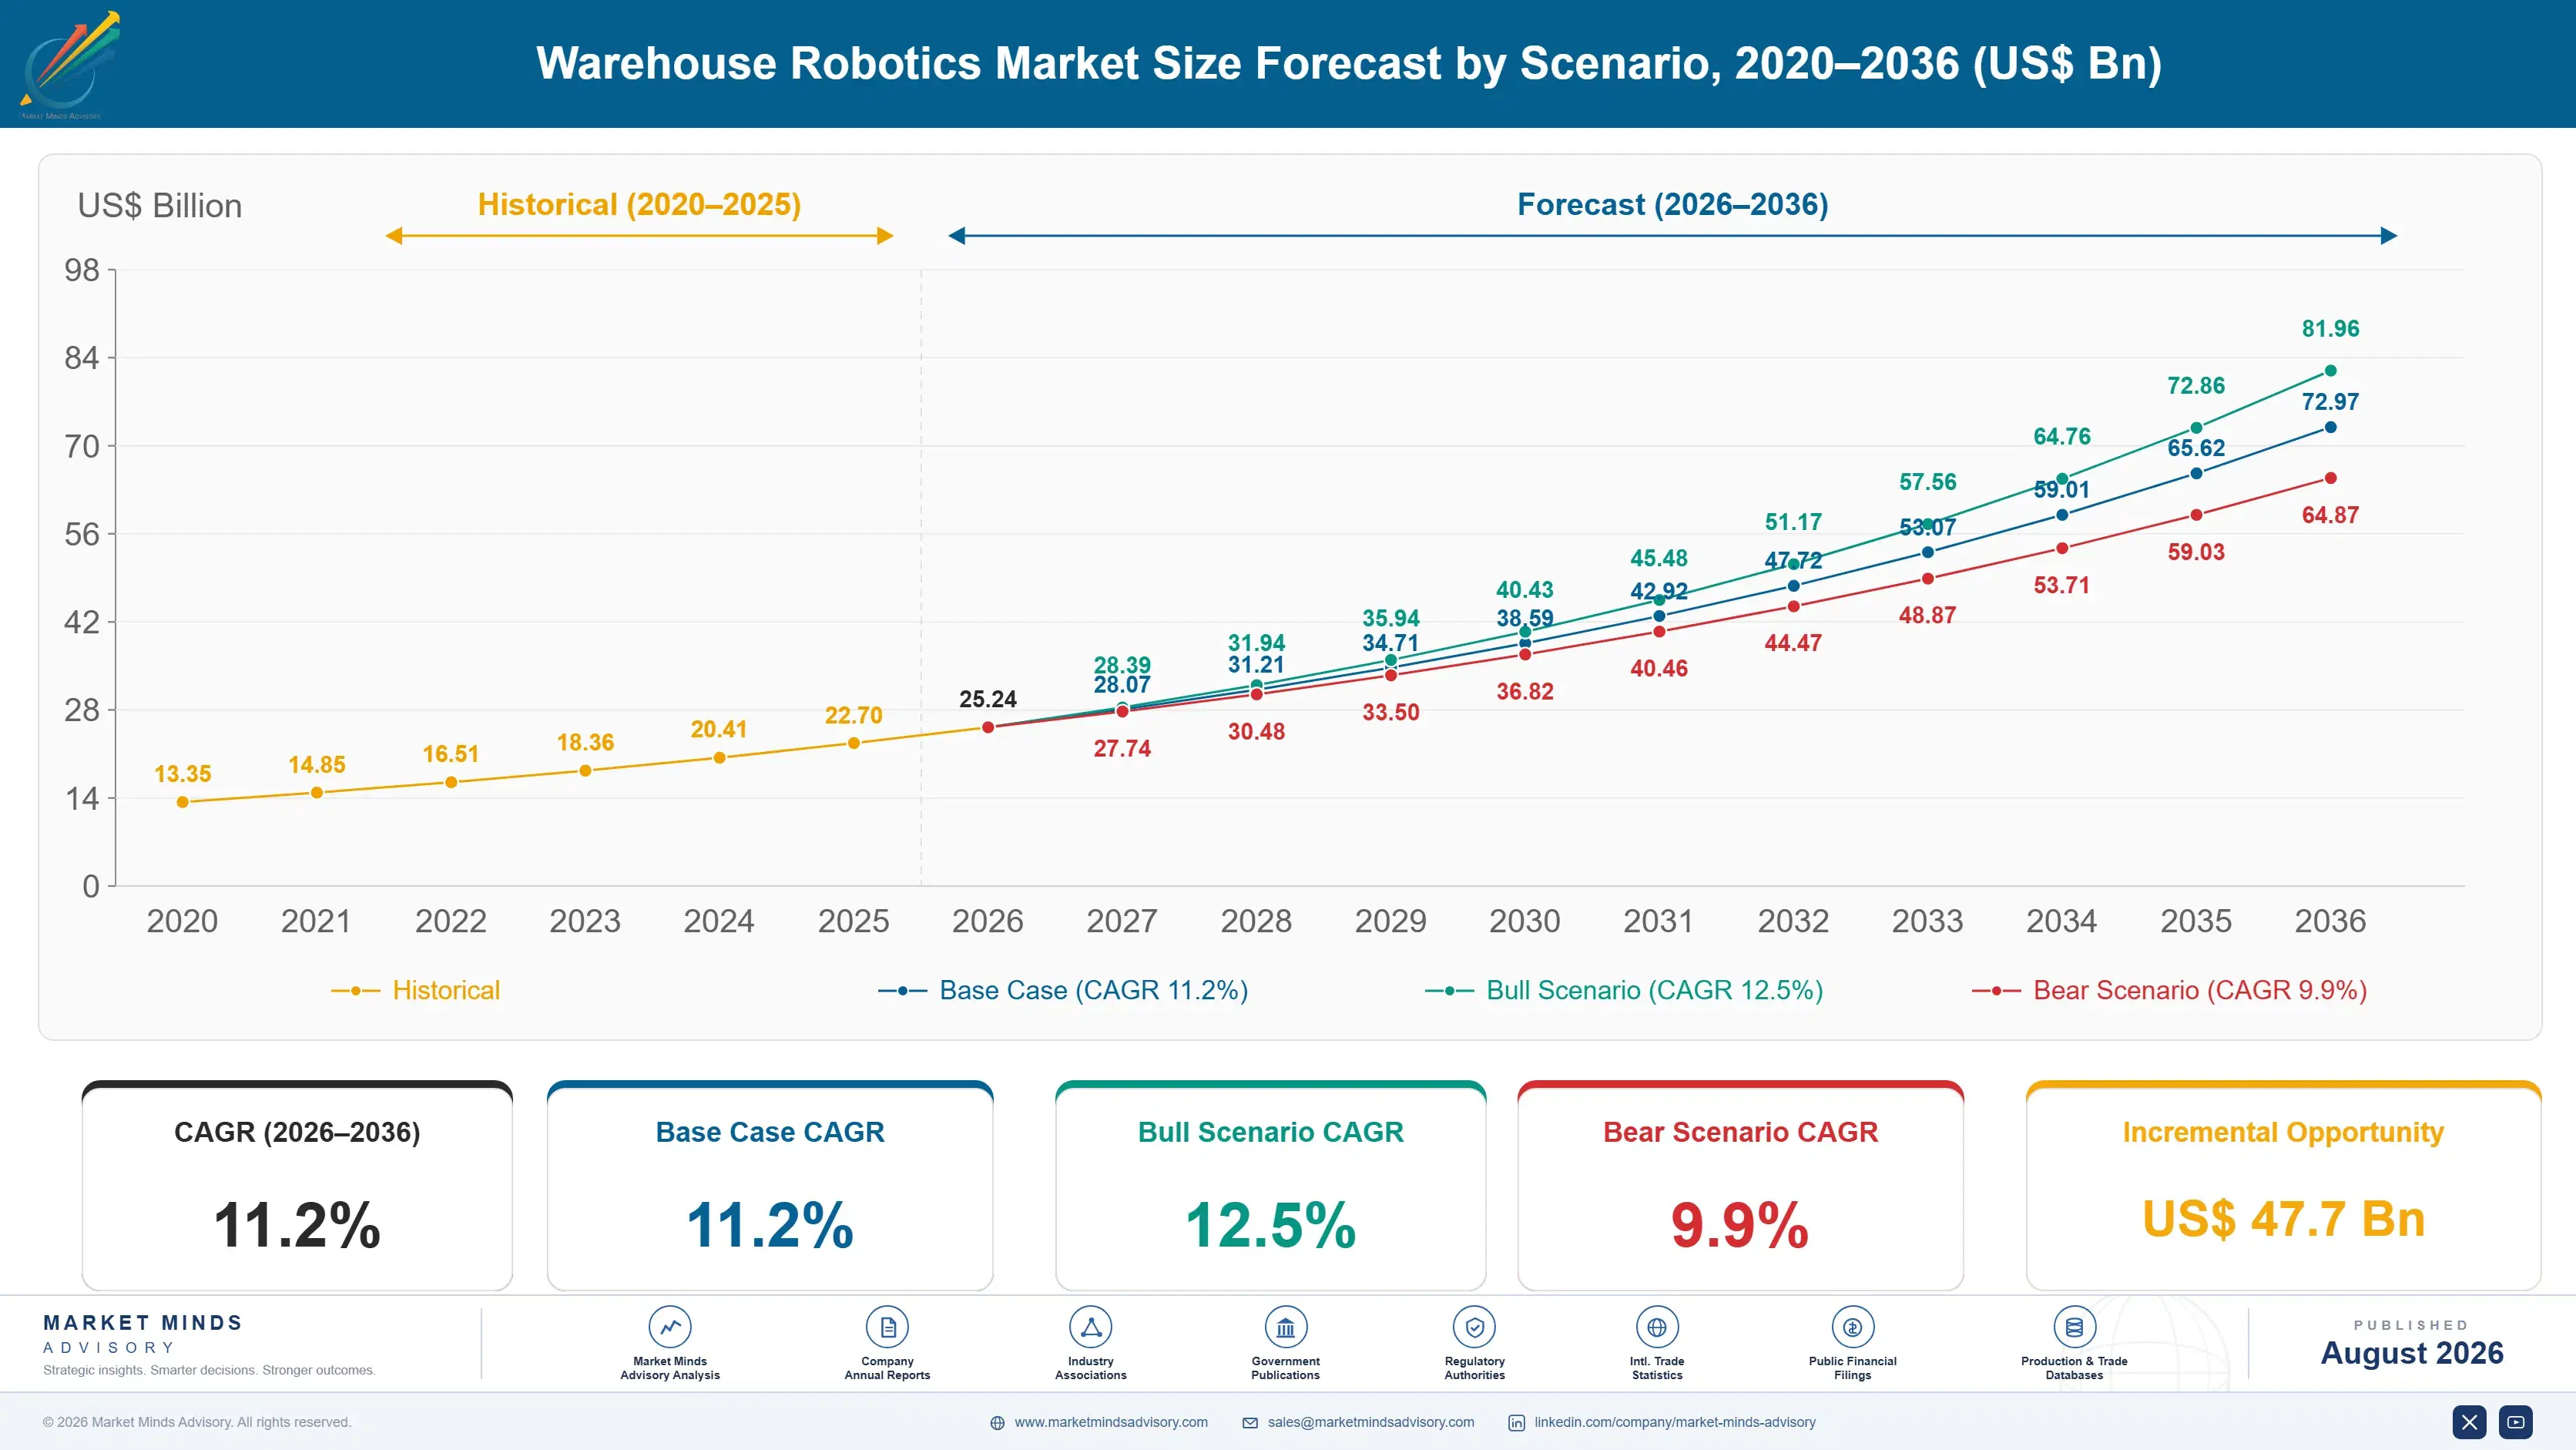
Warehouse Robotics Market Forecast Scenarios

warehouse-robotics-market-size-forecast-scenario-1787324687889
Growth from 2020 to 2025 compounded near 9.8%, and the period contained an overbuild and a correction. E-commerce volumes through 2020 and 2021 drove automation orders to record levels as retailers committed capital against demand curves that turned out to be temporary. Order intake then fell sharply through 2023 as those retailers found themselves with capacity they did not need. Backlogs carried revenue while new bookings stalled.
Three mechanisms carry the base case to 11.2%. First, labour scarcity in distribution, which persists through economic cycles and makes automation the cheaper option rather than the sophisticated one. Second, piece picking maturity, since grasping now handles the item variety real warehouses contain rather than only the curated subsets demonstrations used. Third, facility constraint, as operators unable to expand a building use automation to raise throughput inside the footprint they already occupy.
The bull case at 12.5% assumes piece picking deployment accelerates as reliability data accumulates and grocery automation scales beyond the handful of operators currently proving it. The bear case at 9.9% assumes retailers stay cautious after the overbuild, capital approval remains difficult under margin pressure, and operators prefer mobile robotics that can be redeployed over fixed systems that cannot.

Why The Building Decides The Next Twenty Years

Three forces set demand. Labour scarcity provides the strongest, because distribution vacancies persist through cycles and wage inflation has been sustained for a decade. Facility constraint provides the second, since operators unable to expand a building raise throughput inside the footprint they have. And item profile change provides the third, as order lines shrink toward single items and case-picking systems handle that badly.
MARKET CONCENTRATIONCR5: 38%Moderately consolidated above a deep systems integrator layer
SYSTEM DESIGN LIFE15 to 25 yearsPeriod a fixed installation remains in productive service
PROJECT DELIVERY TIME12 to 30 monthsDuration from contract award to full operational handover
SOFTWARE CONTENT SHAREAbout 29%Control and execution software within total project value
PIECE PICKING ACCURACYAbout 98%Successful grasp rate achieved across mixed item populations
SERVICE REVENUE SHAREAbout 24%Maintenance and spares within total supplier revenue base
The commercial character is defined by how permanent the decision is. A fixed system is designed into the building, commissioned over 12 to 30 months, and expected to run 15 to 25 years, so the assumptions made at design freeze govern operations for two decades. Businesses change faster than that. Operators burned once now specify reconfigurability and modularity ahead of peak throughput, a genuine shift in what suppliers must deliver.
The next decade turns on two things. Whether piece picking reliability holds across the item variety real warehouses contain, since roughly 98% grasp accuracy sounds excellent until the remaining failures require human intervention on a line running continuously. And whether operators keep choosing fixed systems at all, because mobile robotics can be redeployed when the business changes and fixed racking cannot be moved for any price.
"The retailers who overbuilt in 2021 did not buy bad systems. They bought excellent systems for a business that stopped existing about eighteen months later, which is the real risk in this category and nobody puts it in the payback model."
Director, Supply Chain Automation and Logistics Practice · MMA Technology / Fixe

Market Trends

Piece Picking Crossed From Demonstration Into Production

Robotic grasping spent a decade handling curated item sets in demonstrations while failing on the deformable packaging, transparent film, and irregular shapes that real warehouses contain in quantity. Improved vision, suction and gripper design, and learned grasp planning have pushed success rates to roughly 98% across mixed populations, which is finally high enough to deploy. The commercial significance is that piece picking addresses the most labour-intensive task in fulfilment, so each installation displaces more labour than any other automation. Remaining failures still need human intervention, which shapes how operators design the surrounding workflow.
Market Impact: Grocery orders exceed 50 lines
Operators Now Specify Reconfigurability Over Peak Throughput

The 2021 automation overbuild left several retailers with systems designed for volumes that never materialised, and the lesson was expensive enough to change specification behaviour across the industry. Buyers now ask how a system adapts when order profiles shift, whether modules can be added or removed, and what happens if throughput requirements halve rather than double. That reverses two decades of competing on peak rate. Suppliers offering modular architecture, phased deployment, and genuine reconfiguration paths win specifications that pure throughput leaders now lose routinely. Peak rate leadership no longer wins the specification.
Market Impact: Density rises 3 times within footpr

Market Opportunities and Growth Drivers

Grocery Automation Reaches Commercially Viable Economics

Online grocery has the worst fulfilment economics in retail, combining low order values, temperature zones, fragile items, and pick lines running into dozens per order. Manual store picking never worked at scale and dedicated automated fulfilment centres struggled for years on capital cost. Improved throughput per square metre and piece picking capability have finally brought the economics within range for large grocers. Each facility is enormous by warehouse automation standards, so a handful of grocery commitments moves the market noticeably in a way general merchandise deployments do not. Facility scale amplifies every commitment here.
Market Impact: Assumptions locked 25 years

Facility Constraint Forces Density Rather Than Expansion

Warehouse land near population centres is scarce and expensive, and planning permission for new distribution capacity has become genuinely difficult across the Netherlands, southeast England, and parts of North America. Operators who cannot build outward automate upward, since automated storage reaches heights and densities manual operation cannot approach safely. That converts a property problem into an automation purchase, which is a considerably easier internal approval than land acquisition. The argument also improves as land prices rise, which they have done consistently in exactly the locations fulfilment requires. Land prices keep improving the argument annually.
Market Impact: Projects exceed 100 million dollars

Market Restraints and Challenges

Design Freeze Locks Assumptions For Two Decades

A fixed system is engineered around an item profile, order structure, and throughput agreed at design freeze, then built into a building and operated for 15 to 25 years. The root cause is physical: racking, cranes, and conveyor runs are structural elements that cannot be repositioned once installed. Commercially this strands capital when the business changes, which the 2021 overbuild demonstrated across several retailers simultaneously. Suppliers are responding with modular architectures, phased deployment that defers commitment, hybrid designs combining fixed and mobile elements, and contracts allowing capacity adjustment. Nobody models that risk honestly.
Market Impact: Grasp accuracy reaches 98%

Capital Approval Competes Against Everything Else

A warehouse automation project runs into tens or hundreds of millions and competes for capital against store refurbishment, inventory, technology, and acquisitions with faster payback. The root cause is that retail and logistics margins are thin and boards distrust long-payback capital after the overbuild. Commercially this produces sales cycles measured in years and decisions that slip repeatedly across budget periods. Suppliers respond with automation-as-a-service structures, phased deployment matching capital availability, throughput-linked payment, and financing partnerships that move the spend off the customer's balance sheet. Decisions slip across budget years repeatedly.
Market Impact: Systems run 15 to 25 years
3 additional market trends, 4 additional growth drivers, and 2 additional restraints and challenges are covered in the full report. Contact sales@marketmindsadvisory.com to access the complete intelligence.

Segment CAGR and Growth Architecture

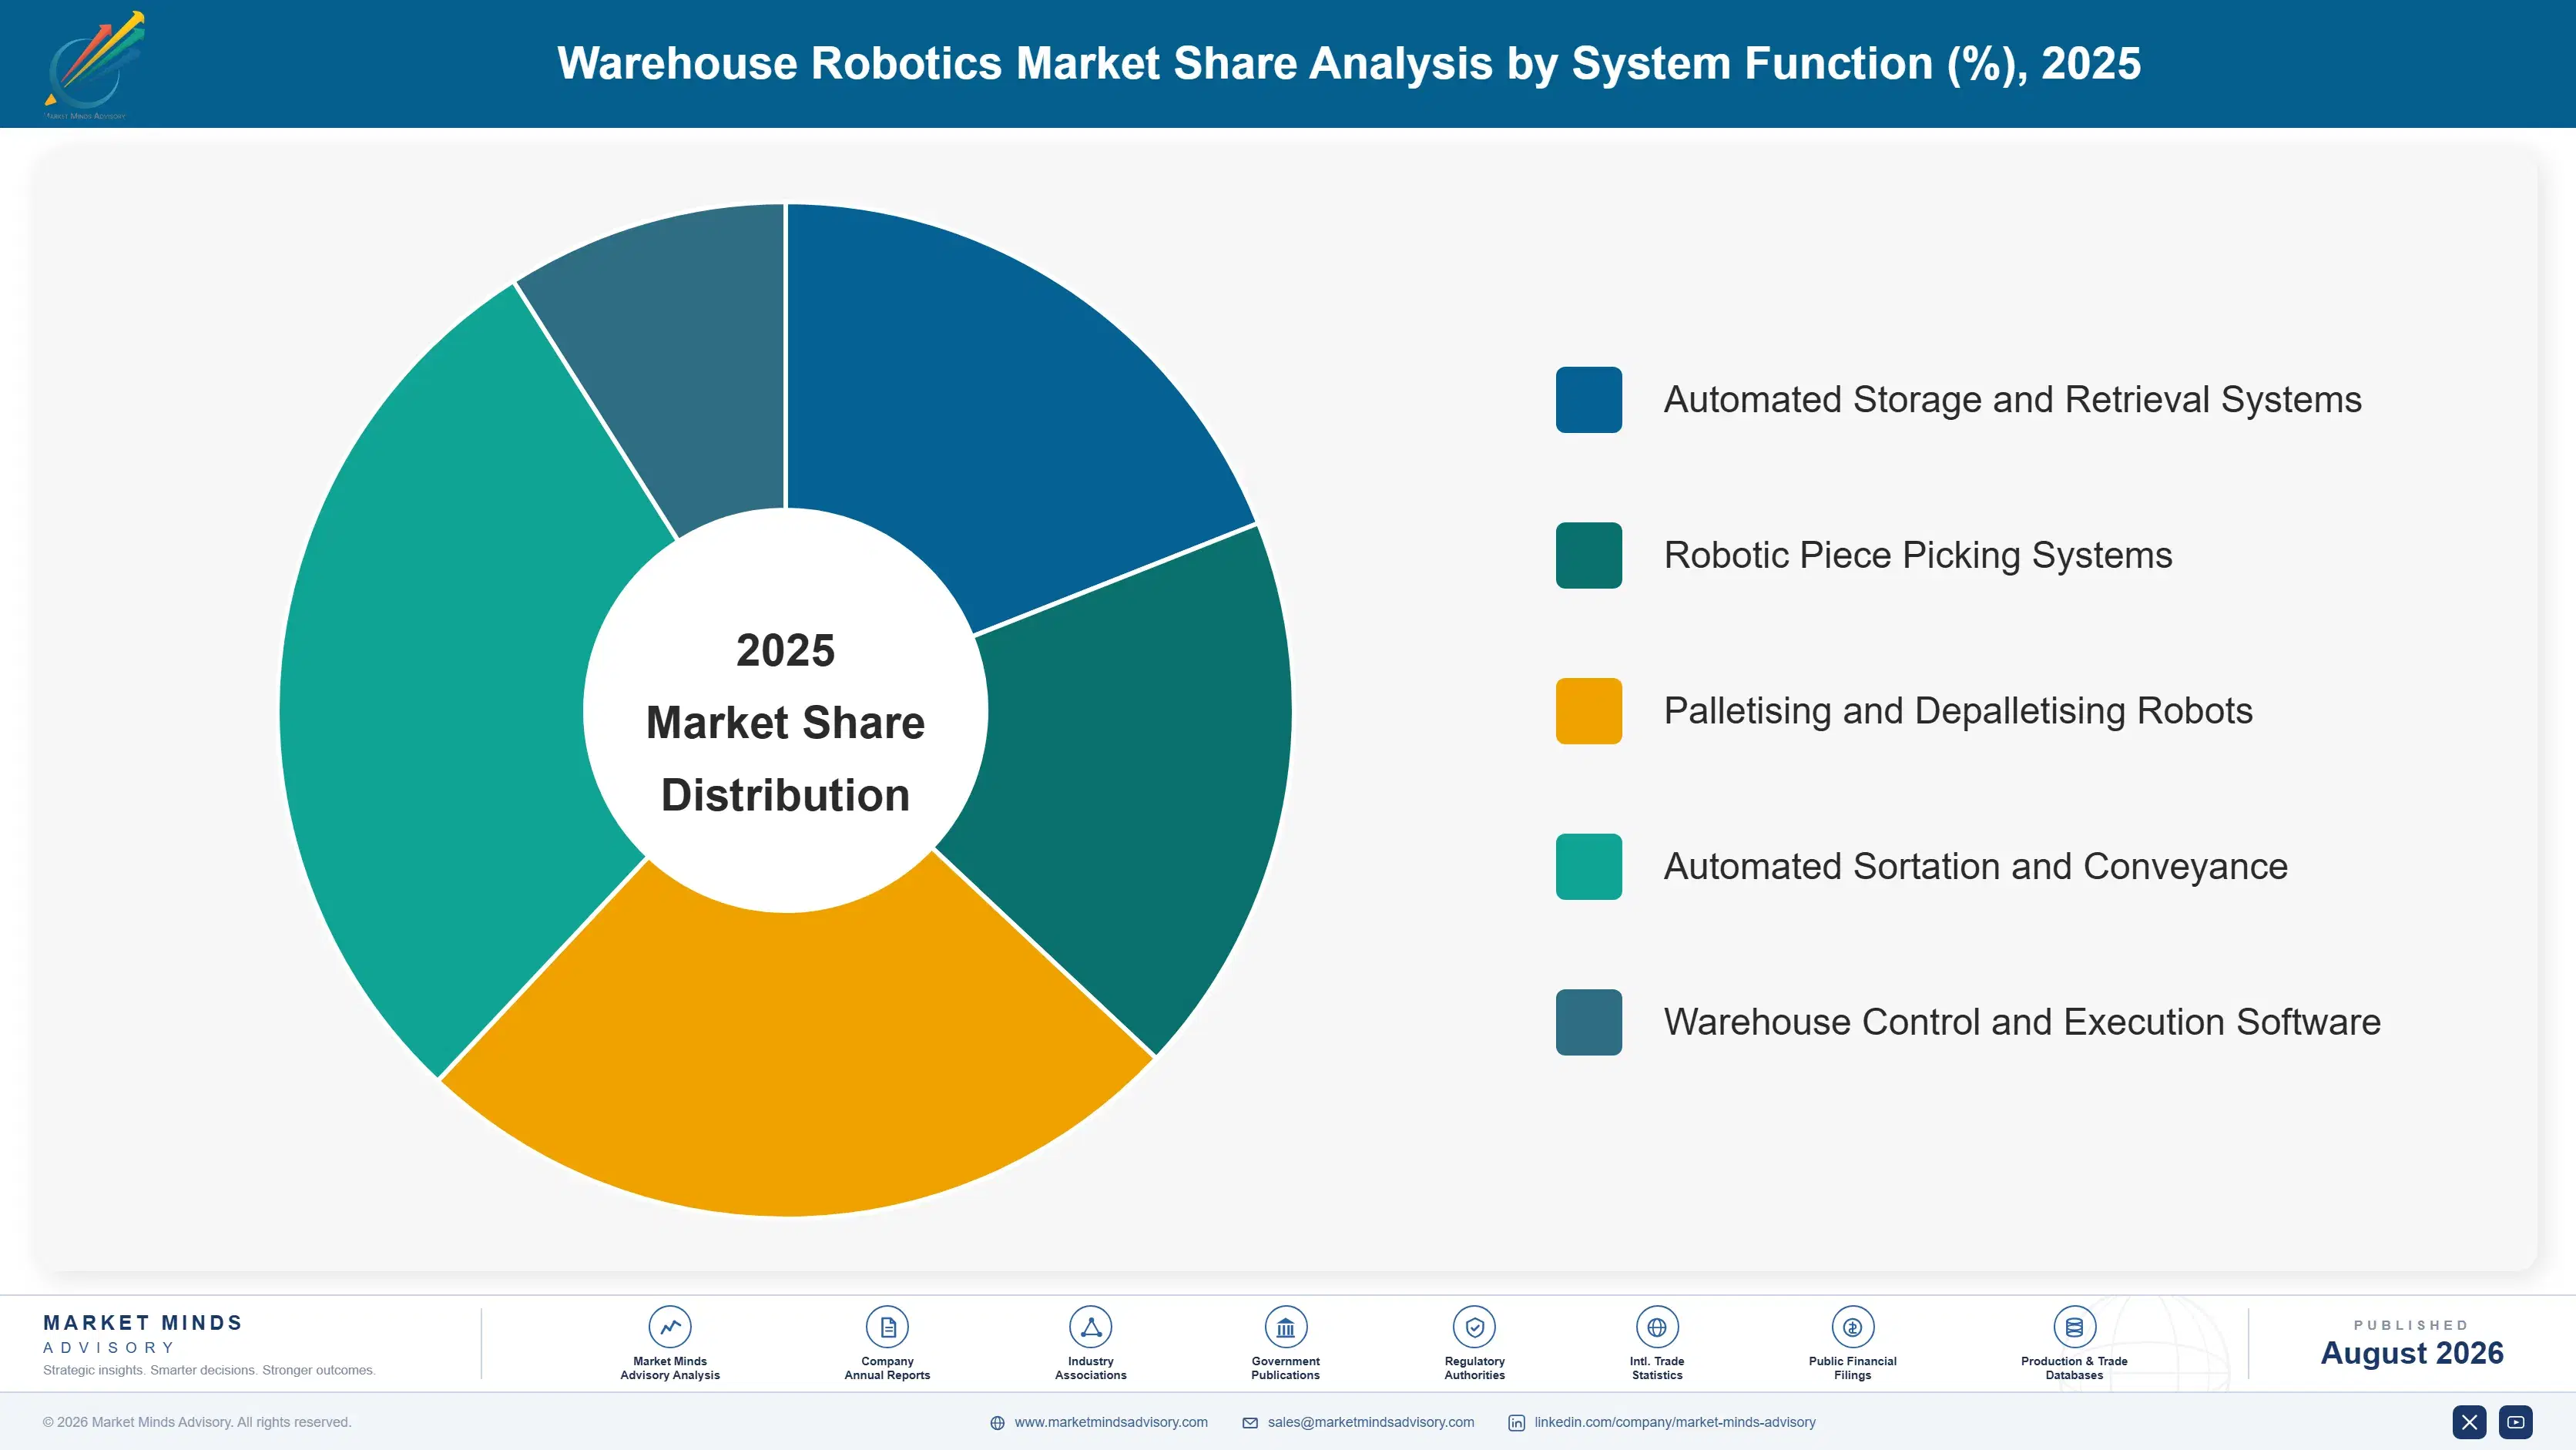
Segmentation follows system function, a single task logic describing what the installed automation physically does with the goods. Each function carries its own engineering discipline, capital intensity, throughput profile, and reconfiguration difficulty, so commercial position tracks the operation rather than the facility type. End-use industry and commercial model appear separately within the framework as distinct dimensions.
warehouse-robotics-market-market-share-analysis-1787324688420

Robotic Piece Picking Systems

Robotic piece picking systems grow fastest at 18.6%, about 1.66 times the overall 11.2% rate, and they address the single most labour-intensive operation in fulfilment. A decade of demonstrations on curated item sets gave way to genuine production capability once vision, gripper design, and learned grasp planning pushed success rates to roughly 98% across mixed populations including deformable packaging and transparent film. Each installation displaces more labour than any other automation function, which makes the payback argument unusually direct. The remaining failure rate still requires human intervention, so workflow design around exception handling matters as much as the robot itself. Grocery and pharmaceutical fulfilment are adopting fastest given item variety and labour intensity together.
CAGR 18.6%

Automated Storage and Retrieval Systems

Automated storage and retrieval systems grow at 12.4%, the second-fastest function, covering shuttle systems, cube storage, crane-based racking, and the goods-to-person stations they feed. Land scarcity is the driver rather than labour, since these systems reach storage densities and heights manual operation cannot approach safely, which converts a property constraint into an automation purchase. Cube storage in particular has grown quickly on modular architecture that suits phased deployment and reconfiguration, addressing exactly the flexibility concern the 2021 overbuild created. Capital intensity is high and the installation is genuinely permanent, so the design freeze problem applies here more acutely than anywhere else in this market. Modular architecture is now the deciding specification.
CAGR 12.4%
Full segment breakdown across 5 segments available in the complete report.

Regional Architecture and Country Demand Map

Warehouse construction and labour cost together set this distribution, moderated by land scarcity that varies enormously between regions. East Asia leads on installation volume, while Western Europe holds a value share above its floor area share because land constraints push specification toward higher density systems.

North America

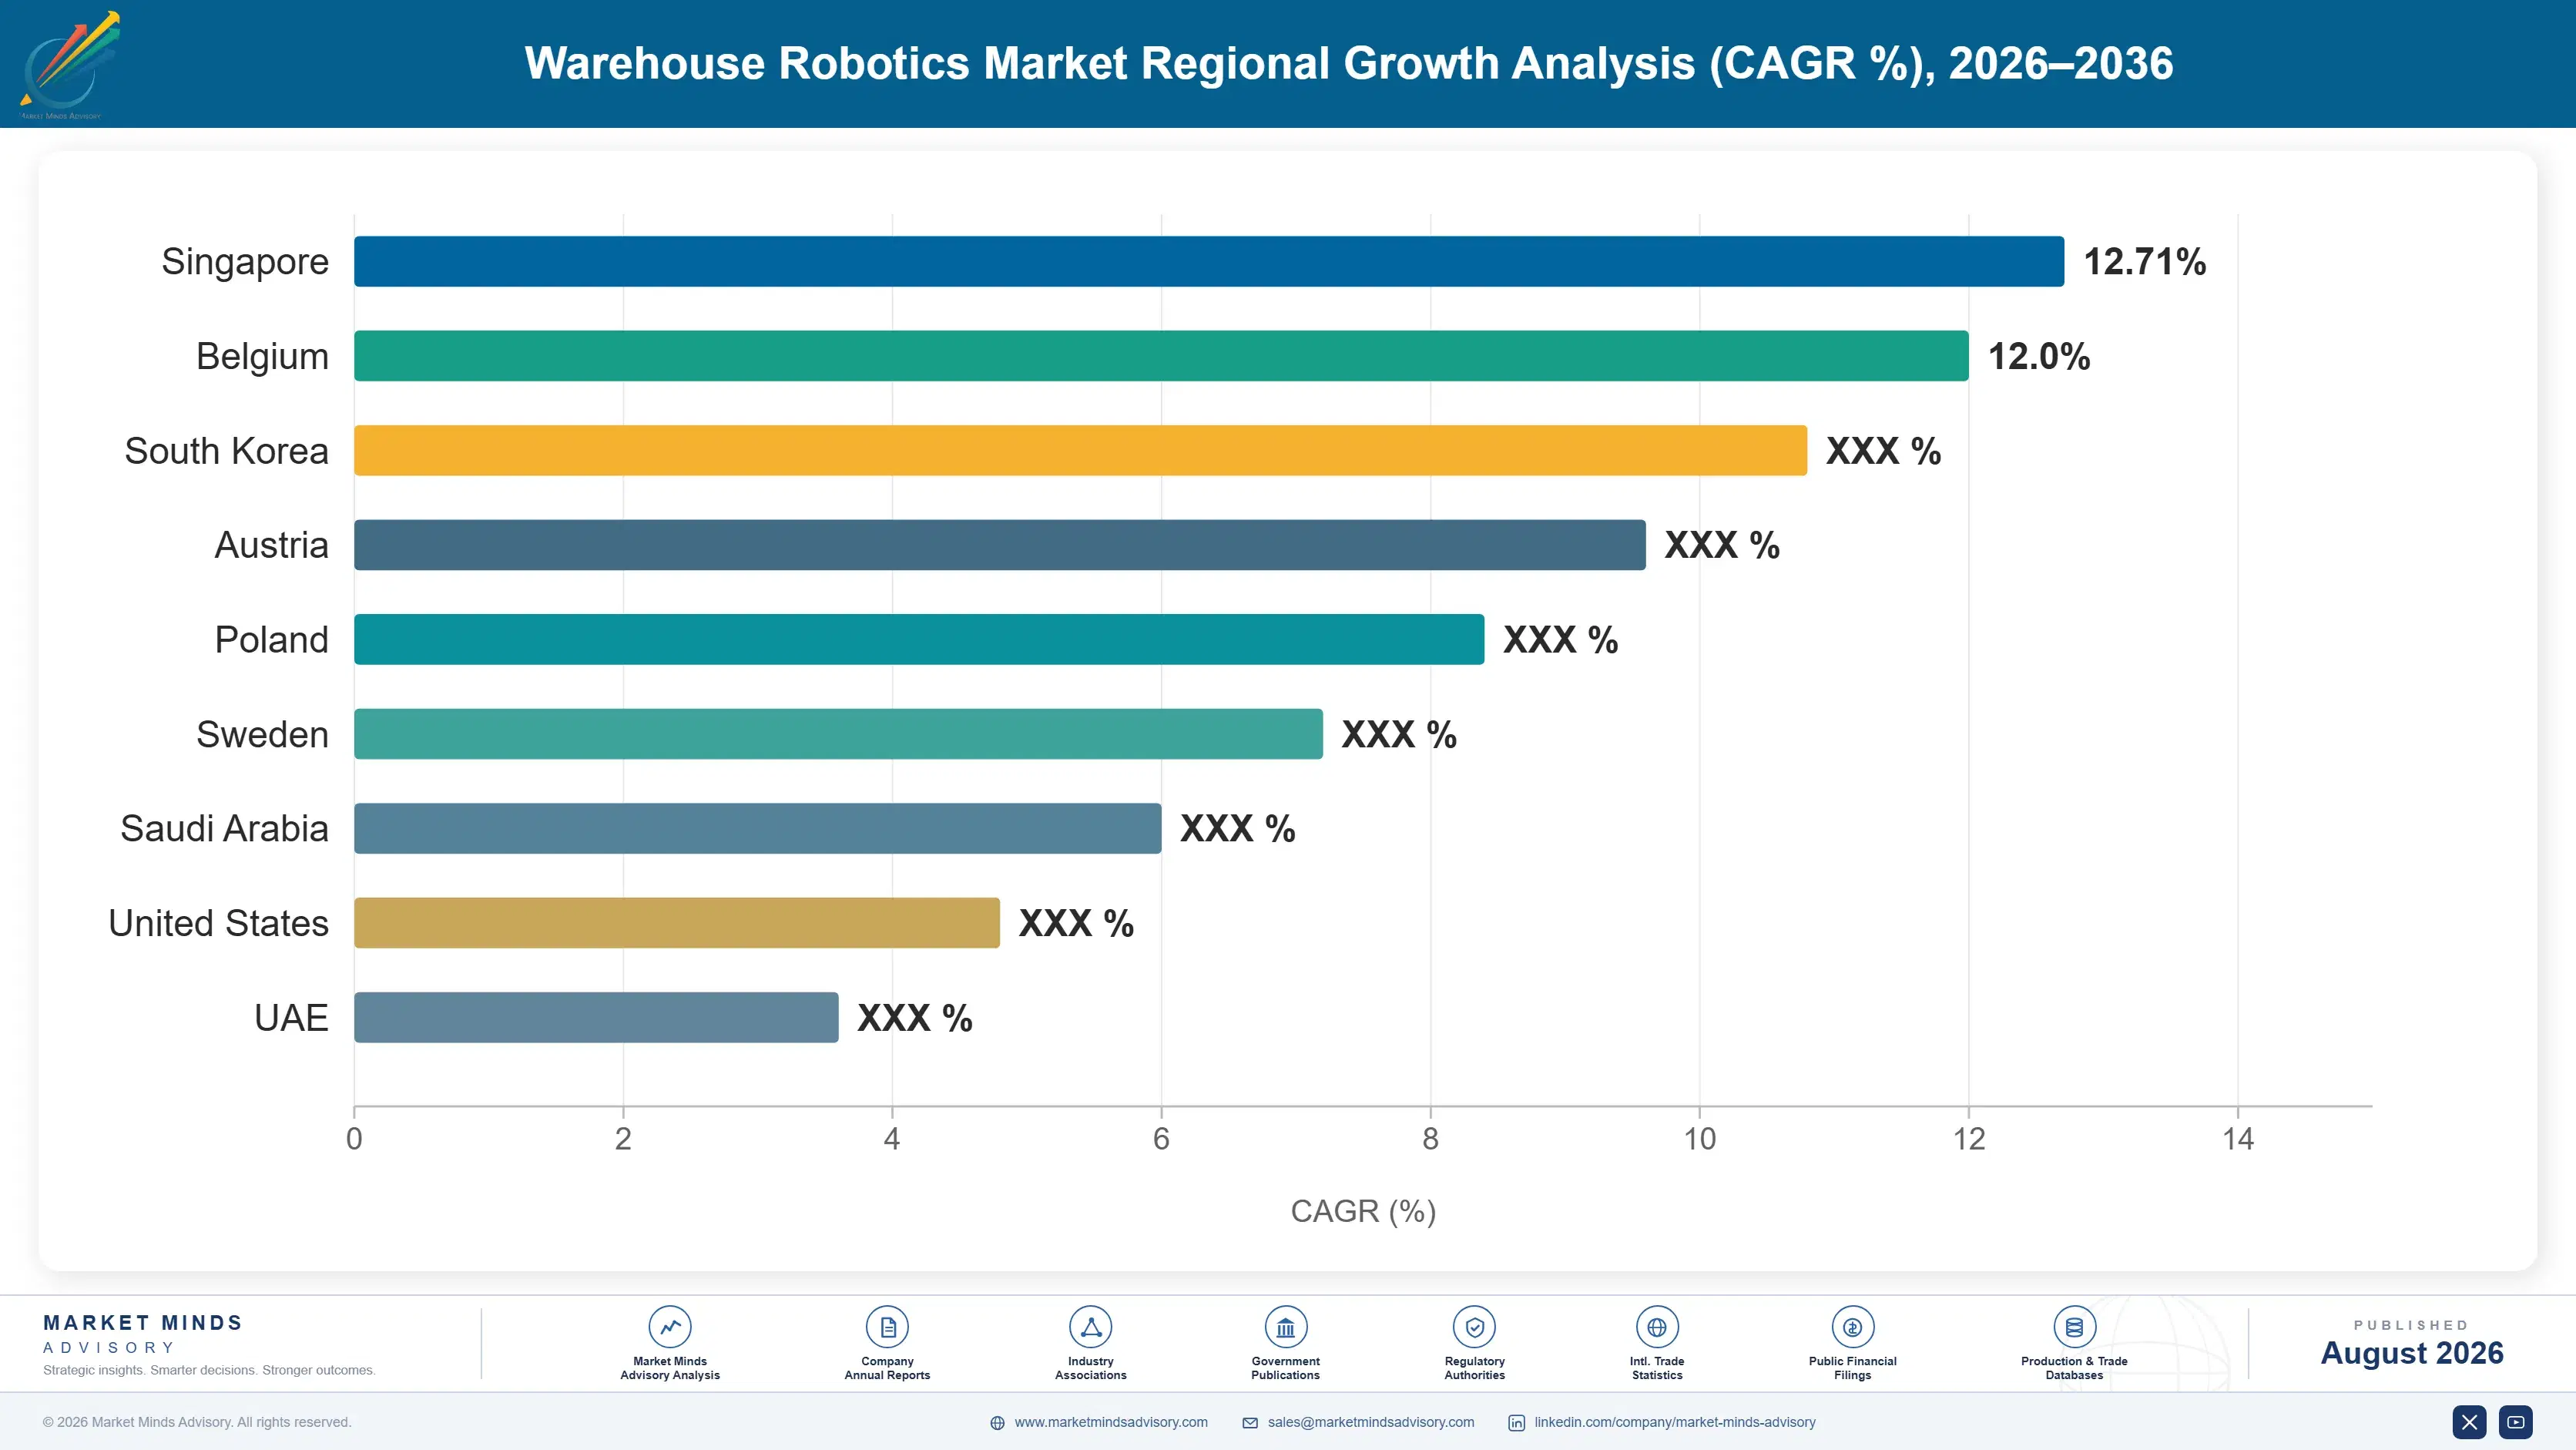
North America holds 27% of value on the largest fulfilment estate anywhere and warehouse wages that have risen faster than general earnings for a decade. The 2021 overbuild was sharpest here, with several major retailers committing capital against e-commerce curves that flattened afterwards, and the caution that followed still shapes capital approval. Grocery automation is advancing more slowly than in Europe because store-based picking remains viable at current labour rates in many markets. Land constraints bind hardest around coastal population centres rather than nationally. Growth of 11.6% reflects labour economics and grocery adoption against boards still wary of long-payback commitments. Board caution following the overbuild still shapes almost every approval.
Share: 27% | CAGR: 11.6% (2026 to 2036)

Western Europe

Land scarcity does more here than labour cost does. Western Europe holds 24% of value, with warehouse land around Randstad, southeast England, and the Rhine corridor genuinely constrained and planning permission increasingly difficult to obtain. That pushes specification toward high-density automated storage rather than toward labour displacement alone. Grocery automation is further advanced than anywhere, with several large grocers operating dedicated automated fulfilment at scale. Daifuku, Dematic, SSI Schaefer, Knapp, and Vanderlande all hold deep European engineering bases. Growth of 10.0% is the slowest of the seven, held back by weak retail investment and construction that planning restrictions have genuinely slowed. Planning permission has genuinely become the binding constraint here.
Share: 24% | CAGR: 10.0% (2026 to 2036)
Regional intelligence for 5 additional markets available in the complete report: East Asia, South Asia and Pacific, Latin America, Middle East and Africa, Eastern Europe. Contact sales@marketmindsadvisory.com.
warehouse-robotics-market-country-cagr-analysis-1787324688941

Where Automation Suppliers Actually Win Projects

Competing on peak throughput was the right strategy until several retailers discovered they had bought capacity for a business that changed. The four moves below reach what buyers now weigh: reconfigurability, capital structures that avoid the approval fight, piece picking where labour displacement is largest, and the service annuity that outlives the installation revenue.

Sell Reconfigurability Rather Than Peak Rate

The 2021 overbuild taught operators that a system optimised for one throughput assumption becomes a liability when the business changes, and specification behaviour shifted accordingly across the industry. Buyers now ask how modules are added or removed and what happens if volumes halve rather than double, questions no peak rate figure answers. Suppliers offering genuine modular architecture and phased deployment win specifications that throughput leaders now lose, because a system running 15 to 25 years must survive assumptions nobody can make accurately. No throughput figure answers the question buyers now ask.
Market Impact: Fixed systems operate 15 to 25 year

Structure Around Capital Approval Rather Than Against It

Projects exceeding 100 million dollars compete against store refurbishment, inventory, and acquisitions with faster payback, and boards distrust long commitments after the overbuild. Automation-as-a-service, throughput-linked payment, and phased deployment matched to capital availability route around that fight entirely by moving spend into operating budgets or deferring it. Suppliers offering these structures close considerably faster and hold customers longer, though carrying the balance sheet exposure is precisely what excludes smaller competitors from following. Boards that wrote off capacity once approve operating spend far more readily than another capital commitment of the same size.
Market Impact: Individual projects routinely excee

Lead With Piece Picking Where Labour Displacement Is Largest

Piece picking addresses the most labour-intensive operation in fulfilment and grasp accuracy has reached roughly 98% across mixed item populations, which finally makes the payback argument direct rather than theoretical. Each installation displaces more labour than any other function, so the business case writes itself in operations rather than requiring finance to believe a productivity forecast. Suppliers should lead proposals with picking rather than storage, because the labour arithmetic is what gets the project approved and storage follows naturally behind it. Storage proposals rarely clear approval on their own merits.
Market Impact: Grasp accuracy now reaches 98% acro

Build The Service Annuity Into The Original Contract

A system running 15 to 25 years generates maintenance, spares, software updates, and modification work across its whole life, and service already represents about 24% of supplier revenue. Negotiating that at handover rather than at award surrenders pricing power at exactly the moment the customer has alternatives. Suppliers should contract service terms alongside the installation, since the customer comparing bids weighs total lifetime cost anyway and a supplier without service revenue is competing on a much thinner proposition. A supplier holding no service revenue competes on a considerably thinner proposition.
Market Impact: Service already represents 24% of t

Who Controls the Margin Pool

Concentration is moderate: the top five hold roughly 38% of installed system value, with integrated suppliers, technology specialists, and independent integrators competing differently. The gap between leaders and challengers is one of project delivery capability and service network depth rather than component engineering, which is broadly available. All participants here are assessed on one basis, revenue from fixed warehouse automation systems, software, and service, excluding mobile robots an
Competition runs along four lines. First, project delivery capability, since a system commissioned late costs the operator more than any price difference. Second, software depth, because warehouse control and execution software carries roughly 29% of project value and determines whether the hardware performs. Third, service network density, given installations run for decades. Fourth, modular architecture, which buyers now weigh above peak throughput after the overbuild.

Pressure is building from two directions. Chinese suppliers have taken domestic share on cost and delivery speed and are exporting into Southeast Asia and beyond. Meanwhile autonomous mobile robotics offers redeployable capacity that fixed systems cannot match, taking projects where flexibility outweighs density. Rankings should favour suppliers with modular architecture and genuine software depth over those competing on throughput specification and installed base alone.
warehouse-robotics-market-company-positioning-matrix-1787324689460

Competitive Moat and Risk Dimensions

DAIFUKU

Moat: Global delivery and Japanese base

Daifuku delivers large automation projects across most major markets with engineering and service capability few competitors match at comparable scale. Its Japanese home market provides steady demand driven by labour shortage rather than cost, which is a more durable driver than retail capital cycles. Breadth across warehouse, airport, and semiconductor material handling spreads exposure across unrelated demand patterns considerably.
DAIFUKU

Risk: Project cycle and retail exposure

Large project revenue swings with retail and logistics capital cycles that turned sharply after the 2021 overbuild, and backlogs conceal that only temporarily. Chinese suppliers compete aggressively on cost in the standard storage and sortation systems that carry volume. Modular and reconfigurable architecture is also an area where newer entrants moved faster than an incumbent built around large engineered projects.
DEMATIC

Moat: Software depth and integration

Dematic combines system engineering with warehouse control and execution software that determines whether installed hardware achieves designed throughput, which is where most projects underperform. Backing within KION provides balance sheet capacity for large project delivery and financing structures. Deep grocery and general merchandise references give it credibility in the segments currently investing most heavily.
DEMATIC

Risk: Capital cycle and mobile competition

Fixed system revenue depends on customers committing capital across decade horizons at a point when boards are notably cautious about exactly that. Autonomous mobile robotics competes for the same budgets while offering redeployability that fixed installations cannot provide at any price. Parent group exposure to industrial truck cycles also correlates with warehouse investment rather than offsetting it.

Players Tracked

Prominent Players

Daifuku
Dematic
SSI Schaefer
Knapp
Vanderlande

Other Key Players

AutoStore
Honeywell Intelligrated
Swisslog
TGW Logistics
Murata Machinery
Beumer Group
Witron
Ocado Technology
Exotec
Berkshire Grey
RightHand Robotics
Fanuc
ABB Robotics
Kardex
Hai Robotics

Recent Developments

MAY 2024

Major grocery retailers commit to further automated fulfilment centres

Several large grocers confirmed additional automated fulfilment facilities following operational results from earlier sites, extending commitments in a segment that had struggled for years on capital cost. These were capital commitments under existing partnerships rather than new agreements, and each facility represents unusually large system value.
Signal: Grocery facilities are large enough that a
SEPTEMBER 2024

Berkshire Grey taken private following piece picking market consolidation

The robotic picking specialist completed a take-private transaction after public market pressure on unprofitable automation businesses, joining a wider consolidation across the piece picking field. This was an acquisition taking a listed company private rather than a merger, and it reduced the number of independent picking specialists available to operators.
Signal: Consolidation among picking specialists na
FEBRUARY 2025

Warehouse operators shift specifications toward modular architecture

Procurement practice across several large logistics operators moved toward specifying modular and reconfigurable systems rather than fixed peak throughput, following capacity written off after the e-commerce correction. This was a change in buyer specification behaviour rather than any transaction or regulation, and it altered how suppliers must position their offers.
Signal: Buyers who wrote off capacity once now wei

Steel, Motors, Controls, Engineering Labour

Engineering and steel dominate this cost sheet between them. Project engineering, software development, and commissioning labour account for roughly 33% of delivered project cost, drawn from a pool competing with every other automation employer. Structural steel for racking and framework takes 19% to 25%. Motors, drives, controls, and sensors add 22% to 28%, and installation labour a further 11% to 16% depending on site conditions.
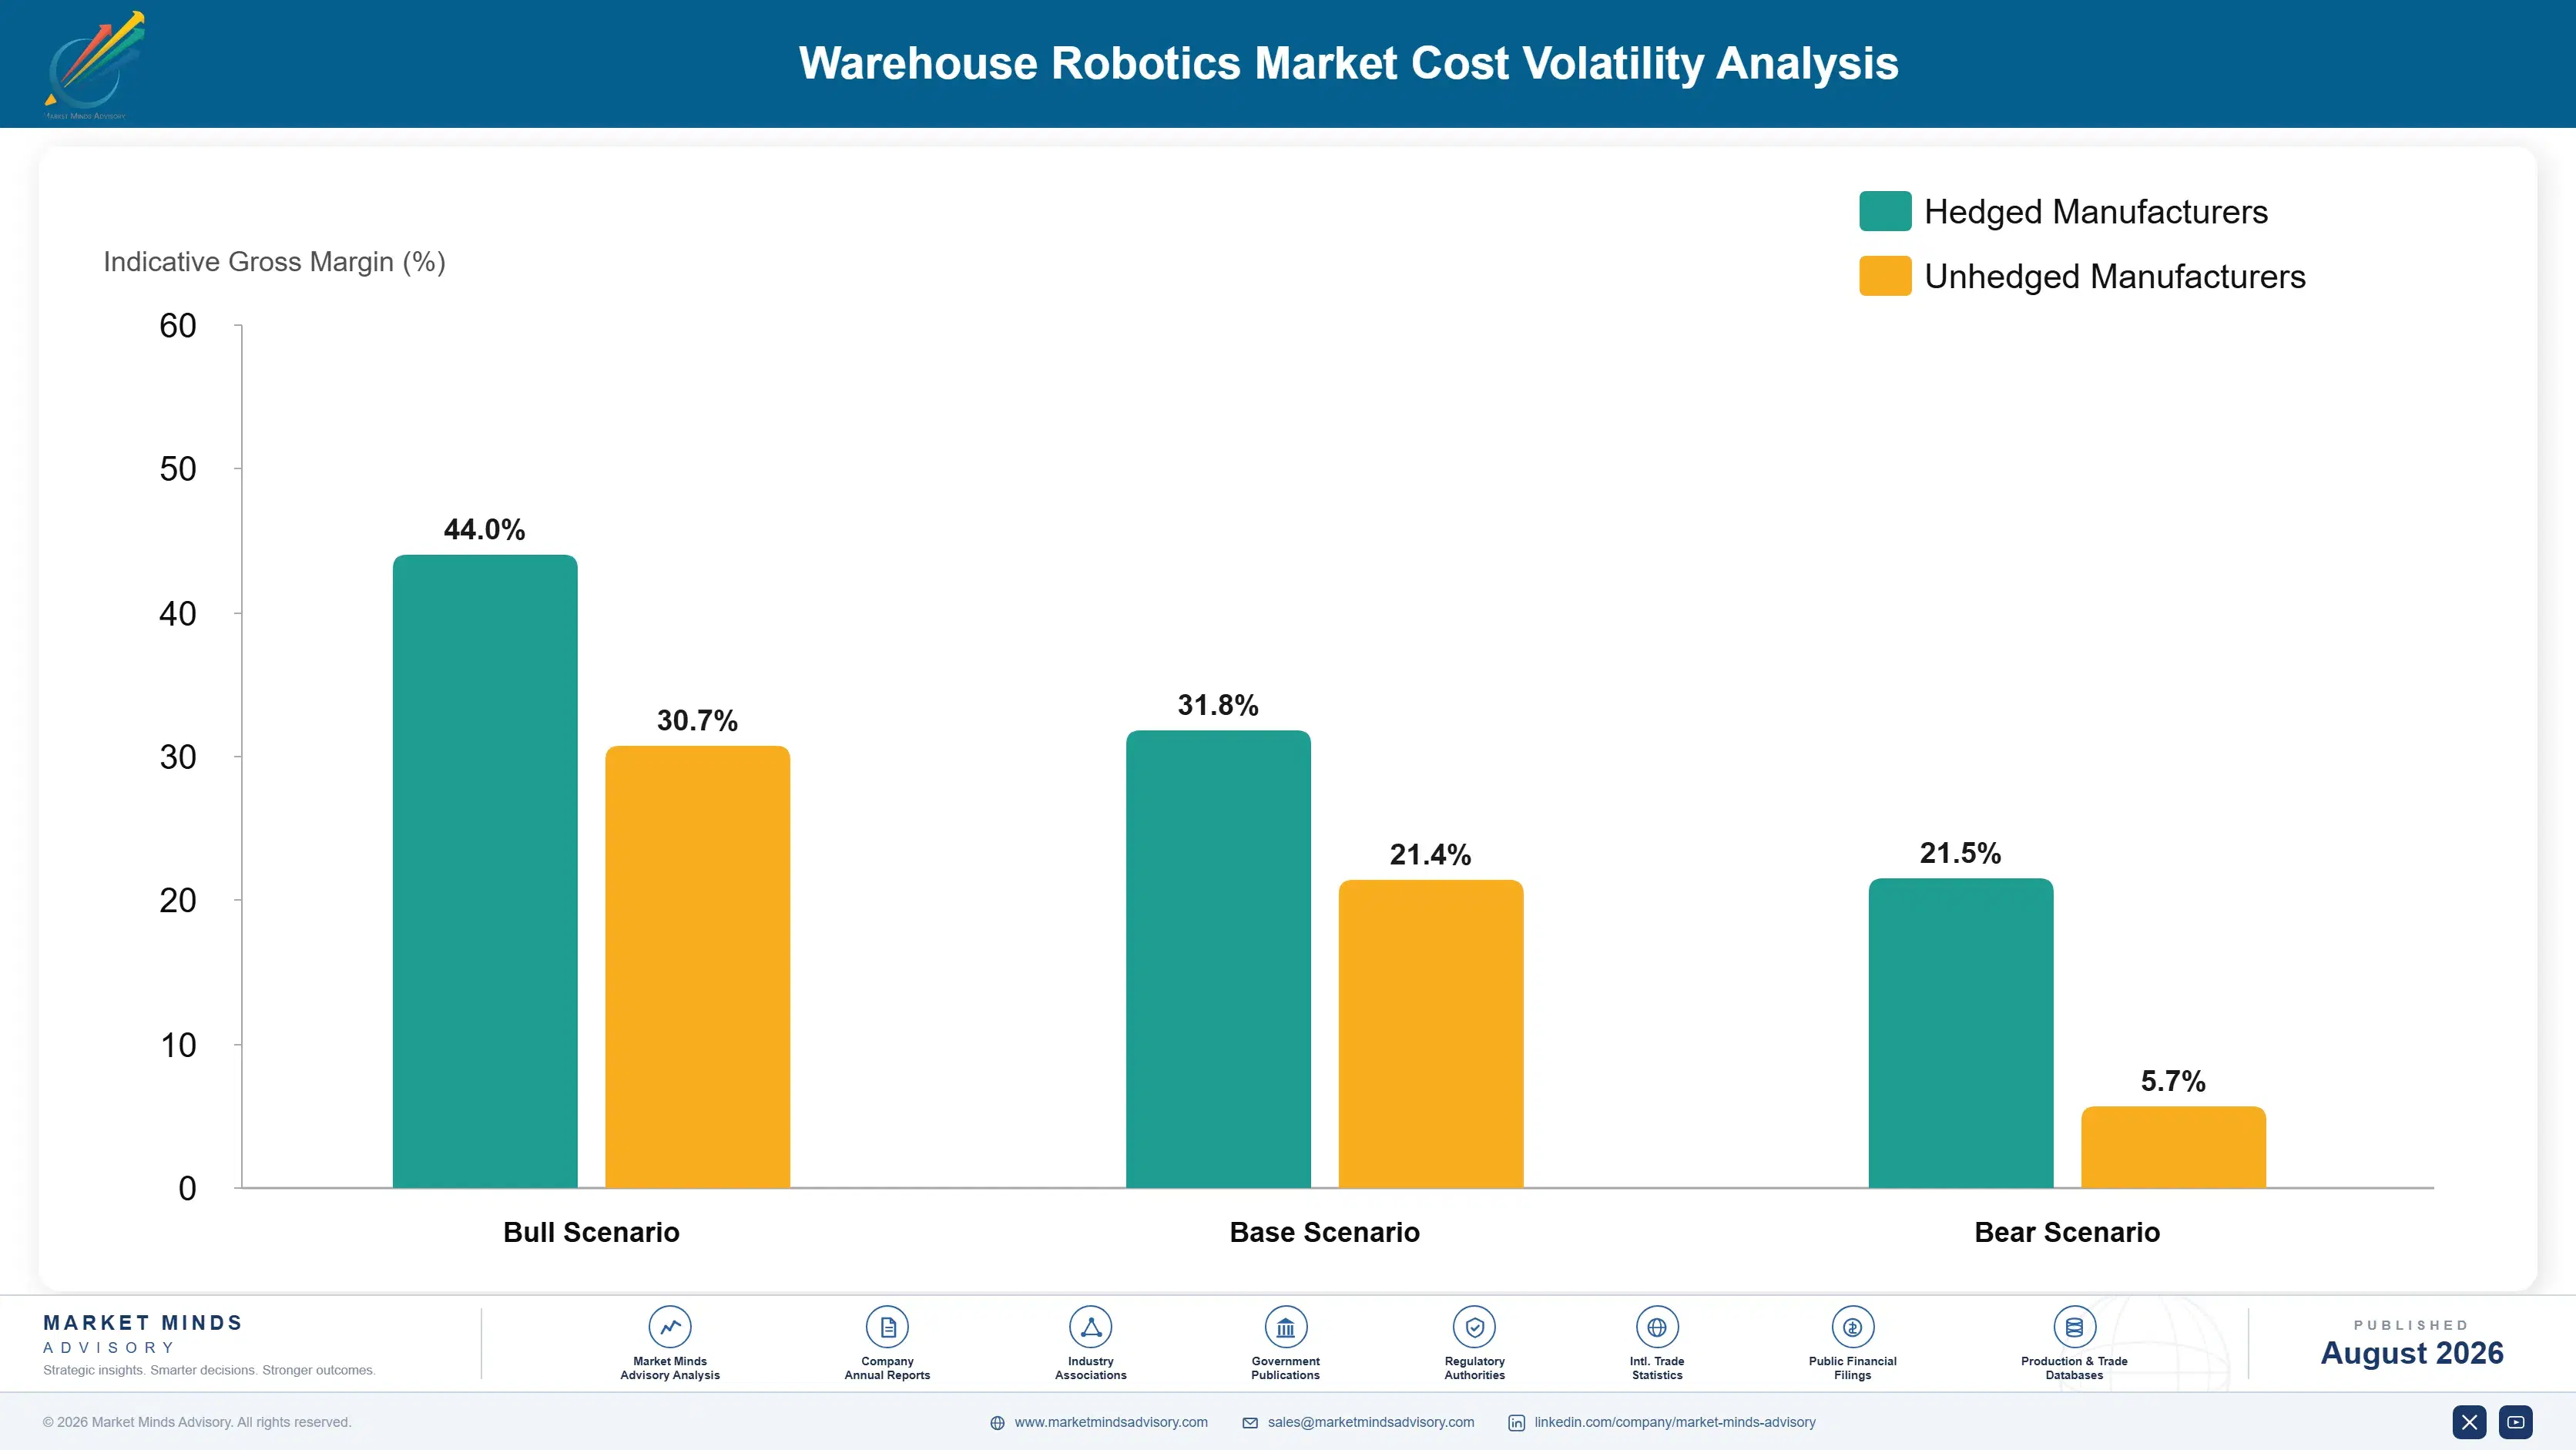
Steel and electronic component costs moved together through 2021 and 2022 with unusual severity. Steel prices rose sharply while semiconductor scarcity extended controller lead times past a year, and suppliers on fixed-price contracts absorbed both. Daifuku and KION both disclosed material cost and supply chain pressure across 2022 reporting. Projects quoted before the inflation and delivered afterwards damaged margin on backlogs that took two years to work through.

Exposure separates by contract structure rather than by scale. A supplier with escalation clauses indexed to steel and component benchmarks passes the largest variable through mechanically. One quoting fixed prices on a project delivering 30 months later carries the full swing across a period nobody can forecast. That difference decided which suppliers emerged from the 2022 inflation intact, and several have rewritten contract templates accordingly since.
warehouse-robotics-market-cost-volatility-analysis-1787324689656

Index long project contracts to steel and component benchmarks

A project quoted today and delivered 30 months later carries material exposure across a period no supplier can forecast, as 2022 demonstrated expensively. Escalation clauses tied to published steel and electronics benchmarks convert that into a mechanical adjustment. Customers resist them, though they concede more readily on long-delivery projects than on short ones, which is where the exposure sits.

Standardise modules across projects rather than engineering each

Bespoke engineering for every installation consumes the scarcest resource in this business and delivers nothing reusable afterwards. Standard modules configured to site requirements convert engineering hours into configuration work and shorten delivery considerably. Buyers now favour modular architecture anyway after the overbuild, which aligns the cost saving with what customers are asking for rather than trading one against the other.

Dual-source drives and controllers at design stage

Controller and drive lead times extended past a year during the semiconductor shortage, stalling projects where a specified part was unavailable. Qualifying alternative components during design costs engineering time once and removes an exposure procurement cannot manage during a shortage. Customers increasingly ask about supply continuity in tender responses, which makes the work commercially visible rather than merely prudent.

Portfolio Architecture for Margin Defence

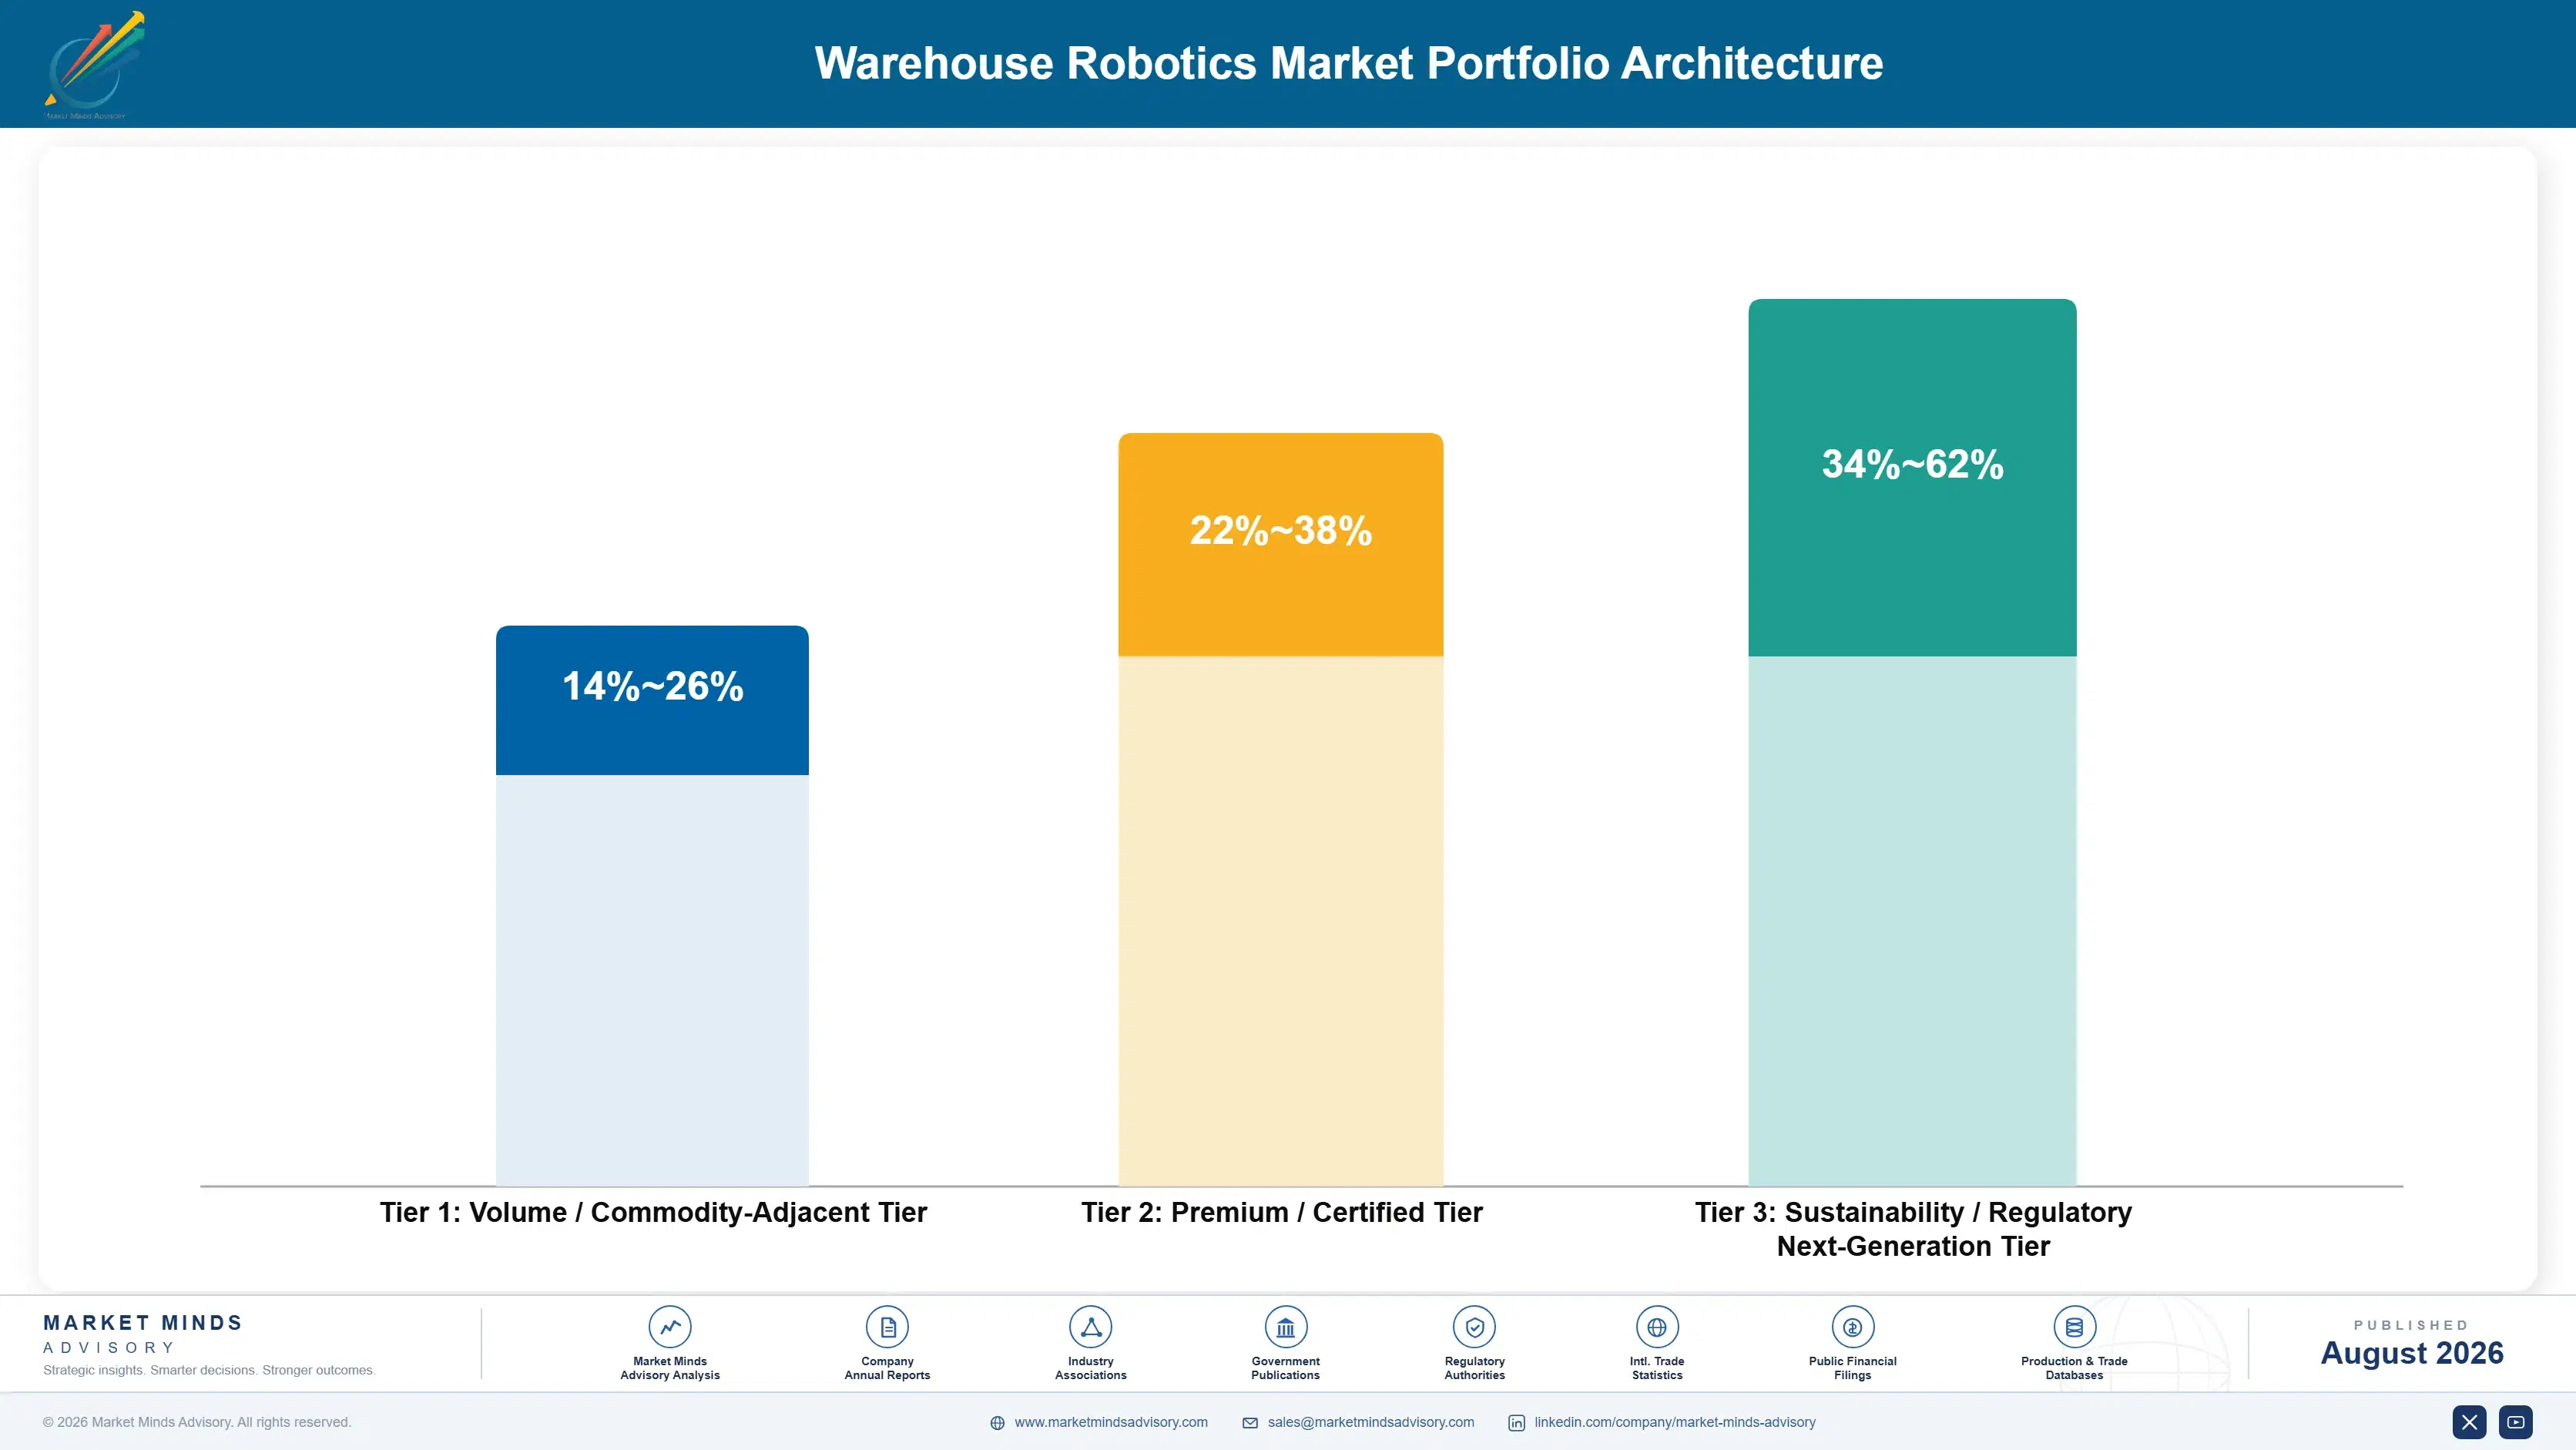
The portfolio splits into three tiers with sharply different economics. Conveyance, sortation, and standard storage hardware form the volume tier, competing on delivered price with margin depending on engineering standardisation. Piece picking and high-density storage earn considerably more because capability and integration both narrow the field. Software, service contracts, and modular reconfiguration sit differently again, priced against the outcome delivered rather than the equipment install
The tension runs between hardware that wins the project and software that determines whether it works. Steel and mechanical content is what the customer sees on the bid, so it establishes the relationship entirely. Yet warehouse control and execution software carries roughly 29% of project value and decides whether designed throughput is ever achieved. Suppliers handling this well price software properly at award rather than discounting it to win the steel.

High-value pools concentrate where capability or duration limits competition: piece picking systems with proven grasp reliability, warehouse execution software that determines achieved throughput, service contracts running decades alongside the installation, and modular architectures buyers now specifically request. All four escape the equipment price comparison. Standard conveyor and sortation hardware sits at the other end, competing against every integrator able to specify comparable components.

Volume / Commodity-Adjacent Tier

Conveyance, standard sortation, pallet handling, and conventional racking-based storage systems. The range is wide because engineering standardisation varies enormously between suppliers and bespoke design for every project destroys margin that modular builders retain.
Gross Margin: 14-26%

Premium / Certified Tier

High-density automated storage, cube systems, palletising robotics, and integrated goods-to-person installations. The range is wide because project complexity and competitive intensity vary considerably by facility type and regional supplier density.
Gross Margin: 22-38%

Sustainability / Regulatory / Next-Generation Tier

Robotic piece picking, warehouse execution software, long-term service contracts, and modular reconfigurable architectures. The range is wide because software and service earn strongly while piece picking still carries development cost against uncertain deployment volumes.
Gross Margin: 34-62%
warehouse-robotics-market-portfolio-architecture-1787324690148

High-value Sub-segments and Strategic Watch-out

Robotic Piece Picking Systems

High value and high growth at 18.6%, the fastest function, addressing the most labour-intensive operation in fulfilment at roughly 98% grasp accuracy. Remaining failures require human intervention, so workflow design around exception handling matters as much as the robot itself does. Grocery and pharmaceutical fulfilment are adopting fastest.
Gross Margin: 34-58%

Automated Storage and Retrieval Systems

High value with strong growth at 12.4%, driven by land scarcity rather than labour cost across constrained metropolitan regions. Cube storage has grown fastest on modular architecture that suits phased deployment, which addresses the flexibility concern the overbuild created. Design freeze risk applies most acutely here.
Gross Margin: 24-40%

Automated Sortation and Conveyance

The volume core by revenue, growing at 9.6% across parcel, retail, and manufacturing distribution everywhere. Steady in aggregate but competing on delivered price against every integrator able to specify comparable components, which keeps margin persistently thin here. Standardisation is the only route to acceptable margin.
Gross Margin: 14-26%

Palletising and Depalletising Robots

The strategic watch-out, growing at 8.8% on a mature technology where general-purpose robot arms from Fanuc and ABB have commoditised most of the capability. Integration and gripper design remain the only differentiation, and both are widely available now. Differentiation has narrowed to integration alone now.
Gross Margin: 18-32%

How Automation Projects Actually Repeat

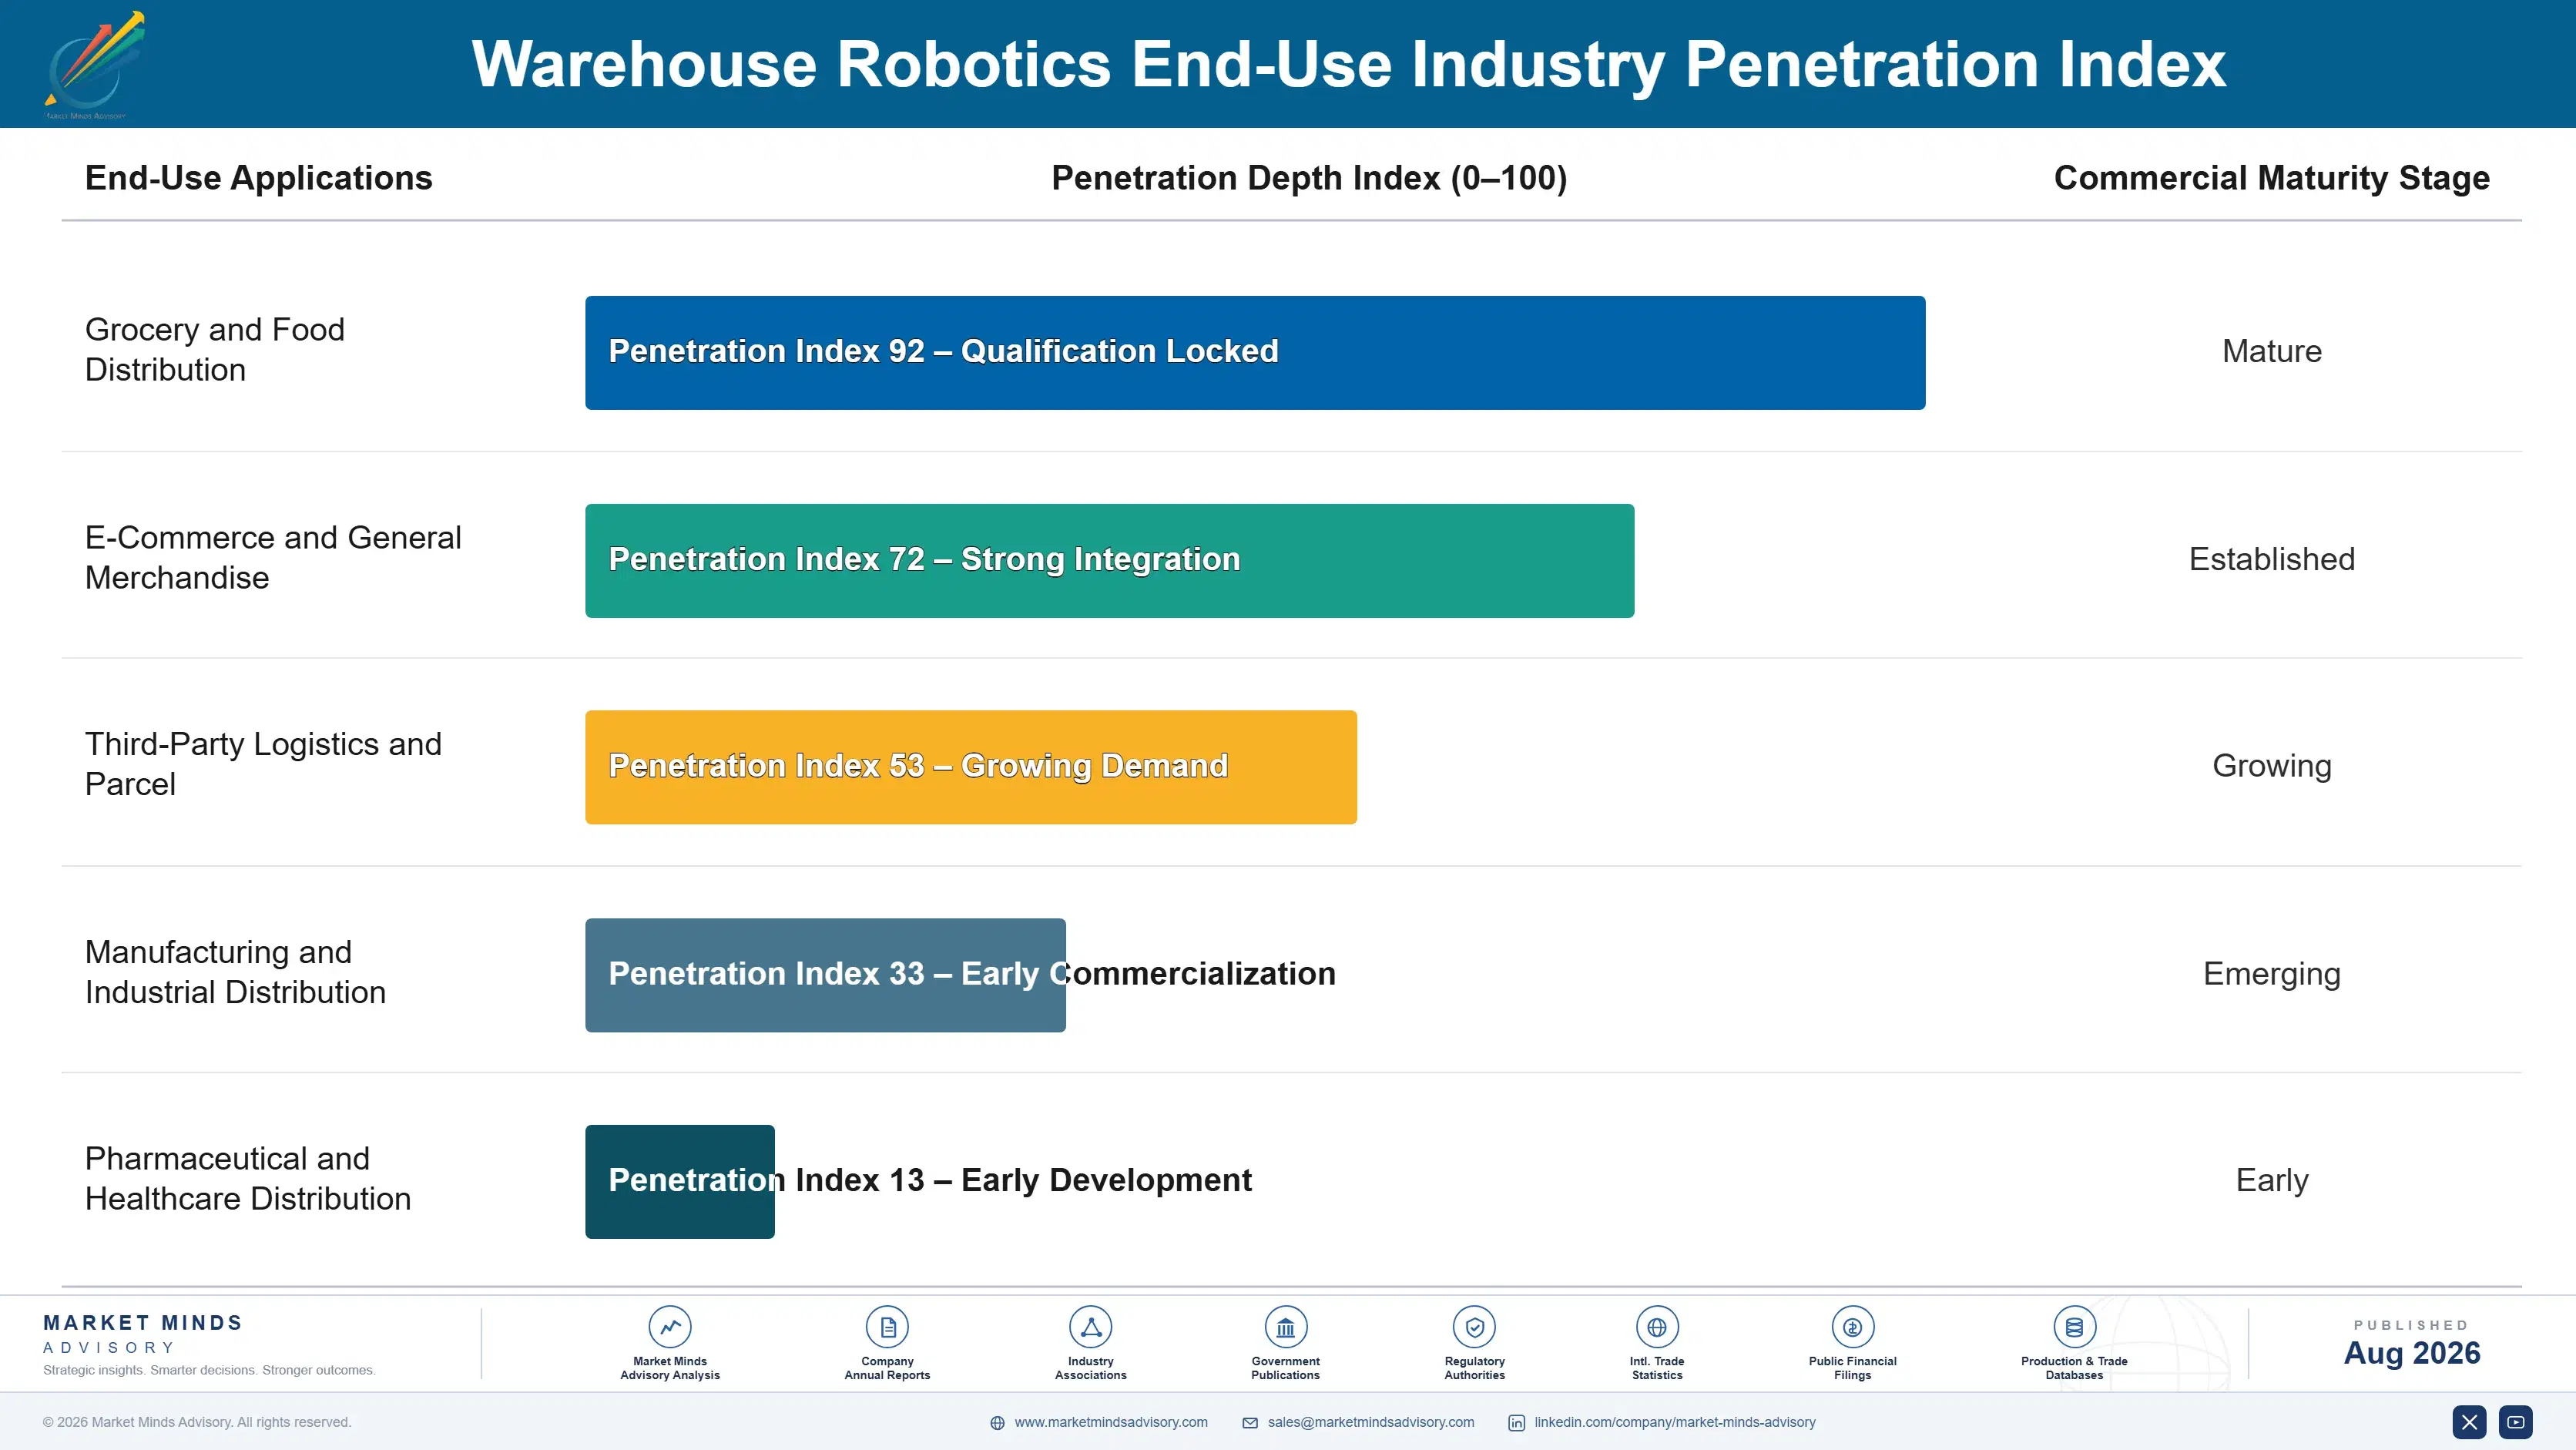
Demand commits once per facility and repeats across the estate. An operator running a successful installation replicates the design at the next site because the engineering and process work are already done, which makes the first project disproportionately valuable. Losing it usually means losing every subsequent facility that operator builds. Service then generates revenue across the 15 to 25 year installed life, which is the annuity behind a lumpy project business.
Stickiness varies sharply by system layer. Warehouse execution software sticks hardest, since it integrates with enterprise systems and controls every piece of hardware in the building. High-density storage sticks through the building design it is embedded in. Piece picking sticks through workflow and exception handling built around it. Conveyance and sortation stick least, since components are interchangeable and integrators replace them at refurbishment.

Buyer profiles have moved from logistics engineering toward supply chain directors and finance functions weighing capital allocation against alternatives with faster payback. The overbuild changed the questions permanently, from peak throughput toward what happens if volumes fall. Younger operations leaders also treat automation as one option alongside mobile robotics and labour rather than an inevitable progression, which is a harder sale than the industry expected.
warehouse-robotics-market-end-use-penetration-index-1787324690636

Our Call On Warehouse Robotics

These are among the four positions where our research anticipates prominent divergence between winners and laggards over the coming forecast period. Each is grounded in the demand model, the regulatory perimeter, and the announced capacity pipeline.
01 / FLEXIBILITY BEATS THROUGHPUT

Buyers who wrote off capacity now ask different questions

A fixed system is designed into the building and operated for 15 to 25 years, so the throughput and item assumptions made at design freeze govern operations far longer than any business plan realistically survives. The 2021 overbuild proved that expensively across several major retailers at once, and specification behaviour changed permanently in response. Suppliers should lead with modular architecture, phased deployment, and genuine reconfiguration paths, because peak rate figures now answer a question that buyers have largely stopped asking altogether.
02 / PICKING CARRIES THE CASE

Grasp reliability finally made the labour argument direct

Robotic piece picking has reached roughly 98% grasp accuracy across mixed item populations including deformable packaging and transparent film, which took a decade longer than the early demonstrations suggested it would. Each installation displaces more labour than any other automation function, so the business case writes itself in operations rather than needing finance to believe any productivity forecast at all. Suppliers should lead proposals with picking rather than storage, because labour arithmetic gets projects approved and storage generally follows along behind it.
03 / SOFTWARE DECIDES PERFORMANCE

Hardware wins the bid, execution software delivers throughput

Warehouse control and execution software carries roughly 29% of project value and determines whether installed hardware ever achieves its designed rate, which is where most underperforming projects actually end up failing. Suppliers discounting software to win the mechanical scope surrender the margin and the differentiation together, then get blamed for throughput that the hardware alone could never have delivered. Software should be priced properly at award, since the customer is comparing total delivered performance rather than steel tonnage in any case.
04 / CAPITAL APPROVAL DECIDES

Structure around the board rather than arguing with it

Projects exceeding 100 million dollars compete for capital against store refurbishment, inventory, and acquisitions carrying far faster payback periods, and boards remain notably cautious after writing off capacity once already. Automation-as-a-service structures, throughput-linked payment, and phased deployment matched to capital availability route around that contest entirely by moving spend into operating budgets or deferring the commitment. Suppliers able to carry that balance sheet exposure close faster and exclude smaller competitors from those same opportunities entirely, which is the real advantage.

Engagement Snapshot From the Field

A live engagement with an industry participant carrying material or product regulatory and market exposure ahead of a defining policy shift, showing how our research translates into a defensible multi-year portfolio strategy.
MARKET MINDS ADVISORY · CLIENT ENGAGEMENT SUMMARY
Warehouse Robotics Producer Strategic Portfolio Review and Transition Roadmap 2026·Investment Scenario on Warehouse Robotics Exposure Evaluation 2025-26
CLIENT PROFILE
A European grocery retailer operating 640 stores and two automated fulfilment centres engaged MMA after online order growth stalled below the volumes its automation had been sized against. The client reported that both facilities ran at roughly 61% of designed throughput, with capital committed against volume forecasts made in 2021 that had never materialised (client-reported, unverified by MMA).
STRATEGIC CHALLENGE
A third facility was contracted and approaching design freeze, sized on the same forecasts that had already proven wrong twice. Meanwhile store-based picking remained cheaper per order at current volumes, which nobody internally wanted to say out loud after the capital already committed. The board needed to decide whether to proceed, resize, or cancel before the freeze made the choice irreversible.
MMA APPROACH
MMA rebuilt cost per order across both existing facilities and store picking at realistic volume ranges rather than at designed capacity, which internal reporting had never compared directly. We assessed whether the contracted third facility could be resized or phased within the existing agreement. We then modelled modular and hybrid configurations against the fixed design already specified, testing each across a range of demand outcomes.
KEY FINDINGS
  1. Both facilities were profitable per order above roughly 70% utilisation and loss-making below it, and neither had reached that threshold since opening (client-reported, unverified by MMA).
  2. The contracted third facility could be phased into two stages within the existing agreement, deferring about 45% of capital until volumes justified it.
  3. Store picking remained cheaper per order below a defined volume threshold, which the automation business case had never acknowledged explicitly at any stage.
  4. A modular configuration cost roughly 8% more initially but held value across every demand scenario tested rather than only the optimistic one (client-reported, unverified by MMA).
CLIENT PROFILE
A European grocery retailer operating 640 stores and two automated fulfilment centres engaged MMA after online order growth stalled below the volumes its automation had been sized against. The client reported that both facilities ran at roughly 61% of designed throughput, with capital committed against volume forecasts made in 2021 that had never materialised (client-reported, unverified by MMA).
STRATEGIC CHALLENGE
A third facility was contracted and approaching design freeze, sized on the same forecasts that had already proven wrong twice. Meanwhile store-based picking remained cheaper per order at current volumes, which nobody internally wanted to say out loud after the capital already committed. The board needed to decide whether to proceed, resize, or cancel before the freeze made the choice irreversible.
MMA APPROACH
MMA rebuilt cost per order across both existing facilities and store picking at realistic volume ranges rather than at designed capacity, which internal reporting had never compared directly. We assessed whether the contracted third facility could be resized or phased within the existing agreement. We then modelled modular and hybrid configurations against the fixed design already specified, testing each across a range of demand outcomes.
KEY FINDINGS
  1. Both facilities were profitable per order above roughly 70% utilisation and loss-making below it, and neither had reached that threshold since opening (client-reported, unverified by MMA).
  2. The contracted third facility could be phased into two stages within the existing agreement, deferring about 45% of capital until volumes justified it.
  3. Store picking remained cheaper per order below a defined volume threshold, which the automation business case had never acknowledged explicitly at any stage.
  4. A modular configuration cost roughly 8% more initially but held value across every demand scenario tested rather than only the optimistic one (client-reported, unverified by MMA).
RECOMMENDED STRATEGY
Phase 1: Phase 1 (0 to 6 months): Renegotiate the third facility into phased delivery before design freeze rather than proceeding at full specified scale. Phase 2: Phase 2 (6 to 20 months): Redirect volume toward existing facilities to push both above the utilisation threshold where they become profitable. Phase 3: Phase 3 (20 to 34 months): Specify modular architecture on all future automation and retain store picking below the defined volume threshold.
OUTCOME
The client phased the third facility and deferred a substantial share of capital without losing the delivery slot. Volume redirection lifted both existing sites above their profitability threshold within a year, and modular specification became standard on all subsequent automation projects the group commissioned (client-reported, unverified by MMA).

Frequently Asked Questions

Foundational context covering the market sizes, CAGR, scope, country, region and competition that inform every finding below. This section is provided to cover basics and most often pre-purchase conversations, answered from the MMA Primary Research Dataset.

What is the current size of the Warehouse Robotics Market?

The global warehouse robotics market is valued at USD 22.7 billion in 2025, covering automated storage and retrieval, piece picking, palletising, sortation and conveyance, and the control software supplied with them. Autonomous mobile robots are excluded.

How large will the Warehouse Robotics Market be by 2036?

The market is forecast to reach USD 72.96 billion by 2036 in the base case, about 2.89 times the 2026 level. That represents incremental value of roughly USD 47.72 billion across the decade.

What is the CAGR for the Warehouse Robotics Market 2026 to 2036?

The market grows at an 11.2% CAGR in the base case, with bull and bear scenarios at 12.5% and 9.9%. The spread turns mainly on piece picking deployment and how cautious capital approval remains.

Which segment is growing fastest?

Robotic piece picking systems grow fastest at 18.6%, about 1.66 times the overall rate, now that grasp accuracy handles the item variety real warehouses contain. Automated storage and retrieval follows at 12.4%.

Who are the major companies in the Warehouse Robotics Market?

Leading suppliers include Daifuku, Dematic, SSI Schaefer, Knapp, and Vanderlande. Concentration is moderate, with the top five holding roughly 38% of installed system value above a deep integrator layer.

Which country is growing fastest?

India grows fastest at a 19.4% CAGR, as retail, e-commerce, and logistics operators build distribution capacity designed around automation from the outset. China follows on construction volume at far greater scale.

Report Segmentation Architecture

The full report scope spans multiple orthogonal segmentation dimensions, with cross-tabulated demand data provided for each dimension pair. Coverage extends further to regional breakdowns, trend trajectories, and the competitive detail needed to support segment-level decision-making.

By System Function

  • Automated Storage and Retrieval Systems
  • Robotic Piece Picking Systems
  • Palletising and Depalletising Robots
  • Automated Sortation and Conveyance
  • Warehouse Control and Execution Software

By End-Use Industry

  • Grocery and Food Distribution
  • E-Commerce and General Merchandise
  • Third-Party Logistics and Parcel
  • Manufacturing and Industrial Distribution
  • Pharmaceutical and Healthcare Distribution

By Commercial Model

  • Turnkey Capital Purchase
  • Automation-as-a-Service Subscription
  • Phased Deployment Contract
  • Integrator Delivered Project

By Region

  • North America
  • Western Europe
  • East Asia
  • South Asia and Pacific
  • Latin America
  • Middle East and Africa
  • Eastern Europe

Scope, Methodology, and Coverage

Every figure in this report is reproducible from documented input assumptions. The scope below maps the historical period, the forecast horizon, the segmentation dimensions, and the countries covered, alongside the underlying primary and qualitative methodology.
Historical Period
2020 to 2025
Forecast Period
2026 to 2036
Base Year
2025 (USD billions; MMA Primary Research Dataset, August 2026)
Market Definition
The warehouse robotics market comprises fixed and semi-fixed automated systems installed within storage, distribution, and fulfilment facilities to move, store, sort, and handle goods, valued at supplier revenue from equipment, software, installation, and service. It spans automated storage and retrieval systems including shuttle, cube, and crane-based designs, robotic piece picking systems, palletising and depalletising robots, automated sortation and conveyance systems, and the warehouse control and execution software supplied as part of those installations. Autonomous mobile robots navigating without fixed guidance infrastructure, forklifts and manually operated material handling equipment, static racking sold without automation, standalone warehouse management software sold independently of a system, and the warehouse buildings and land themselves are excluded.
Quantitative Units
USD billions (current prices); installed systems and throughput in units per hour where applicable
Segmentation Dimensions
By System Function; By End-Use Industry; By Commercial Model; By Region
Regions Covered
North America, Western Europe, East Asia, South Asia and Pacific, Latin America, Middle East and Africa, Eastern Europe
Countries Covered
USA, China, Germany, France, UK, Japan, South Korea, India, Australia, Canada, Brazil, Mexico, Indonesia, Vietnam, Thailand, Malaysia, UAE, Saudi Arabia, South Africa, Nigeria, Turkey, Poland, Netherlands, Italy, Spain, Sweden, Switzerland, Argentina, Colombia, Singapore, and additional markets relevant to this sector
Key Companies Profiled
Daifuku, Dematic, SSI Schaefer, Knapp, Vanderlande, AutoStore, Honeywell Intelligrated, Swisslog, TGW Logistics, Murata Machinery, Beumer Group, Witron, Ocado Technology, Exotec, Berkshire Grey, RightHand Robotics, Fanuc, ABB Robotics, Kardex, Hai Robotics
Quantitative Methodology
Primary survey, n=3,800 respondents, Q4 2025, six countries; demand-side model with trade association cross-validation
Qualitative Methodology
47 expert interviews, Q4 2025; applied to validate demand model assumptions, identify emerging dynamics, and assess competitive positioning
Report Format
PDF and XLSX data workbook (Word format preview document)
Publisher
Market Minds Advisory
Report Code
MMA-2026-TEC-218
Published
August 2026
Contact
sales@marketmindsadvisory.com | www.marketmindsadvisory.com

Purchase the full Warehouse Robotics Market Report (2026 to 2036).

The full MMA Warehouse Robotics report sizes the market across five system functions, five end-use industries, four commercial models, and seven regions through 2036. It profiles 20 suppliers on a consistent basis of fixed warehouse automation system, software, and service revenue, scoring each on project delivery capability, software depth, service network density, and modular architecture maturity. Scenario models quantify how labour scarcity, piece picking adoption, and capital availability move both installation volume and achievable margin by function. The report also includes utilisation threshold modelling against facility profitability, design freeze risk assessment by item profile volatility, piece picking reliability benchmarking, and automation-as-a-service structure comparison for suppliers and operators.
Five-function and four-model market sizing to 2036
Twenty-supplier benchmark on fixed warehouse automation revenue
Utilisation threshold modelling against facility profitability by segment
Design freeze risk assessment against item profile and volume volatility
Piece picking grasp reliability benchmarking across item populations
Automation-as-a-service structure comparison against capital purchase

Built For The People Who Decide

From boardroom strategy to bench-side execution, this report is read cover-to-cover by leaders shaping the next decade of their industry, turning demand scenarios, market dynamics and valuation benchmarks into decisions.
CXOs/ Presidents/ VPs/ Managers
M&A and Corporate Development
Strategy Teams and R&D Heads
Procurement and Product Directors
Regulatory and Compliance Leaders
Investor Relations and Equity Analysts