Market Minds Advisory
VR Stroke Rehabilitation Market

VR Stroke Rehabilitation Market: VR Stroke Rehabilitation: Fifteen Years Answering The Wrong Question About The Arm

The field spent fifteen years proving virtual reality matches conventional arm therapy, which was never the interesting question, while the deficit affecting three in five survivors went almost entirely untreated.

Lead Analyst

Published

August 2026

Make Smarter Decisions with Customized Research Insights

Request a free sample report and evaluate market opportunities, growth trends, and competitive dynamics relevant to your business needs.

2025 MARKET VALUE$0.3BMarket Size 2025
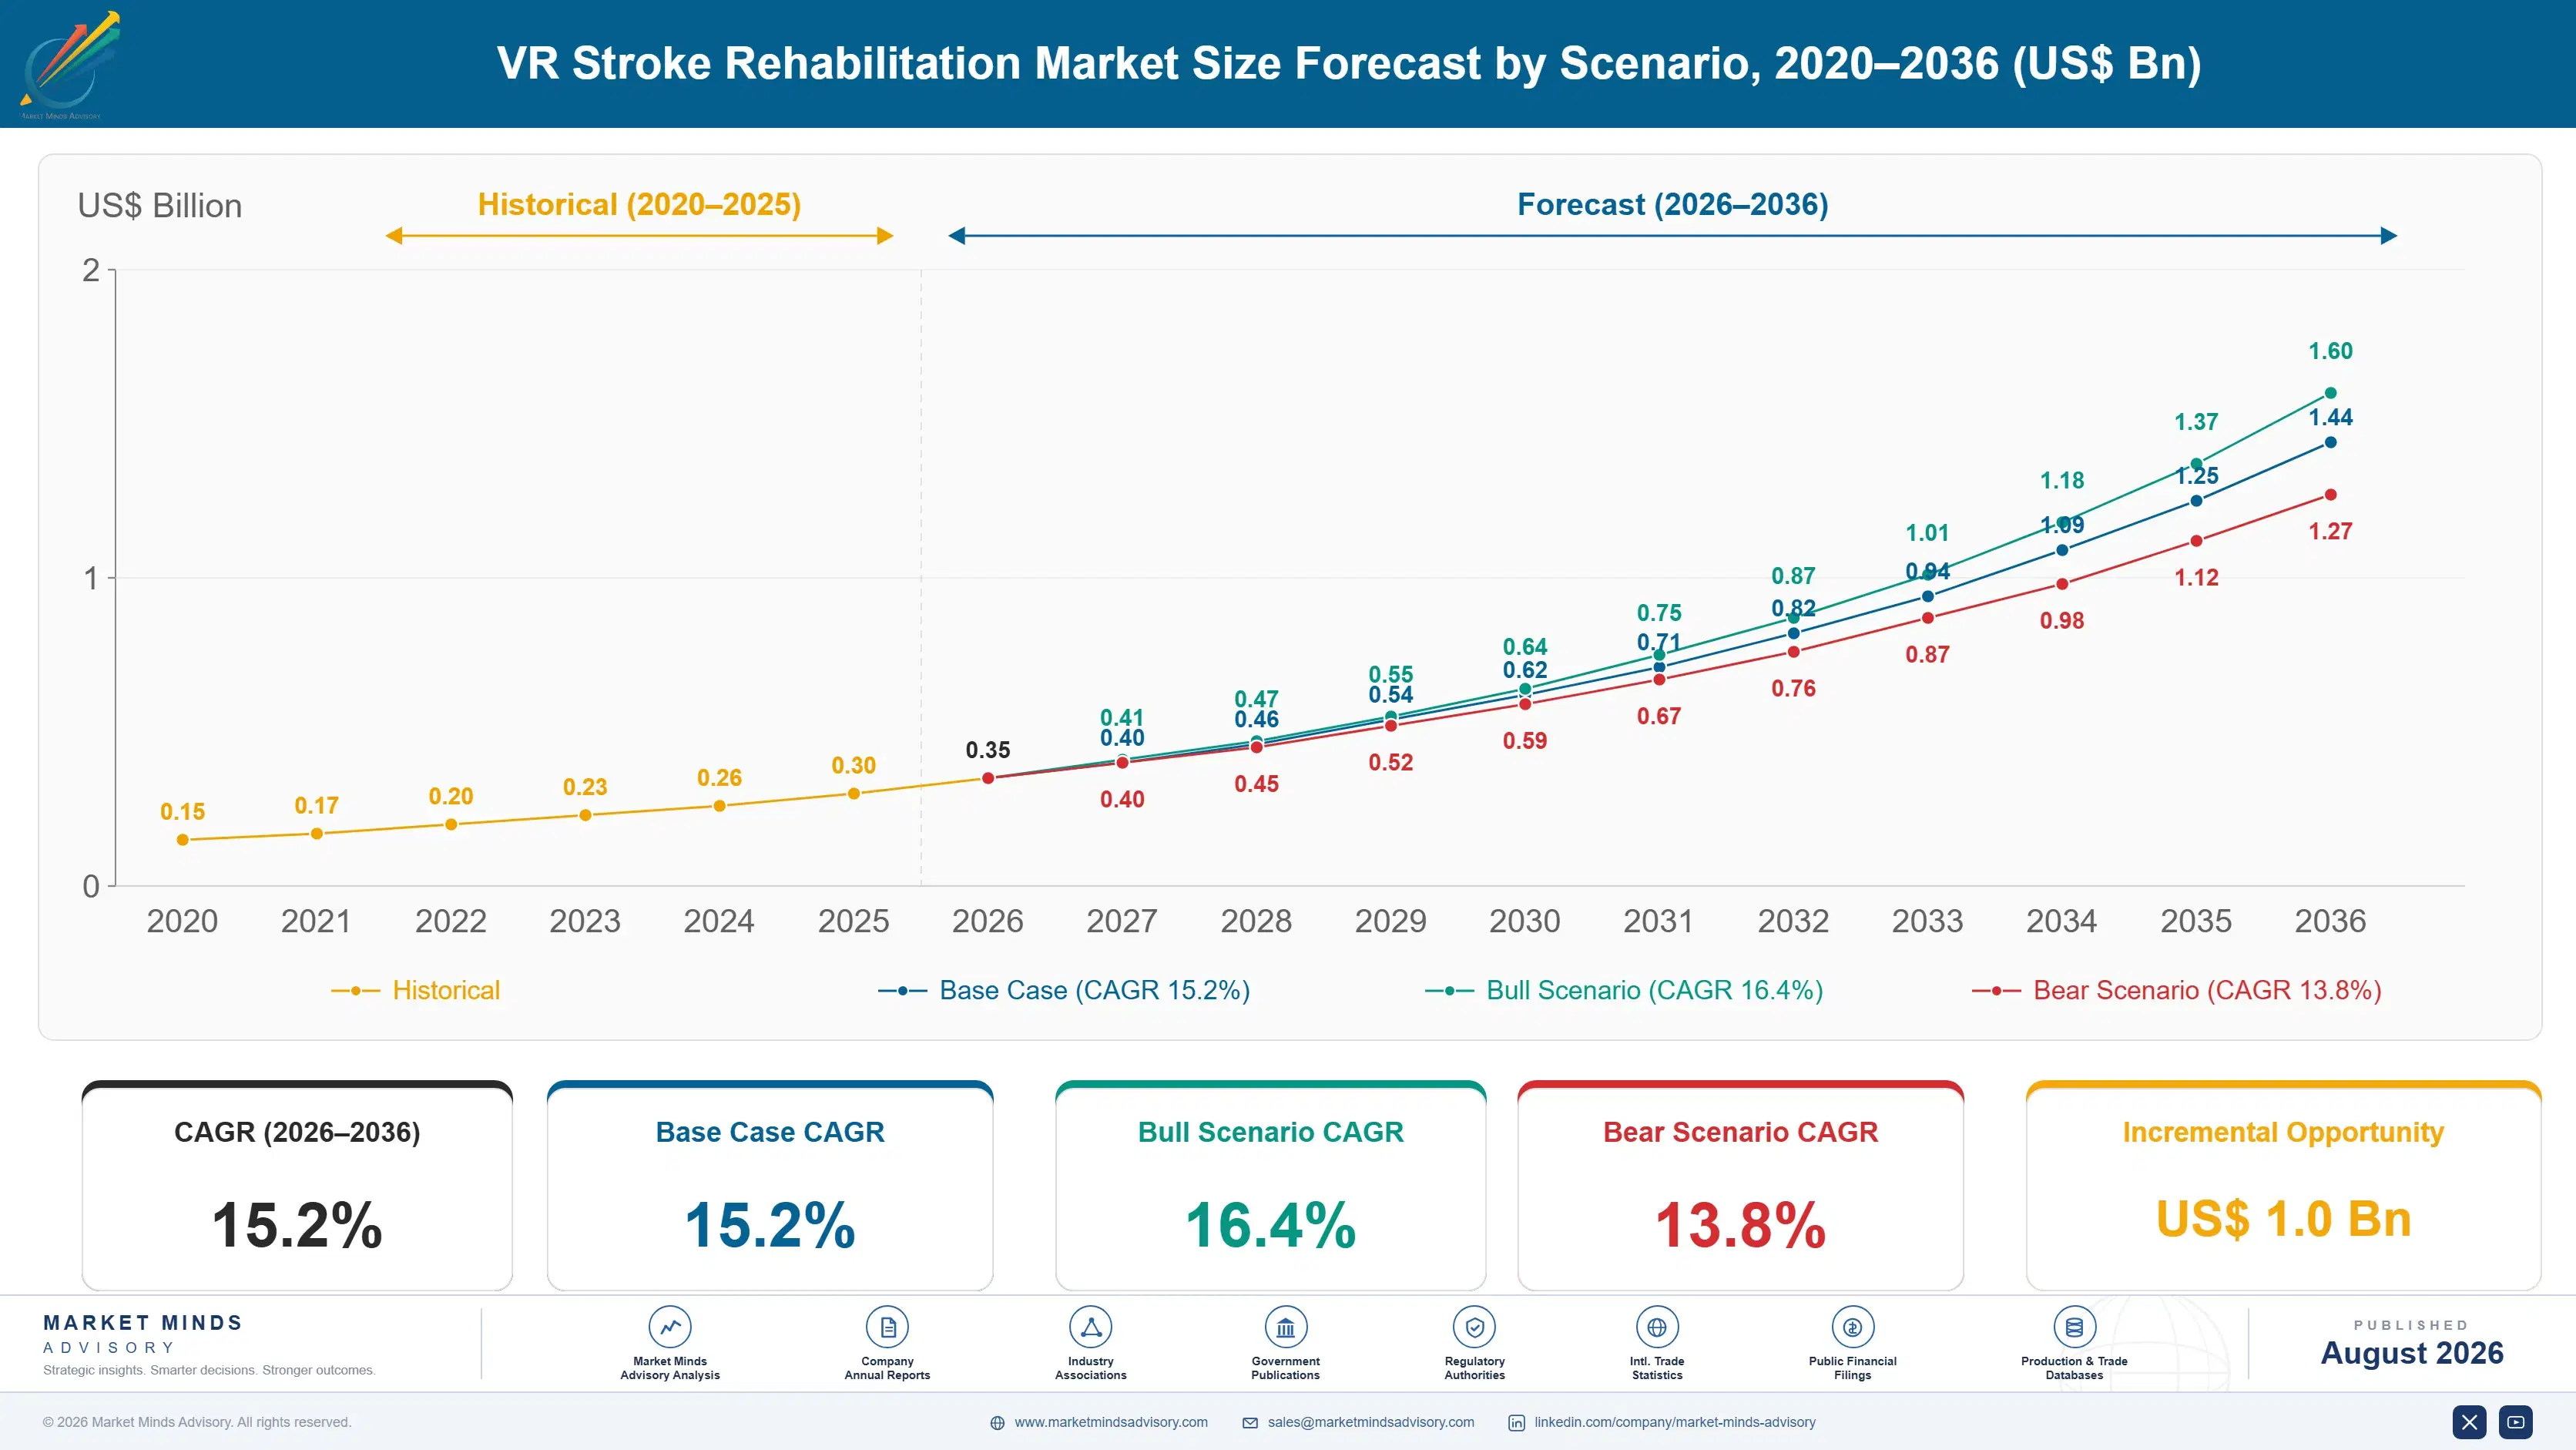
2036 FORECAST VALUE$1.4BBase Case , 2026 to 2036
CAGR 2026 TO 203615.2 %Bull 16.4% / Bear 13.8%
INCREMENTAL OPPORTUNITY$1.0BNet 10- year value creation
EXPANSION MULTIPLE4.12x2036 value over 2026 base
Strategic Levers
M&A Pipeline
Regional Outlook
Country Rankings
Competitive Intelligence
Segmental Deep-dive
Call-Us : 91 93563 13602

Executive Snapshot and Market Trajectory.

Fifteen years of trials established that virtual reality matches conventional therapy for arm movement. That was never the interesting question, because motor rehabilitation has good tools and a workforce trained to deliver them. The argument for VR there is dose, not capability, and dose is a scheduling problem.
Where the technology does something nothing else can is ecological validity. Putting a survivor in a simulated supermarket, kitchen or road crossing trains executive function that a tabletop task in a clinic room cannot touch at all. Roughly 60% of survivors carry measurable cognitive deficit and it remains the least treated consequence of stroke. Cognitive rehabilitation grows at 22.8%, half again the market rate.
The binding constraint is payment rather than proof. Only about 9% of national payers hold a dedicated code for immersive therapy, so systems are bought from capital budgets and research grants, and grant funded equipment does not get replaced when it ages. Competition is fragmented at 34% for the top five. China grows at 19.8% as rehabilitation capacity is built rather than converted. Capacity built rather than converted leaves no incumbent to displace.
Market Definition
Virtual and mixed reality systems used in clinical rehabilitation of stroke survivors, covering immersive and non-immersive hardware, haptic peripherals, clinical software platforms and remote monitoring services delivered under a prescribed rehabilitation pathway. Measured at supplier revenue. Robotic exoskeletons and end-effector robots without VR content, functional electrical stimulation devices, general neurological assessment equipment, and consumer gaming hardware sold outside a clinical pathway are excluded.
Base Year Value
$0.3B in 2025 (MMA Primary Research Dataset, August 2026)
Forecast Period
2026 to 2036, eleven discrete annual values
CAGR
15.2% base case. Bull 16.4%. Bear 13.8%.
Fastest Growth Segment
Cognitive and Executive Function Rehabilitation: 22.8% CAGR
Fastest Growth Country
China: 19.8% CAGR
Fastest Growth Region
South Asia and Pacific: 17.6% CAGR
Largest Region
East Asia: 32% of 2025 global value
Market Leaders
MindMaze, Penumbra, XRHealth, CUREosity, Neuro Rehab VR. Source: MMA Primary Research Dataset, July 2026.
Primary Survey
n=3,800 procurement and R&D decision-makers, Q4 2025, six countries
Methodology
Demand-side build-up, cross-validated against public data, 47 expert interviews

VR Stroke Rehabilitation Market Forecast Scenarios

vr-stroke-rehabilitation-market-size-forecast-scenario-1787664826138
The five years to 2025 were an evidence building period that generated more published data than most rehabilitation technology has assembled, and little reimbursement to go with it. Consumer headset costs collapsed, which removed the hardware barrier and exposed the payment one. The 13.8% historical rate came from research grant purchasing and from a small number of hospital systems buying ahead of any payer decision.
The 15.2% base case rests on three mechanisms. Cognitive and executive function rehabilitation grows at 22.8% as the field moves toward the deficit that conventional therapy handles least well and that affects roughly three in five survivors. Home delivery expands where remote clinician monitoring is built in, since that is what holds adherence. And Chinese rehabilitation capacity keeps building at 19.8%, with equipment specified during facility planning rather than added later.
The 16.4% bull case turns on a major payer establishing a dedicated reimbursement code for immersive rehabilitation, which would move purchasing from capital budgets into operating ones and change the replacement cycle entirely. The 13.8% bear case is home adherence: only about 38% of patients complete prescribed sessions without remote monitoring, and a home programme nobody finishes produces no outcome data worth paying for.

The Deficit That Nobody Was Measuring

The research question the field chose was whether virtual reality matches conventional therapy for upper limb recovery, and after fifteen years the answer is yes. That finding is less useful than it looks. Motor rehabilitation already has established techniques and therapists trained to deliver them, so matching the standard buys a purchasing argument about dose and engagement rather than capability. Nobody replaces a working method with an equivalent one.
TOP FIVE CONCENTRATION34%Combined installed base held by the leading suppliers
COGNITIVE IMPAIRMENT PREVALENCE60%Stroke survivors carrying measurable cognitive deficit after discharge
WEEKLY CLINIC CONTACT3 hoursSupervised therapy time available in typical outpatient pathways
DEDICATED REIMBURSEMENT COVERAGE9%National payers with a specific code for immersive therapy
UNSUPERVISED HOME ADHERENCE38%Patients completing prescribed sessions without remote clinician monitoring
SOFTWARE REVENUE SHARE44%Supplier turnover from licences rather than hardware sales
The genuine advantage is ecological validity, and it applies to a deficit the field ignored. A simulated supermarket, kitchen or road crossing trains executive function under conditions a clinic tabletop task cannot reproduce, and roughly 60% of survivors leave hospital with measurable cognitive impairment. That impairment predicts return to work and independent living more than grip strength does, and it receives a fraction of the therapy time.
Payment rather than evidence is what holds the market back. Around 9% of payers maintain a dedicated code for immersive rehabilitation, which pushes purchasing into capital budgets and research grants. Grant funded equipment has a failure mode: it arrives, it gets used while the study runs, and nobody replaces it because no line item exists. The installed base ages quietly and buys nothing.
"The field measured what was easy to measure, which was arm movement, and built products for it. Meanwhile the thing that decides whether somebody goes back to work was sitting in the notes as a single word: cognition."
Director, Digital Health and Rehabilitation Technology Practice · MMA Medical Devices and Digital Health Practice · August 2026

Market Trends

Cognitive Rehabilitation Overtakes Motor As The Commercial Case

Roughly 60% of stroke survivors leave hospital with measurable cognitive impairment, and it predicts return to work and independent living more reliably than motor recovery does. Conventional therapy addresses it with tabletop tasks in clinic rooms that bear no resemblance to the situations where the deficit actually shows. Simulated supermarkets, kitchens and road crossings reproduce those conditions directly, which is something no other modality can do at any price. Cognitive rehabilitation grows at 22.8% against a market rate of 15.2%, the fastest segment by a clear margin. Nobody else can reproduce it.
Market Impact: China grows at 19.8% annually
Software Licensing Displaces Hardware As The Revenue Model

Consumer headset prices collapsed over the past five years, which removed hardware margin as a viable business and forced suppliers toward content and platform licensing instead. Software already accounts for 44% of supplier revenue and the share keeps rising. That shift suits clinical customers, who prefer operating expenditure to capital in a market where only about 9% of national payers hold a dedicated code. It also exposes suppliers to headset discontinuation, since a consumer device withdrawn from sale forces revalidation of every medical claim built on it. That risk sits outside supplier control.
Market Impact: Clinics deliver only 3 hours weekly

Market Opportunities and Growth Drivers

Chinese Rehabilitation Capacity Builds Rather Than Converts

China carries the largest stroke burden of any country by a wide margin and has been building dedicated rehabilitation capacity across tertiary and county level hospitals rather than converting existing wards. Growth runs at 19.8%, faster than any market covered. Equipment is specified during facility planning, which means a supplier arriving at that stage faces no incumbent to displace. Domestic manufacturers including Fourier Intelligence supply hardware at prices imported systems cannot approach, while academic centres buy Western platforms for protocol comparability in published work. Protocol comparability is what Western suppliers still sell on.
Market Impact: Only 9% of payers hold codes

Recovery Dose Exceeds What Any Clinic Schedule Delivers

Stroke recovery responds to therapy dose and typical outpatient pathways deliver around three supervised hours a week, which is a small fraction of what trial protocols showing benefit actually used. No workforce expansion will close that gap at acceptable cost anywhere. Home delivered virtual reality is the only modality that can plausibly add dose without adding therapist time, and remote monitoring lets one clinician oversee many patients simultaneously. Adherence is the catch, since only about 38% complete prescribed sessions when nobody is watching them. Monitoring design decides whether the dose arrives at all.
Market Impact: Adherence falls to 38% unsupervised

Market Restraints and Challenges

Reimbursement Codes Exist In Almost No Jurisdiction

Only about 9% of national payers maintain a dedicated reimbursement code for immersive rehabilitation, which forces purchasing into capital budgets and research grants rather than operating expenditure. The root cause is that payers classify therapy by clinician time delivered rather than by modality, so a technology reducing clinician time has no obvious billing home. Commercially this produces grant funded installations that nobody replaces when they age. Suppliers are funding health economic studies and pursuing digital therapeutic pathways, which have worked in a handful of markets so far. Progress is slow and jurisdiction by jurisdiction.
Market Impact: Affects 60% of stroke survivors

Unsupervised Home Adherence Collapses Without Remote Monitoring

Around 38% of patients complete prescribed home sessions when no clinician is monitoring them, and adherence falls fastest in exactly the cognitively impaired population the fastest growing segment targets. The root cause is that executive dysfunction impairs the planning and initiation that self directed therapy requires, which makes the deficit its own barrier to treatment. Commercially this undermines outcome claims that payer submissions depend on. Participants are building scheduled contact, remote dashboards and caregiver involvement into home products, with measurable but partial improvement. The deficit being treated is also what obstructs the treatment.
Market Impact: Software reaches 44% of supplier revenue
3 additional market trends, 4 additional growth drivers, and 2 additional restraints and challenges are covered in the full report. Contact sales@marketmindsadvisory.com to access the complete intelligence.

Segment CAGR and Growth Architecture

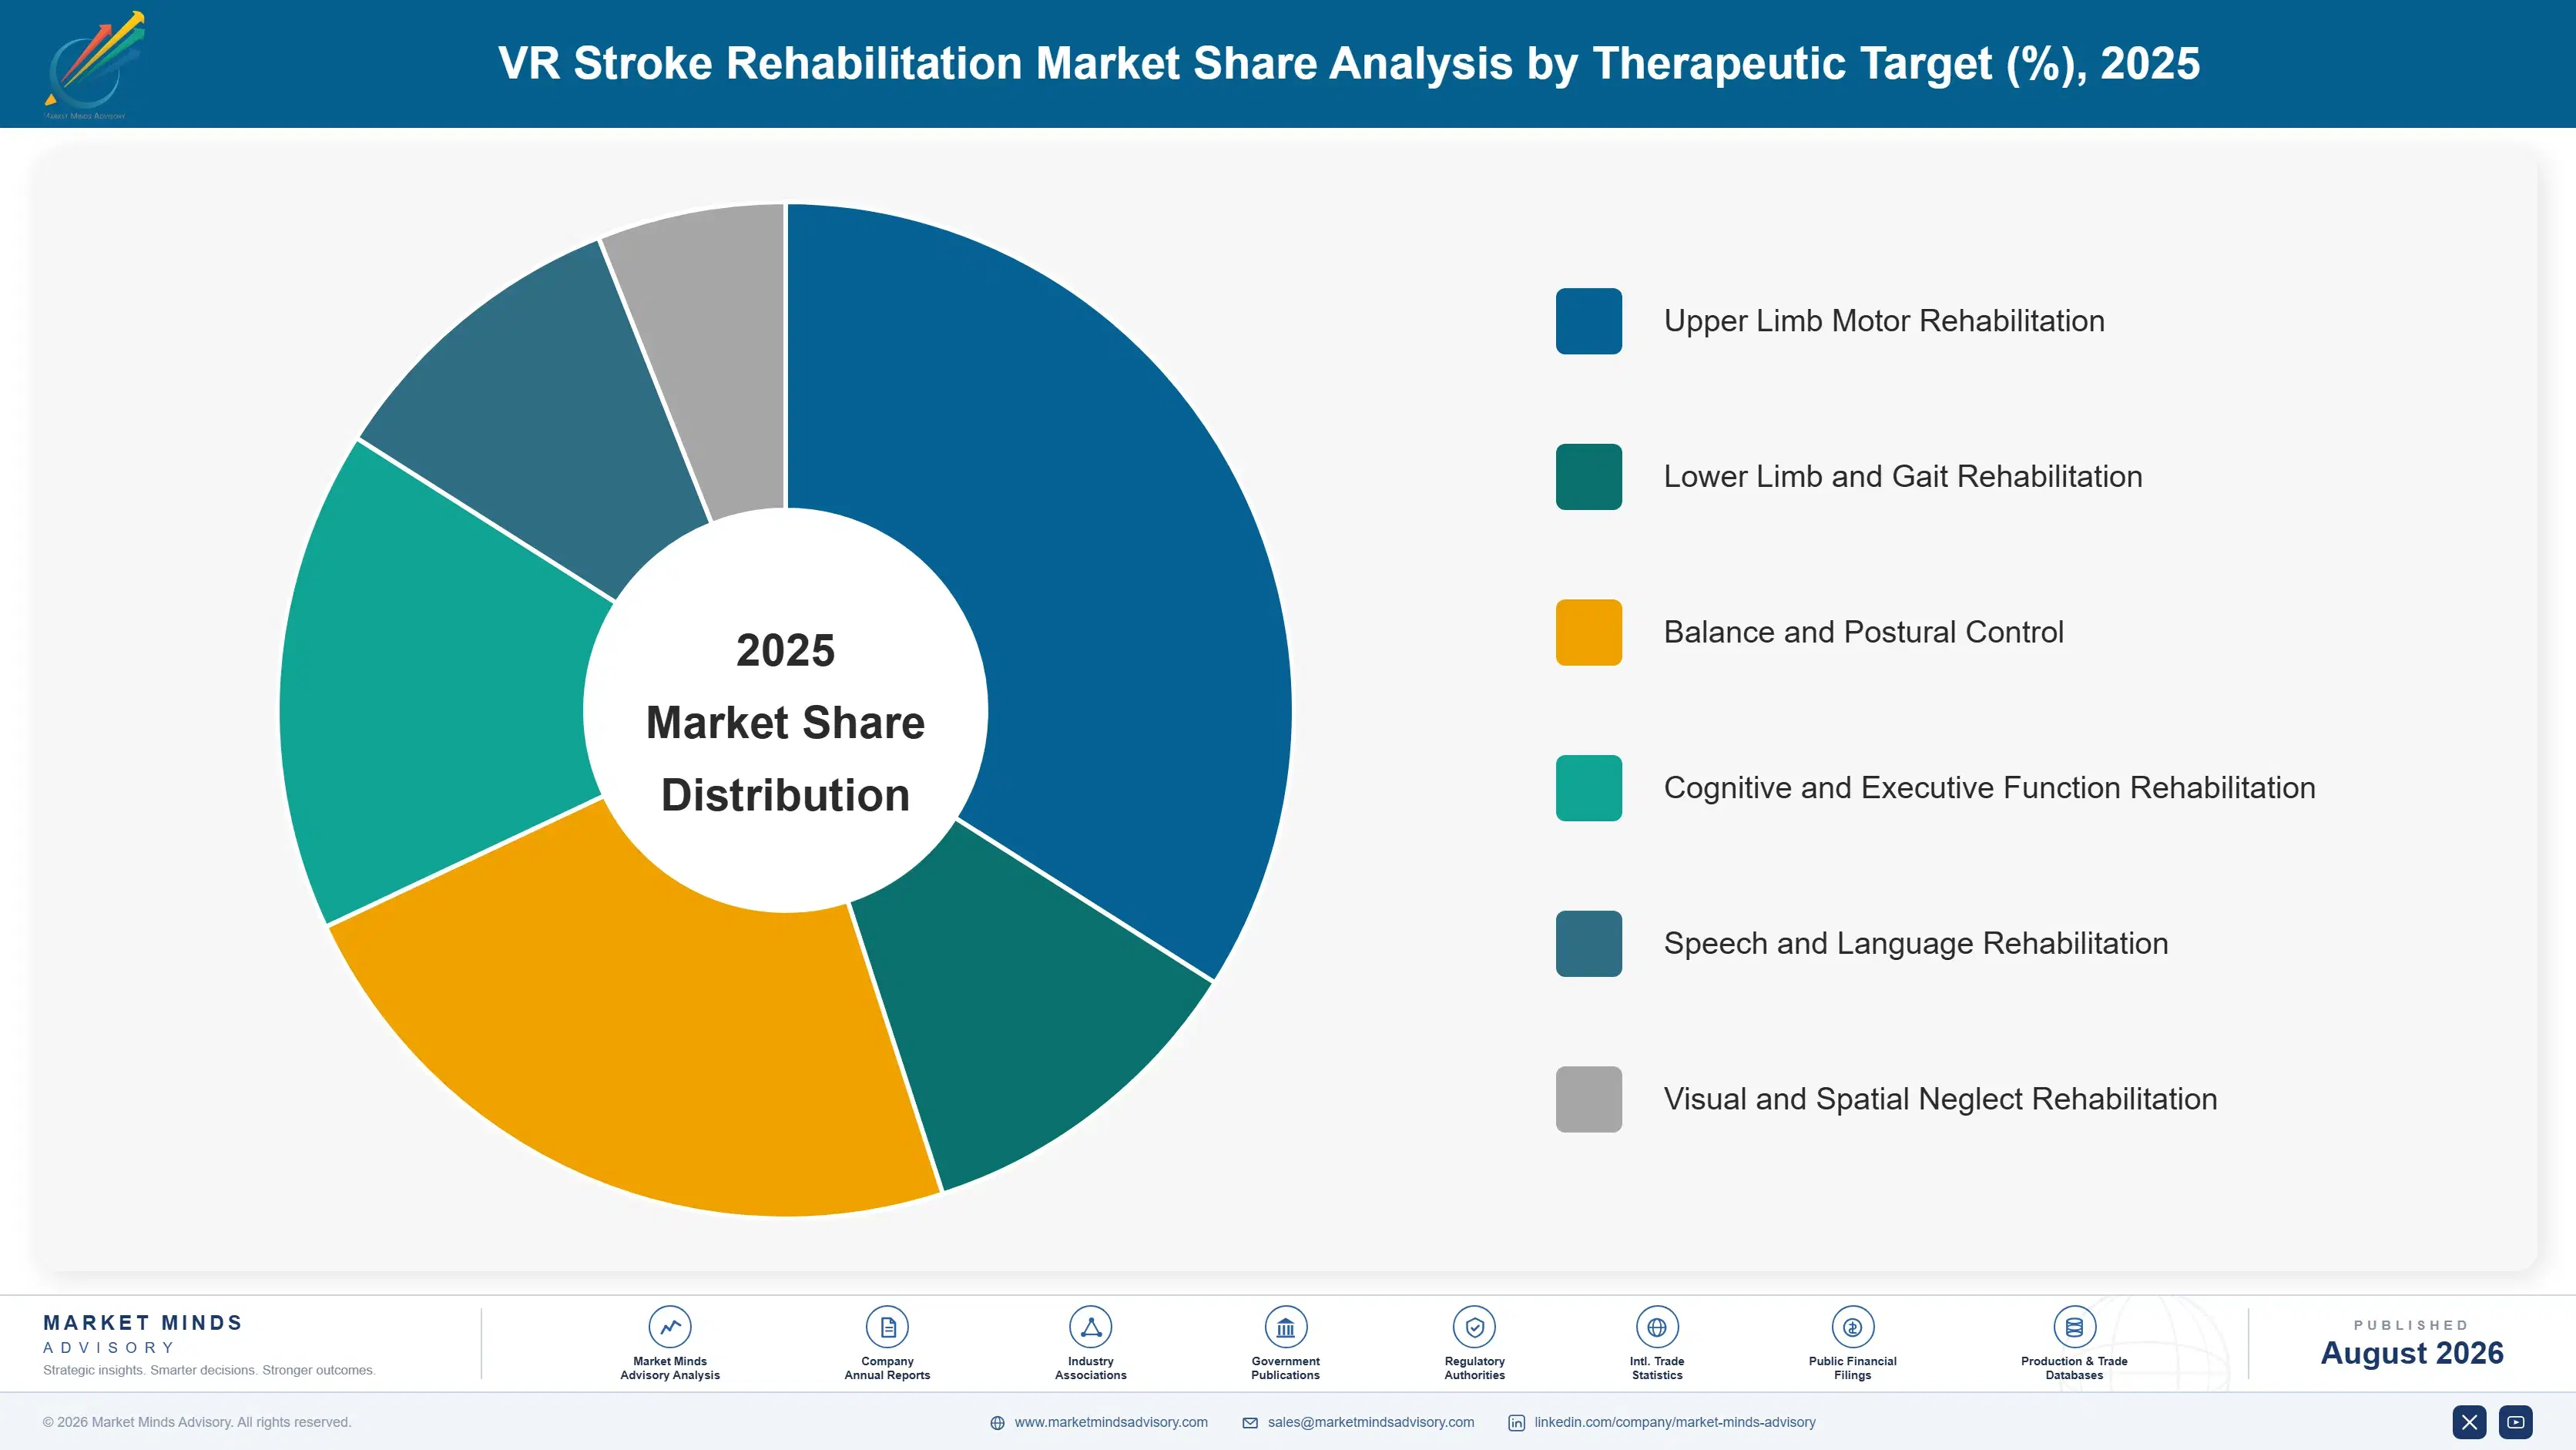
Segmentation follows therapeutic target, since the deficit being treated determines content design, evidence requirements, clinical workflow and which therapist specialty controls the purchase. Six targets cover post stroke rehabilitation as practised. Growth tracks how badly conventional therapy handles each deficit rather than how large the affected population happens to be. Population size matters considerably less.
vr-stroke-rehabilitation-market-market-share-analysis-1787664826718

Cognitive and Executive Function Rehabilitation

Simulated everyday environments used to assess and train attention, planning, sequencing and executive function, delivered through immersive hardware with graded task complexity. At 22.8% this is the fastest growing target, half again the market rate of 15.2%, and the reason is that conventional therapy handles this deficit worst. Tabletop clinic tasks bear little resemblance to the supermarket or kitchen where executive dysfunction actually appears, and roughly 60% of survivors carry measurable impairment. The irony is that the same executive dysfunction undermines home adherence, which is why products here need scheduled clinician contact built in rather than added on. Products designed for supervised clinic use transfer badly into homes without that contact built in.
CAGR 22.8%

Speech and Language Rehabilitation

Conversational and scenario based therapy for aphasia and related communication deficits, using simulated social situations that a clinic room cannot reproduce convincingly. Growth of 19.4% is second fastest in the market and the driver is practice volume rather than technique. Aphasia therapy responds strongly to repetition and speech and language therapists are among the scarcest rehabilitation staff anywhere, which makes any modality that multiplies practice hours commercially valuable. Evidence here is thinner than in motor rehabilitation, and payer submissions depend on outcome measures the field has not fully standardised across jurisdictions yet. Suppliers entering here are funding evidence work at the same time as building content, which slows commercial progress considerably.
CAGR 19.4%
Full segment breakdown across 6 segments available in the complete report.

Regional Architecture and Country Demand Map

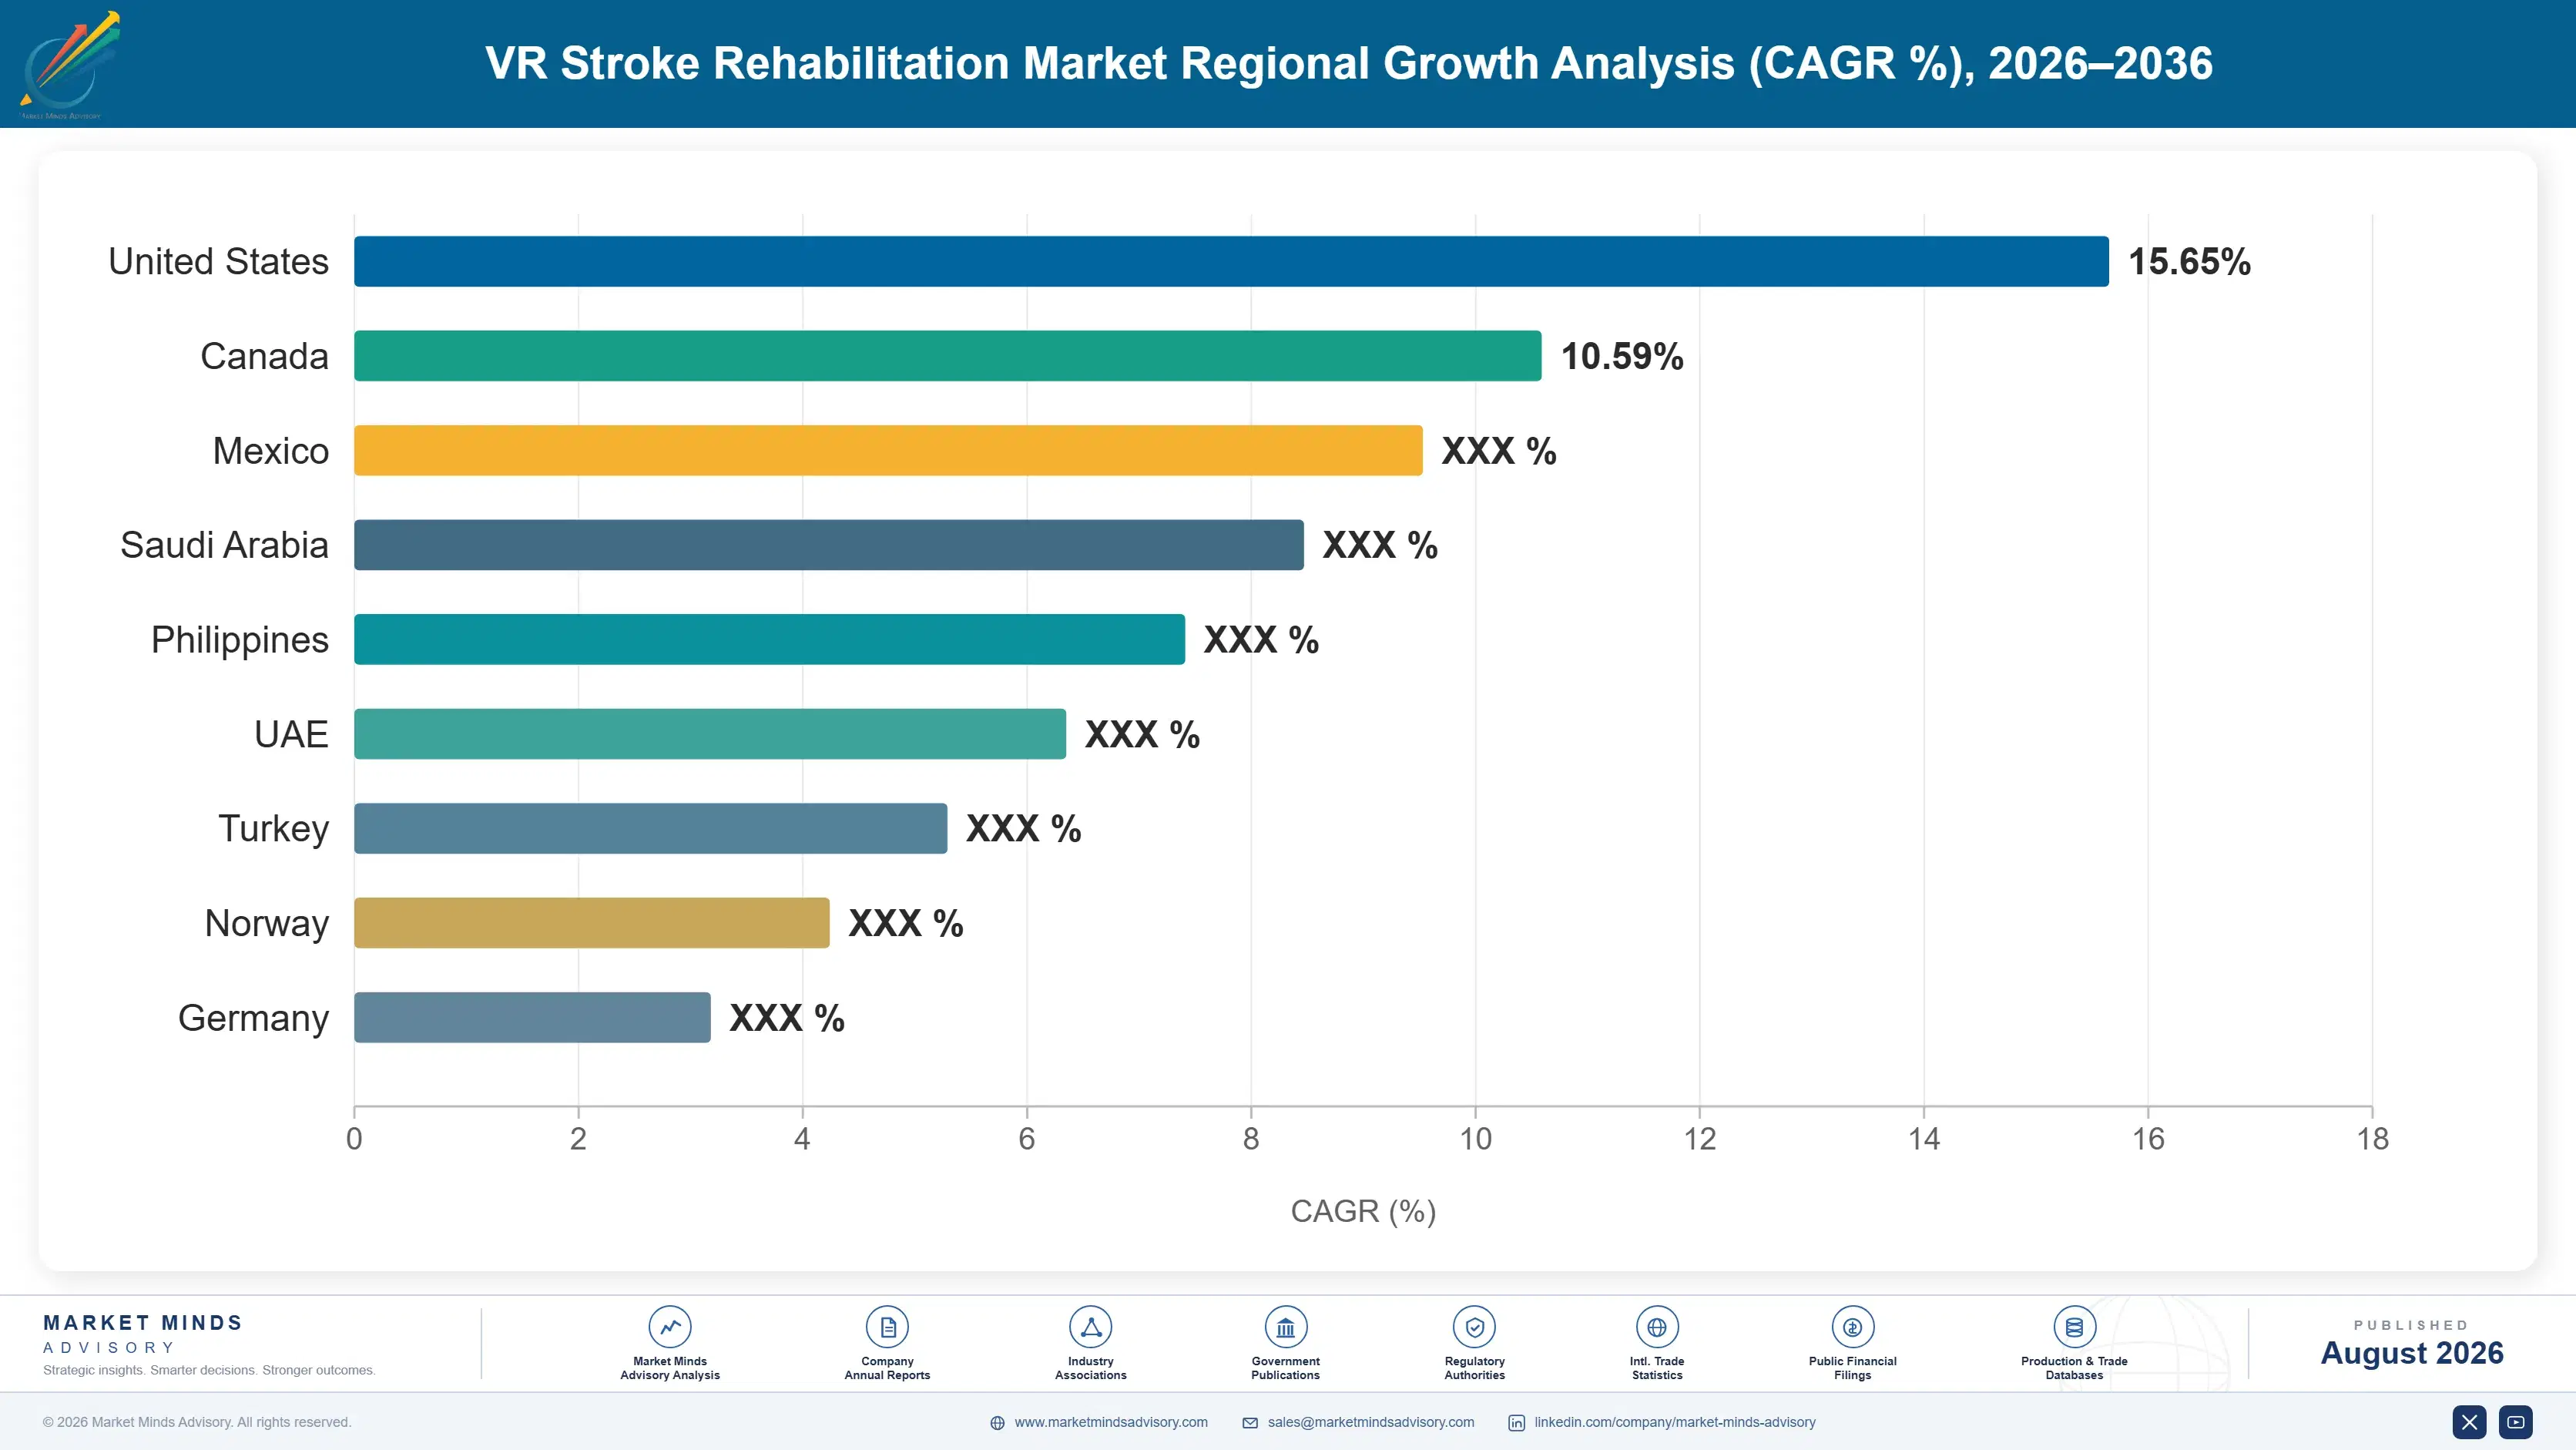
East Asia holds 32%, above the standard band, because China and Japan carry the largest stroke burden and the most deliberate rehabilitation capacity building anywhere. North America follows at 26% and Western Europe at 21%. China grows fastest at 19.8%. Capacity is being built rather than converted.

North America

Academic medical centres and well funded rehabilitation hospital groups built this 26% share, largely from research grants and capital budgets rather than from any reimbursement pathway. American evidence generation has been substantial and payer response has not followed it, which leaves suppliers selling to institutions willing to fund ahead of a billing code. Veterans health facilities have been unusually early adopters, with stroke and traumatic brain injury programmes running side by side. Home delivery is developing fastest here among all Western markets. Growth of 14.2% reflects institutional purchasing rather than any broad clinical pathway adoption. Purchasing here runs ahead of any payer decision, which is unusual and not indefinitely sustainable.
Share: 26% | CAGR: 14.2% (2026 to 2036)

Western Europe

National health systems shape this 21% share in ways that cut both directions. Centralised assessment bodies demand health economic evidence that few suppliers can fund, and once a technology clears that bar adoption follows across a whole system rather than hospital by hospital. Dutch, German and Nordic rehabilitation services have been the most active adopters, with several running multi site home delivery programmes. Data protection requirements around remote monitoring add compliance cost that American suppliers frequently underestimate. Growth of 13.6% is the lowest of the seven regions and reflects assessment timelines rather than clinical scepticism. Once a technology clears assessment here, adoption follows across an entire national system at once.
Share: 21% | CAGR: 13.6% (2026 to 2036)
Regional intelligence for 5 additional markets available in the complete report: East Asia, South Asia and Pacific, Latin America, Middle East and Africa, Eastern Europe. Contact sales@marketmindsadvisory.com.
vr-stroke-rehabilitation-market-country-cagr-analysis-1787664827257

Where This Category Actually Pays

Nothing here is won on immersion quality, because the headset is a commodity and the clinical claim rests on content and evidence. Value accrues to whoever addresses the deficit conventional therapy handles worst, whoever delivers dose outside the clinic, whoever earns recurring licence revenue, and whoever reaches capacity being built. Four routes carry weight.

Build For The Deficit Nobody Treats Properly

Roughly 60% of stroke survivors leave hospital with measurable cognitive impairment, and it predicts return to work and independent living better than motor recovery does while receiving a fraction of the therapy time. Conventional practice addresses it through tabletop tasks that bear no resemblance to the supermarket or kitchen where the deficit appears. Simulated environments reproduce those conditions directly and nothing else can. Cognitive rehabilitation grows at 22.8% against a market rate of 15.2% as a direct result of that gap. Motor therapy sells on equivalence and cognitive therapy sells on capability nobody else has.
Market Impact: Addresses the 60% of survivors carrying cognitive deficit

Design For Dose Delivered Outside The Clinic

Typical outpatient pathways deliver around three supervised hours a week, far below the dose that trial protocols demonstrating benefit actually used, and no realistic workforce expansion closes that gap. Home delivery is the only route to more dose without more therapist time. The catch is adherence, which falls to roughly 38% when nobody is monitoring, and falls fastest among the cognitively impaired patients the growth segment targets. Products with scheduled clinician contact and remote dashboards built in hold adherence considerably better than self directed ones. Design decides whether the dose actually arrives.
Market Impact: Lifts adherence well above the 38% unsupervised baseline

Sell Software Licences Not Headset Hardware

Consumer headset prices collapsed and took hardware margin with them, which is why software already accounts for 44% of supplier revenue and keeps rising. Licensing suits clinical customers who prefer operating expenditure in a market where roughly 9% of national payers hold a dedicated code, and it produces revenue that recurs rather than ending at installation. The exposure is headset discontinuation, since a consumer device withdrawn from sale forces revalidation of every clinical claim built on it and that cost lands without warning. Validating across more than one platform is the only sensible answer.
Market Impact: Software already carries 44% of all supplier revenue

Follow Chinese Rehabilitation Capacity As It Builds

China carries the largest national stroke burden anywhere and is building dedicated rehabilitation capacity rather than converting existing wards, with growth running at 19.8% and faster than any market covered. Equipment specified during facility planning means a supplier present at that stage displaces nobody. Domestic manufacturers supply hardware well below imported pricing, so competing on price is not the route in. Academic centres buying Western platforms for protocol comparability in published work is the position worth holding instead. Evidence comparability rather than price is the argument that works with academic buyers in that market.
Market Impact: Captures the 19.8% Chinese growth rate through 2036

Who Controls the Margin Pool

Concentration is low in a market that is still early. The top five hold 34% of installed base and associated licence revenue, the basis applied consistently throughout this section, across a field mixing venture funded specialists, medical device groups and rehabilitation equipment manufacturers adding virtual reality to existing ranges. MindMaze leads on clinical evidence depth and regulatory clearances, and the gap to challengers reflects trial investment more than product capability.
Competition runs on three fronts. Evidence led specialists compete for clinical guideline recognition and payer submissions, which is slow and expensive and produces the only genuinely defensible position available. Rehabilitation equipment manufacturers compete by adding virtual reality content to installed hardware they already service. And Chinese domestic manufacturers compete on price in the fastest growing market anywhere.

Rankings will move with reimbursement decisions rather than with product launches, since a dedicated payer code would separate suppliers holding health economic evidence from those without it permanently. The other pressure point is headset dependency, which exposes every supplier building on consumer hardware to a discontinuation decision taken by a company with no interest in medical applications at all.
vr-stroke-rehabilitation-market-company-positioning-matrix-1787664827788

Competitive Moat and Risk Dimensions

MINDMAZE

Moat: Clinical Evidence And Clearances

Regulatory clearances across multiple jurisdictions combined with published trial data create a position that cannot be assembled quickly, since the trials take years and cost far more than product development. Payer submissions and clinical guideline discussions reference that evidence directly, which makes it the asset competitors find hardest to match on any timeline.
MINDMAZE

Risk: Capital Intensity Without Reimbursement

Sustaining trial programmes and regulatory work requires continued funding in a market where roughly 9% of national payers hold a dedicated code, which means the evidence is being built ahead of the revenue that would justify it. A prolonged funding environment shift would force choices between evidence generation and commercial expansion.
PENUMBRA

Moat: Established Hospital Relationships

Existing commercial relationships across stroke care built through neurovascular device business give direct access to exactly the institutions that also run rehabilitation programmes, which shortens the sales cycle considerably. Financial strength from an established device business funds rehabilitation development without the external capital dependency specialist competitors carry.
PENUMBRA

Risk: Rehabilitation Outside Core Focus

Rehabilitation sits alongside a much larger neurovascular business competing for the same internal capital and management attention, and returns in rehabilitation depend on reimbursement developments outside the company's control. A category requiring sustained investment ahead of payer decisions is a difficult case to make against interventional programmes with clearer economics.

Players Tracked

Prominent Players

MindMaze
Penumbra
XRHealth
CUREosity
Neuro Rehab VR

Other Key Players

Tyromotion
Motek Medical
Hocoma
BTS Bioengineering
Virtualware
Rehametrics
SyncVR Medical
Immersive Rehab
Evolv Rehabilitation Technologies
MediTouch
Neofect
Bionik Laboratories
Saebo
Fourier Intelligence
Reha Technology

Recent Developments

MARCH 2025

Payer pilot establishes reimbursement pathway for immersive rehabilitation

A national payer opened a pilot reimbursement pathway for immersive rehabilitation delivered under clinician supervision, requiring outcome reporting as a condition of payment. Roughly 9% of national payers currently hold any dedicated code, which makes each pathway decision commercially significant well beyond the market it covers.
Signal: Payment rather than evidence is the constraint, so every code decision moves more than one market
JUNE 2025

Consumer headset discontinuation forces clinical system revalidation

A consumer headset withdrawal from sale forced suppliers building clinical claims on that hardware to revalidate on replacement devices, at cost and on timelines nobody had budgeted. Software already accounts for 44% of supplier revenue, and the underlying hardware dependency remains outside supplier control entirely.
Signal: Building medical claims on consumer hardware means a discontinuation decision elsewhere becomes your own regulatory problem overnight
SEPTEMBER 2025

Home programme adds remote monitoring after adherence findings

A home delivered rehabilitation programme added scheduled clinician contact and remote dashboards following findings that unsupervised adherence runs near 38%, with the steepest falls among cognitively impaired patients. That population is precisely the one the fastest growing segment is designed to serve at scale. Design has to anticipate that.
Signal: The deficit the product treats is also the deficit that stops patients completing the treatment at home

What A Clinical VR System Costs

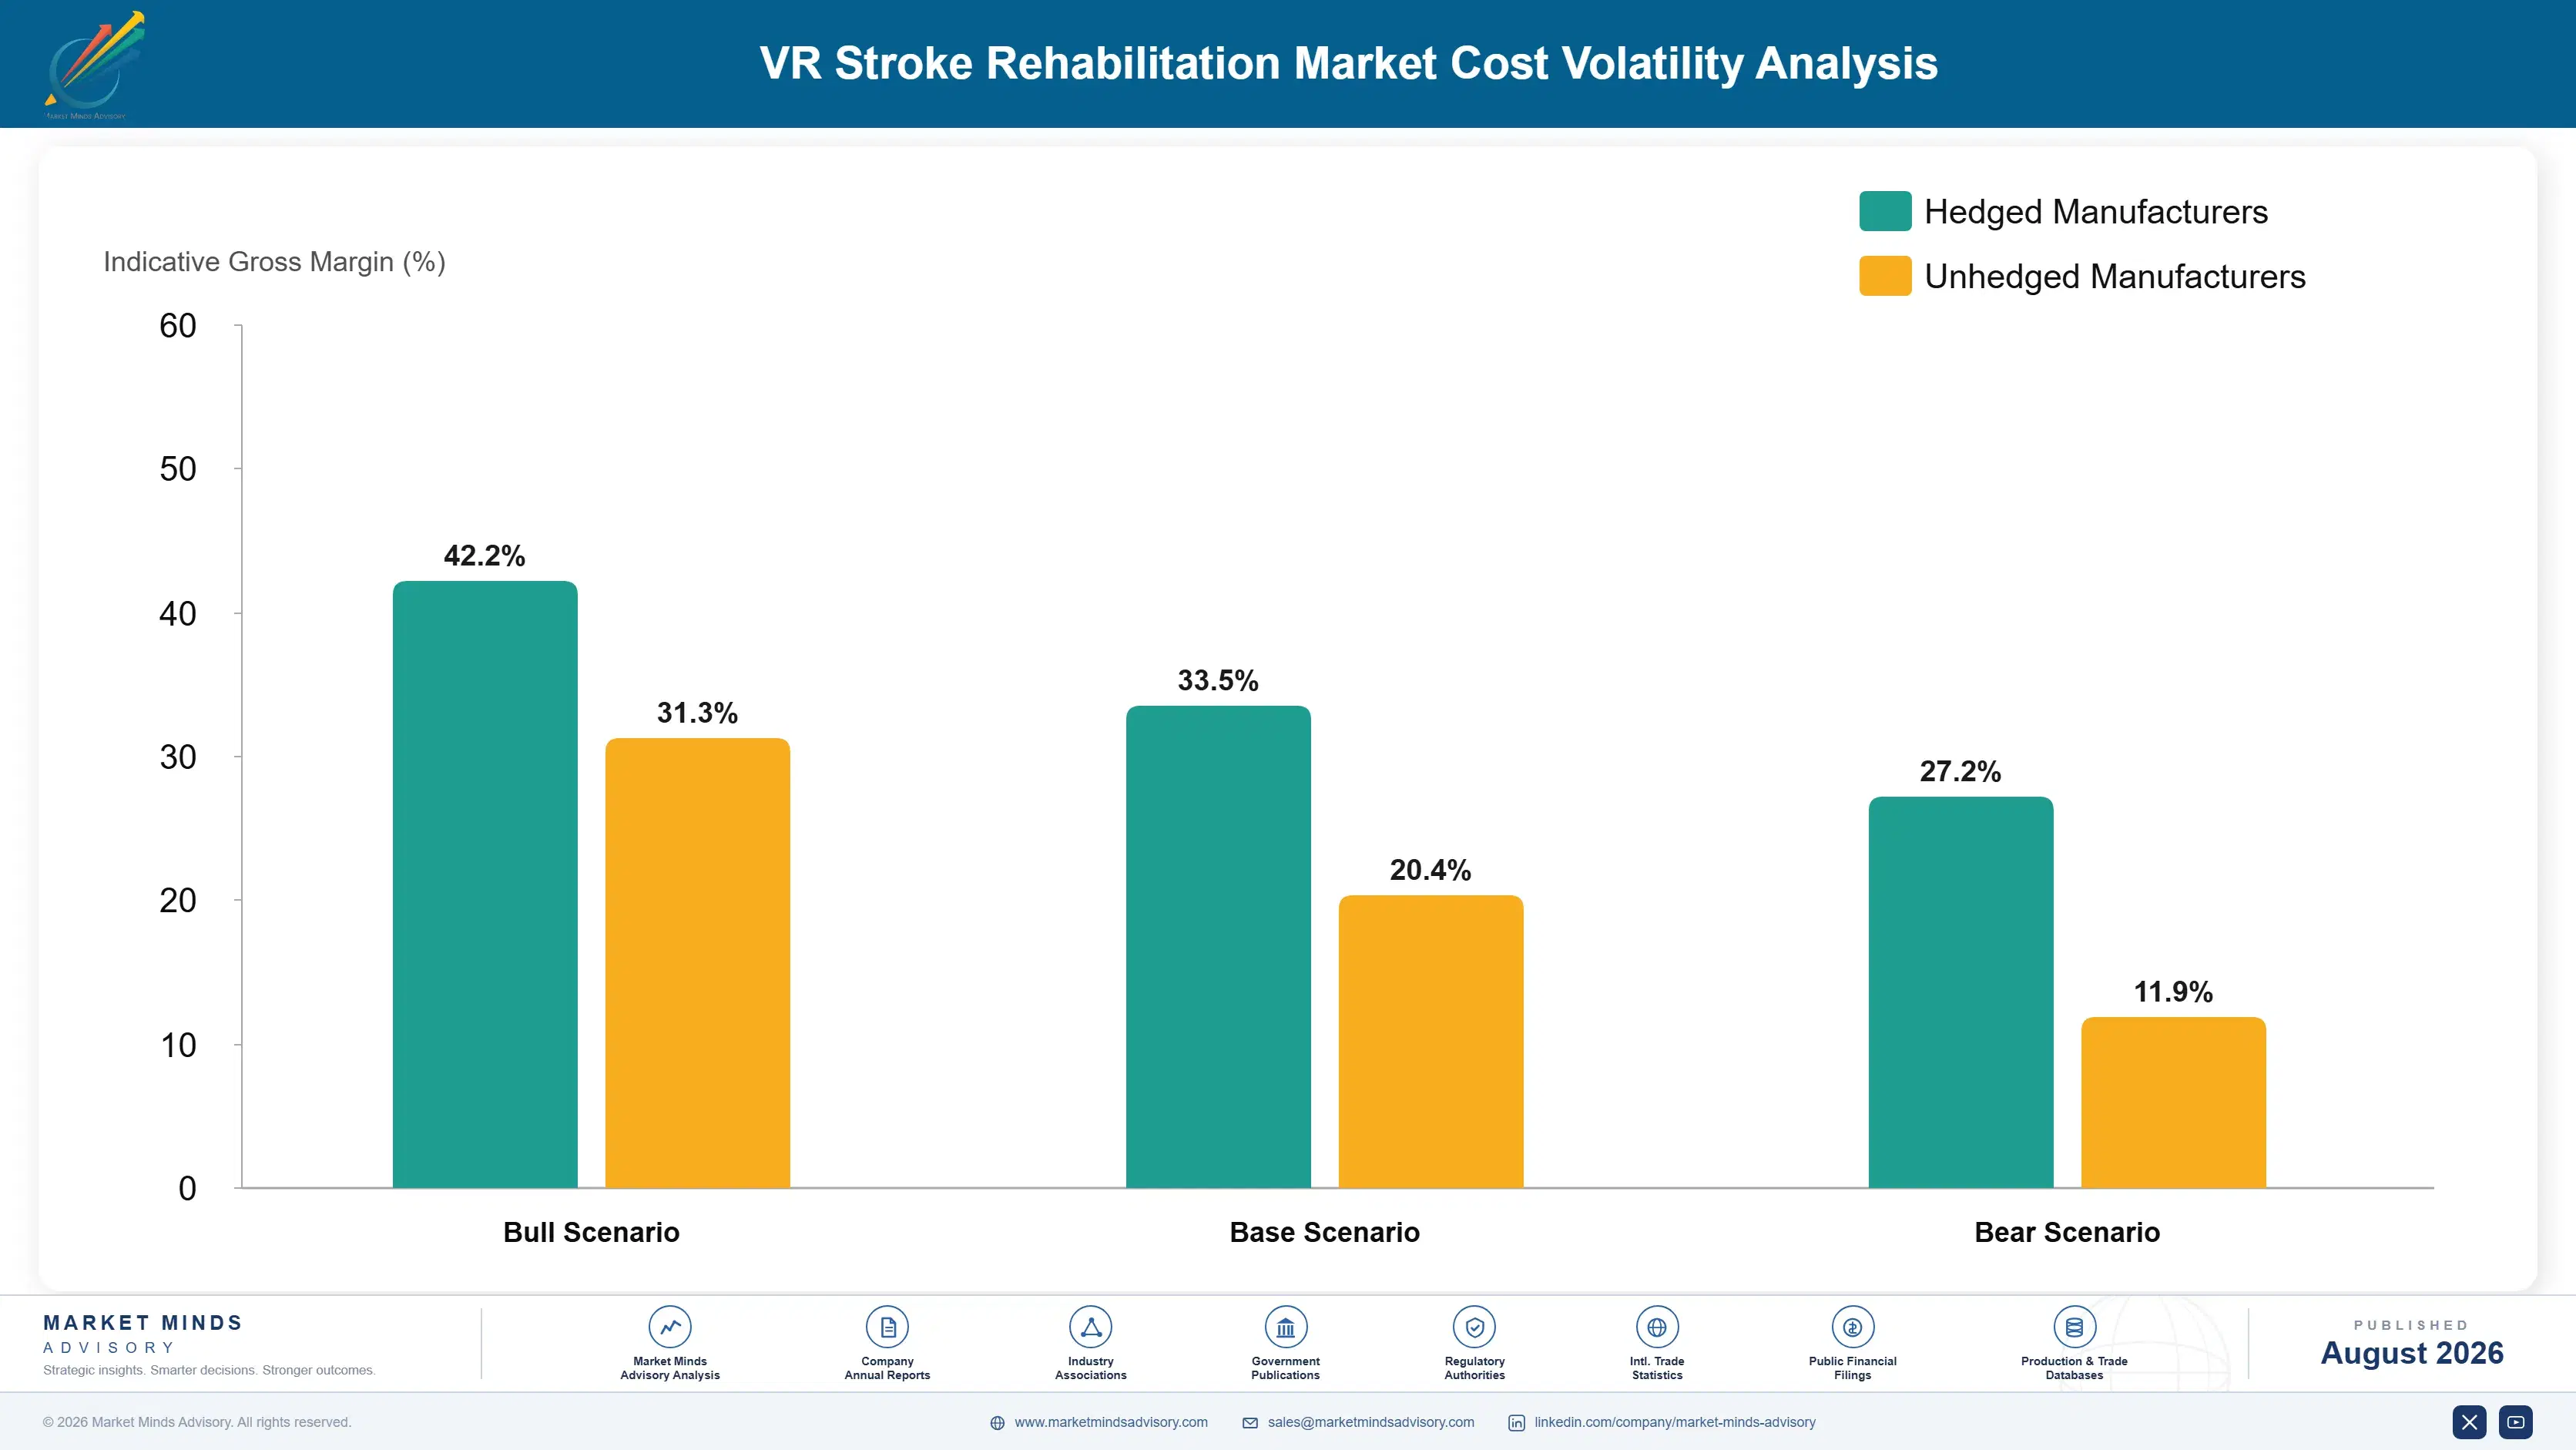
Software development and clinical validation dominate, absorbing roughly 46% of cost of goods once amortised across production volumes measured in thousands of systems rather than millions. Headset hardware accounts for about 19% and falling, since suppliers buy commodity consumer devices rather than building their own. Haptic peripherals and motion sensing come from specialist manufacturers. Display panels trace overwhelmingly to East Asian production.
Hardware discontinuation rather than component pricing is the exposure that matters, because a consumer headset withdrawn from sale invalidates regulatory clearances built on it and forces revalidation nobody budgeted. Company annual reports across the sector documented exactly that during the last consumer device transition, alongside display panel supply tightening recorded in China MIIT industrial output data. Suppliers holding clearances on a single hardware platform absorbed the revalidation cost directly into operating expense.

Exposure divides by hardware strategy rather than by scale. Suppliers building clinical claims on one consumer headset carry concentrated discontinuation risk, while those validating across multiple platforms pay more in regulatory work and sleep better. Rehabilitation equipment manufacturers adding content to hardware they already build avoid the problem entirely and carry higher unit cost instead. Small specialists face the worst of both.
vr-stroke-rehabilitation-market-cost-volatility-analysis-1787664827984

Validate clinical claims across more than one hardware platform

A clearance built on one consumer headset becomes worthless the day that device is withdrawn, and the decision belongs to a company with no interest in medical applications. Validating across multiple platforms costs more in regulatory work upfront and removes a risk that can halt sales entirely. Suppliers who learned this during the last transition are considerably better placed now.

Shift revenue toward licences rather than hardware margin

Consumer headset pricing collapsed and took hardware margin with it, which is why software already carries 44% of supplier revenue across the field. Licence revenue recurs, suits clinical customers preferring operating expenditure, and insulates the business from device pricing decisions made elsewhere. Suppliers still building a case around hardware margin are defending economics that disappeared several years ago.

Fund health economic evidence before pursuing payer submissions

Roughly 9% of national payers hold a dedicated code for immersive rehabilitation, and the submissions that succeed carry health economic evidence rather than clinical efficacy data alone. That work costs substantially more than the trials establishing efficacy did. Funding it early is the only route from grant purchasing to operating budgets, and it is the barrier smaller competitors cannot clear.

Portfolio Architecture for Margin Defence

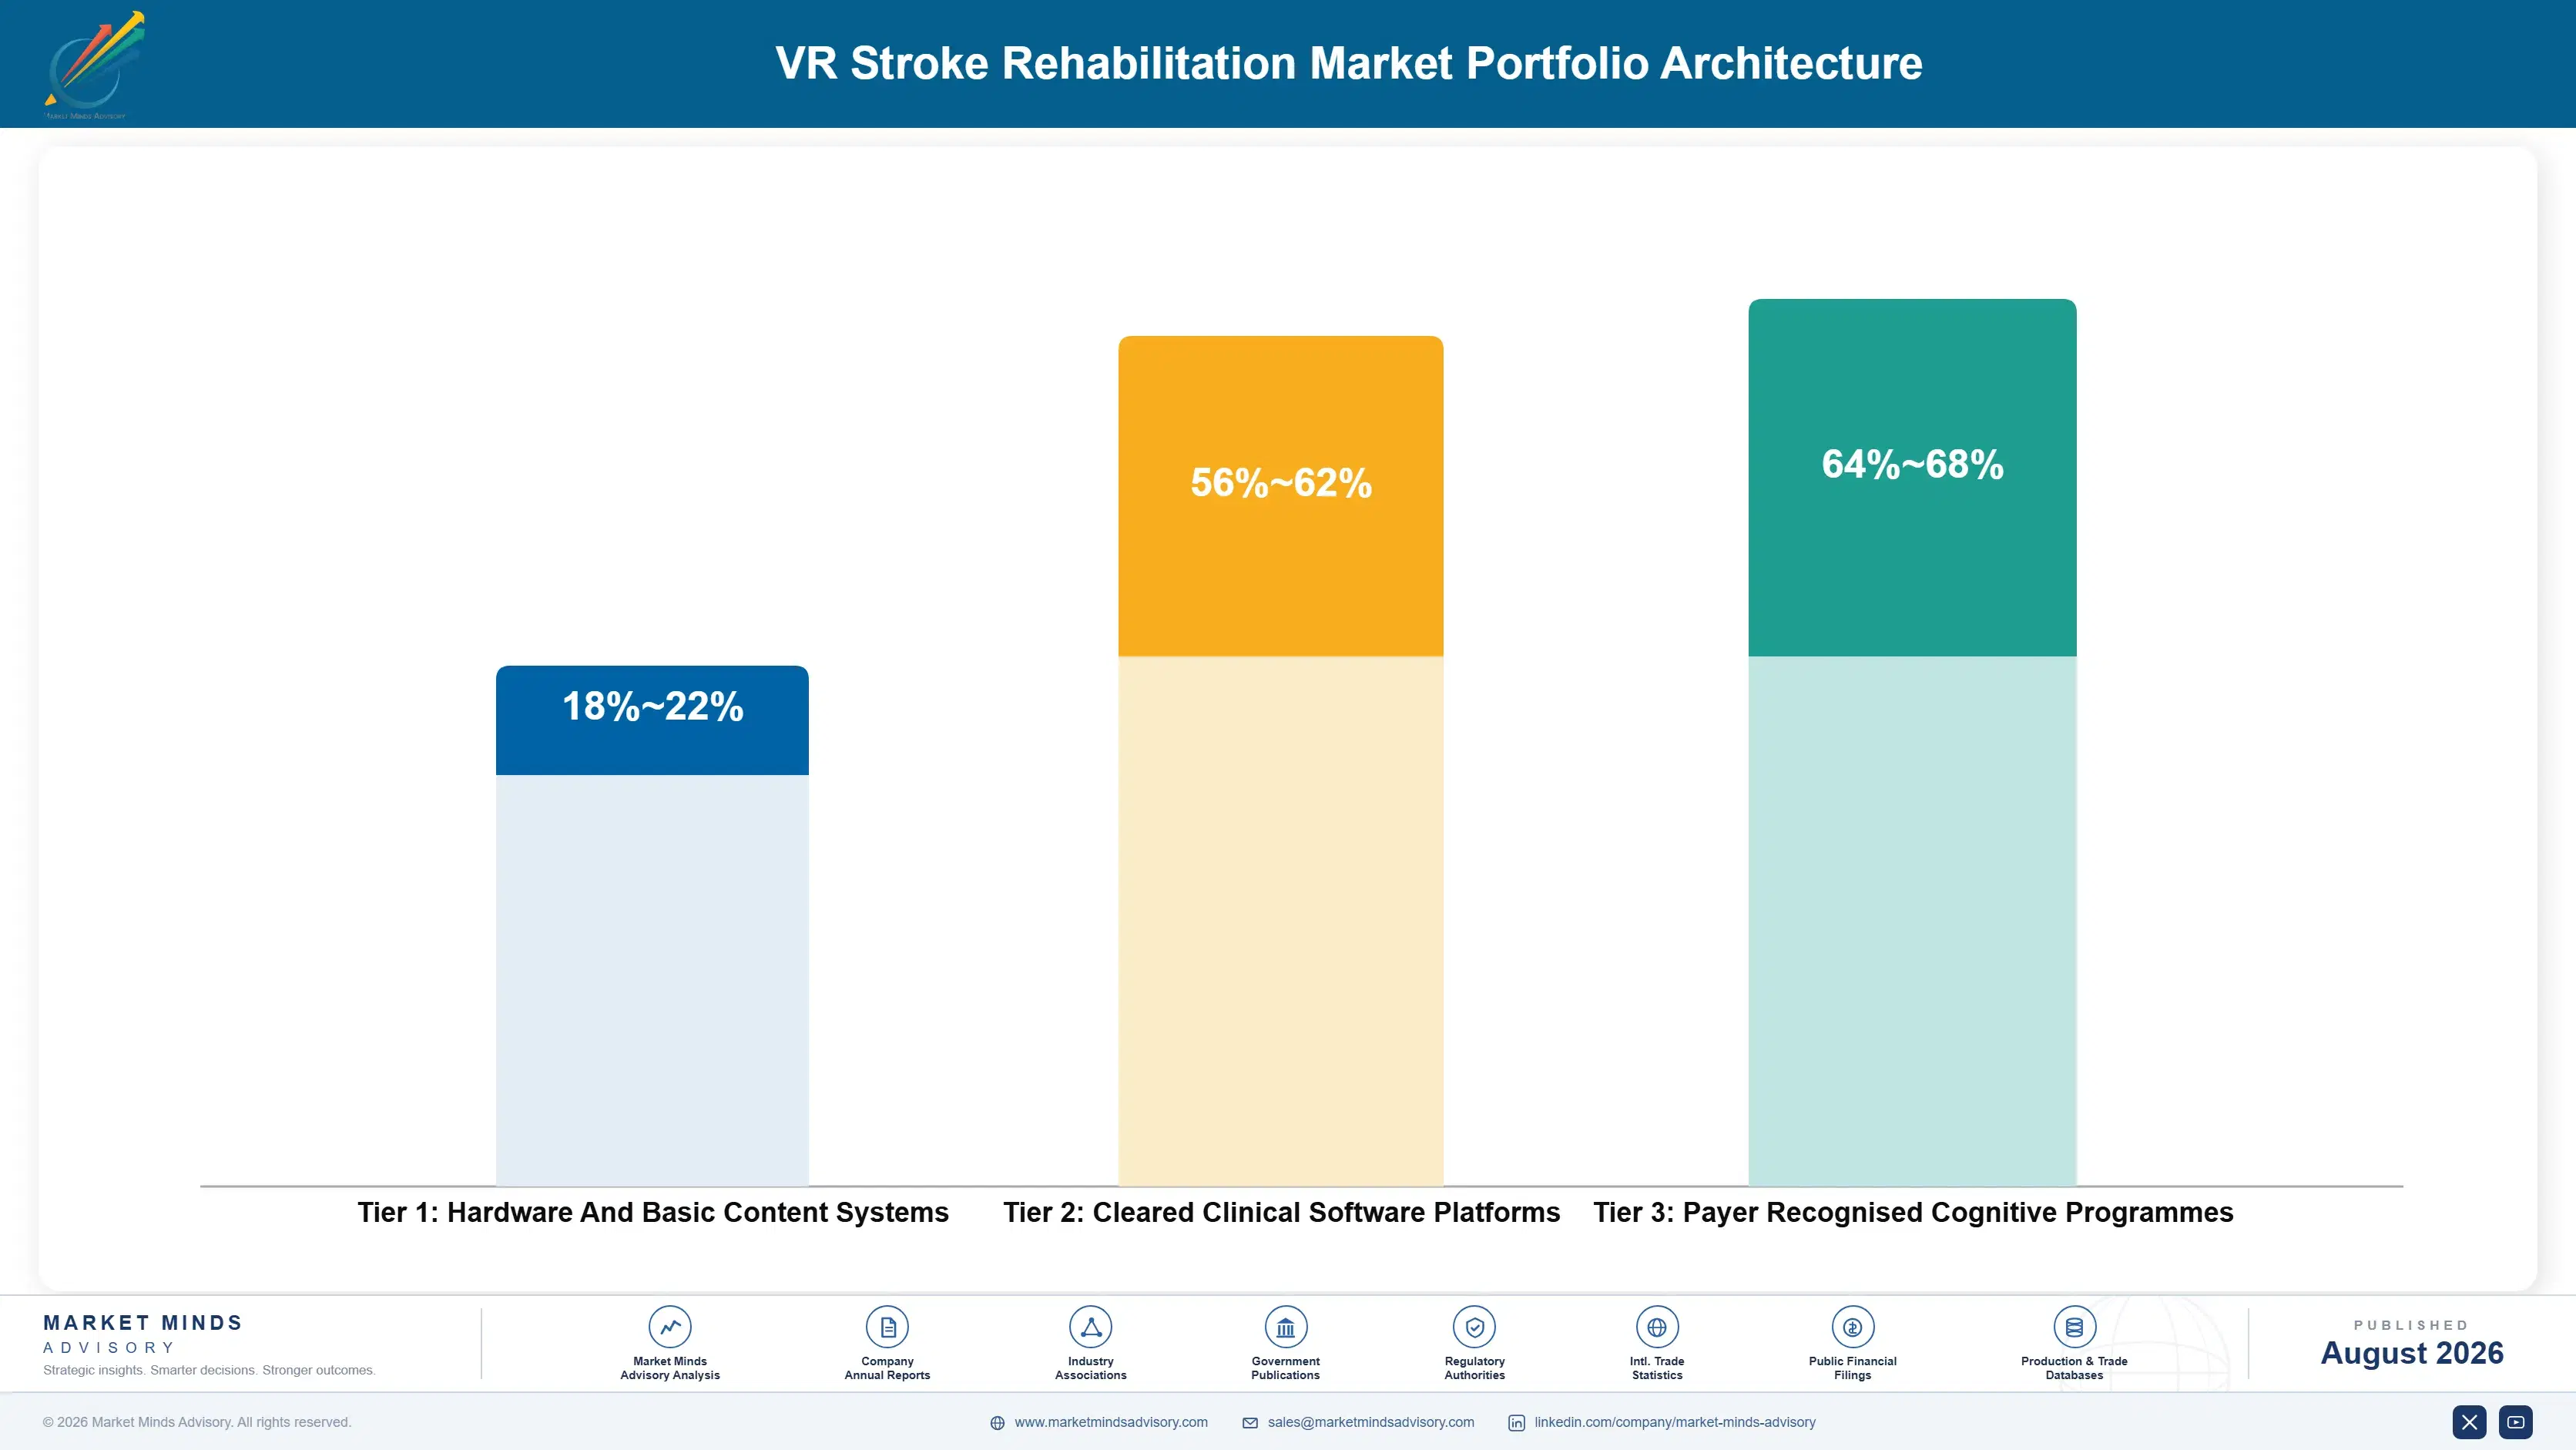
Margin architecture divides on whether revenue recurs. Hardware resale earns almost nothing now that consumer headsets are commodities, and suppliers still building on that margin are defending economics that vanished several years ago. Clinical software licences earn considerably better and recur across an installed life. Evidence backed cognitive platforms with payer recognition earn best, because a reimbursement pathway is the one position a competitor cannot buy quickly.
The tension runs between evidence cost and market readiness. Building health economic evidence takes years and costs more than the efficacy trials did, in a market where roughly 9% of national payers hold a dedicated code to submit against. A supplier funding that work is spending ahead of revenue that may arrive slowly. One that does not is selling into capital budgets and grants that never replace equipment.

High value pools concentrate in cognitive rehabilitation at 22.8% and in payer recognised delivery pathways, neither of which is a hardware position. Everything selling systems alone competes against domestic manufacturers in the fastest growing geography and against commodity headset pricing everywhere else. The businesses worth building are those where the licence recurs and the evidence file is genuinely difficult for anybody else to assemble.

Hardware And Basic Content Systems

Commodity headset resale bundled with basic exercise content, competing directly against domestic manufacturers in the fastest growing markets. Margin is thin and differentiation minimal, since the underlying hardware is identical across suppliers.
Gross Margin: 18-22%

Cleared Clinical Software Platforms

Regulatory cleared clinical platforms licensed to rehabilitation providers with outcome tracking and clinician workflow built in. The range is wide because licence terms differ substantially between institutional and per patient models across markets.
Gross Margin: 56-62%

Payer Recognised Cognitive Programmes

Cognitive rehabilitation programmes carrying health economic evidence and reimbursement recognition, delivered with remote monitoring. Margin is highest because a payer pathway cannot be replicated quickly by any competitor at any investment level.
Gross Margin: 64-68%
vr-stroke-rehabilitation-market-portfolio-architecture-1787664828483

High-value Sub-segments and Strategic Watch-out

Cognitive and Executive Function Rehabilitation

Fastest growing at 22.8% because conventional therapy handles this deficit worst and roughly 60% of survivors carry it. The same executive dysfunction undermines home adherence, which is why scheduled clinician contact has to be designed in rather than added later. Design has to anticipate that from the start.
Gross Margin: 60-66%

Speech and Language Rehabilitation

Second fastest at 19.4% on practice volume rather than technique, since aphasia responds to repetition and speech therapists are among the scarcest rehabilitation staff anywhere. Evidence is thinner here than in motor rehabilitation and outcome measures remain unstandardised across jurisdictions. Evidence cost is the entry barrier here.
Gross Margin: 54-58%

Upper Limb Motor Rehabilitation

Growing at 16.8% and carrying the largest installed base, since it is where fifteen years of trials concentrated and where clinical familiarity is deepest. Competition is direct and the evidence proves equivalence to conventional therapy rather than superiority over it. Equivalence is a weak purchasing argument.
Gross Margin: 40-44%

Balance and Postural Control

Growing at 12.6% and constrained by capital cost, since platform integrated systems carry hardware that commodity headsets cannot replace. Falls prevention gives the clinical case genuine weight and the equipment economics remain considerably less attractive than software led segments. Hardware cost is the constraint on this segment.
Gross Margin: 36-40%

How Rehabilitation Systems Keep Earning

The economics turn on whether a licence recurs or a capital sale ends. A rehabilitation department buying a system from a research grant uses it while the study runs and replaces nothing afterwards, because no operating budget line exists. A department licensing software annually renews or cancels each year, which is a worse contract and a better business, since renewals surface problems while there is time to fix them.
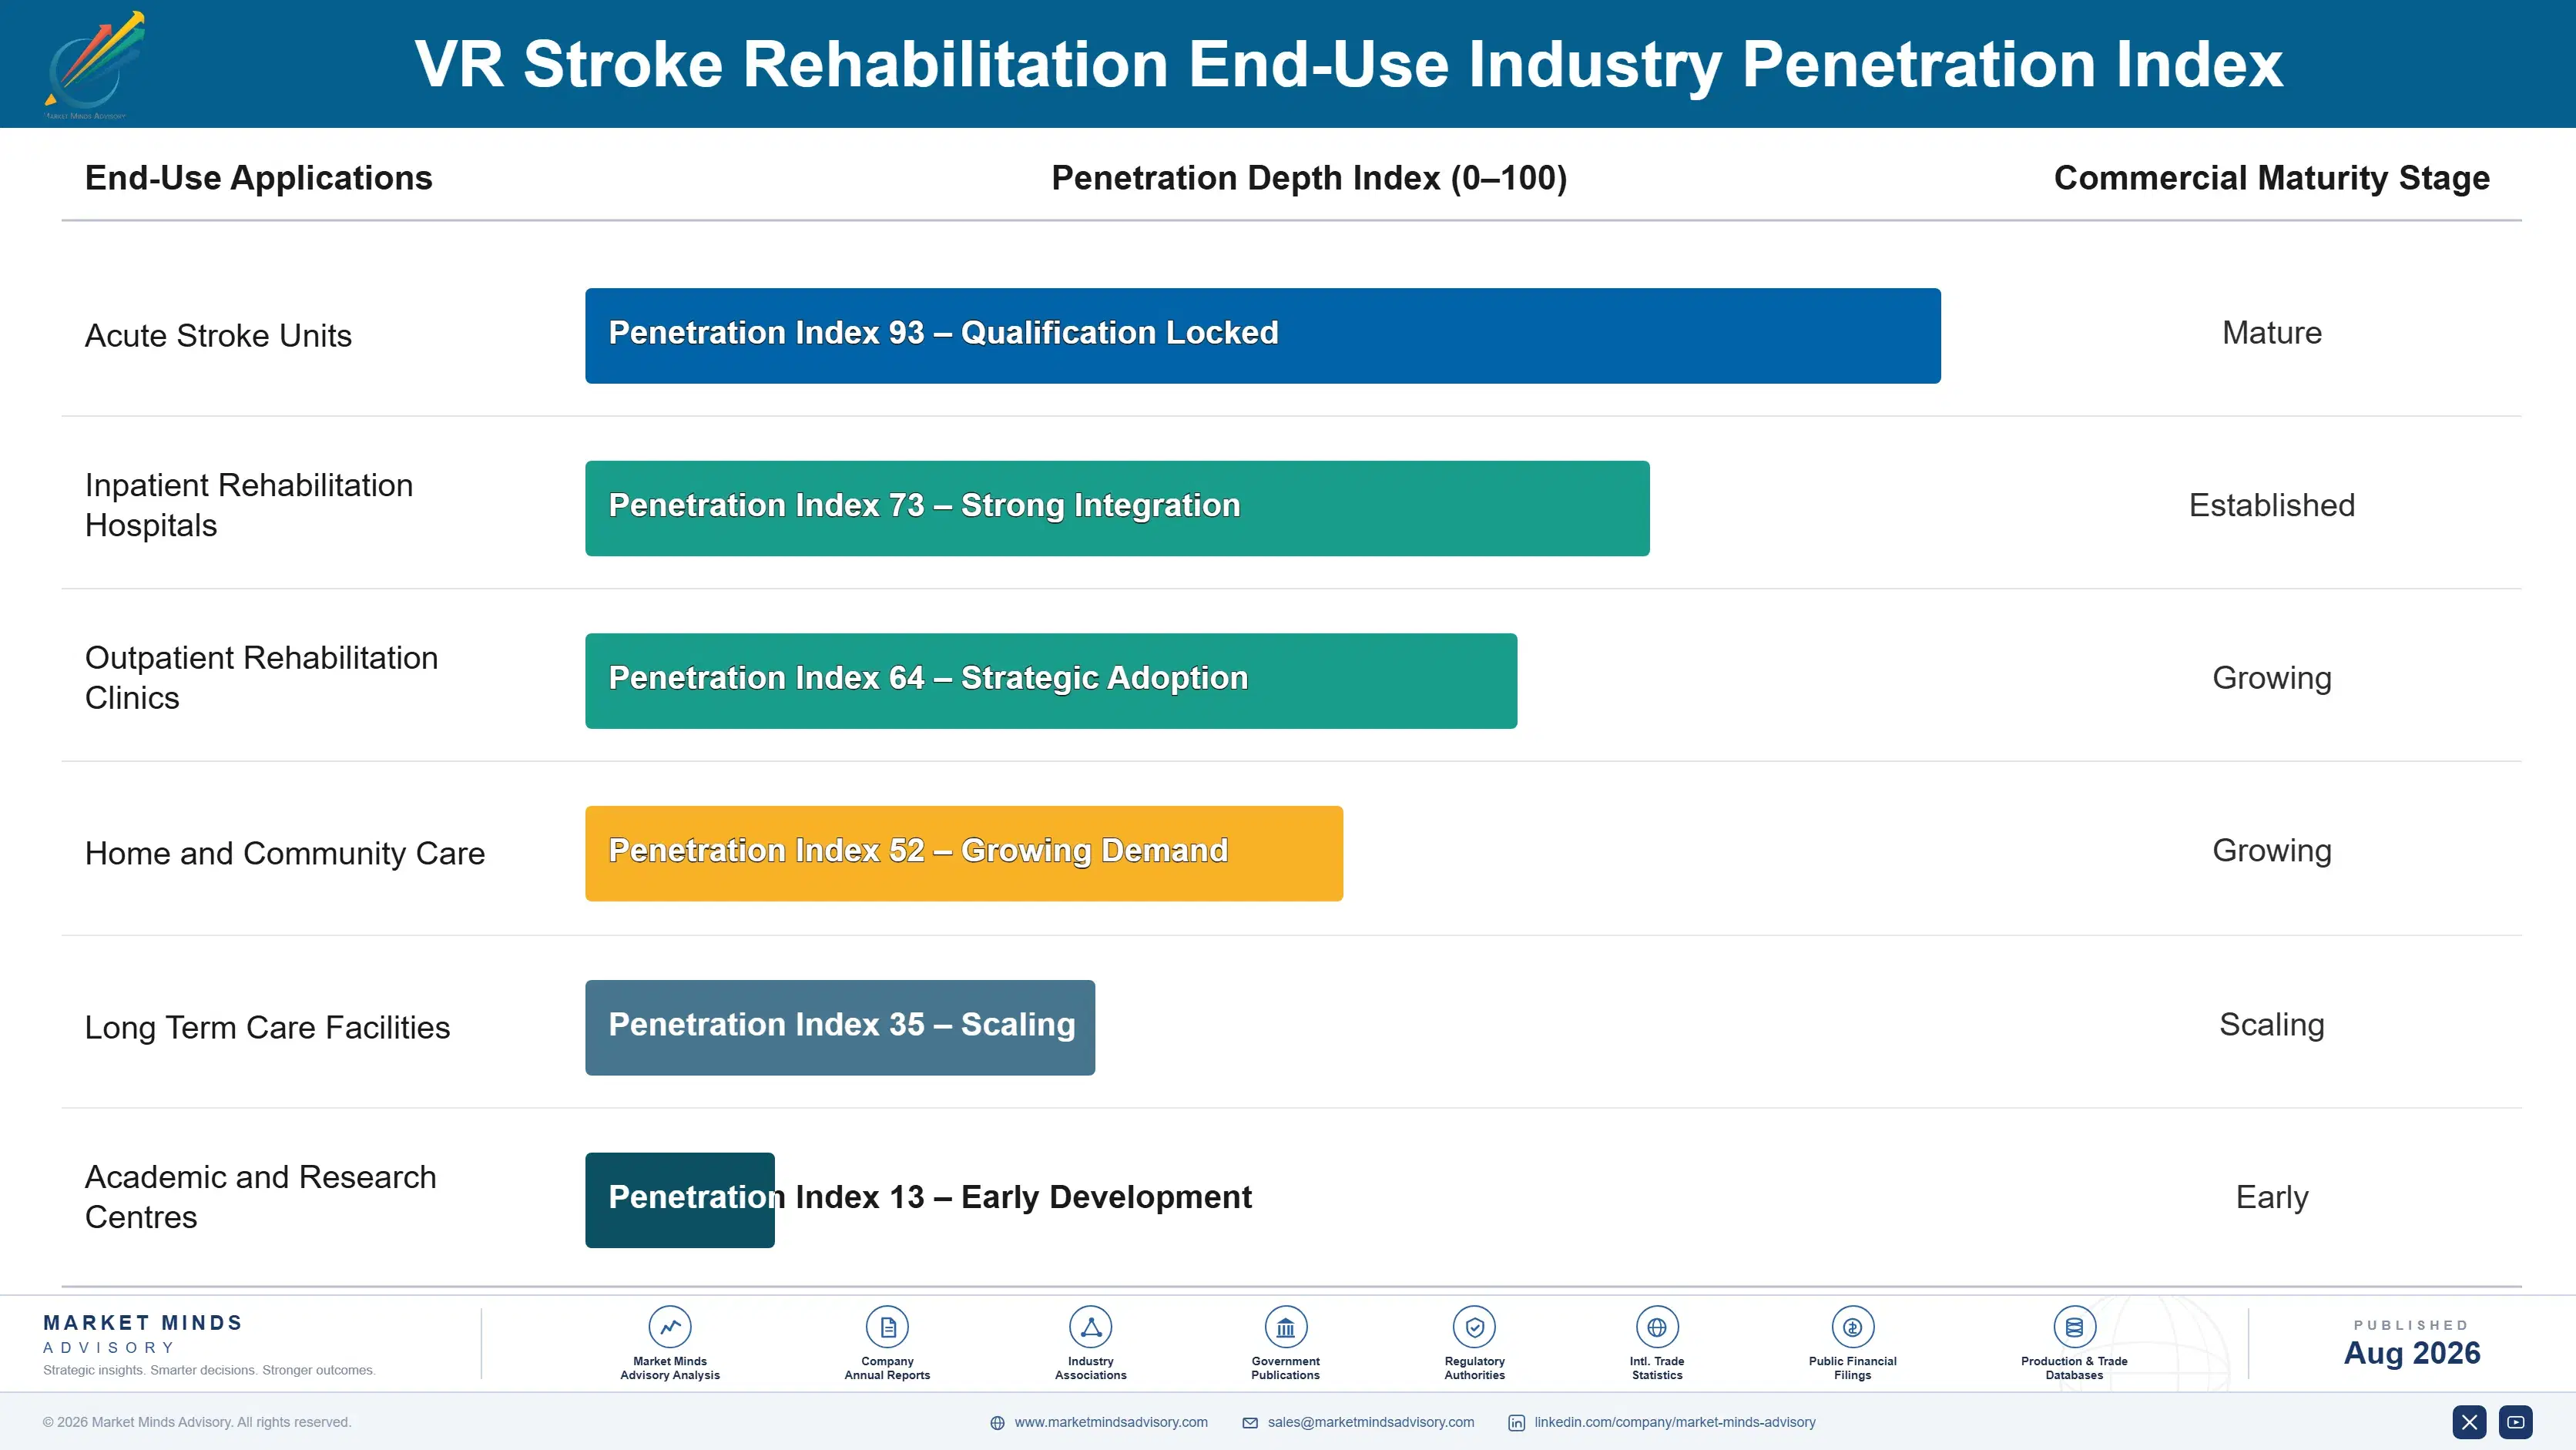
Adoption depth varies sharply by clinical setting. Inpatient rehabilitation hospitals with dedicated stroke programmes embed systems into daily protocols and use them heavily. Outpatient clinics use them as one option among several, at whatever intensity therapists prefer. Home programmes depend entirely on whether remote monitoring is built in, since unsupervised adherence sits near 38% and falls fastest in the cognitively impaired patients who need the therapy most.

The purchaser is shifting from researcher to clinical director to payer. Early installations were bought by academics running trials, then by rehabilitation directors funding from capital budgets. Where reimbursement pathways open, the decision moves to payers assessing health economic evidence rather than clinical efficacy alone. That transition changes what a supplier must prove, and most of the field is still proving the previous thing.
vr-stroke-rehabilitation-market-end-use-penetration-index-1787664828978

Where This Category Rewards Focus

These are among the four positions where our research anticipates prominent divergence between winners and laggards over the coming forecast period. Each is grounded in the demand model, the regulatory perimeter, and the announced capacity pipeline.
01 / COGNITIVE DEFICIT FOCUS

Treat what conventional therapy handles worst

Roughly 60% of stroke survivors leave hospital with measurable cognitive impairment, and it predicts return to work and independent living considerably better than motor recovery does while receiving a small fraction of available therapy time. Conventional practice addresses it with tabletop clinic tasks that bear no resemblance to the supermarket or kitchen where executive dysfunction actually appears. Simulated environments reproduce those conditions and nothing else can, which is why the segment grows at 22.8% against a market rate of 15.2%.
02 / HOME DOSE DELIVERY

Dose comes from outside the clinic room

Typical outpatient pathways deliver around three supervised hours weekly, far below the dose that trial protocols demonstrating benefit actually used, and no realistic workforce expansion will ever close that gap at acceptable cost. Home delivery is the only route to more therapy without more therapist time available anywhere. Adherence falls to roughly 38% unsupervised and falls fastest among cognitively impaired patients, so scheduled contact and remote dashboards have to be designed in from the very start rather than added on later.
03 / RECURRING LICENCE ECONOMICS

The renewal is worth more than the sale

Consumer headset pricing collapsed and took hardware margin with it, which is why software already accounts for 44% of supplier revenue across the field and the share continues rising each year. A grant funded capital sale ends at installation and nothing replaces the equipment when it ages, because no operating budget line exists for it anywhere. An annual licence is a worse contract and a considerably better business, since renewals surface problems while there is still time left to fix them properly.
04 / REIMBURSEMENT PATHWAY INVESTMENT

Health economics, not efficacy, moves payers

Only about 9% of national payers hold a dedicated code for immersive rehabilitation, which forces purchasing into capital budgets and research grants that never fund replacement. The submissions that succeed carry health economic evidence rather than the clinical efficacy data the field spent fifteen years generating instead. That work costs substantially more than the efficacy trials did, and it is precisely the barrier that smaller competitors cannot clear at all, which makes it the most durable position available in the category.

Engagement Snapshot From the Field

A live engagement with an industry participant carrying material or product regulatory and market exposure ahead of a defining policy shift, showing how our research translates into a defensible multi-year portfolio strategy.
MARKET MINDS ADVISORY · CLIENT ENGAGEMENT SUMMARY
VR Stroke Rehabilitation Producer Strategic Portfolio Review and Transition Roadmap 2026·Investment Scenario on VR Stroke Rehabilitation Exposure Evaluation 2025-26
CLIENT PROFILE
A rehabilitation technology developer selling immersive upper limb therapy systems to hospital rehabilitation departments across Western Europe and North America. Annual revenue was approximately 19 million dollars (client-reported, unverified by MMA), roughly two thirds from capital hardware sales. Regulatory clearances were held on a single consumer headset platform that the manufacturer had recently placed under review.
STRATEGIC CHALLENGE
Sales were concentrated in upper limb motor therapy where the client's own trial data demonstrated equivalence to conventional therapy rather than superiority, which made the purchasing argument difficult with clinical directors. Management wanted to know whether to expand into cognitive rehabilitation or to defend the motor position. Nobody had assessed the single platform clearance exposure properly.
MMA APPROACH
MMA analysed the client's win and loss records against the clinical argument used in each case, separating capability objections from budget ones. Cognitive rehabilitation expansion was costed including the evidence programme required. Forty-seven expert interviews with rehabilitation directors, therapists and payer assessors established what actually drives adoption, alongside quantitative survey work across six countries.
KEY FINDINGS
  1. Equivalence evidence lost 7 of every 10 competitive evaluations against conventional therapy, since matching an established method gives a clinical director no reason to change anything.
  2. Cognitive rehabilitation inquiries had risen 3 fold across two years without any product to sell, and were being referred to competitors by the client's own sales team.
  3. Single platform clearance exposure would cost an estimated 14 months of revalidation work if the headset manufacturer withdrew the device from sale.
  4. Payer assessors in 5 of the 6 surveyed markets required health economic evidence the client had never commissioned in any form at all.
CLIENT PROFILE
A rehabilitation technology developer selling immersive upper limb therapy systems to hospital rehabilitation departments across Western Europe and North America. Annual revenue was approximately 19 million dollars (client-reported, unverified by MMA), roughly two thirds from capital hardware sales. Regulatory clearances were held on a single consumer headset platform that the manufacturer had recently placed under review.
STRATEGIC CHALLENGE
Sales were concentrated in upper limb motor therapy where the client's own trial data demonstrated equivalence to conventional therapy rather than superiority, which made the purchasing argument difficult with clinical directors. Management wanted to know whether to expand into cognitive rehabilitation or to defend the motor position. Nobody had assessed the single platform clearance exposure properly.
MMA APPROACH
MMA analysed the client's win and loss records against the clinical argument used in each case, separating capability objections from budget ones. Cognitive rehabilitation expansion was costed including the evidence programme required. Forty-seven expert interviews with rehabilitation directors, therapists and payer assessors established what actually drives adoption, alongside quantitative survey work across six countries.
KEY FINDINGS
  1. Equivalence evidence lost 7 of every 10 competitive evaluations against conventional therapy, since matching an established method gives a clinical director no reason to change anything.
  2. Cognitive rehabilitation inquiries had risen 3 fold across two years without any product to sell, and were being referred to competitors by the client's own sales team.
  3. Single platform clearance exposure would cost an estimated 14 months of revalidation work if the headset manufacturer withdrew the device from sale.
  4. Payer assessors in 5 of the 6 surveyed markets required health economic evidence the client had never commissioned in any form at all.
RECOMMENDED STRATEGY
Phase 1: Phase one: begin revalidation on a second hardware platform immediately, since single platform exposure carries an estimated 14 month recovery timeline if withdrawal happens. Phase 2: Phase two: develop cognitive rehabilitation content, where inquiries rose 3 fold across two years and equivalence evidence is not the obstacle it is in motor therapy. Phase 3: Phase three: commission health economic evidence, required by payer assessors in 5 of 6 surveyed markets and absent from the client's file entirely.
OUTCOME
The client completed second platform revalidation before the headset manufacturer confirmed withdrawal, avoiding an interruption that would have halted sales for most of a year. Cognitive content launched into a pipeline already asking for it, and licence revenue rose as a share of turnover for the first time (client-reported, unverified by MMA).

Frequently Asked Questions

Foundational context covering the market sizes, CAGR, scope, country, region and competition that inform every finding below. This section is provided to cover basics and most often pre-purchase conversations, answered from the MMA Primary Research Dataset.

What is the current size of the VR Stroke Rehabilitation Market?

The market was valued at 0.29 billion dollars in 2025, covering immersive and non-immersive systems, clinical software and remote monitoring services worldwide. It reaches an estimated 0.33 billion dollars during 2026.

How large will the VR Stroke Rehabilitation Market be by 2036?

MMA forecasts 1.36 billion dollars by 2036, an increase of 1.03 billion dollars over the 2026 base. That represents an expansion multiple of 4.12 times across the forecast period.

What is the CAGR for the VR Stroke Rehabilitation Market 2026 to 2036?

The base case compound annual growth rate is 15.2%, with a bull case of 16.4% and a bear case of 13.8%. Reimbursement pathway decisions and home adherence separate those two scenarios.

Which segment is growing fastest?

Cognitive and executive function rehabilitation grows at 22.8%, half again the market rate of 15.2%, because conventional therapy handles that deficit worst. Speech and language rehabilitation follows at 19.4%.

Who are the major companies in the VR Stroke Rehabilitation Market?

MindMaze, Penumbra, XRHealth, CUREosity and Neuro Rehab VR lead on installed base and associated licence revenue. Together they account for 34% of the global market.

Which country is growing fastest?

China grows fastest at 19.8%, because it carries the largest national stroke burden anywhere and is building dedicated rehabilitation capacity rather than converting existing hospital wards.

Report Segmentation Architecture

The full report scope spans multiple orthogonal segmentation dimensions, with cross-tabulated demand data provided for each dimension pair. Coverage extends further to regional breakdowns, trend trajectories, and the competitive detail needed to support segment-level decision-making.

By Therapeutic Target

  • Upper Limb Motor Rehabilitation
  • Lower Limb and Gait Rehabilitation
  • Balance and Postural Control
  • Cognitive and Executive Function Rehabilitation
  • Speech and Language Rehabilitation
  • Visual and Spatial Neglect Rehabilitation

By End-Use Industry

  • Acute Stroke Units
  • Inpatient Rehabilitation Hospitals
  • Outpatient Rehabilitation Clinics
  • Home and Community Care
  • Long Term Care Facilities
  • Academic and Research Centres

By Commercial Dimension

  • Capital Equipment Purchase
  • Software Licence Subscription
  • Managed Service Contracts
  • Research Grant Procurement
  • Payer Reimbursed Delivery
  • Distributor and Integrator Supply

By Region

  • North America
  • Western Europe
  • East Asia
  • South Asia and Pacific
  • Latin America
  • Middle East and Africa
  • Eastern Europe

Scope, Methodology, and Coverage

Every figure in this report is reproducible from documented input assumptions. The scope below maps the historical period, the forecast horizon, the segmentation dimensions, and the countries covered, alongside the underlying primary and qualitative methodology.
Historical Period
2020 to 2025
Forecast Period
2026 to 2036
Base Year
2025 (USD billions; MMA Primary Research Dataset, August 2026)
Market Definition
Virtual and mixed reality systems used in clinical rehabilitation of stroke survivors worldwide, covering immersive head mounted and non-immersive screen based hardware, haptic and motion sensing peripherals, cleared clinical software platforms, and remote monitoring services delivered under a prescribed rehabilitation pathway. Measured at supplier revenue. Robotic exoskeletons and end-effector robots without virtual reality content, functional electrical stimulation devices, general neurological assessment equipment, and consumer gaming hardware sold outside a clinical pathway are excluded from scope.
Quantitative Units
USD billions (supplier revenue); systems installed; USD per system and per patient licence
Segmentation Dimensions
Therapeutic target; end-use industry; commercial dimension; region
Regions Covered
North America, Western Europe, East Asia, South Asia and Pacific, Latin America, Middle East and Africa, Eastern Europe
Countries Covered
United States, Canada, United Kingdom, Germany, France, Netherlands, Switzerland, Sweden, Italy, Spain, China, Japan, South Korea, Taiwan, India, Australia, Singapore, Brazil, Mexico, Saudi Arabia, Israel, Poland
Key Companies Profiled
MindMaze, Penumbra, XRHealth, CUREosity, Neuro Rehab VR, Tyromotion, Motek Medical, Hocoma, BTS Bioengineering, Virtualware, Rehametrics, SyncVR Medical, Immersive Rehab, Evolv Rehabilitation Technologies, MediTouch, Neofect, Bionik Laboratories, Saebo, Fourier Intelligence, Reha Technology
Quantitative Methodology
Primary survey, n=3,800 respondents, Q4 2025, six countries; demand-side model with trade association cross-validation
Qualitative Methodology
47 expert interviews, Q4 2025; applied to validate demand model assumptions, identify emerging dynamics, and assess competitive positioning
Report Format
PDF and XLSX data workbook (Word format preview document)
Publisher
Market Minds Advisory
Report Code
MMA-2026-MED-134
Published
August 2026
Contact
sales@marketmindsadvisory.com | www.marketmindsadvisory.com

Purchase the full VR Stroke Rehabilitation Market Report (2026 to 2036).

The full report argues that fifteen years of trials answered the wrong question, proving virtual reality matches conventional arm therapy while the deficit affecting three in five survivors went untreated. It sizes all six therapeutic targets independently through 2036, models reimbursement pathway status by jurisdiction, and quantifies home adherence against remote monitoring design. Regional chapters cover all seven regions, with Chinese capacity building assessed separately from Western institutional purchasing. Competitive profiling covers 20 participants on one consistent installed base measure, with evidence files assessed individually.
Six therapeutic targets sized independently through 2036
Reimbursement pathway status mapped by payer jurisdiction
Home adherence quantified against remote monitoring design
Hardware discontinuation exposure assessed by supplier platform strategy
Chinese capacity building separated from Western institutional purchasing
Twenty participants profiled on one consistent installed measure

Built For The People Who Decide

From boardroom strategy to bench-side execution, this report is read cover-to-cover by leaders shaping the next decade of their industry, turning demand scenarios, market dynamics and valuation benchmarks into decisions.
CXOs/ Presidents/ VPs/ Managers
M&A and Corporate Development
Strategy Teams and R&D Heads
Procurement and Product Directors
Regulatory and Compliance Leaders
Investor Relations and Equity Analysts