Market Minds Advisory
Vision Screeners Market

Vision Screeners Market: Sold To Clinicians Who Do Not Treat Eyes

Roughly 74% of these devices are bought by paediatricians, school nurses and occupational health staff who provide no eye care at all, and the purchase is justified by a reimbursement code rather than clinical preference.

Lead Analyst

Published

September 2026

Make Smarter Decisions with Customized Research Insights

Request a free sample report and evaluate market opportunities, growth trends, and competitive dynamics relevant to your business needs.

2025 MARKET VALUE$0.6BMarket Size 2025
2036 FORECAST VALUE$1.4BBase Case , 2026 to 2036
CAGR 2026 TO 20367.8 %Bull 9.0% / Bear 6.6%
INCREMENTAL OPPORTUNITY$0.7BNet 10- year value creation
EXPANSION MULTIPLE2.11x2036 value over 2026 base
Strategic Levers
M&A Pipeline
Regional Outlook
Country Rankings
Competitive Intelligence
Segmental Deep-dive
Call-Us : 91 93563 13602

Executive Snapshot and Market Trajectory

The buyer here is not an eye doctor and never will be. Around 74% of these devices go to paediatricians, school nurses and occupational health staff who provide no eye care, which means the device must return a referral decision rather than a prescription.
North America takes 31% of value because instrument-based screening carries a reimbursement code that makes the purchase an arithmetic exercise: roughly 340 screenings and the device has paid for itself. East Asia takes 27% and screens far more children than anywhere on earth through national school programmes, at device prices a fraction of Western levels. Smartphone systems grow at 11.7%. Unit volume and category revenue plainly sit in two quite different places here entirely.
Concentration reaches 57%. The clinical deadline is what gives the category its urgency, since amblyopia treated before roughly age seven usually resolves and treated afterwards largely does not. False referral rate near 12% is the specification that actually decides whether a practice keeps using the device it bought. Amblyopia found at nine or ten leaves permanent vision loss in one eye, which is what gives early screening its whole value.
Market Definition
The market covers instruments and systems used to detect vision problems and refractive risk without providing a full refraction or diagnosis, spanning handheld photoscreeners, tabletop autorefractor screeners, occupational and driver vision screeners, smartphone and app-based screening systems, digital visual acuity chart systems, and wearable and binocular function screeners. Full diagnostic refraction equipment, ophthalmic imaging and surgical devices, spectacle lenses, contact lenses and other worn vision care products, and professional eye examination services are excluded from scope.
Base Year Value
$0.6B in 2025 (MMA Primary Research Dataset, August 2026)
Forecast Period
2026 to 2036, eleven discrete annual values
CAGR
7.8% base case. Bull 9.0%. Bear 6.6%.
Fastest Growth Segment
Smartphone and App-Based Screening Systems: 11.7% CAGR
Fastest Growth Country
India: 9.8% CAGR
Fastest Growth Region
South Asia and Pacific: 10.0% CAGR
Largest Region
North America: 31% of 2025 global value
Market Leaders
Welch Allyn, Plusoptix, Adaptica, Nidek, Topcon Healthcare. Source: MMA Analysis based on disclosed vision screening device revenue and installed base, company annual reports 2025.
Primary Survey
n=3,800 procurement and R&D decision-makers, Q4 2025, six countries
Methodology
Demand-side build-up, cross-validated against public data, 47 expert interviews

Vision Screeners Market Forecast Scenarios

vision-screeners-market-size-forecast-scenario-1787712294571
Growth from 2020 to 2025 ran at 6.6% and two very different forces produced it. Paediatric guideline bodies recommending instrument-based screening from around twelve months of age moved photoscreeners into general paediatric practice across North America and Western Europe. Separately, national school screening programmes across East Asia created enormous unit volume at price points that bear almost no relation to what a Western practice pays for the same function.
The 7.8% base case rests on three mechanisms. Smartphone and app-based systems keep expanding screening into settings that could never justify a dedicated instrument. School and community programmes keep broadening across South Asia and Latin America as public health funding reaches vision. And occupational screening keeps growing steadily wherever workplace and driver licensing requirements tighten, which is a quiet segment that nobody markets loudly. None of the three needs a new device.
The bull case at 9.0% assumes reimbursement for instrument-based screening extends into additional health systems, which would repeat in Europe what already happened in North America. The bear case at 6.6% is false referral rates undermining confidence, since a device sending 12% of healthy children to an optometrist damages the referring relationship and quietly stops being used at all.

A Code, A Deadline, A Referral

Almost every ophthalmic device is sold to somebody who treats eyes. This one is not. Roughly 74% of vision screeners are bought by paediatricians, school nurses, community health workers and occupational health staff, none of whom refract, prescribe or treat. That determines the whole product specification: a pass or refer answer in about eight seconds on an uncooperative child, with no interpretation required.
FIVE-FIRM CONCENTRATION57%Share of category revenue held by the largest device suppliers
DEVICE PAYBACK SCREENINGS340Screenings needed before a device repays its purchase price
AMBLYOPIA TREATMENT WINDOWAge 7Age beyond which amblyopia treatment largely stops working
FALSE REFERRAL RATE12%Screened children referred who need no clinical intervention
NON-SPECIALIST PURCHASER SHARE74%Devices bought by clinicians who provide no eye care
SCREENING SESSION DURATION8 secondsTime a handheld device needs per child screened
The purchase is justified by a code rather than by clinical enthusiasm. Where instrument-based ocular screening is separately reimbursed, a paediatric practice can calculate that roughly 340 screenings repays the device, after which it contributes. Sales conversations in those markets are payback conversations. Where no such code exists, the same device has to be justified as a cost, and adoption in those markets runs years behind at identical clinical merit.
Underneath sits a deadline that no other screening quite shares. Amblyopia detected and treated before roughly age seven usually resolves; detected afterwards, the vision loss is generally permanent. That gives screening in the first years of life a value that decays to almost nothing later. It also raises the cost of a miss, which is why the sensitivity trade-off is argued over more than price.
"Nobody buys these because they are interested in eyes. They buy them because a code makes the maths work, and they stop using them the moment the optometrist down the road complains about being sent healthy children."
Director, Ophthalmic Diagnostics Practice · MMA Ophthalmic Diagnostic Devices Practice · August 2026

Market Trends

Reimbursement Coding Converts Adoption Into Simple Arithmetic

Where instrument-based ocular screening carries its own reimbursement code, a paediatric practice calculates that roughly 340 screenings covers the device and everything after that contributes. The sale becomes an arithmetic exercise rather than a clinical argument. Markets without such a code adopt the identical device years later at identical clinical merit, purely because it has to be justified as an expense. Manufacturers who understood this shaped their whole commercial approach around payment policy rather than product features. Payment policy, not product features, is where a national market actually opens up.
Market Impact: Closes treatment window at age 7
Smartphone Systems Reach Settings Instruments Never Could

App-based screening using a phone camera and controlled illumination grows at 11.7% by reaching community health workers, schools and rural clinics that could never justify a dedicated instrument costing thousands of dollars. Accuracy trails purpose-built photoscreeners, which matters clinically and matters less where the alternative is no screening whatsoever. Regulatory clearance varies considerably between markets. The segment is expanding the screened population rather than taking volume from existing devices at all. Where the alternative is nothing, a device that is 85% right beats one that is never present at all.
Market Impact: Grows India fastest at 9.8%

Market Opportunities and Growth Drivers

Amblyopia Treatment Window Closes Around Age Seven

Amblyopia detected and treated before roughly age seven usually resolves with patching or optical correction, while the same condition found at nine or ten leaves permanent vision loss in one eye for life. That deadline gives early screening a clinical value nothing else in paediatric vision carries, and it is the argument that persuaded guideline bodies to recommend instrument-based screening from around twelve months. Parents understand the deadline immediately once anybody explains it to them properly. Detection at three costs a patch; detection at ten costs the use of an eye.
Market Impact: Refers 12% of healthy children

School And Community Programmes Reach Unscreened Populations

National and state school screening programmes across East Asia, South Asia and Latin America are reaching child populations that had no vision screening at all, and India grows fastest of any country at 9.8% as public health funding extends toward vision. Programme procurement buys in volume at tender pricing rather than per practice. Device durability and battery life matter more than optical refinement, since the instrument is carried between schools daily by people who are not clinicians. Optical refinement wins almost no points in a tender specification document anywhere at all.
Market Impact: Delays adoption by 5 years

Market Restraints and Challenges

False Referrals Quietly Destroy The Referral Relationship

A screener sending roughly 12% of healthy children to an optometrist floods that practice with normal examinations and strains the professional relationship the referring clinician depends on. Root cause is that raising sensitivity to avoid missing amblyopia inevitably lowers specificity. Commercial impact is devices that stop being used without ever being returned or complained about. Mitigation runs through referral criteria tuning, follow-up data sharing and honest specificity disclosure, which better manufacturers now provide openly. A device that stops being used still counts as a sale and never as a renewal.
Market Impact: Repays devices in 340 screenings

No Reimbursement Code Means No Adoption Curve

Health systems without a separate payment for instrument-based ocular screening adopt the same devices years behind those that have one, despite identical clinical evidence and identical guideline recommendations sitting behind both. Root cause is that a paediatric practice cannot fund equipment out of a consultation fee that does not change. Commercial impact is entire national markets that simply do not develop. Mitigation involves health economic dossiers and payer engagement, which is slow, expensive and occasionally works. Payer bodies move on their own timetable, and no amount of clinical marketing accelerates it.
Market Impact: Grows app screening at 11.7%
2 additional market trends, 4 additional growth drivers, and 3 additional restraints and challenges are covered in the full report. Contact sales@marketmindsadvisory.com to access the complete intelligence.

Segment CAGR and Growth Architecture

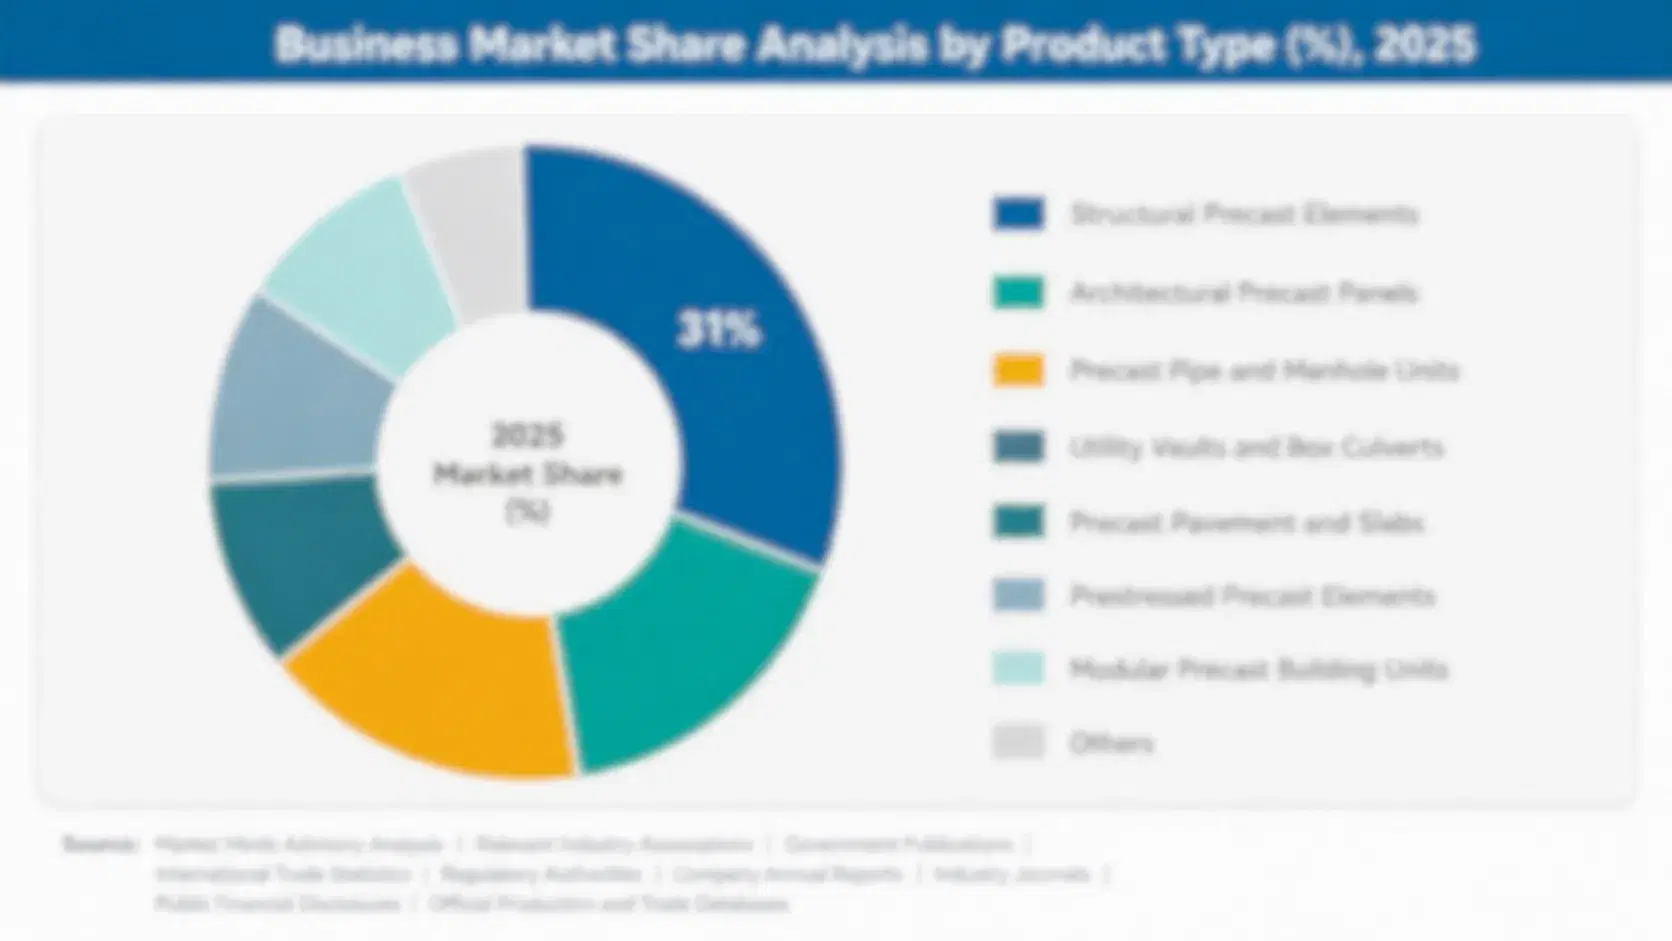
Segmentation follows device type and screening modality: what the instrument physically is and how it obtains its result. Six categories cover the market without overlap. Screened population, care setting and procurement route are treated as separate commercial dimensions throughout this report rather than as segmentation logic in their own right, since each cuts across every device type.
vision-screeners-market-market-share-analysis-1787712294855

Smartphone and App-Based Screening Systems

Applications using a phone camera with controlled illumination and analysis software grow at 11.7%, half again the market rate of 7.8%, by reaching community health workers, school programmes and rural clinics that could never justify a dedicated instrument. Accuracy trails purpose-built photoscreeners measurably, which matters where alternatives exist and matters far less where the alternative is no screening at all. Regulatory clearance and reimbursement eligibility both vary considerably between markets, and the segment expands the screened population rather than displacing existing device volume. Subscription and per-screening pricing models are common here rather than outright purchase, which changes the revenue architecture and makes the comparison against instrument pricing considerably less direct than it looks.
CAGR 11.7%

Handheld Photoscreeners

Binocular infrared photoscreeners capture a refractive estimate and detect amblyopia risk factors in roughly eight seconds at arm's length, which is the only workflow that functions on an uncooperative toddler in a paediatric room. Growth at 9.0% follows guideline recommendation and reimbursement coding rather than any recent optical advance. The commercial contest is fought over specificity, since a device referring 12% of healthy children damages the referring practice's relationships and stops being used long before anybody formally complains about it. Guideline bodies recommending instrument-based screening from around twelve months of age did more for this segment than any optical development of the past decade managed to achieve anywhere at all.
CAGR 9.0%
Full segment breakdown across 6 segments available in the complete report.

Regional Architecture and Country Demand Map

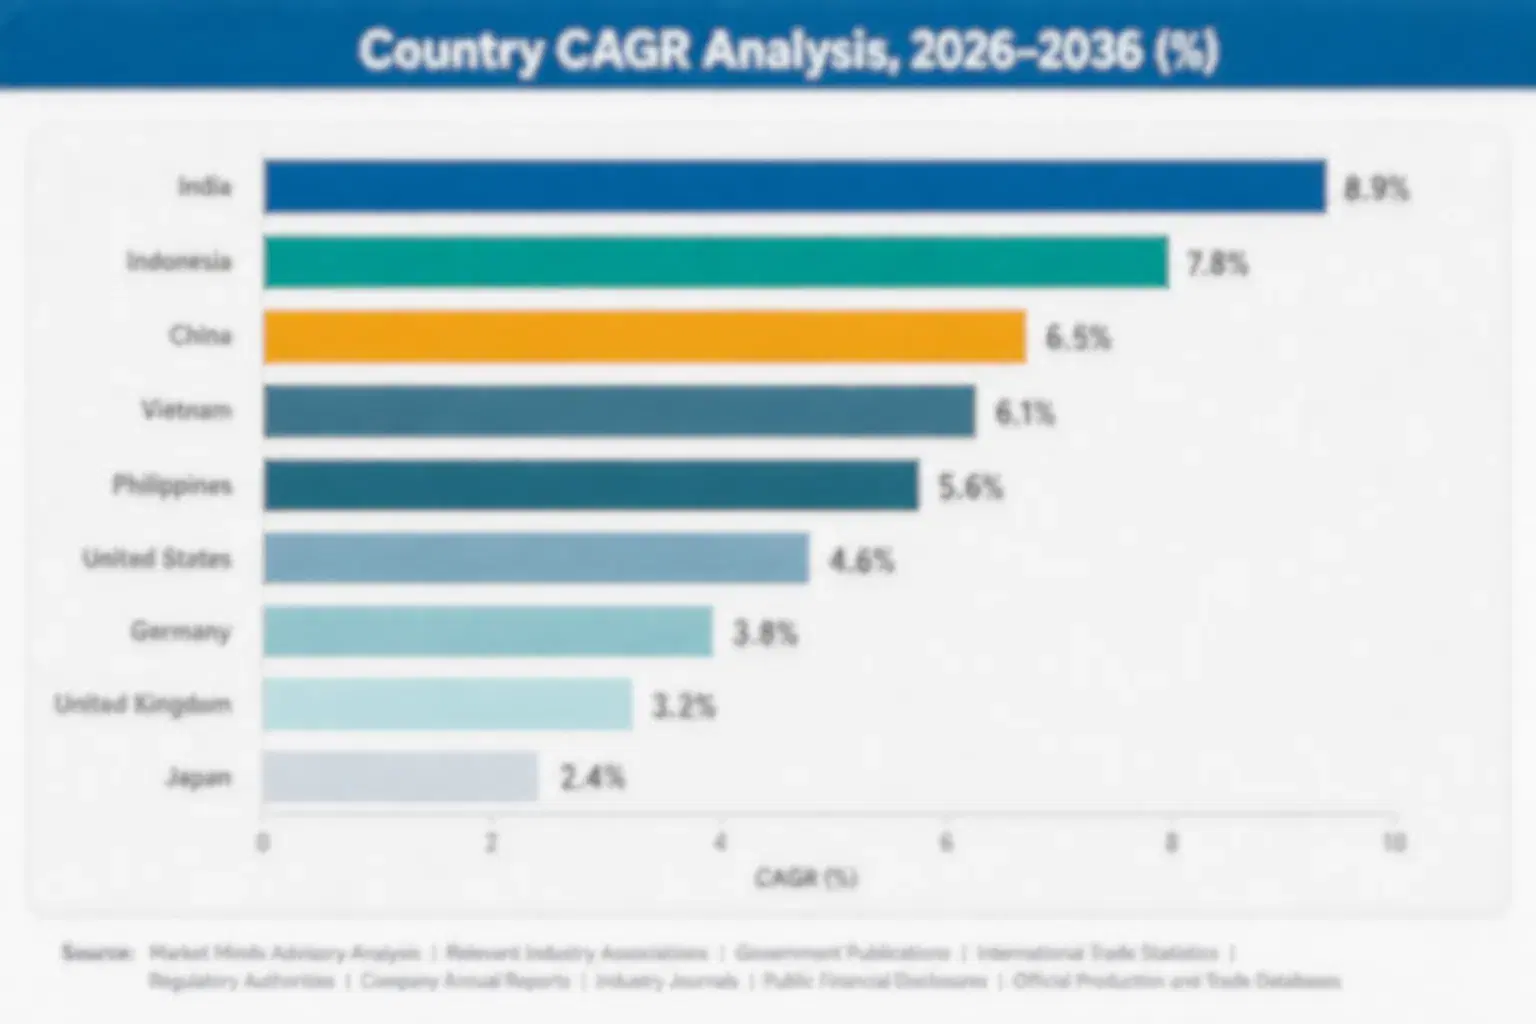
Geography follows reimbursement policy and public screening programme funding rather than child population. North America leads on value through coded reimbursement, while East Asia screens far more children through national school programmes. Child population numbers alone predict very little about where the revenue actually lands.

North America

Instrument-based ocular screening carries its own reimbursement code, which turned adoption into an arithmetic exercise for paediatric practices and produced the deepest installed base anywhere. Paediatric guideline recommendation from around twelve months of age reinforced it. Occupational and driver vision screening adds a steady institutional segment that operates on entirely separate purchasing logic. Device pricing is the highest of any region, and manufacturers structure their whole commercial approach around payment policy rather than around clinical marketing at all. Replacement cycles run six to eight years, so the installed base depth that reimbursement created also means new site growth is slowing as paediatric practice approaches genuine saturation in several states already.
Share: 31% | CAGR: 7.0% (2026 to 2036)

Western Europe

Adoption trails North America by several years despite identical clinical evidence, because most national systems do not pay separately for instrument-based screening and a paediatric practice cannot fund equipment from an unchanged consultation fee. Where public child health programmes procure centrally, as in parts of Scandinavia and the Netherlands, penetration is considerably better. Occupational screening under workplace health rules is well established across Germany and France. Manufacturers here spend heavily on payer engagement with mixed results. Smartphone-based systems have found less traction than elsewhere, since regulatory expectations are high and the alternative in most settings is an existing screening pathway rather than no screening whatsoever anywhere at all here. Adoption follows payment.
Share: 20% | CAGR: 6.2% (2026 to 2036)
Regional intelligence for 5 additional markets available in the complete report: East Asia, South Asia and Pacific, Latin America, Middle East and Africa, Eastern Europe. Contact sales@marketmindsadvisory.com.
vision-screeners-market-country-cagr-analysis-1787712295148

Selling Payback, Not Better Optics

Roughly 74% of buyers provide no eye care, about 340 screenings repay a device where reimbursement exists, false referrals near 12% quietly kill usage, and amblyopia treatment stops working around age seven. Four levers work on payment policy, specificity, programme procurement and non-clinical usability rather than on optical performance of any kind at all.

Engage Payers Before Engaging Any Clinicians

Markets with a reimbursement code for instrument-based ocular screening adopt these devices roughly five years ahead of markets without one, at identical clinical evidence and identical guideline recommendation. Payer engagement and health economic dossiers therefore matter more than any product feature. It is slow, expensive work that occasionally fails entirely, and it is the only thing that opens a national market. Manufacturers treating it as regulatory overhead rather than as commercial strategy consistently arrive late. A code decision by 1 payer body opens more volume than 10 years of clinical marketing has ever produced.
Market Impact: Accelerates national market adoption by 5 full years

Compete On Specificity, Not On Sensitivity

Every manufacturer claims it will not miss amblyopia, and buyers assume that. What quietly decides whether a device keeps being used is the roughly 12% of healthy children it refers unnecessarily, because that floods the optometrist and strains a professional relationship the paediatrician values considerably. Publishing referral outcome data, tuning criteria by age and supporting follow-up reconciliation all address it. Devices that stop being used are rarely returned and almost never complained about formally. Sensitivity claims are simply assumed by everybody; specificity is the thing actually being measured in practice.
Market Impact: Reduces the 12% rate of unnecessary child referrals

Build For Programme Tender Rather Than Practice

School and community programmes buy hundreds of units at once through tenders weighing durability, battery life and unit price far above optical refinement, since devices are carried between schools daily by staff who are not clinicians. That is a different product and a different sales motion from a paediatric practice purchase. Manufacturers running one range for both consistently lose tenders on cost and lose practices on capability, satisfying neither buyer properly. A tender for 2,000 units decided on a 15% price gap is not a contest a premium range can enter at all.
Market Impact: Wins tenders running to 100 units or more

Design For Operators With No Eye Training

Around 74% of these devices are used by people who do not refract, prescribe or treat, so anything requiring interpretation is a design failure rather than a feature. A pass or refer result in roughly eight seconds, with no settings to adjust and no image to read, is the actual specification. Manufacturers carrying clinical configurability from their ophthalmic ranges into screening devices consistently produce products that sit unused in a cupboard within a year. Configurability that an eye clinic values becomes an outright liability in a school nurse's hands entirely.
Market Impact: Serves the 74% who provide no eye care

Who Controls the Margin Pool

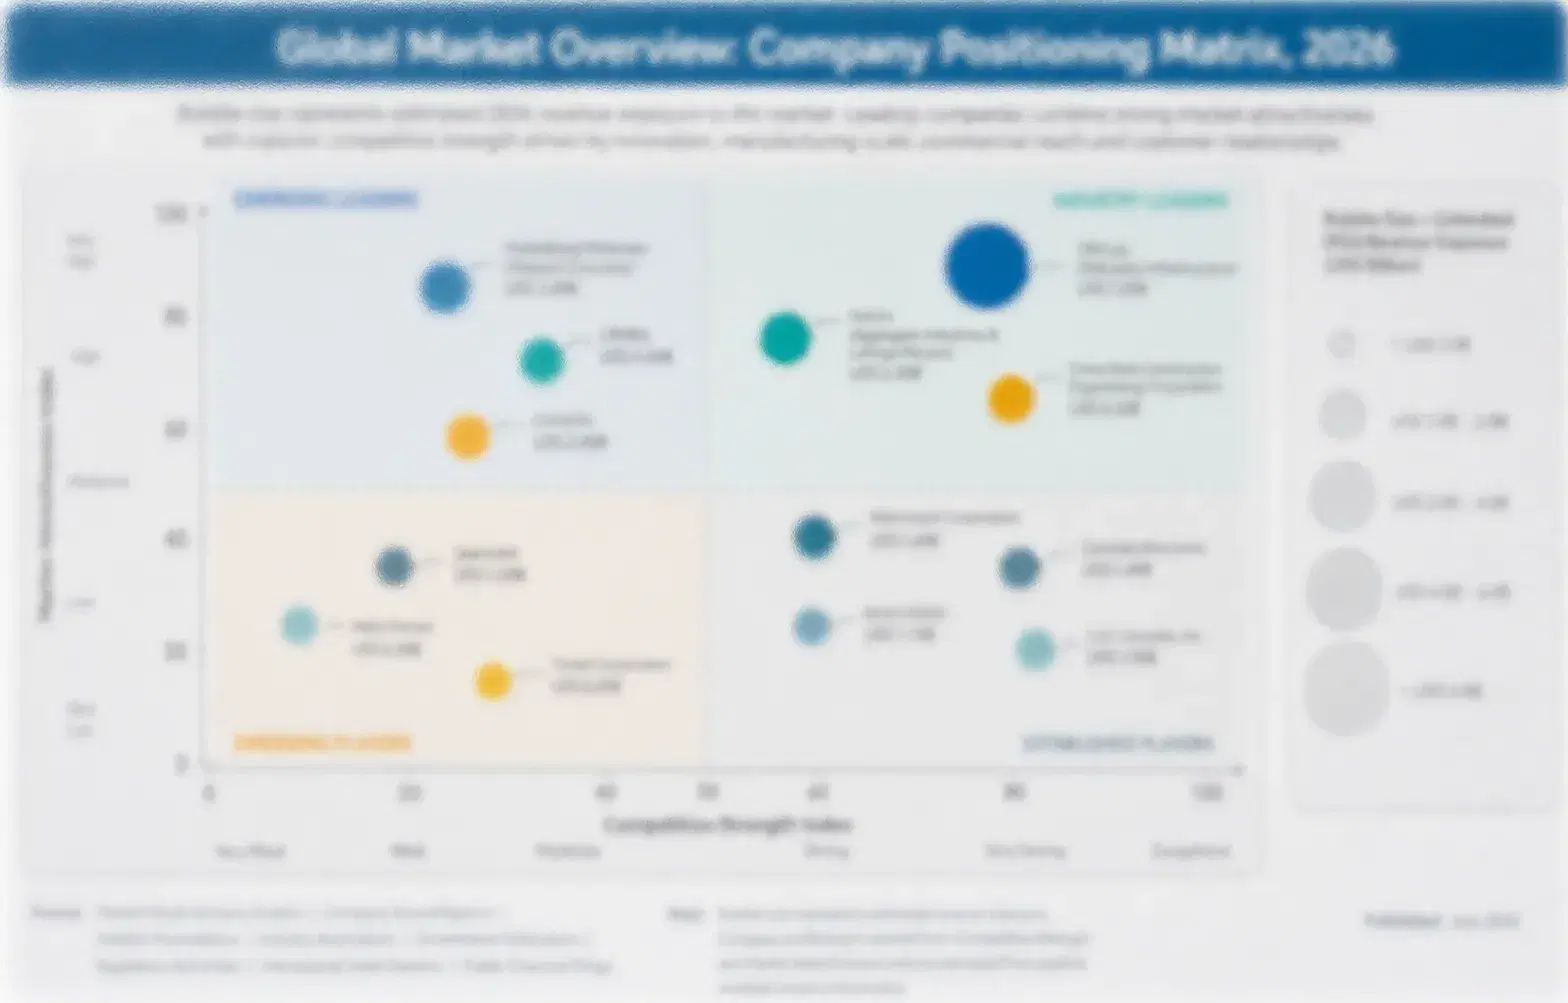
Measured on disclosed vision screening device revenue and installed base, the five largest suppliers hold a CR5 of 57%, which is high for a small category and reflects how much of it turns on regulatory clearance and reimbursement eligibility rather than on manufacturing scale. Welch Allyn and Plusoptix hold the deepest paediatric photoscreener positions, Adaptica competes on portability and programme suitability, and Nidek and Topcon bring ophthalmic instrument depth into tabletop screening formats. None of them competes primarily on optics.
Three contests define activity. Paediatric practice supply competes on reimbursement eligibility and specificity performance rather than on price. Programme tenders compete on durability, battery life and unit cost almost exclusively. And occupational screening competes on compliance documentation, where the buyer is a safety department rather than any clinician at all. Smartphone systems compete on reach into settings no instrument served.

Pressure builds from smartphone-based entrants reaching settings instruments never served, and from Chinese manufacturers supplying national programme volume at tender prices. Rankings shift toward whoever holds reimbursement eligibility and referral outcome evidence together. Optical performance is assumed by every buyer and argued over by almost none of them any more.
vision-screeners-market-company-positioning-matrix-1787712295426

Competitive Moat and Risk Dimensions

WELCH ALLYN

Moat: Paediatric Channel And Coding Position

Welch Allyn sells into paediatric practice alongside a broad primary care instrument range, which places a screener inside a purchasing relationship that already exists. Reimbursement eligibility and coding support are well established. A competitor with better optics still has to reach a paediatrician who buys instruments once every several years and has little interest in eyes.
WELCH ALLYN

Risk: Programme Tender Price Exposure

The volume growth in this category sits in school and community programme tenders that weigh unit price and durability far above the clinical refinement a practice-focused range carries. Devices designed for a paediatric room lose those tenders on cost. Building a separate programme range costs development spending that the practice channel does not obviously justify.
PLUSOPTIX

Moat: Specificity Data And Referral Credibility

Plusoptix built its position on published referral criteria and outcome data that let a paediatrician predict how many healthy children a device will send onward, which is the number that decides whether the instrument stays in use. That evidence took years of field data. A newer entrant claiming equivalent sensitivity cannot demonstrate the specificity record that actually matters here.
PLUSOPTIX

Risk: Narrow Category Concentration

A position concentrated almost entirely in paediatric vision screening carries no adjacent range to absorb a reimbursement policy change or a guideline revision in any single market. Broader instrument suppliers spread that exposure across many product lines. Smartphone-based screening also reaches settings a dedicated instrument was never going to serve at all.

Players Tracked

Prominent Players

Welch Allyn
Plusoptix
Adaptica
Nidek
Topcon Healthcare

Other Key Players

Essilor Instruments
Huvitz
Righton
Stereo Optical
Keystone View
Marco Ophthalmic
Reichert Technologies
Chongqing Kanghua
Shenzhen Certainn
Suoer Electronic
GoCheck Kids
EyeQue
Luneau Technology
Medmont
Vmax Vision

Recent Developments

JANUARY 2025

National programme tender awards school screening devices at volume

A national school health programme awarded a multi-year tender covering several thousand portable vision screening devices, a public procurement award rather than any corporate transaction. Specifications weighted battery life, drop resistance and unit price considerably above optical refinement, reflecting daily transport by non-clinical staff between schools.
Signal: Programme specifications reward durability and cost in ways that practice-focused product ranges consistently fail to satisfy.
MAY 2025

Manufacturer publishes referral outcome data across paediatric installed base

A screener manufacturer published referral outcome reconciliation data gathered across its paediatric installed base, showing how many referred children required intervention. This was a voluntary evidence disclosure rather than any regulatory submission, acquisition or commercial arrangement with any of the practices actually involved in it.
Signal: Publishing specificity outcomes addresses the one concern that quietly ends device usage without any formal complaint.
SEPTEMBER 2025

Health system adds instrument-based screening to reimbursed child services

A national health system added instrument-based ocular screening to its reimbursed child health service schedule, a payment policy decision rather than any commercial agreement with device manufacturers. Paediatric practices in that market had previously funded any such equipment entirely out of unchanged general consultation revenue instead.
Signal: A payment code opens a national market faster than any amount of clinical marketing has managed.

Sensors, Optics And Boards

The bill of materials is mostly electronics rather than optics, which surprises people. CMOS image sensors, infrared illumination arrays, embedded processing boards and displays, precision moulded optical housings and calibration components together account for 31 to 39% of finished device cost, with regulatory documentation and clinical validation adding substantially more. Sensor and microcontroller supply comes from the general semiconductor market, where medical device volumes are trivially small beside automotive demand.
The volatility that mattered was the semiconductor shortage through 2021 and 2022. Image sensor and microcontroller lead times extended from weeks to well over a year, and SEMI industry data records the capacity and allocation conditions across the period. Medical device manufacturers were deprioritised almost everywhere, since their annual volumes rarely justify allocation against a car maker. Several suppliers redesigned boards around whatever parts they could obtain.

Exposure divides by design flexibility rather than by scale. Suppliers who designed around single-sourced sensors and microcontrollers carried the sharpest exposure and the longest outages. Those with multi-sourced board designs and pre-qualified alternates continued shipping throughout. Chinese manufacturers with domestic sensor and board supply hold a cost position roughly a third below Western production, which matters enormously in tenders decided on unit price.
vision-screeners-market-cost-volatility-analysis-1787712295738

Design boards around multi-sourced sensors and controllers

Single-sourced image sensors and microcontrollers left several suppliers unable to ship at all when allocation tightened, and a medical device redesign carries revalidation taking many months. Designing for multiple qualified parts costs engineering effort and some performance compromise upfront. It converts an allocation crisis into a purchasing decision, which is the difference between shipping and simply stopping.

Hold buffer inventory on regulated critical components

Components inside a cleared medical device cannot be swapped freely, so an outage on one part stops production entirely regardless of commercial alternatives. Holding buffer stock ties up working capital against parts that may become obsolete before use. It bought continuity for the suppliers who did it through a shortage that removed competitors for whole quarters.

Separate programme device design from practice device design

Programme tenders weigh unit price and durability far above the optical refinement paediatric practices value, and a single range satisfying both satisfies neither properly in the end. A dedicated programme design costs separate development and separate regulatory clearance work. It allows a genuinely competitive tender price without discounting the practice range or damaging its positioning anywhere else.

Portfolio Architecture for Margin Defence

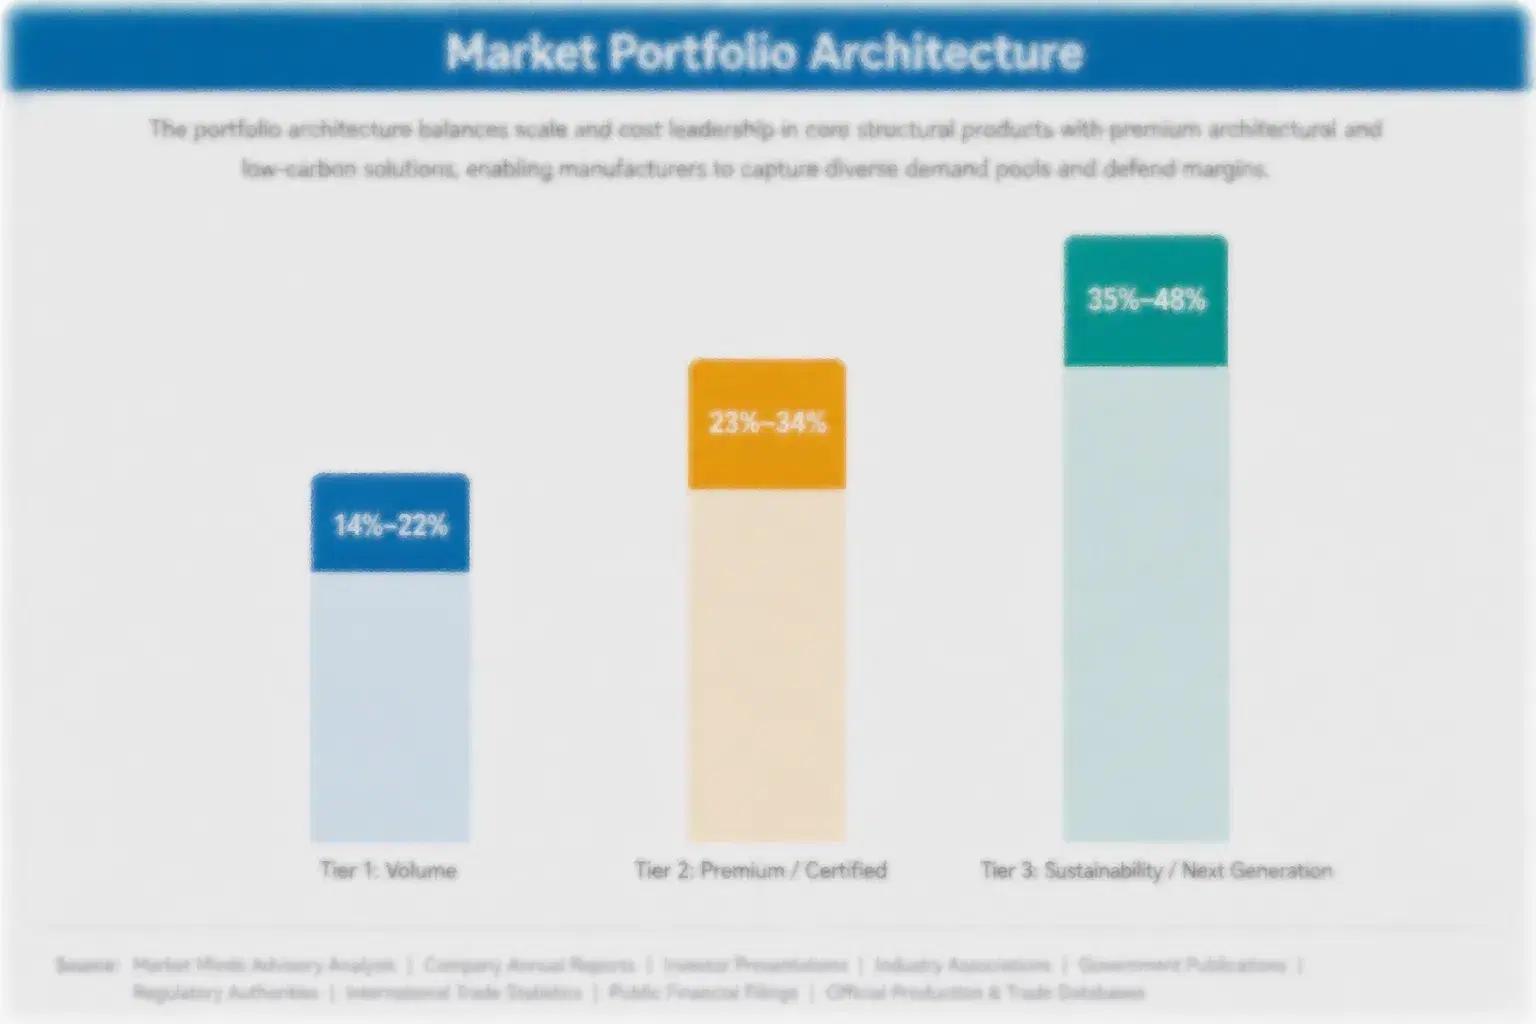
Margin follows reimbursement eligibility rather than technical capability, which is not what device engineers expect to hear. Programme tender devices earn thinly against unit price competition. Digital acuity chart systems earn modestly on commoditised display hardware. Occupational screeners earn moderately on stable institutional replacement. Tabletop autorefractor screeners earn well in clinical settings. Handheld photoscreeners sold into reimbursed paediatric practice earn best, because the buyer is calculating payback rather than comparing prices.
The tension is that the volume growth and the margin sit in different places entirely. Programme tenders across East Asia, South Asia and Latin America deliver units in thousands at prices that leave very little, while reimbursed paediatric practice delivers margin one device at a time. A supplier serving both needs two product ranges and two commercial teams, and most have tried to serve both with one of each.

High-value pools sit in three places. Reimbursement-eligible handheld photoscreeners sold on payback arithmetic. Published referral outcome evidence, which is not a product but determines whether devices stay in use and get replaced. And occupational screening, a quiet institutional segment with predictable replacement cycles that almost nobody markets against seriously.

Volume / Commodity-Adjacent

Programme tender devices and digital acuity chart systems competing on unit price and durability. The 10-point range separates manufacturers with domestic sensor and board supply from those buying components on the open semiconductor market.
Gross Margin: 24-34%

Premium / Certified

Occupational screeners and tabletop autorefractor screeners sold into institutional and clinical settings under compliance requirements. The 12-point spread reflects how differently safety department procurement and clinical purchasing behave across otherwise comparable instruments.
Gross Margin: 46-58%

Sustainability / Regulatory / Next-Generation

Reimbursement-eligible handheld photoscreeners and smartphone systems sold on payback arithmetic and screening reach. The 16-point range is wide because coded paediatric device economics and app-based subscription economics follow entirely different commercial logic.
Gross Margin: 58-74%
vision-screeners-market-portfolio-architecture-1787712296073

High-value Sub-segments and Strategic Watch-out

Reimbursed Handheld Photoscreeners

Highest margin, sold to a buyer calculating that roughly 340 screenings repays the device rather than comparing prices against alternatives. The risk is that reimbursement policy is a single decision by a payer that can be revised without any warning at all. Policy is the single point of failure.
Gross Margin: 64-74%

Smartphone Screening Systems

Fastest growth at 11.7%, reaching community and rural settings that could never justify a dedicated instrument costing thousands. The risk is that accuracy trails purpose-built devices measurably, which invites regulatory attention wherever alternatives genuinely exist. Regulators are now beginning to look at exactly that question.
Gross Margin: 58-70%

Occupational Screening Devices

The steady institutional core, replaced on predictable cycles under workplace and driver licensing requirements that change slowly. Suppliers hold it because it funds development without the policy volatility that paediatric reimbursement brings with it constantly. It is dull revenue, and it is also entirely dependable.
Gross Margin: 46-56%

Programme Tender Price Erosion

The strategic watch-out. Volume growth sits in tenders decided on unit price and durability, where Chinese manufacturers hold roughly a third cost advantage. The risk is winning units while losing the economics that funded the product in the first place. Units without economics are not a business.
Gross Margin: 22-32%

Bought Once, Replaced Slowly

This is capital equipment with a very long life and almost no consumable stream, which makes the revenue architecture unusual for a medical device. A paediatric practice buys one screener and keeps it for six to eight years, generating nothing further beyond occasional calibration. Growth therefore comes from new sites rather than from existing ones, and every market eventually saturates. Suppliers assuming a consumable tail would develop have mostly been disappointed.
Stickiness comes from workflow habit and from referral history rather than from any contract. A practice that has screened thousands of children on one device knows its referral behaviour and trusts what it produces, which makes switching feel like a clinical risk rather than a purchasing decision. Programme buyers are the opposite, retendering every few years on price. Occupational buyers sit between, replacing on cycle with mild preference for continuity.

The purchaser has shifted from clinician toward programme and procurement. Individual paediatricians once bought screeners on a colleague's recommendation and a coding calculation. Public programmes and corporate practice groups now buy hundreds at a time against written specifications, weighing durability, battery life and unit price. That buyer never meets the device before deciding, and reads a specification sheet instead.
vision-screeners-market-end-use-penetration-index-1787712296423

Payment Policy Decides Everything

These are among the four positions where our research anticipates prominent divergence between winners and laggards over the coming forecast period. Each is grounded in the demand model, the regulatory perimeter, and the announced capacity pipeline.
01 / PAYER ENGAGEMENT PRIORITY

A code opens a market, marketing does not

Markets carrying a specific reimbursement code for instrument-based ocular screening adopt these devices roughly five years ahead of the markets without one, despite identical clinical evidence and identical guideline recommendations sitting behind both of those markets. Payer engagement and properly built health economic dossiers therefore matter considerably more than any product feature a manufacturer could possibly develop. It is slow and expensive work that sometimes fails outright anyway, and nothing else has ever opened up a national market at all.
02 / SPECIFICITY PERFORMANCE FOCUS

Nobody complains, they just stop using it

Every manufacturer claims its device will not miss amblyopia and every single buyer simply assumes that this claim is true, so sensitivity is simply not where the real competition happens in this particular category. What actually decides continued use is the roughly 12% of entirely healthy children referred unnecessarily, because that floods the local optometrist and strains a professional relationship the paediatrician genuinely values. Devices failing on specificity are rarely returned and almost never formally complained about by anybody anywhere.
03 / DUAL RANGE NECESSITY

One product cannot serve both buyers

Programme tenders buy hundreds of units at once against specifications weighting durability, battery life and unit price far above the optical refinement that paediatric practices are actually paying for. Manufacturers running a single range across both lose the tenders on cost and lose the practices on capability, satisfying neither buyer properly in the end. A dedicated programme design costs separate development and separate regulatory clearance, and it is the only way to compete properly in both places at the same time.
04 / NON-SPECIALIST DESIGN DISCIPLINE

The operator does not treat eyes

Roughly 74% of all these devices are operated by paediatricians, school nurses and community health workers none of whom refract, prescribe or treat, which makes anything at all requiring interpretation a design failure rather than a feature. A pass or refer result in about eight seconds, with no settings to adjust and no image to read, is the actual product specification. Manufacturers importing clinical configurability from their ophthalmic ranges consistently produce devices that sit unused in a cupboard within a year.

Engagement Snapshot From the Field

A live engagement with an industry participant carrying material or product regulatory and market exposure ahead of a defining policy shift, showing how our research translates into a defensible multi-year portfolio strategy.
MARKET MINDS ADVISORY · CLIENT ENGAGEMENT SUMMARY
Vision Screeners Producer Strategic Portfolio Review and Transition Roadmap 2026·Investment Scenario on Vision Screeners Exposure Evaluation 2025-26
CLIENT PROFILE
An ophthalmic instrument manufacturer supplying vision screening devices across European and Asian markets, with reported screening device revenue of 34 million dollars (client-reported, unverified by MMA). Roughly 71% came from a single premium handheld range. The company had lost four consecutive public programme tenders and held no separate programme product of any kind at all.
STRATEGIC CHALLENGE
Programme tenders across three markets had been lost on unit price while the premium range held its position in private paediatric practice. Management was preparing to discount the premium range into tenders. That risked damaging practice pricing everywhere without solving a cost gap of roughly a third against manufacturers with domestic component supply.
MMA APPROACH
MMA analysed win and loss data across tenders against specification weightings and competitor pricing, a reconciliation the company had never performed. Nineteen expert interviews with programme procurement officers, paediatricians, school health coordinators and optometrists established what each buyer genuinely weighs. The analysis treated range separation and payer engagement rather than discounting as the routes available.
KEY FINDINGS
  1. Tender specifications weighted battery life, drop resistance and unit price far above the optical performance the premium range had been developed and priced around.
  2. Optometrists receiving referrals reported a false referral burden the company had never measured, quantified or shared with any of its own referring customers.
  3. Two of the three markets had no reimbursement pathway for instrument-based screening, and nobody in the company had ever approached the relevant payer bodies.
  4. Discounting the premium range into tenders would have exposed private practice pricing across all three markets to immediate and probably irreversible erosion.
CLIENT PROFILE
An ophthalmic instrument manufacturer supplying vision screening devices across European and Asian markets, with reported screening device revenue of 34 million dollars (client-reported, unverified by MMA). Roughly 71% came from a single premium handheld range. The company had lost four consecutive public programme tenders and held no separate programme product of any kind at all.
STRATEGIC CHALLENGE
Programme tenders across three markets had been lost on unit price while the premium range held its position in private paediatric practice. Management was preparing to discount the premium range into tenders. That risked damaging practice pricing everywhere without solving a cost gap of roughly a third against manufacturers with domestic component supply.
MMA APPROACH
MMA analysed win and loss data across tenders against specification weightings and competitor pricing, a reconciliation the company had never performed. Nineteen expert interviews with programme procurement officers, paediatricians, school health coordinators and optometrists established what each buyer genuinely weighs. The analysis treated range separation and payer engagement rather than discounting as the routes available.
KEY FINDINGS
  1. Tender specifications weighted battery life, drop resistance and unit price far above the optical performance the premium range had been developed and priced around.
  2. Optometrists receiving referrals reported a false referral burden the company had never measured, quantified or shared with any of its own referring customers.
  3. Two of the three markets had no reimbursement pathway for instrument-based screening, and nobody in the company had ever approached the relevant payer bodies.
  4. Discounting the premium range into tenders would have exposed private practice pricing across all three markets to immediate and probably irreversible erosion.
RECOMMENDED STRATEGY
Phase 1: Phase one: develop a separate programme device on durability and cost, protecting premium range pricing in private paediatric practice entirely. Phase 2: Phase two: measure and publish referral outcome data, addressing the concern that quietly ends device usage without any complaint ever being made. Phase 3: Phase three: open payer engagement in the two markets that lack any reimbursement pathway for instrument-based ocular screening at all.
OUTCOME
A programme device entered development and the company won its next two tenders on the new range rather than by discounting. Published referral outcome data was cited by paediatricians as a purchasing factor within three quarters (client-reported, unverified by MMA). Payer engagement opened in both markets, and one added instrument-based screening to its reimbursed child health schedule the following year.

Frequently Asked Questions

Foundational context covering the market sizes, CAGR, scope, country, region and competition that inform every finding below. This section is provided to cover basics and most often pre-purchase conversations, answered from the MMA Primary Research Dataset.

What is the current size of the Vision Screeners Market?

The market was worth 0.6 billion dollars in 2025, covering handheld photoscreeners, tabletop screeners, occupational devices, smartphone systems, acuity charts and binocular screeners. It reaches 0.65 billion dollars in 2026.

How large will the Vision Screeners Market be by 2036?

MMA forecasts 1.37 billion dollars by 2036, an increase of 0.72 billion dollars over the 2026 base. That represents an expansion multiple of 2.11 times across the forecast period.

What is the CAGR for the Vision Screeners Market 2026 to 2036?

The base case compounds at 7.8% annually. The bull case reaches 9.0% if reimbursement extends into further health systems, while the bear case sits at 6.6% on false referral rates undermining confidence.

Which segment is growing fastest?

Smartphone and app-based screening systems, at 11.7%, half again the market rate of 7.8%. They reach community and rural settings that could never justify a dedicated instrument.

Who are the major companies in the Vision Screeners Market?

Welch Allyn, Plusoptix, Adaptica, Nidek and Topcon Healthcare lead on disclosed screening device revenue and installed base. Essilor Instruments, Huvitz and Stereo Optical hold notable positions.

Which country is growing fastest?

India at 9.8%, as public health funding reaches school vision screening and community programmes extend into districts with no prior provision. Tender durability requirements shape the products sold there.

Report Segmentation Architecture

The full report scope spans multiple orthogonal segmentation dimensions, with cross-tabulated demand data provided for each dimension pair. Coverage extends further to regional breakdowns, trend trajectories, and the competitive detail needed to support segment-level decision-making.

By Device Type

  • Handheld Photoscreeners
  • Tabletop Autorefractor Screeners
  • Occupational and Driver Vision Screeners
  • Smartphone and App-Based Screening Systems
  • Digital Visual Acuity Chart Systems
  • Wearable and Binocular Function Screeners

By End-Use Industry

  • Paediatric and Primary Care Practice
  • School and Community Health Programmes
  • Occupational Health and Safety Departments
  • Driver Licensing and Transport Authorities
  • Optometric and Ophthalmic Practice
  • Non-Governmental Screening Programmes

By Commercial Dimension

  • Reimbursement Funded Practice Purchase
  • Public Programme Tender Procurement
  • Institutional Compliance Purchase
  • Distributor and Dealer Supply
  • Subscription and Software Licensing
  • Donor Funded Programme Supply

By Region

  • North America
  • Western Europe
  • East Asia
  • South Asia and Pacific
  • Latin America
  • Middle East and Africa
  • Eastern Europe

Scope, Methodology, and Coverage

Every figure in this report is reproducible from documented input assumptions. The scope below maps the historical period, the forecast horizon, the segmentation dimensions, and the countries covered, alongside the underlying primary and qualitative methodology.
Historical Period
2020 to 2025
Forecast Period
2026 to 2036
Base Year
2025 (USD billions; MMA Primary Research Dataset, August 2026)
Market Definition
Scope covers instruments, systems and applications used to identify vision problems and refractive risk factors without delivering a full refraction, diagnosis or prescription, spanning handheld photoscreeners, tabletop autorefractor screeners, occupational and driver vision screeners, smartphone and app-based screening systems, digital visual acuity chart systems, and wearable and binocular function screeners. Full diagnostic refraction and phoropter equipment, ophthalmic imaging including tomography and fundus systems, surgical devices, spectacle lenses, contact lenses and other worn vision care products covered separately under vision care products, and professional eye examination services are excluded from the market size and all derived figures.
Quantitative Units
USD billions (current prices); devices shipped; installed base; screenings performed per device; false referral rate
Segmentation Dimensions
By Device Type; By End-Use Industry; By Commercial Dimension; By Region
Regions Covered
North America, Western Europe, East Asia, South Asia and Pacific, Latin America, Middle East and Africa, Eastern Europe
Countries Covered
USA, China, Germany, Japan, India, UK, France, South Korea, Canada, Brazil, Australia, Italy, Netherlands, Poland, Mexico
Key Companies Profiled
Welch Allyn, Plusoptix, Adaptica, Nidek, Topcon Healthcare, Essilor Instruments, Huvitz, Righton, Stereo Optical, Keystone View, Marco Ophthalmic, Reichert Technologies, Chongqing Kanghua, Shenzhen Certainn, Suoer Electronic, GoCheck Kids, EyeQue, Luneau Technology, Medmont, Vmax Vision
Quantitative Methodology
Primary survey, n=3,800 respondents, Q4 2025, six countries; demand-side model with trade association cross-validation
Qualitative Methodology
47 expert interviews, Q4 2025; applied to validate demand model assumptions, identify emerging dynamics, and assess competitive positioning
Report Format
PDF and XLSX data workbook (Word format preview document)
Publisher
Market Minds Advisory
Report Code
MMA-2026-MED-142
Published
August 2026
Contact
sales@marketmindsadvisory.com | www.marketmindsadvisory.com

Purchase the full Vision Screeners Market Report (2026 to 2036).

The full report runs to 150 pages and covers all six device type segments, seven regions and 20 profiled suppliers in detail. It includes the complete segment CAGR set, regional reimbursement and programme funding comparison, and device payback analysis modelled across practice and programme settings. Company profiles carry evaluation on disclosed screening device revenue and installed base, with moat and risk assessment for the top five suppliers. The competitive section extends to 13 tracked tender, evidence and payment policy developments across 2024 and 2025. Primary research inputs include a quantitative survey of 3,800 respondents and 47 expert interviews conducted in Q4 2025.
Six device type segments with individual CAGR forecasts
Seven regional markets with reimbursement and programme funding comparison
Twenty supplier profiles on consistent revenue and installed base basis
Thirteen tracked tender and payment policy developments with commercial interpretation
Device payback modelled across practice and programme procurement settings
False referral burden assessed as a determinant of continued use

Built For The People Who Decide

From boardroom strategy to bench-side execution, this report is read cover-to-cover by leaders shaping the next decade of their industry, turning demand scenarios, market dynamics and valuation benchmarks into decisions.
CXOs/ Presidents/ VPs/ Managers
M&A and Corporate Development
Strategy Teams and R&D Heads
Procurement and Product Directors
Regulatory and Compliance Leaders
Investor Relations and Equity Analysts