Market Minds Advisory
Vision Care Products Market

Vision Care Products Market: Vision Care Products Market: Correction Becomes Treatment As Myopia Spreads

Myopia prevalence near 86% among urban adolescents in the worst affected markets has turned a category that corrected vision into one that now attempts to slow the progression of the condition itself.

Lead Analyst

Published

August 2026

Make Smarter Decisions with Customized Research Insights

Request a free sample report and evaluate market opportunities, growth trends, and competitive dynamics relevant to your business needs.

2025 MARKET VALUE$96.0BMarket Size 2025
2036 FORECAST VALUE$233.2BBase Case , 2026 to 2036
CAGR 2026 TO 20368.4 %Bull 9.6% / Bear 7.2%
INCREMENTAL OPPORTUNITY$129.1BNet 10- year value creation
EXPANSION MULTIPLE2.24x2036 value over 2026 base
Strategic Levers
M&A Pipeline
Regional Outlook
Country Rankings
Competitive Intelligence
Segmental Deep-dive
Call-Us : 91 93563 13602

Executive Snapshot and Market Trajectory.

This category stopped merely correcting vision and started trying to change its course. Myopia prevalence reaching roughly 86% among urban adolescents in the worst affected markets created a treatment proposition where only a correction proposition had ever existed before. Nothing else in the category changed as much.
East Asia takes 30% of value, leading on three counts at once: the highest myopia prevalence anywhere, roughly 71% of global frame manufacture, and the market where myopia management lenses were first commercialised at scale. Those lenses grow at 12.6%, half again the market rate of 8.4%. Contact lenses follow at 7.8% as daily disposables keep displacing monthly replacement. Frames trail both of those, growing at little more than half the market rate overall.
Concentration sits at 41%, held down by a fragmented frame trade sitting alongside consolidated lens and contact lens manufacture. The gate on all of it is an eye examination: around 78% of purchases require a current prescription, which makes optometrist capacity the constraint that pricing and marketing cannot move. Roughly 71% of the world's frames come from a single manufacturing region, which is a concentration nobody has yet unwound.
Market Definition
The market covers products worn or applied to correct, protect or manage vision, spanning spectacle lenses, myopia management lenses and devices, spectacle frames, contact lenses, contact lens care solutions, and over-the-counter ocular lubricants. Ophthalmic surgical devices and intraocular lenses, diagnostic and screening instruments, prescription ophthalmic pharmaceuticals, refractive surgery services, and professional eye examination services are excluded from scope.
Base Year Value
$96.0B in 2025 (MMA Primary Research Dataset, August 2026)
Forecast Period
2026 to 2036, eleven discrete annual values
CAGR
8.4% base case. Bull 9.6%. Bear 7.2%.
Fastest Growth Segment
Myopia Management Lenses and Devices: 12.6% CAGR
Fastest Growth Country
India: 10.4% CAGR
Fastest Growth Region
South Asia and Pacific: 10.6% CAGR
Largest Region
East Asia: 30% of 2025 global value
Market Leaders
EssilorLuxottica, Johnson & Johnson Vision, Alcon, CooperVision, Hoya. Source: MMA Analysis based on disclosed vision care product revenue, company annual reports 2025.
Primary Survey
n=3,800 procurement and R&D decision-makers, Q4 2025, six countries
Methodology
Demand-side build-up, cross-validated against public data, 47 expert interviews

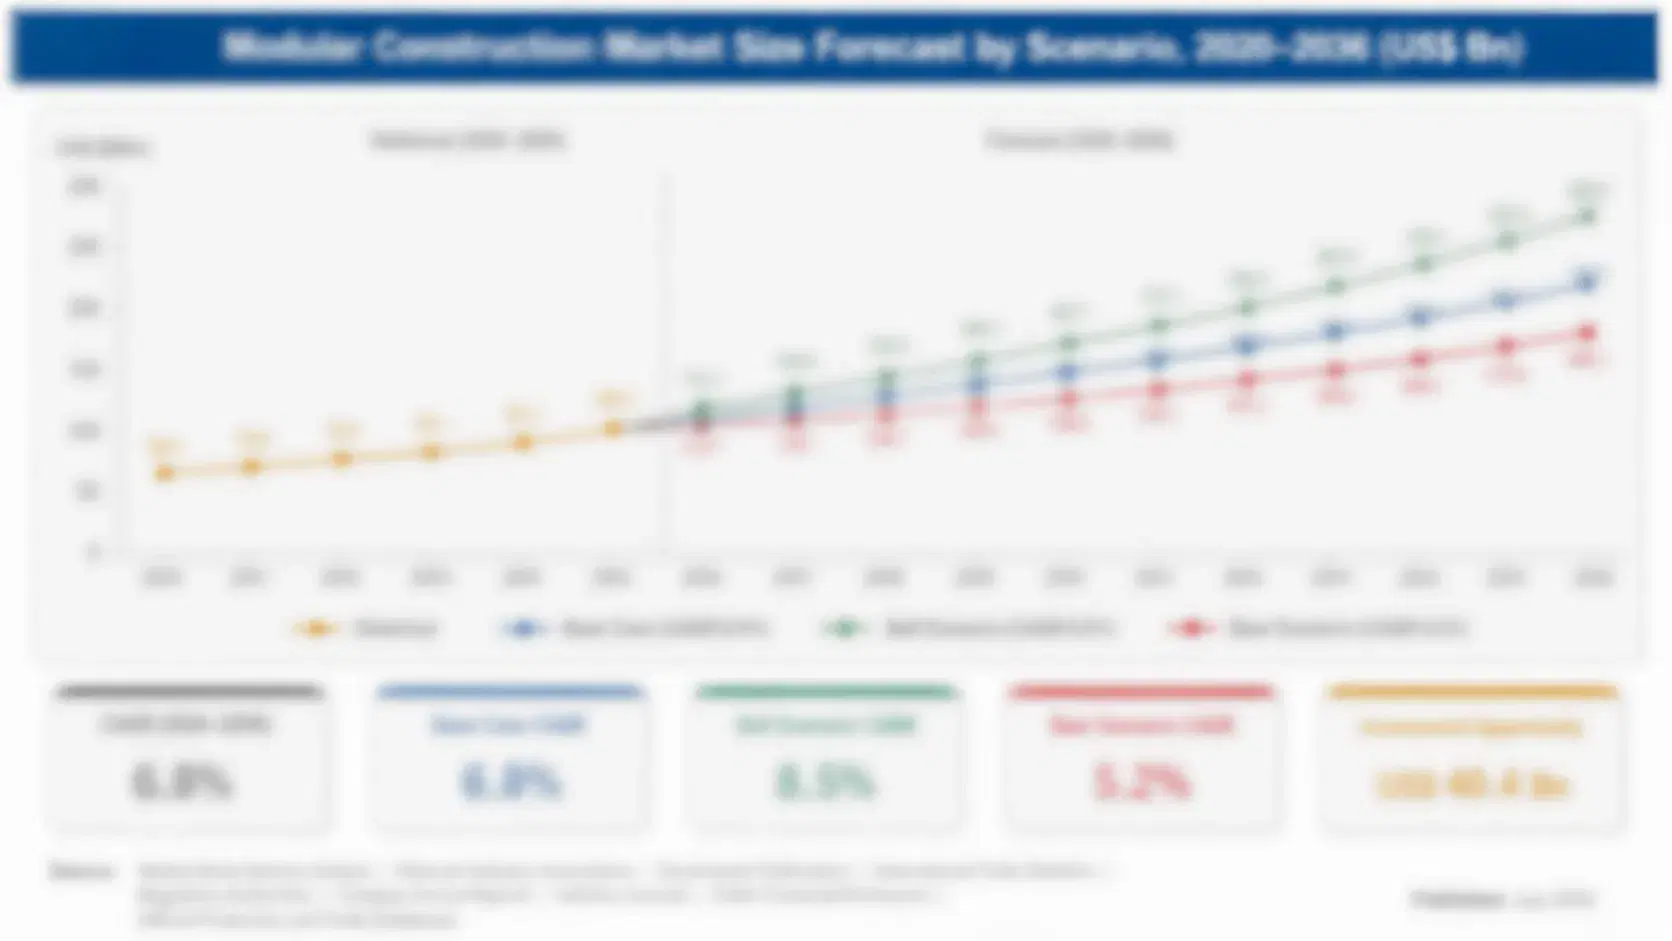
Vision Care Products Market Forecast Scenarios

vision-care-products-market-size-forecast-scenario-1787712290957
Growth from 2020 to 2025 ran at 7.2% and two things drove most of it. Myopia management lenses moved from clinical trial evidence to commercial category across East Asia and then outward, creating premium volume that had not existed at all in 2019. Daily disposable contact lenses kept converting monthly wearers, which raises annual revenue per wearer considerably even though each individual lens sells for far less.
The 8.4% base case rests on three mechanisms. Myopia management adoption keeps spreading from East Asia into South Asia, Europe and North America as clinical evidence accumulates and parents encounter it through optometrists. Daily disposable conversion continues where penetration remains well below the 42% now typical. And Indian and Southeast Asian corrected-vision penetration keeps rising from levels that leave most refractive error entirely untreated today. None of the three depends on new optics.
The bull case at 9.6% assumes myopia management reimbursement or school programme funding emerges in one or more large markets, which would move the category from parental discretionary spending into funded provision. The bear case at 7.2% is optometrist capacity constraining volume, since roughly 78% of purchases require a current examination and that capacity grows far more slowly than demand.

The Prescription Is The Gate

Almost every commercial decision in this category runs into the same wall. Around 78% of what gets sold requires a current prescription, which means an optometrist has to examine the patient before any purchase happens at all. Advertising creates demand and pricing shifts where it lands, but neither adds examination hours. Markets grow at the pace their professional capacity allows.
FIVE-FIRM CONCENTRATION41%Share of category revenue held by largest vision groups
URBAN ADOLESCENT MYOPIA86%Share of city adolescents affected in the worst hit markets
EYEWEAR REPLACEMENT CYCLE2.8 yearsAverage interval between one prescription eyewear purchase and the next
PRESCRIPTION GATED PURCHASES78%Purchases requiring a current examination before they can proceed
DAILY DISPOSABLE SHARE42%Contact lens wearers using single-use daily replacement lenses
FRAME MANUFACTURE CONCENTRATION71%Global frames produced within a single manufacturing region
Myopia changed what the category is for. Prevalence near 86% among urban adolescents in the worst affected East Asian markets is a public health problem rather than a refractive inconvenience, and high myopia carries genuine lifetime risk of retinal detachment, glaucoma and myopic maculopathy. Spectacle lenses using defocus optics and orthokeratology both aim to slow axial elongation rather than simply correct it. Parents buy that argument, which is why the segment grows at 12.6%.
The trade underneath remains oddly split. Roughly 71% of the world's frames are manufactured in one region, largely by contract producers supplying brands that do not manufacture. Lens surfacing happens in regional prescription laboratories within hours of an order, so lens economics depend on laboratory network density rather than plant scale. Contact lens manufacture is the opposite: enormous plants running one design continuously for months.
"The most valuable asset in this business is not a lens design or a brand. It is a room with a chair, a phoropter and somebody qualified to sit in front of it, and nobody is building those fast enough."
Director, Ophthalmic and Vision Care Practice · MMA Ophthalmic Devices and Consumer Health Practice · August 2026

Market Trends

Myopia Management Turns Correction Into Active Treatment

Defocus spectacle lenses, orthokeratology and specialised soft contact lenses all aim to slow axial elongation rather than simply correct the resulting blur, which changes the conversation from convenience to lifetime ocular risk. Growth at 12.6% follows parental willingness to fund that, especially where prevalence reaches roughly 86% among urban adolescents. Clinical evidence has accumulated enough to satisfy most practitioners. Pricing sits well above conventional lenses, and parents rarely negotiate it at all. The treatment window closes as progression slows, so each patient contributes for only a few years in total.
Market Impact: Affects 86% of urban adolescents
Daily Disposables Keep Converting Monthly Lens Wearers

Daily replacement now accounts for roughly 42% of contact lens wearers, and each conversion raises annual revenue per wearer substantially despite a far lower price for each individual lens. Comfort, hygiene and the removal of care solutions entirely all drive the switch. The casualty is lens care solutions, which decline as the wearer base converts and which no supplier has found any way to defend. Penetration still varies enormously between markets. Practitioner recommendation at the fitting appointment drives conversion far more than any consumer advertising campaign ever manages to here.
Market Impact: Grows India fastest at 10.4%

Market Opportunities and Growth Drivers

Myopia Prevalence Creates A Public Health Category

Urban adolescent myopia reaching roughly 86% in the worst affected East Asian markets is not a consumer trend but an epidemiological shift, and high myopia carries measurable lifetime risk of retinal detachment, glaucoma and myopic maculopathy. Governments have responded with school screening and outdoor time policies. That framing moves eyewear from discretionary purchase toward health intervention, which changes both willingness to pay and the likelihood that funding eventually arrives from somewhere other than parents. Where a health system eventually funds it, the segment stops depending on parental discretion altogether at last.
Market Impact: Gates 78% of all purchases

Uncorrected Refractive Error Remains Enormous In India

India grows fastest of any country at 10.4% because corrected-vision penetration remains low against a population where uncorrected refractive error is the leading cause of visual impairment by a considerable margin. Optometry training capacity is expanding and organised retail chains are reaching tier two and tier three cities for the first time. Affordability rather than awareness is the binding constraint, which favours value-tier lenses and frames over anything premium. Ready-made spectacles distributed through outreach programmes address volume that formal optical retail has never once reached anywhere in the country at all.
Market Impact: Concentrates 71% in 1 region

Market Restraints and Challenges

Optometrist Capacity Gates Roughly Four Fifths Of Sales

Around 78% of purchases require a current prescription, so an examination has to happen before any transaction can, and examination capacity grows only as fast as optometrists are trained and licensed. Root cause is professional scope regulation combined with training pipelines measured in years. Commercial impact is that marketing spend can shift share without growing the market. Mitigation runs through auto-refraction, technician-assisted workflows and remote review, all of which face regulatory resistance. A market grows at the pace its professional training pipeline actually allows, and nothing else moves that at all.
Market Impact: Grows management lenses at 12.6%

Frame Manufacturing Sits In One Region Entirely

Roughly 71% of global frame production happens in a single manufacturing region, largely through contract producers supplying brands that own no factories themselves. Root cause is decades of accumulated tooling, skilled assembly labour and component supply that nobody has replicated elsewhere at comparable cost. Commercial impact is tariff and logistics exposure that brands cannot engineer away quickly. Mitigation involves qualifying secondary capacity in Vietnam and India, which several groups have now genuinely begun. Tooling transfer and lower initial yield are the real costs of moving any of it somewhere else.
Market Impact: Converts 42% to daily replacement
3 additional market trends, 4 additional growth drivers, and 2 additional restraints and challenges are covered in the full report. Contact sales@marketmindsadvisory.com to access the complete intelligence.

Segment CAGR and Growth Architecture

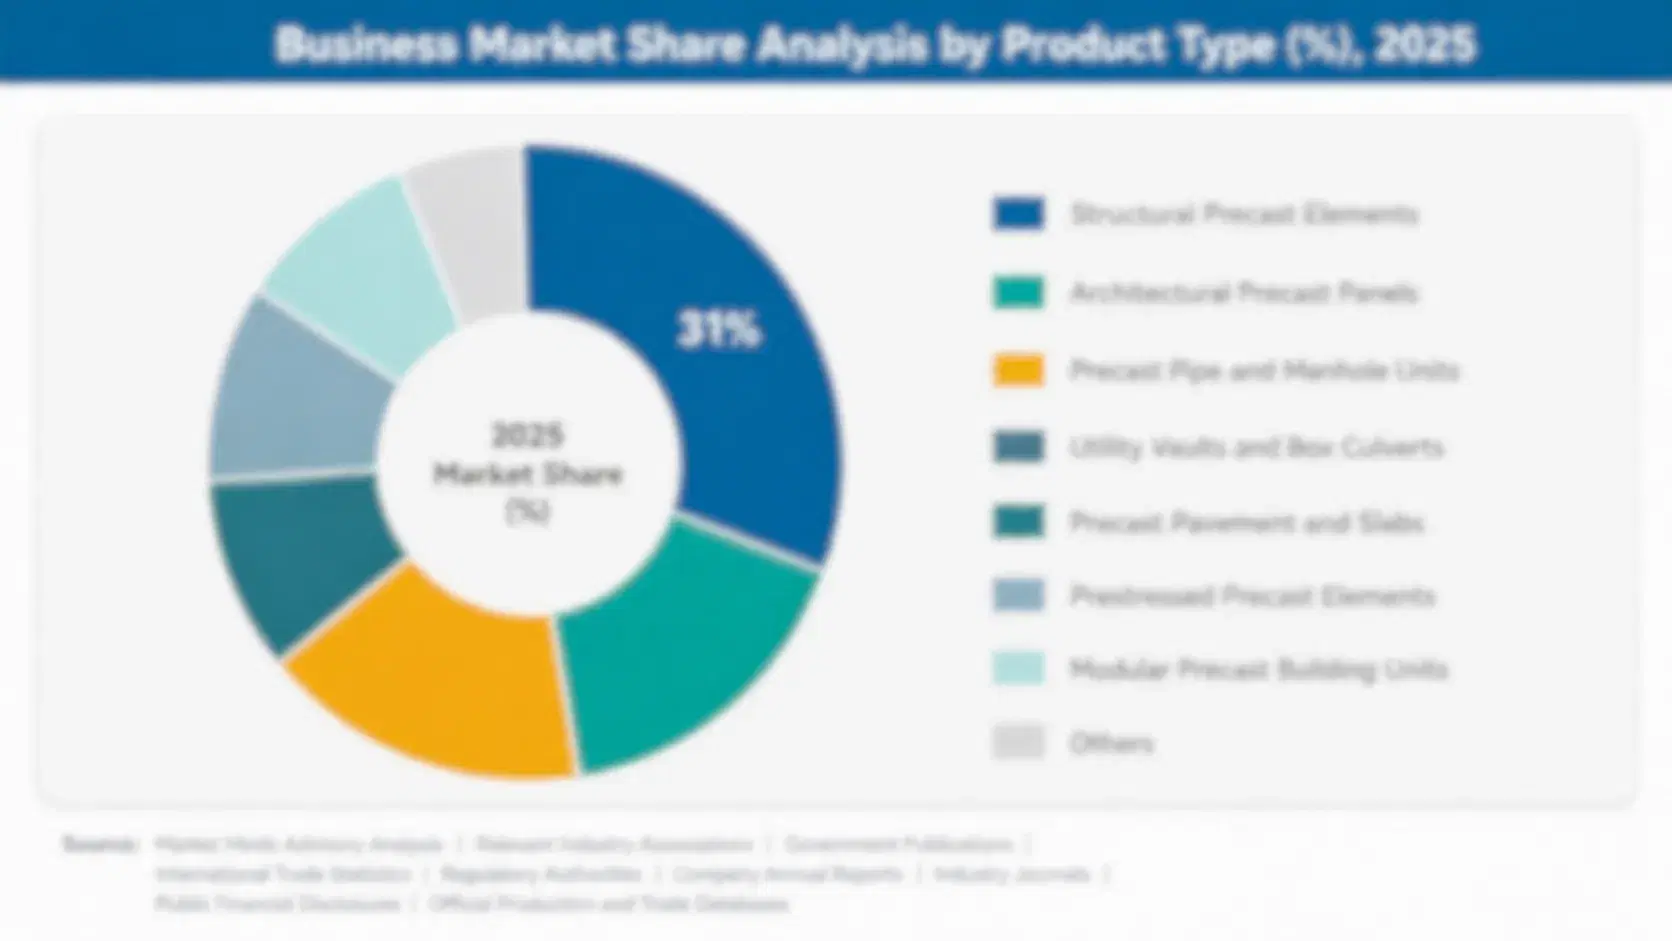
Segmentation follows product category: what the patient actually wears, applies or uses to correct or manage vision. Six categories cover the market without overlap. Distribution channel, patient age group and clinical indication are treated as separate commercial dimensions throughout this report rather than as segmentation logic in their own right, since each cuts across all six categories.
vision-care-products-market-market-share-analysis-1787712291235

Myopia Management Lenses and Devices

Defocus spectacle lenses, orthokeratology lenses and specialised soft contact lenses aim to slow axial elongation in progressing childhood myopia rather than simply correcting the refractive result. Growth at 12.6%, half again the market rate of 8.4%, follows parental willingness to fund a treatment argument rather than a convenience one, particularly where prevalence reaches roughly 86% among urban adolescents. Pricing sits far above conventional lenses and is rarely negotiated. The commercial risk is that the child outgrows the indication, which caps the treatment window at a few years. That window closes as progression slows, so a business built on this segment must continuously replace patients who age out of it entirely.
CAGR 12.6%

Contact Lenses

Soft, rigid gas permeable and specialised lens designs together grow at 7.8%, driven mostly by daily disposable conversion rather than by any expansion in the number of people wearing lenses at all. Daily replacement now covers roughly 42% of wearers and raises annual spend per wearer considerably. Manufacturing is unlike anything else in the category: enormous automated plants running a single design continuously for months, which rewards scale absolutely and punishes any manufacturer without it. Dropout among new wearers remains the persistent unsolved problem. Roughly half of new wearers stop within their first two years, which caps installed base growth however many fittings a practice performs in any given period.
CAGR 7.8%
Full segment breakdown across 6 segments available in the complete report.

Regional Architecture and Country Demand Map

Geography follows myopia prevalence, manufacturing concentration and optometry capacity together rather than population alone. East Asia leads on all three at once, and India grows fastest from a substantially uncorrected base. Population size alone predicts remarkably little about where value in this category actually lands.

North America

Optical retail is unusually consolidated, with vertically integrated groups controlling manufacture, brands, prescription laboratories and store networks simultaneously, which is a degree of ownership from resin to till that few consumer categories tolerate. Vision benefit plans fund a substantial share of purchases and set replacement rhythms directly through their eligibility rules. Myopia management adoption trails East Asia noticeably, held back by cost sitting entirely with parents. Contact lens penetration and daily disposable share are both among the highest anywhere. Direct-to-consumer sellers found routes around the prescription gate earlier here than anywhere, separating the examination from the purchase in a way the established trade had spent years trying hard to prevent.
Share: 25% | CAGR: 7.6% (2026 to 2036)

Western Europe

Independent optical practice retains far more share here than in North America, particularly across Germany, France and Italy, which keeps the trade fragmented and gives lens manufacturers considerable influence over what practices recommend. Several national health systems part-fund children's eyewear, which supports early correction and now begins to reach myopia management in a few countries. Italian frame design and manufacture retains genuine premium positioning even as volume production sits elsewhere. Replacement cycles run longer than the global average. Optometry workforce density is high but appointment capacity is still the practical limit on volume, and several markets have begun permitting technician-assisted pre-testing to raise throughput per practitioner in a meaningful way at last.
Share: 22% | CAGR: 6.8% (2026 to 2036)
Regional intelligence for 5 additional markets available in the complete report: East Asia, South Asia and Pacific, Latin America, Middle East and Africa, Eastern Europe. Contact sales@marketmindsadvisory.com.
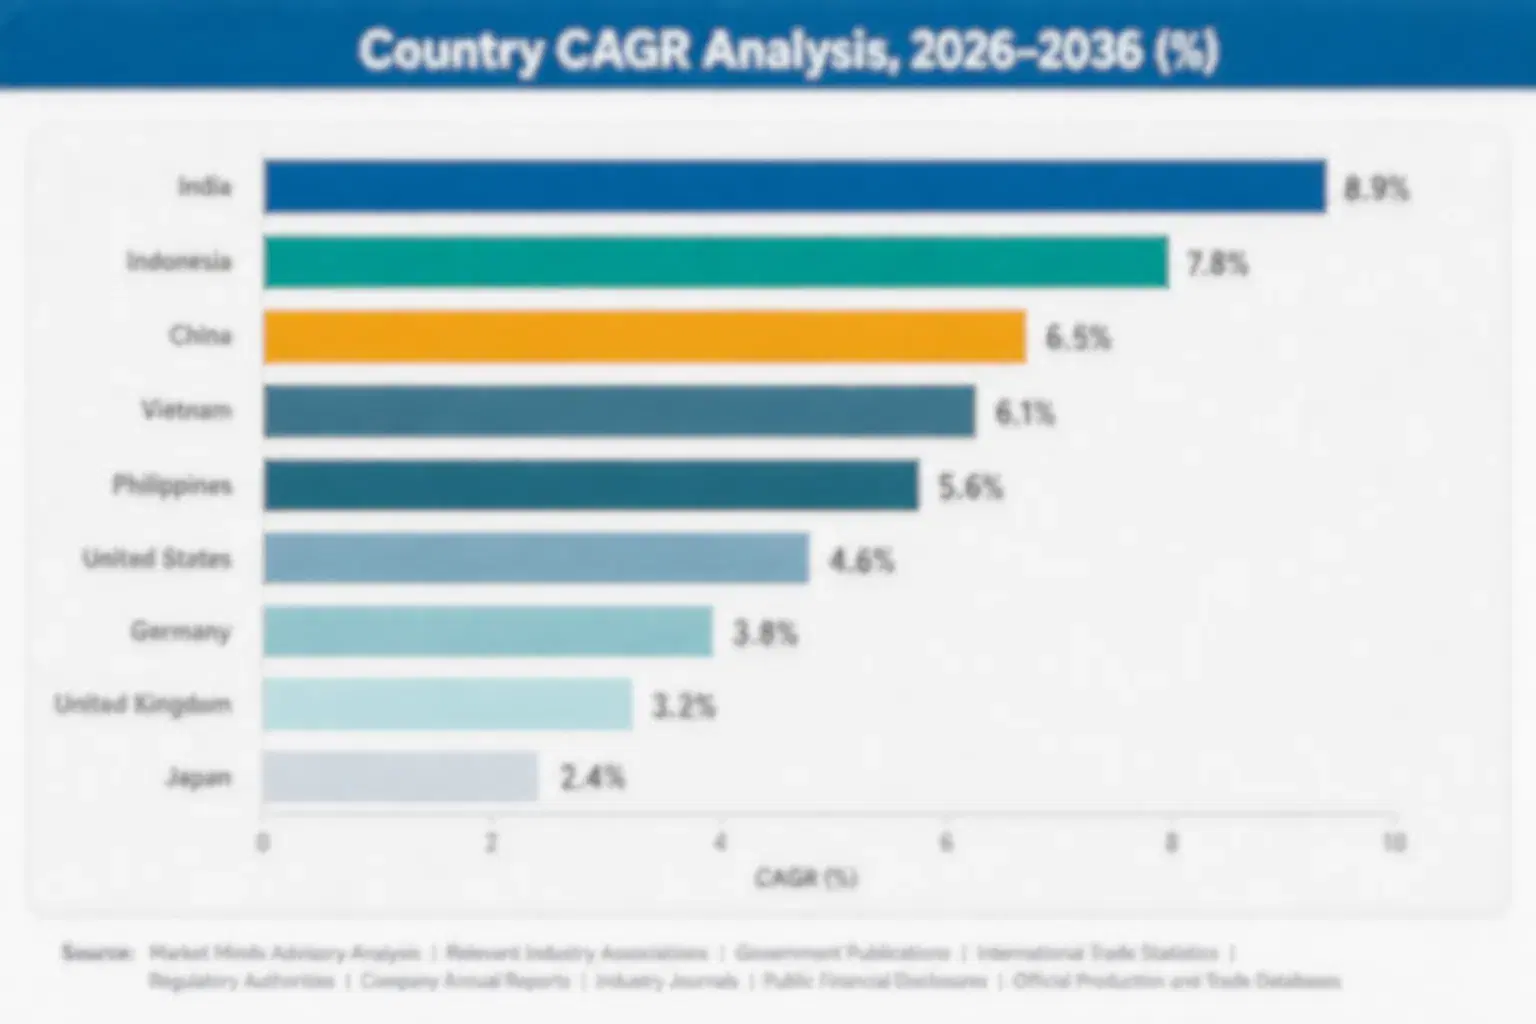
vision-care-products-market-country-cagr-analysis-1787712291577

Working Around The Examination Chair

Around 78% of purchases need a current prescription, urban adolescent myopia reaches roughly 86%, daily disposables cover 42% of wearers, and 71% of frames come from one region. Four levers work on examination capacity, treatment positioning, wearer conversion and supply diversification rather than on price, which this whole category already competes on constantly anyway.

Expand Examination Throughput Without More Optometrists

With roughly 78% of purchases gated by a current prescription, examination capacity is the ceiling on volume and no amount of marketing raises it. Auto-refraction, technician-assisted pre-testing and remote review can lift throughput per optometrist by 30% or more where regulation permits them. The obstacle is professional scope rules rather than technology. Groups that engaged regulators early and built the workflow properly hold capacity advantages competitors cannot simply buy their way into later. Nothing else in the commercial toolkit adds even a single appointment to the working week at all.
Market Impact: Lifts throughput per optometrist by 30% or more

Sell Myopia Management As Clinical Treatment

Parents facing urban adolescent prevalence near 86% and the lifetime retinal risk that high myopia carries respond to a treatment argument in a way no correction argument has ever achieved. Pricing sits well above conventional lenses and is rarely negotiated, which is unusual in a category where price comparison is otherwise constant. The requirement is genuine practitioner education and honest evidence presentation, since a treatment claim that outruns its data damages the whole segment. Practitioner education is the whole delivery mechanism, since parents hear the argument in a consulting room.
Market Impact: Commands roughly 3 times the conventional lens price

Convert Monthly Wearers To Daily Replacement

Daily disposables now cover roughly 42% of wearers and lift annual revenue per wearer considerably despite each lens selling for far less than a monthly one does. Conversion runs through practitioner recommendation at fitting and refit appointments rather than through consumer advertising. Penetration varies enormously between markets, which means the opportunity is concentrated wherever it currently sits lowest. The offsetting loss is lens care solution revenue, which converts to nothing at all. Roughly half of new wearers stop within two years, so conversion of existing wearers matters more than recruiting new ones does.
Market Impact: Raises annual spend across the current 42% base

Qualify Frame Capacity Outside The Dominant Region

Roughly 71% of global frame production sits in one manufacturing region, which concentrates tariff, logistics and policy exposure in a way brands owning no factories cannot quickly unwind. Qualifying capacity in Vietnam, India and Eastern Europe costs tooling investment and tolerance of lower initial yield. It converts a concentrated dependency into a sourcing choice, and several groups have started that work considerably later than the exposure warranted. Tariff decisions taken in a single week can move landed cost by more than a year of negotiated supplier savings would have achieved.
Market Impact: Diversifies away from a 71% single-region supply concentration

Who Controls the Margin Pool

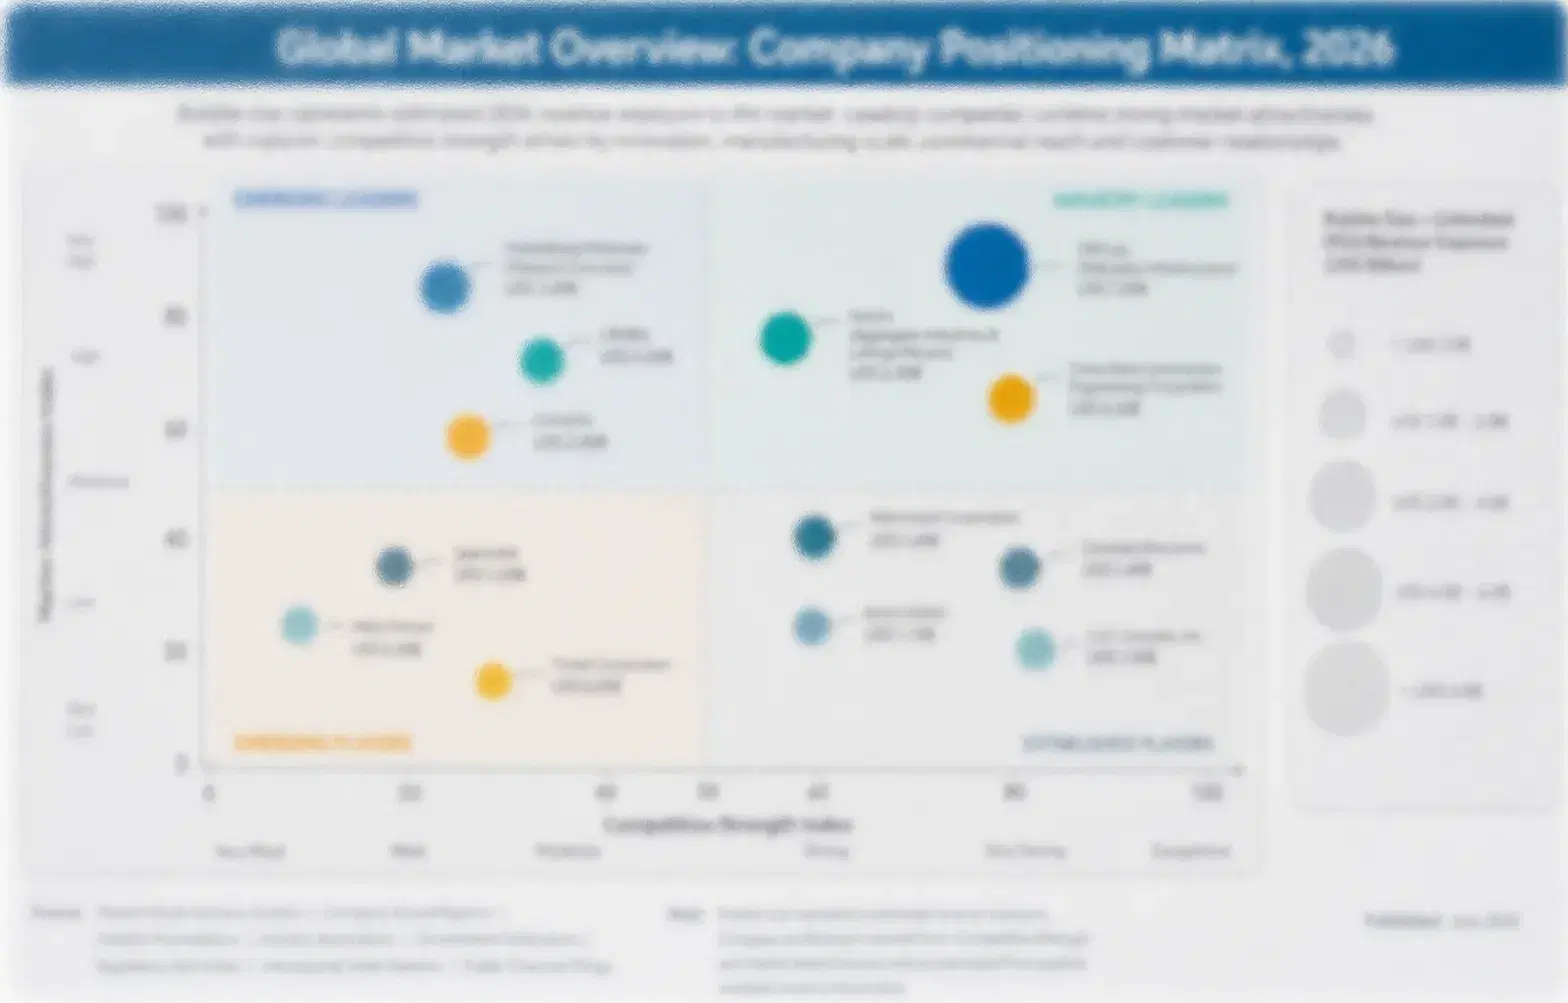
Measured on disclosed vision care product revenue, the five largest groups hold a CR5 of 41%, which conceals two very different structures sitting inside one category. Lens and contact lens manufacture is heavily consolidated, while frames remain fragmented across thousands of brands supplied by contract producers. EssilorLuxottica spans manufacture, brands, laboratories and retail simultaneously, while Johnson & Johnson Vision, Alcon and CooperVision compete almost entirely in contact lenses, and Hoya holds lens technology depth.
Three contests define activity. Myopia management competes on clinical evidence and practitioner education rather than on price, which favours groups able to fund trials. Contact lenses compete on manufacturing scale and fitting relationships. And spectacle lenses compete on prescription laboratory network density, since a practice orders from whoever delivers reliably by tomorrow. Ocular lubricants compete in pharmacy aisles on brand alone.

Pressure builds from direct-to-consumer sellers who found routes around the prescription gate, and from Chinese lens manufacturers moving up from value into mid-tier. Rankings shift toward whoever holds myopia management evidence and practitioner trust together. Evidence funding and practitioner relationships are the two things a fast follower finds hardest to assemble in time.
vision-care-products-market-company-positioning-matrix-1787712291901

Competitive Moat and Risk Dimensions

ESSILORLUXOTTICA

Moat: Ownership From Resin To Till

The group manufactures lenses and frames, owns major eyewear brands, operates prescription laboratories and runs retail chains, which is a completeness of ownership few consumer categories tolerate. Margin can be taken wherever conditions favour. A competitor holding one link negotiates with a counterparty that also competes with it downstream, which is a difficult position to occupy.
ESSILORLUXOTTICA

Risk: Integration Draws Regulatory Attention

Ownership spanning manufacture, brands, laboratories and retail attracts competition authority interest wherever share concentrates, and independent practices have complained about supply terms in several markets. Remedies constraining vertical arrangements would reduce exactly the advantage the model produces. Scale also makes the group the obvious subject of any inquiry that opens.
JOHNSON & JOHNSON VISION

Moat: Contact Lens Manufacturing Scale

Contact lens production rewards scale more absolutely than almost any medical device category, since automated plants run a single design continuously for months and unit cost falls steeply with volume. That position took decades and enormous capital to build. A new entrant needs both the plant and the fitting relationships with practitioners, and neither can be acquired quickly.
JOHNSON & JOHNSON VISION

Risk: Daily Conversion Erodes Care Revenue

Conversion toward daily disposables raises lens revenue while eliminating the lens care solutions that accompanied monthly wear, so the category grows and one of its components disappears entirely. Suppliers holding both lines absorb that trade rather than benefiting cleanly from it. Wearer dropout among new fits also caps how far the installed base actually grows.

Players Tracked

Prominent Players

EssilorLuxottica
Johnson & Johnson Vision
Alcon
CooperVision
Hoya

Other Key Players

Bausch + Lomb
Zeiss
Nikon Optical
Rodenstock
Safilo Group
Marchon Eyewear
Marcolin
De Rigo
Fielmann
Warby Parker
Menicon
SEED Contact Lens
Wanxin Optical
Mingyue Optical
Younger Optics

Recent Developments

MARCH 2025

National school myopia screening programme extends to management lenses

A national school screening programme extended its referral pathway to include myopia management lens options for progressing children, a public health policy decision rather than any commercial arrangement with a manufacturer. Screening had previously identified refractive error and referred only for conventional correction across the whole programme.
Signal: Public programme referral moves myopia management out of parental discretionary spending and into properly funded provision.
JULY 2025

Optical group qualifies frame production capacity in Vietnam

An eyewear group qualified contract frame manufacturing capacity in Vietnam alongside its existing supply base, a sourcing and supplier qualification decision rather than any acquisition or joint venture arrangement. Frame production concentration in a single region had left tariff and logistics exposure that the group could not otherwise reduce.
Signal: Sourcing diversification is at last being funded after years of acknowledged and entirely unaddressed concentration risk.
NOVEMBER 2025

Retail chain deploys technician-assisted pre-testing across store network

An optical retail chain deployed auto-refraction and technician-assisted pre-testing across its store network to raise examination throughput per optometrist, an operational change rather than any corporate transaction. Prescription requirements gate most purchases, and optometrist availability had been limiting appointment volume across many of its locations.
Signal: Throughput per optometrist is now being treated as the real growth constraint rather than consumer demand.

Monomer, Coating And Acetate

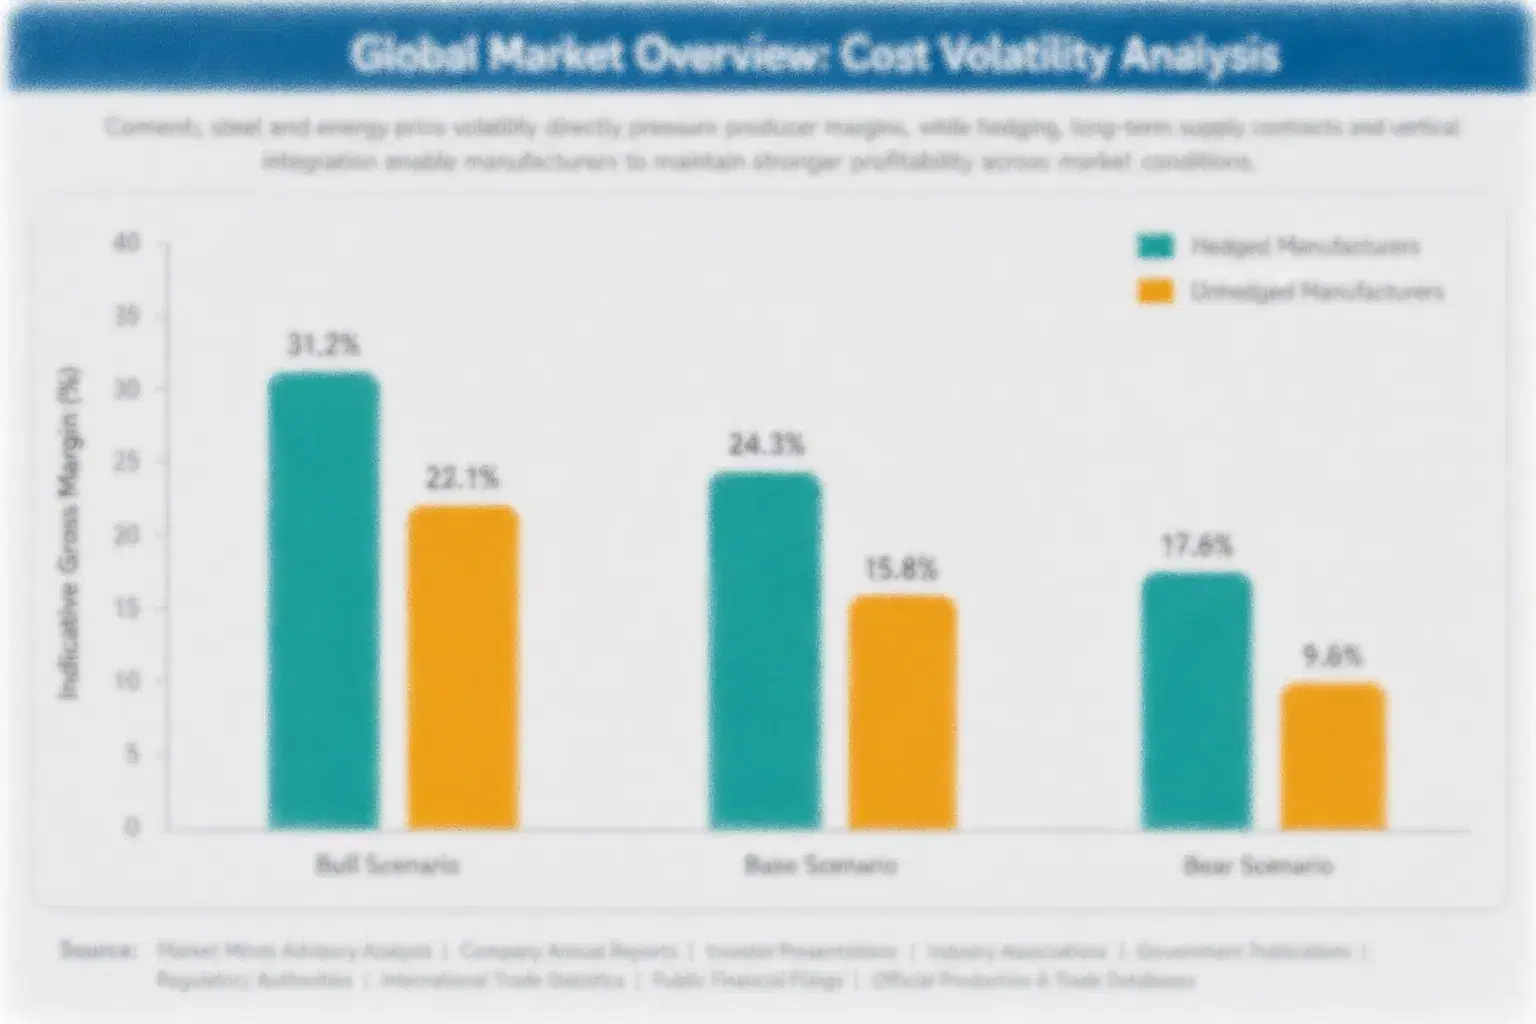
Inputs differ completely by product line, which makes a single cost picture misleading. Lens monomer including allyl diglycol carbonate and high-index thiourethane resins, vacuum-deposited coating materials, cellulose acetate and metal for frames, and silicone hydrogel monomer with blister packaging for contact lenses together account for 26 to 35% of product cost. High-index monomer supply is concentrated with a small number of Japanese chemical producers, which is a genuine single dependence.
The volatility that mattered was resin and freight cost through 2021 and 2022. Petrochemical feedstock prices moved sharply, which EIA data records across the period, and container freight from the dominant frame manufacturing region reached multiples of normal rates. EssilorLuxottica Annual Report 2024 records the resulting sourcing and inventory changes retained since. Cellulose acetate for premium frames tightened separately, since very few producers make it.

Exposure divides by product line and by ownership of the chain. Frame brands owning no factories carry full tariff and freight exposure with no ability to absorb it internally. Vertically integrated groups shift margin between manufacture, laboratory and retail as conditions move. Contact lens manufacturers carry the least input exposure and the most fixed capital, which makes utilisation rather than material cost decide their margin.
vision-care-products-market-cost-volatility-analysis-1787712292233

Qualify high-index monomer supply beyond a single producer

High-index lens resin comes from very few chemical producers, and premium progressive and thin-lens ranges depend on it entirely with no straightforward substitute available. Qualifying an additional producer costs optical property validation across every lens design in the range. It removes a dependency that would halt premium production outright, which matters more than the modest pricing benefit it also produces.

Build frame sourcing capacity in a second country

Roughly 71% of frame production sits in one region, leaving brands that own no factories fully exposed to tariff decisions and freight cycles they cannot influence at all. Qualifying capacity elsewhere costs tooling transfer and lower yield. It converts a concentrated dependency into a genuine sourcing choice, which is worth more than the unit cost difference either way.

Hold contact lens plant utilisation above design thresholds

Contact lens manufacturing carries enormous fixed capital and comparatively small material cost, so margin follows how continuously the lines run rather than what the monomer costs in any given quarter. Protecting utilisation means committing to designs for long production campaigns. It constrains portfolio flexibility considerably and is the single largest determinant of profitability in this particular line.

Portfolio Architecture for Margin Defence

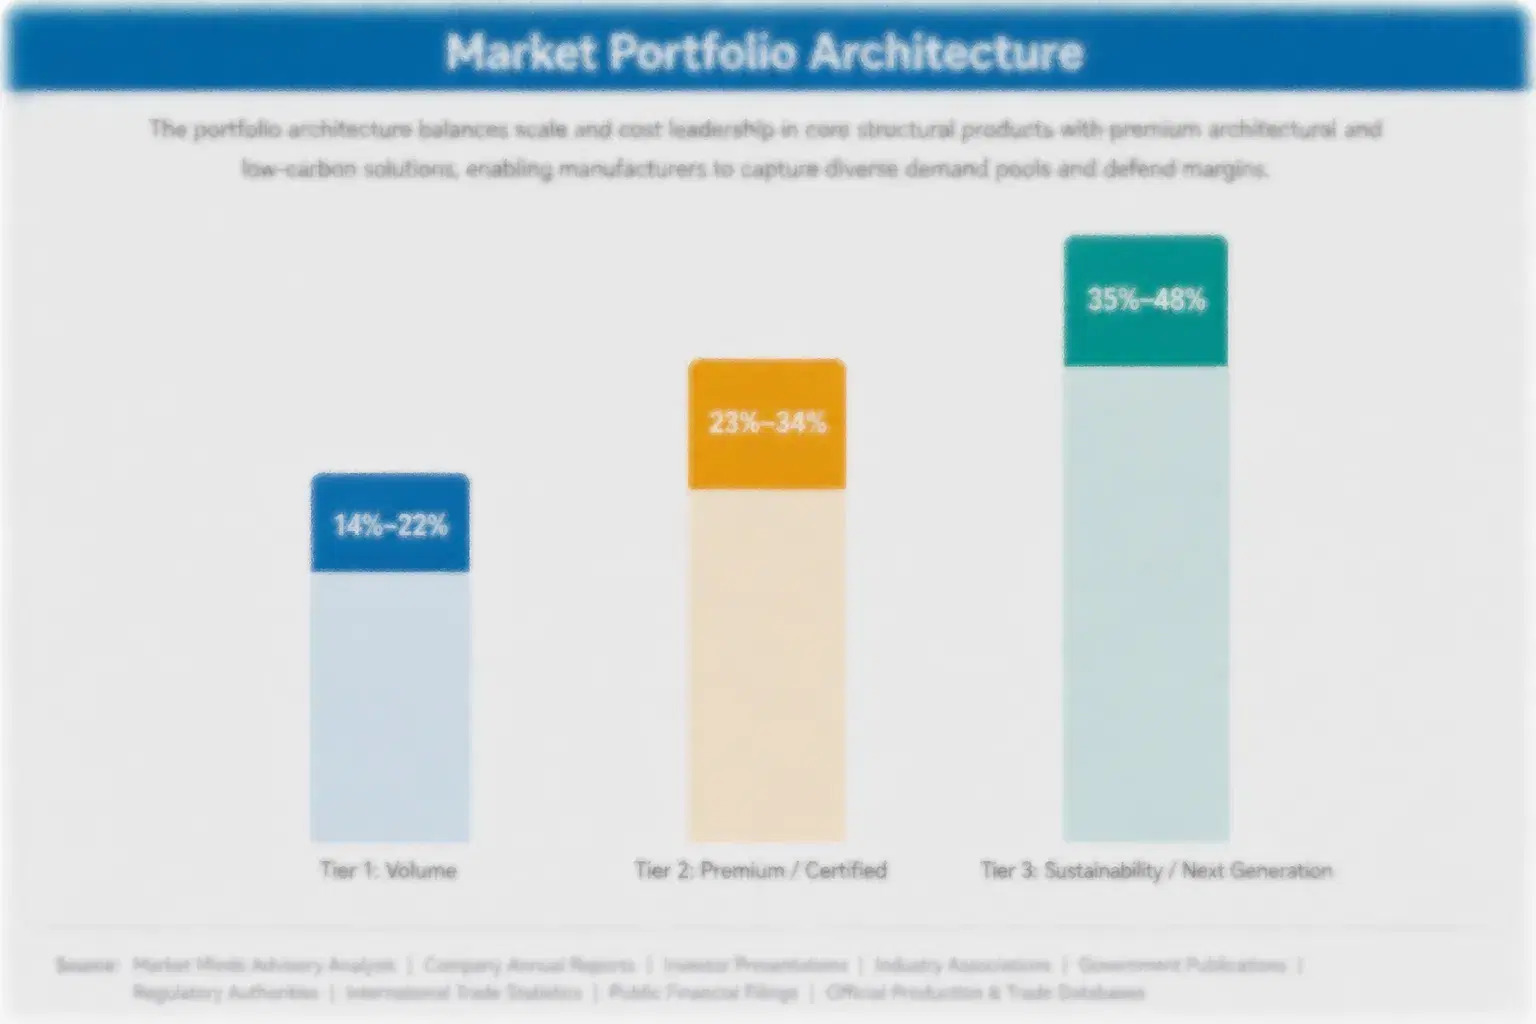
Margin follows clinical framing rather than product cost, which is the clearest pattern in the category. Contact lens care solutions earn thinly and shrink as daily disposables convert wearers away from them. Value frames earn modestly against contract manufacturing that anybody can access. Single vision lenses earn moderately on volume. Progressive lenses and daily disposable contacts earn well. Myopia management lenses earn best of all, because parents are buying a treatment rather than a correction.
The tension is that the highest margin segment has the shortest customer window. A child in myopia management is a patient for perhaps four to six years before progression slows and the indication ends, whereas a progressive lens wearer buys every 2.8 years for decades. Building a business on the treatment segment means continuously replacing patients who age out, which is a very different commercial rhythm from ordinary eyewear.

High-value pools sit in three places. Myopia management lenses backed by clinical evidence and practitioner education. Premium progressive designs, where the fitting relationship and measurement technology defend pricing. And examination capacity itself, which is not a product at all but determines how much of everything else can be sold in any given market.

Volume / Commodity-Adjacent

Contact lens care solutions, value frames and basic single vision lenses competing on price through mass channels. The 10-point range separates vertically integrated producers from brands buying finished goods out of contract manufacture at market prices.
Gross Margin: 22-32%

Premium / Certified

Progressive lenses, coated premium designs and daily disposable contact lenses sold through professional dispensing. The 14-point spread reflects how differently prescription laboratory economics and high-volume contact lens plant economics behave from one another.
Gross Margin: 48-62%

Sustainability / Regulatory / Next-Generation

Myopia management lenses, orthokeratology and specialised designs sold on clinical evidence rather than optical convenience. The 16-point range is wide because spectacle-based and contact-based management approaches carry entirely different manufacturing and fitting cost structures.
Gross Margin: 62-78%
vision-care-products-market-portfolio-architecture-1787712292563

High-value Sub-segments and Strategic Watch-out

Myopia Management Lenses

Highest margin and fastest growth at 12.6%, sold to parents on lifetime ocular risk rather than on optical convenience. The risk is the treatment window, since a child ages out of the indication within a few years and the patient has to be replaced all over again.
Gross Margin: 70-78%

Premium Progressive Designs

Strong economics defended by fitting measurement, practitioner relationship and a wearer who returns roughly every 2.8 years for decades. The risk is Chinese lens manufacturers moving steadily up from value into mid-tier and compressing the pricing beneath it. Mid-tier is where that pressure lands first.
Gross Margin: 56-66%

Single Vision Lens Volume

The volume core, filling prescription laboratory capacity and anchoring the relationship with every dispensing practice in the network. Suppliers hold it because laboratory throughput economics depend on it, whatever its own margin looks like in isolation. Nobody gives up laboratory throughput voluntarily for exactly that reason.
Gross Margin: 34-44%

Lens Care Solution Decline

The strategic watch-out. Daily disposable conversion eliminates the care solution rather than substituting a competitor's, so the revenue simply disappears as wearers switch. The risk is a line that no amount of marketing or reformulation can defend at all. Marketing cannot reach a wearer who no longer needs it.
Gross Margin: 18-28%

A Wearer For Decades

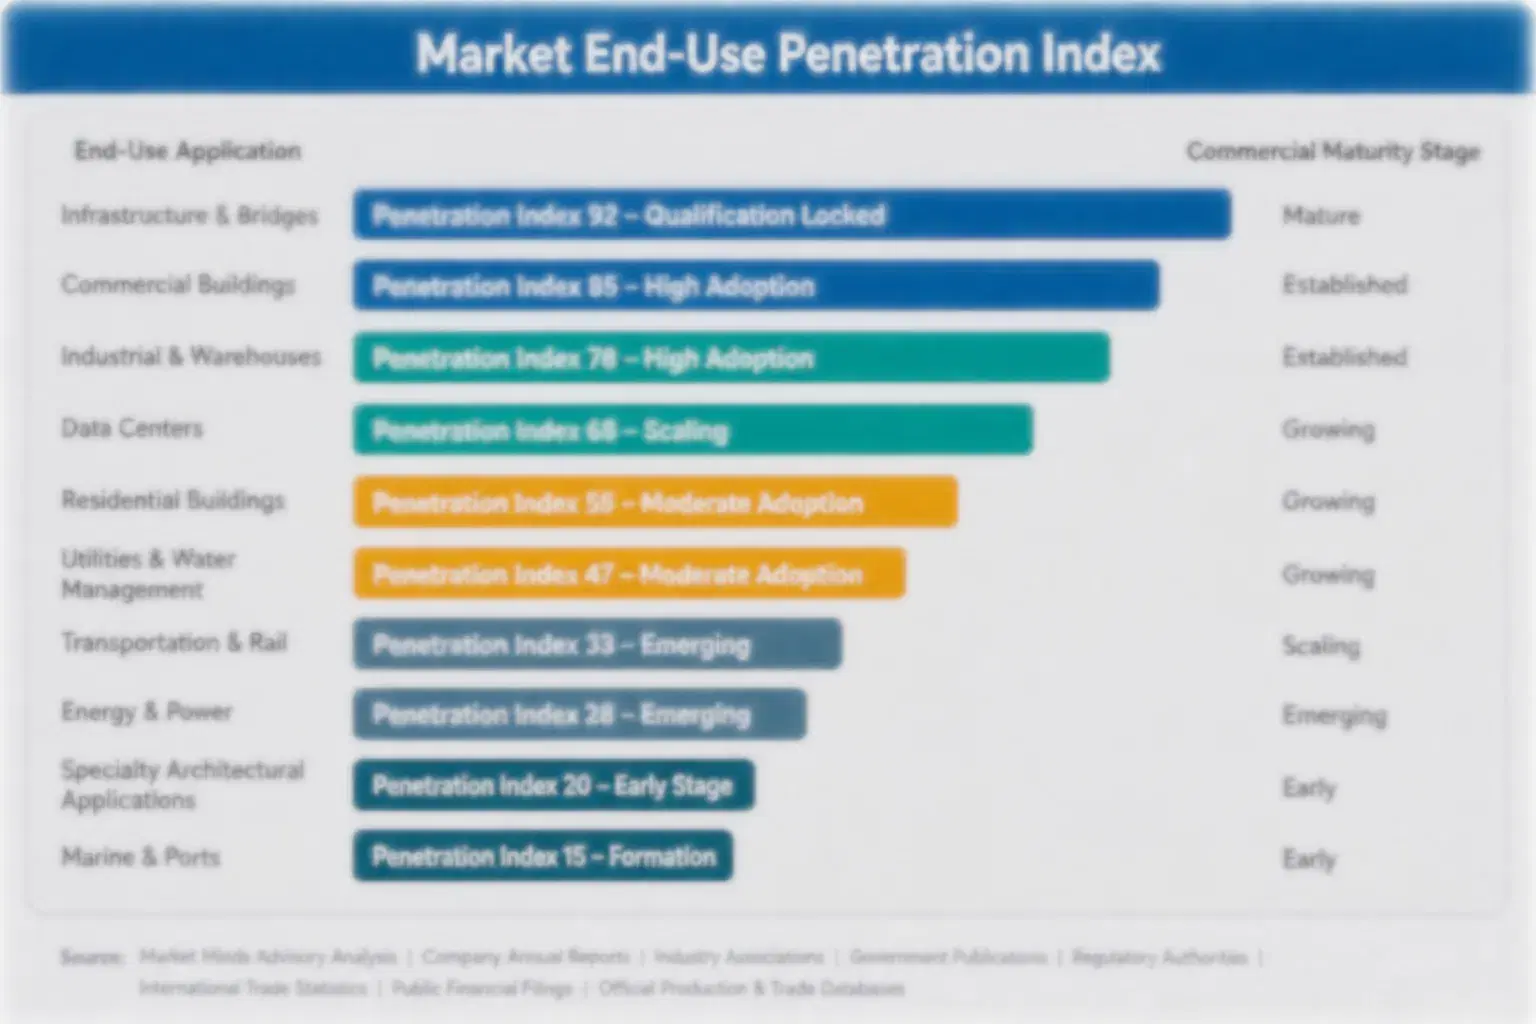
Once someone needs correction they generally need it permanently, which makes each wearer an annuity running for decades rather than a transaction. Spectacle wearers return roughly every 2.8 years, contact lens wearers reorder continuously, and prescriptions drift enough to require both. The practice that dispenses the first pair usually dispenses the next several, because the record, measurements and relationship all sit in one place and moving them costs effort nobody enjoys.
Stickiness varies sharply by product line and by age. Progressive lens wearers are extremely sticky, since fitting measurements and adaptation make switching genuinely uncomfortable. Contact lens wearers are stickier than they look, because a refit costs an appointment. Children in myopia management are the stickiest of all while the indication lasts and then leave the segment entirely. Value frame buyers are barely sticky and shop openly on price.

The purchaser has changed generationally in a way that matters. Older wearers accept the practitioner's recommendation and dispense in the same visit. Younger wearers arrive having researched lens types and brands, treat the examination and the purchase as separable, and buy frames or contacts online after obtaining a prescription elsewhere. That separation is what direct-to-consumer sellers built their businesses around.
vision-care-products-market-end-use-penetration-index-1787712292913

Capacity, Then Everything Else

These are among the four positions where our research anticipates prominent divergence between winners and laggards over the coming forecast period. Each is grounded in the demand model, the regulatory perimeter, and the announced capacity pipeline.
01 / EXAMINATION CAPACITY BUILDING

No chair, no sale, no exceptions

Roughly 78% of all purchases require a current valid prescription, which means an optometrist has to examine the patient before anything at all is sold and no marketing budget anywhere adds a single examination hour to the week. Auto-refraction, technician-assisted pre-testing and remote review can each raise throughput per optometrist by 30% or more wherever professional scope rules permit them. Groups that engaged regulators early and rebuilt the workflow hold capacity advantages that competitors cannot simply go out and purchase later.
02 / TREATMENT POSITIONING DISCIPLINE

Parents fund treatment, not optical convenience

Urban adolescent myopia running near 86% in the worst affected markets, and the lifetime retinal risk that high myopia plainly carries, together produce a willingness to pay that no correction argument has ever come close to achieving. Myopia management lenses command roughly three times conventional pricing and parents rarely negotiate that pricing at all. The discipline is honest evidence presentation, since any treatment claim outrunning its clinical data would badly damage confidence in the entire segment for everybody in it.
03 / WEARER CONVERSION ECONOMICS

Daily lenses grow spend and kill solutions

Daily disposables now cover roughly 42% of contact lens wearers and lift annual revenue per wearer considerably, even though each individual lens sells for a great deal less than a monthly replacement lens does. Conversion happens through practitioner recommendation at fitting and refit appointments rather than through any consumer advertising campaign at all. The offsetting loss is lens care solution revenue, which disappears from the category entirely rather than moving across to a competitor when a wearer finally switches over.
04 / FRAME SOURCING DIVERSIFICATION

Seventy-one percent from one place is exposure

Roughly 71% of all global frame production now sits inside a single manufacturing region, largely through contract producers supplying brands that own no factories at all and therefore cannot absorb tariff or freight shocks internally. Qualifying frame capacity in Vietnam, India or Eastern Europe costs tooling transfer and a sustained period of genuinely lower yield. It converts a concentrated dependency into a genuine sourcing choice, which is worth considerably more than any unit cost difference in either direction ever could.

Engagement Snapshot From the Field

A live engagement with an industry participant carrying material or product regulatory and market exposure ahead of a defining policy shift, showing how our research translates into a defensible multi-year portfolio strategy.
MARKET MINDS ADVISORY · CLIENT ENGAGEMENT SUMMARY
Vision Care Products Producer Strategic Portfolio Review and Transition Roadmap 2026·Investment Scenario on Vision Care Products Exposure Evaluation 2025-26
CLIENT PROFILE
An optical retail group operating stores with in-house examination across three European markets, with reported vision care revenue of 420 million dollars (client-reported, unverified by MMA). Roughly 63% came from spectacle lenses and frames dispensed in store. Myopia management represented a very small share and no throughput programme existed anywhere across the estate when the work began.
STRATEGIC CHALLENGE
Like-for-like growth had slowed for two years while marketing spend rose, and appointment waiting times had extended across most of the store network. Management was planning a further advertising increase and a frame range expansion. Neither addressed the fact that appointments rather than customer interest were limiting how much the group could actually sell.
MMA APPROACH
MMA analysed revenue against examination hours delivered per store, a comparison the group had never constructed despite holding all the underlying data. Twenty expert interviews with optometrists, store managers, parents of myopic children and regulators established where throughput and demand actually diverged. The analysis treated examination capacity and treatment positioning rather than marketing spend as the routes available.
KEY FINDINGS
  1. Marketing spend was generating appointment requests the stores could not accommodate, so incremental advertising was lengthening waiting lists rather than adding any revenue at all.
  2. Optometrists were spending a substantial share of each appointment on tasks technicians could legally perform in two of the three markets involved.
  3. Parents interviewed described strong willingness to fund myopia management once the lifetime risk was explained, and most had never had that conversation in store.
  4. Frame range expansion had produced measurable inventory cost without any corresponding lift in dispensing volume across the previous two range refreshes in either year.
CLIENT PROFILE
An optical retail group operating stores with in-house examination across three European markets, with reported vision care revenue of 420 million dollars (client-reported, unverified by MMA). Roughly 63% came from spectacle lenses and frames dispensed in store. Myopia management represented a very small share and no throughput programme existed anywhere across the estate when the work began.
STRATEGIC CHALLENGE
Like-for-like growth had slowed for two years while marketing spend rose, and appointment waiting times had extended across most of the store network. Management was planning a further advertising increase and a frame range expansion. Neither addressed the fact that appointments rather than customer interest were limiting how much the group could actually sell.
MMA APPROACH
MMA analysed revenue against examination hours delivered per store, a comparison the group had never constructed despite holding all the underlying data. Twenty expert interviews with optometrists, store managers, parents of myopic children and regulators established where throughput and demand actually diverged. The analysis treated examination capacity and treatment positioning rather than marketing spend as the routes available.
KEY FINDINGS
  1. Marketing spend was generating appointment requests the stores could not accommodate, so incremental advertising was lengthening waiting lists rather than adding any revenue at all.
  2. Optometrists were spending a substantial share of each appointment on tasks technicians could legally perform in two of the three markets involved.
  3. Parents interviewed described strong willingness to fund myopia management once the lifetime risk was explained, and most had never had that conversation in store.
  4. Frame range expansion had produced measurable inventory cost without any corresponding lift in dispensing volume across the previous two range refreshes in either year.
RECOMMENDED STRATEGY
Phase 1: Phase one: deploy technician-assisted pre-testing across stores where scope rules permit it, converting marketing demand into appointments the group can actually serve. Phase 2: Phase two: train dispensing staff on myopia management and make the risk conversation standard for every progressing child seen in any store. Phase 3: Phase three: reduce frame range breadth and redirect that working capital into examination capacity and testing equipment across the estate instead.
OUTCOME
Pre-testing deployment lifted examination throughput materially across the two permitting markets within three quarters. Myopia management dispensing rose from a negligible base to a meaningful share of paediatric revenue (client-reported, unverified by MMA). Frame range reduction released working capital without measurable dispensing loss, and waiting times fell to levels the marketing spend could finally justify.

Frequently Asked Questions

Foundational context covering the market sizes, CAGR, scope, country, region and competition that inform every finding below. This section is provided to cover basics and most often pre-purchase conversations, answered from the MMA Primary Research Dataset.

What is the current size of the Vision Care Products Market?

The market was worth 96.0 billion dollars in 2025, covering spectacle lenses, myopia management, frames, contact lenses, care solutions and ocular lubricants. It reaches 104.1 billion dollars in 2026.

How large will the Vision Care Products Market be by 2036?

MMA forecasts 233.2 billion dollars by 2036, an increase of 129.1 billion dollars over the 2026 base. That represents an expansion multiple of 2.24 times across the forecast period.

What is the CAGR for the Vision Care Products Market 2026 to 2036?

The base case compounds at 8.4% annually. The bull case reaches 9.6% if myopia management gains funded provision, while the bear case sits at 7.2% on optometrist capacity constraining volume.

Which segment is growing fastest?

Myopia management lenses and devices, at 12.6%, half again the market rate of 8.4%. Parents fund a treatment argument in a way no correction argument has ever achieved.

Who are the major companies in the Vision Care Products Market?

EssilorLuxottica, Johnson and Johnson Vision, Alcon, CooperVision and Hoya lead on disclosed vision care product revenue. Zeiss, Rodenstock and Menicon hold notable positions in several regional markets.

Which country is growing fastest?

India at 10.4%, where uncorrected refractive error remains the leading cause of visual impairment and penetration is still low. Optometry training capacity is expanding steadily there.

Report Segmentation Architecture

The full report scope spans multiple orthogonal segmentation dimensions, with cross-tabulated demand data provided for each dimension pair. Coverage extends further to regional breakdowns, trend trajectories, and the competitive detail needed to support segment-level decision-making.

By Product Category

  • Spectacle Lenses
  • Myopia Management Lenses and Devices
  • Spectacle Frames
  • Contact Lenses
  • Contact Lens Care Solutions
  • Over-the-Counter Ocular Lubricants

By End-Use Industry

  • Independent Optical Practice
  • Optical Retail Chains
  • Hospital and Clinical Ophthalmology
  • Mass Merchant and Pharmacy Retail
  • Online and Direct-to-Consumer
  • Public Health and Outreach Programmes

By Commercial Dimension

  • Prescription Dispensing Sale
  • Vision Benefit Plan Funded
  • Direct Consumer Purchase
  • School Screening Programme Supply
  • Subscription and Replenishment Models
  • Wholesale and Distributor Supply

By Region

  • North America
  • Western Europe
  • East Asia
  • South Asia and Pacific
  • Latin America
  • Middle East and Africa
  • Eastern Europe

Scope, Methodology, and Coverage

Every figure in this report is reproducible from documented input assumptions. The scope below maps the historical period, the forecast horizon, the segmentation dimensions, and the countries covered, alongside the underlying primary and qualitative methodology.
Historical Period
2020 to 2025
Forecast Period
2026 to 2036
Base Year
2025 (USD billions; MMA Primary Research Dataset, August 2026)
Market Definition
Scope covers manufactured products worn or applied by patients to correct, protect or actively manage vision, spanning spectacle lenses, myopia management lenses and devices including orthokeratology, spectacle frames, contact lenses, contact lens care solutions, and over-the-counter ocular lubricants and eye drops. Ophthalmic surgical devices and intraocular lenses, vision screening and diagnostic instruments, prescription ophthalmic pharmaceuticals including low-dose atropine, refractive and cataract surgery services, professional eye examination fees, and low vision electronic aids are excluded from the market size and all derived figures.
Quantitative Units
USD billions (current prices); units dispensed; wearers served; replacement cycle in years; examination throughput per practitioner
Segmentation Dimensions
By Product Category; By End-Use Industry; By Commercial Dimension; By Region
Regions Covered
North America, Western Europe, East Asia, South Asia and Pacific, Latin America, Middle East and Africa, Eastern Europe
Countries Covered
China, USA, Japan, Germany, India, France, Italy, UK, South Korea, Brazil, Canada, Spain, Australia, Mexico, Poland
Key Companies Profiled
EssilorLuxottica, Johnson & Johnson Vision, Alcon, CooperVision, Hoya, Bausch + Lomb, Zeiss, Nikon Optical, Rodenstock, Safilo Group, Marchon Eyewear, Marcolin, De Rigo, Fielmann, Warby Parker, Menicon, SEED Contact Lens, Wanxin Optical, Mingyue Optical, Younger Optics
Quantitative Methodology
Primary survey, n=3,800 respondents, Q4 2025, six countries; demand-side model with trade association cross-validation
Qualitative Methodology
47 expert interviews, Q4 2025; applied to validate demand model assumptions, identify emerging dynamics, and assess competitive positioning
Report Format
PDF and XLSX data workbook (Word format preview document)
Publisher
Market Minds Advisory
Report Code
MMA-2026-MED-141
Published
August 2026
Contact
sales@marketmindsadvisory.com | www.marketmindsadvisory.com

Purchase the full Vision Care Products Market Report (2026 to 2036).

The full report runs to 180 pages and covers all six product category segments, seven regions and 20 profiled groups in detail. It includes the complete segment CAGR set, regional myopia prevalence and optometry workforce comparison, and examination throughput analysis modelled against dispensing volume. Company profiles carry evaluation on disclosed vision care product revenue, with moat and risk assessment for the top five groups. The competitive section extends to 17 tracked policy, sourcing and operational developments across 2024 and 2025. Primary research inputs include a quantitative survey of 3,800 respondents and 47 expert interviews conducted in Q4 2025.
Six product category segments with individual CAGR forecasts
Seven regional markets with myopia prevalence and workforce data
Twenty group profiles on consistent revenue evaluation basis
Seventeen tracked policy and sourcing developments with commercial interpretation
Examination throughput modelled as the binding constraint on volume
Myopia management pricing and treatment window assessed across markets

Built For The People Who Decide

From boardroom strategy to bench-side execution, this report is read cover-to-cover by leaders shaping the next decade of their industry, turning demand scenarios, market dynamics and valuation benchmarks into decisions.
CXOs/ Presidents/ VPs/ Managers
M&A and Corporate Development
Strategy Teams and R&D Heads
Procurement and Product Directors
Regulatory and Compliance Leaders
Investor Relations and Equity Analysts