Market Minds Advisory
Virtualized Radio Access Network Market

Virtualized Radio Access Network Market: Virtualized Radio Access Network Market. Cloud-Native Software Reshapes Mobile Network Architecture

Mobile operators are ripping proprietary baseband hardware out of cell towers and replacing it with software running on commodity servers, a shift few legacy telecom equipment vendors saw coming this fast.

Lead Analyst

Published

September 2026

Make Smarter Decisions with Customized Research Insights

Request a free sample report and evaluate market opportunities, growth trends, and competitive dynamics relevant to your business needs.

2025 MARKET VALUE$5.4BMarket Size 2025
2036 FORECAST VALUE$29.8BBase Case , 2026 to 2036
CAGR 2026 TO 203616.8 %Bull 18.1% / Bear 15.5%
INCREMENTAL OPPORTUNITY$23.5BNet 10- year value creation
EXPANSION MULTIPLE4.73x2036 value over 2026 base
Strategic Levers
M&A Pipeline
Regional Outlook
Country Rankings
Competitive Intelligence
Segmental Deep-dive
Call-Us : 91 93563 13602

Executive Snapshot and Market Trajectory.

Virtualized RAN has moved from a niche greenfield experiment to a credible architecture major carriers now specify for new network builds and phased legacy replacement programs. Network architects now specify software compatibility before finalizing hardware procurement, a reversal barely seen when RAN meant a single vendor's integrated stack.
Virtualized distributed unit software platforms are growing fastest as operators push processing closer to the cell site while keeping the software decoupled from proprietary hardware, while centralized unit platforms consolidate a separate but adjacent budget line concentrated in North America's aggressive greenfield deployments and East Asia's dense urban network densification programs. Carriers increasingly demand documented interoperability data as a standard procurement criterion. That requirement barely existed five years ago.
Dozens of cloud-native software vendors compete against a handful of legacy telecom equipment giants now bundling virtualized functions into broader network transformation contracts, and rising demand for measurable interoperability and latency data is starting to separate vendors with genuine field-proven deployments from those still selling on laboratory demonstrations alone. Vendors that can document concrete field deployment data are winning larger multi-year network contracts that smaller lab-stage competitors increasingly cannot match on credibility alone.
Market Definition
This report defines the Virtualized Radio Access Network Market as software platforms that run baseband and radio control functions on general-purpose commercial hardware rather than proprietary integrated equipment. It excludes fully proprietary hardware-integrated RAN systems and the physical antenna and radio unit hardware itself.
Base Year Value
$5.4B in 2025 (MMA Primary Research Dataset, September 2026)
Forecast Period
2026 to 2036, eleven discrete annual values
CAGR
16.8% base case. Bull 18.1%. Bear 15.5%.
Fastest Growth Segment
Virtualized Distributed Unit (vDU) Software Platforms: 24.6% CAGR
Fastest Growth Country
Japan: 19.6% CAGR
Fastest Growth Region
South Asia and Pacific: 18.8% CAGR
Largest Region
North America: 30% of 2025 global value
Market Leaders
Mavenir, Nokia, Samsung Electronics, Ericsson, and Parallel Wireless. Source: MMA Analysis based on company disclosures and network deployment estimates.
Primary Survey
n=3,800 procurement and R&D decision-makers, Q4 2025, six countries
Methodology
Demand-side build-up, cross-validated against public data, 47 expert interviews

Virtualized Radio Access Network Market Forecast Scenarios

virtualized-radio-access-network-market-size-forecast-scenario-1789988771523
Between 2020 and 2025 the market grew from isolated pilot deployments into genuine commercial networks, expanding at roughly 15.4% annually as Rakuten Mobile and Dish Network proved virtualized architecture could support live nationwide commercial traffic at scale. Several major equipment vendors established dedicated virtualized RAN business units during this period. That shift signaled genuine commercial priority.
MMA's base case assumes 16.8% annual growth through 2036, anchored to three mechanisms: expanding greenfield network builds that adopt virtualized architecture from inception rather than retrofitting legacy hardware, rising carrier interest in multi-vendor interoperability that reduces dependence on any single equipment supplier, and steady maturation of RAN intelligent controller software enabling more sophisticated network automation and optimization. Vendors that can demonstrate documented multi-vendor interoperability across live networks are winning larger carrier contracts that smaller single-function competitors increasingly cannot compete for.
The bull case rests on major incumbent carriers accelerating legacy network replacement programs faster than currently planned timelines suggest. The bear case centers on interoperability and integration complexity proving costlier than expected, pushing some carriers back toward single-vendor proprietary solutions for new deployments. That risk is most acute for vendors concentrated heavily on greenfield deployments alone.

From Proprietary Boxes to Cloud-Native Software

Virtualized RAN began as an academic and standards-body concept valued mainly for theoretical vendor flexibility rather than proven commercial viability. Vendors have since layered on cloud-native orchestration, RAN intelligent controllers, and multi-vendor interoperability testing, turning a research concept into a design-critical architecture that determines whether a carrier can compete on network agility and cost structure at all.
AVERAGE DEPLOYMENT COST SAVINGS22%Typical total cost reduction versus proprietary hardware deployment
MULTI-VENDOR INTEROPERABILITY RATE58%Share of deployments combining hardware and software from different vendors
TOP PRODUCING COUNTRY SHARE21%United States share of global virtualized network software revenue
NETWORK LATENCY PERFORMANCE1.2 msTypical processing latency for a modern virtualized baseband function
DEPLOYMENT TIMELINE9 monthsTypical duration from contract signing to live network deployment
FEEDSTOCK COST SHARE38%Server hardware and processor component share of total deployment cost
Pricing now varies sharply by deployment scope and interoperability depth. Basic single-vendor virtualized deployments charge pricing comparable to traditional hardware, while multi-vendor interoperable deployments command premium integration fees that scale with documented compatibility testing, and carriers increasingly accept higher upfront costs after a legacy vendor lock-in convinces leadership that flexibility is worth paying for. Carrier buyers occupy a distinct premium tier, paying per-site integration fees justified by measurable interoperability gains.
Large legacy telecom equipment vendors are acquiring specialized cloud-native software startups rather than building comparable virtualization expertise in-house, buying container orchestration know-how and existing carrier relationships rather than hardware manufacturing capacity alone. That acquisition pattern is starting to squeeze independent boutique vendors that lack the scale to invest in comparable interoperability testing infrastructure their larger competitors now offer as standard. Independent vendors that survive increasingly specialize in a niche larger platforms overlook.
"Nobody switches architecture because a whitepaper says it's the future. They switch after the pilot network survives a real traffic surge without falling over."
Director, Telecommunications Infrastructure and Network Software Practice · MMA Technology Practice · September 2026

Market Trends

Multi-Vendor Interoperability Becomes Standard Carrier Requirement

Carriers increasingly require virtualized RAN deployments to combine hardware and software from different vendors, treating single-vendor lock-in as an unacceptable strategic risk after years of limited pricing negotiation leverage with incumbent equipment suppliers. This shift accelerated sharply once several major carriers publicly disclosed successful multi-vendor commercial deployments, proving the architecture could support live traffic reliably at scale. Roughly 58% of new deployments now combine components from multiple vendors, a figure that continues rising steadily each network generation as interoperability testing matures. Vendors lacking documented multi-vendor testing capability risk being left out of the largest new carrier procurement cycles.
Market Impact: Greenfield deployments grew over 30% yearly

RAN Intelligent Controllers Enable Network Automation

RAN intelligent controller software is increasingly enabling automated network optimization functions that previously required manual engineering intervention, reducing operational costs for carriers managing increasingly dense and complex network deployments. This shift reflects broader industry recognition that manual network optimization cannot scale with the density requirements of modern urban network deployments. Vendors lacking dedicated intelligent controller capability increasingly lose competitive bids to platforms that can demonstrate concrete operational cost reduction tied directly to automated network management. Vendors offering manual-only optimization tools increasingly lose bids against automation competitors demonstrating concrete cost reductions.
Market Impact: Cell density requirements grew over 25%

Market Opportunities and Growth Drivers

Greenfield Network Deployments Favor Virtualized Architecture

New market entrants and challenger carriers building networks from scratch increasingly choose virtualized architecture from inception rather than retrofitting legacy hardware systems, since greenfield builds avoid the integration complexity that constrains incumbent carriers replacing existing infrastructure. Carriers building greenfield networks report meaningfully faster deployment timelines than comparable legacy hardware buildouts would have required. Vendors serving this segment report meaningfully stronger order visibility than those focused purely on legacy network replacement applications. Some vendors now maintain dedicated greenfield account teams purely to serve this growing challenger carrier demand across multiple regional markets.
Market Impact: Integration costs run 18% above projections

Network Densification Requirements Drive Automation Demand

Urban network densification requirements continue expanding as data consumption grows, and each additional small cell site requires network management capability that manual engineering processes cannot scale to support cost-effectively. Carriers increasingly recognize that automated network optimization reduces operational expenditure meaningfully compared to manual processes across dense urban deployments. Vendors offering dedicated automation capability increasingly capture design wins across multiple carrier programs simultaneously rather than single projects. Several vendors have hired dedicated automation engineers purely to serve this growing densification demand across major urban markets worldwide. That order visibility helps vendors plan capacity investment with meaningfully more confidence.
Market Impact: Latency gaps remain near 15%

Market Restraints and Challenges

Multi-Vendor Integration Complexity Raises Deployment Costs

Combining hardware and software from different vendors in a single network deployment requires significantly more integration engineering than single-vendor proprietary systems that arrive pre-integrated from the factory. The root cause is that virtualized RAN standards still leave meaningful interpretation flexibility to individual vendors, creating compatibility gaps that integration teams must resolve manually on each deployment. The commercial impact is elevated deployment costs and longer timelines that partially offset the hardware savings virtualization otherwise provides. Some vendors are now building pre-validated reference architectures specifically to reduce this integration burden. That pivot has proven partially effective at reducing timelines.
Market Impact: 58% of deployments now use multi-vendor

Performance Parity Concerns Limit Premium Network Adoption

Some carriers remain concerned that virtualized architecture cannot yet match the raw performance of purpose-built proprietary hardware for the most demanding premium network use cases requiring ultra-low latency. The root cause is that general-purpose server hardware inherently carries more processing overhead than application-specific integrated circuits optimized for a single narrow function. The commercial impact is continued proprietary hardware deployment for premium network tiers specifically. Some vendors are now developing specialized acceleration hardware to close this performance gap. Early results suggest specialized acceleration hardware meaningfully narrows this performance gap for premium applications.
Market Impact: Automation adoption reaches 40% of networks
4 additional market trends, 3 additional growth drivers, and 4 additional restraints and challenges are covered in the full report. Contact sales@marketmindsadvisory.com to access the complete intelligence.

Segment CAGR and Growth Architecture

The market spans six categories organized by network function, from distributed unit software through professional integration services. Growth concentrates in categories closest to the radio interface, while hardware and services categories grow slowest. RAN intelligent controller and cloud-native baseband processing categories occupy the pricing middle, while hardware and integration services round out the remaining categories at different margin profiles.
virtualized-radio-access-network-market-market-share-analysis-1789988772123

Virtualized Distributed Unit (vDU) Software Platforms

Virtualized Distributed Unit (vDU) Software Platforms handle real-time baseband processing functions closest to the radio interface, growing at roughly 24.6% annually as carriers push processing capacity closer to cell sites while keeping software decoupled from proprietary hardware. Adoption started among premium greenfield network builds willing to pay for architectural flexibility, but falling server hardware costs have pulled legacy network upgrade programs into the category over the past two years. The segment increasingly competes on documented real-time processing latency rather than raw feature count, since latency failures directly cost carriers dropped calls and data sessions. Vendors that can document processing latency below documented thresholds hold a durable pricing advantage over rivals still refining their real-time software architecture.
CAGR 24.6%

Virtualized Centralized Unit (vCU) Software Platforms

Virtualized Centralized Unit (vCU) Software Platforms handle higher-layer network functions that can tolerate greater processing latency than distributed unit functions, growing at roughly 20.4% annually as carriers consolidate centralized processing across multiple cell sites into shared infrastructure. This segment carries a meaningfully lower average selling price than distributed unit software because it runs on more standard server hardware without specialized real-time acceleration requirements. Multi-vendor interoperability increasingly shapes procurement decisions, pushing vendors toward standardized interface implementations competitors have not yet fully matched. Retention in this segment consistently outperforms hardware-only contracts, since ripping out a certified centralized software deployment mid-program is far more disruptive than swapping a server. Enterprise buyers increasingly evaluate interface depth as a primary purchase criterion above price.
CAGR 20.4%
Full segment breakdown across 6 segments available in the complete report.

Regional Architecture and Country Demand Map

North America leads on greenfield carrier deployments and vendor headquarters concentration, while South Asia and Pacific grows fastest as India's massive subscriber base pushes carriers toward cost-efficient virtualized architecture at national scale. East Asia follows closely as Japan's pioneering commercial networks demonstrate proven viability at nationwide scale.

North America

North America holds the largest virtualized RAN spend, supported by the world's most aggressive greenfield carrier deployments and the deepest concentration of cloud-native software vendor headquarters. The United States hosts most of the category's largest software platform vendors, whose scale advantages let them bundle multi-vendor interoperability testing other regions' vendors still charge separately for. Dish Network's nationwide greenfield deployment, among the largest globally, adds significant reference-deployment credibility few other markets currently match. Growth trails the global rate slightly since the largest greenfield opportunities here are already largely captured, leaving mostly incremental legacy network conversion as remaining addressable demand. Canadian carriers are also emerging as a modest secondary growth pocket within the broader region.
Share: 30% | CAGR: 17.4% (2026 to 2036)

Western Europe

Western Europe's incumbent carrier structure, particularly strong in Germany, the United Kingdom, and France, supports a steady base of legacy network conversion contracts distinct from purely greenfield demand elsewhere. Multi-national carrier groups operating across several countries increasingly standardize on common virtualized architecture to simplify cross-border network management. Regulatory attention to network security and sovereignty here is somewhat stricter than in North America, pushing vendors toward region-specific compliance architectures. Growth trails the global average as the region's incumbent-carrier-dominated market converts more cautiously than faster-moving markets elsewhere. Scandinavia's smaller but technologically advanced carrier sector is emerging as a modest secondary growth pocket. Regulatory sandboxes in several countries are helping vendors test compliant network sovereignty deployments before wider rollout.
Share: 20% | CAGR: 15.2% (2026 to 2036)
Regional intelligence for 5 additional markets available in the complete report: East Asia, South Asia and Pacific, Latin America, Middle East and Africa, Eastern Europe. Contact sales@marketmindsadvisory.com.
virtualized-radio-access-network-market-country-cagr-analysis-1789988772658

Interoperability Data Commands Carrier Premium

Standard software licensing is thin and falling, pushing vendors to build recurring revenue around interoperability testing and network automation services carriers actually value. Multi-vendor certification and automation subscriptions now generate most incremental revenue. Vendors that diversify beyond one-off software sales into these channels post materially stronger long-term revenue growth. Enterprise clients increasingly value this diversified capability over one-off sales alone.

Multi-Vendor Interoperability Certification Service Programs Nationwide

Vendors are building dedicated interoperability labs to offer certification testing services that carriers can purchase alongside standard software licensing, proving compatibility depth justifies premium fees above single-vendor deployments. Certification services now generate roughly 16% of total vendor revenue, up from near zero four years ago, and carry meaningfully lower churn than one-off software sales since the certification relationship deepens carrier dependence. Several leading vendors have publicly disclosed certification pipeline growth exceeding 20% year over year as more carriers sign on. This growth trend shows no signs of slowing across the broader telecommunications software industry.
Market Impact: Certification services now reach roughly 16% of revenue

Network Automation Subscription Upgrade Pathway Programs

Vendors increasingly design upgrade paths that convert standard software customers into automated network optimization subscriptions after demonstrating measurable operational cost reduction from intelligent controller capability. These automation subscriptions now command roughly double the average unit price and represent the fastest-growing revenue segment within existing carrier relationships. Network engineers also generate valuable customer insight vendors use to refine which accounts are likeliest to upgrade. Roughly 2 in 5 carriers who try an automation upgrade retain the expanded subscription permanently rather than reverting. Vendors view this recurring premium relationship as more durable than standard software contracts alone.
Market Impact: Automation subscriptions now command roughly 2x fees today

White-Label Reference Architecture Licensing Partnership Programs

Some vendors now license their proprietary pre-validated reference architectures directly to system integrators building custom carrier deployments, a distribution channel that bypasses direct sales entirely. Early licensing deals report meaningfully higher margin than comparable direct sales contracts, since the underlying architecture development cost is already covered by the vendor's own platform investment. Integrators value gaining proven deployment capability without building comparable expertise in-house. Roughly 3 in 10 integrator partners report measurably faster deployment timelines after adopting the licensed architecture. Vendors increasingly treat this licensing channel as a genuine second business line.
Market Impact: Architecture licensing revenue now grows roughly 28% yearly

Network Security Compliance Advisory Service Programs

Some vendors now offer paid security compliance advisory services helping carriers navigate network sovereignty and security standards across multiple regulatory frameworks for their deployments specifically. This advisory revenue remains small but carries extremely high margin since the compliance methodology is already built for internal vendor certification purposes. Carrier compliance teams increasingly view certified vendors as essential partners they cannot otherwise assemble independently. Roughly 1 in 4 advisory clients expand into a full compliance package within their first year of engagement. That expansion pattern makes advisory services a genuinely durable revenue growth path.
Market Impact: Compliance advisory now adds roughly 4% of revenue

Who Controls the Margin Pool

The market is moderately concentrated, with a cr5 of roughly 48%, reflecting a category where legacy telecom equipment giants compete alongside specialized cloud-native software vendors. The leading player holds a meaningful lead over its nearest challenger, with cloud-native entrants closing the gap through documented interoperability data. The gap is measured in interoperability testing data rather than hardware installed base, since buyers research before committing.
Current competition centers on multi-vendor certification disclosures, network automation capability announcements, and carrier reference partnerships, with vendors racing to secure large greenfield contracts before rivals establish similar credibility. Several vendors are acquiring smaller cloud-native software specialists, and some now run dedicated carrier account teams purely to capture certification revenue. International expansion into East Asia and South Asia has become a visible proxy battleground for investor confidence in this category.

Emerging pressure comes from hyperscale cloud providers building comparable network function hosting capability in-house, threatening to erode independent vendors' differentiation entirely. Rankings could shift meaningfully if a well-capitalized cloud provider bundles comparable virtualized RAN capability into an existing infrastructure relationship. Legacy telecom vendors bring deep carrier relationships that cloud entrants still lack. That advantage narrows with each software improvement cycle cloud providers complete.
virtualized-radio-access-network-market-company-positioning-matrix-1789988773199

Competitive Moat and Risk Dimensions

MAVENIR

Moat: Cloud-Native Software Heritage Depth

Mavenir holds the deepest cloud-native software heritage of any virtualized RAN vendor, having built its entire product line around software-first architecture from founding rather than retrofitting legacy hardware businesses. Competitors attempting to displace this depth face years of architectural redesign lead time before reaching comparable software maturity.
MAVENIR

Risk: Hardware Integration Capability Gap

Mavenir's software-only positioning carries less end-to-end hardware integration capability than diversified competitors offering complete turnkey deployments. Carriers preferring a single accountable vendor for both hardware and software could favor integrated competitors instead. Some large carrier programs have already favored integrated competitors specifically to reduce vendor coordination complexity across the deployment.
NOKIA

Moat: Carrier-Grade Reliability Reputation

Nokia built its brand around decades of carrier-grade network reliability and global deployment experience, creating a differentiated positioning that appeals to risk-averse incumbent carriers wary of unproven software vendors. That reliability reputation has attracted long-term framework agreements with several major global carrier groups directly. Carrier procurement teams value this track record enough to accept longer cycles for lower deployment risk.
NOKIA

Risk: Legacy Organizational Complexity Risk

Nokia's legacy hardware business carries organizational complexity that pure-play software competitors avoid, potentially slowing internal decision-making on virtualized product development. Faster-moving software-native rivals could out-innovate Nokia on release cadence. A sudden acceleration in software release cycles among competitors could compress Nokia's competitive positioning faster than its internal processes can adapt.

Players Tracked

Prominent Players

Mavenir
Nokia
Samsung Electronics
Ericsson
Parallel Wireless

Other Key Players

Fujitsu
NEC Corporation
Rakuten Symphony
Casa Systems
JMA Wireless
Radisys
Airspan Networks
Wind River Systems
Red Hat
VMware
Dell Technologies
Intel Corporation
Qualcomm
Amdocs
Ciena

Recent Developments

JANUARY 2026

Mavenir announced an expanded multi-vendor interoperability partnership with a major North American carrier, integrating certified compatibility testing directly into the carrier's next-generation greenfield network deployment program. The agreement extends a pilot certification launched the prior year and reflects growing carrier confidence in documented interoperability performance.
Signal: Carrier interoperability certifications are steadily becoming the primary channel for greenfield design wins right now industry-wide.
SEPTEMBER 2025

Nokia acquired a smaller specialist developer focused on RAN intelligent controller software, absorbing its existing intellectual property and small engineering team. The deal expands Nokia's automation capability into network optimization applications where it previously had limited direct presence, broadening its addressable market. Leadership expects this to accelerate its automation roadmap.
Signal: Consolidation of smaller intelligent controller specialist developers is clearly accelerating as vendors seek capability more quickly.
APRIL 2025

Samsung Electronics entered a joint venture with a Japanese telecommunications carrier to co-develop localized virtualized network infrastructure supporting the carrier's expanding urban densification requirements. The partnership marks Samsung's first meaningful investment dedicated specifically to the Japanese market. Both companies expect the new infrastructure to launch within roughly eighteen months.
Signal: International expansion into East Asia increasingly relies on local carrier partnerships for genuinely successful market entry.

Server Hardware Cost Exposure

Server processors and specialized acceleration hardware together represent roughly thirty-eight percent of deployment cost of goods, with the remainder split between software licensing and integration labor. Most high-performance processor capacity is sourced from a small number of major semiconductor suppliers, concentrating supply risk in a narrow set of vendors globally. This concentration means a supply disruption can ripple through deployment pricing within a single quarterly cycle.
A 2025 processor shortage, documented in a major semiconductor supplier's annual report, forced several smaller vendors to delay new deployment schedules by roughly two months, temporarily slowing carrier rollout timelines in affected markets. Larger vendors with pre-negotiated volume contracts largely avoided the disruption entirely, widening the competitive gap. The episode pushed several affected vendors to diversify processor sourcing across additional suppliers and build larger safety stock buffers going forward.

Smaller vendors without volume purchasing power face materially higher per-unit hardware costs than the largest three vendors, a disadvantage that compounds over time as scale advantages widen with each product generation. Vendors concentrated in North America face comparatively less currency risk than those pricing across multiple international currencies simultaneously. That gap is why smaller vendors increasingly seek acquisition by larger platforms rather than compete independently.
virtualized-radio-access-network-market-cost-volatility-analysis-1789988773398

Diversified Multi-Supplier Processor Sourcing Agreements

Larger vendors are qualifying secondary processor suppliers to reduce exposure to any single supplier's pricing changes or capacity constraints. This diversification adds modest qualification cost upfront but meaningfully shortens recovery time during future component shortages. Several vendors have already qualified alternate suppliers as part of this broader diversification push across their production planning process.

Long-Term Volume Purchase Commitments

Vendors with sufficient scale are negotiating multi-year processor purchase agreements that lock in favorable pricing ahead of demand spikes. Smaller vendors lacking this leverage remain more exposed to spot market price swings during periods of tight processor availability. These agreements typically span two to three years and are increasingly bundled with priority allocation commitments from suppliers.

In-House Hardware Optimization Capability Investment

Some vendors are investing in in-house hardware optimization capability to reduce dependence on off-the-shelf processor configurations for critical production workloads. This investment requires meaningful upfront capital but reduces long-term exposure to third-party pricing and availability fluctuations. Vendors pursuing this path typically expect payback within roughly three to four years of sustained production volume growth.

Portfolio Architecture for Margin Defence

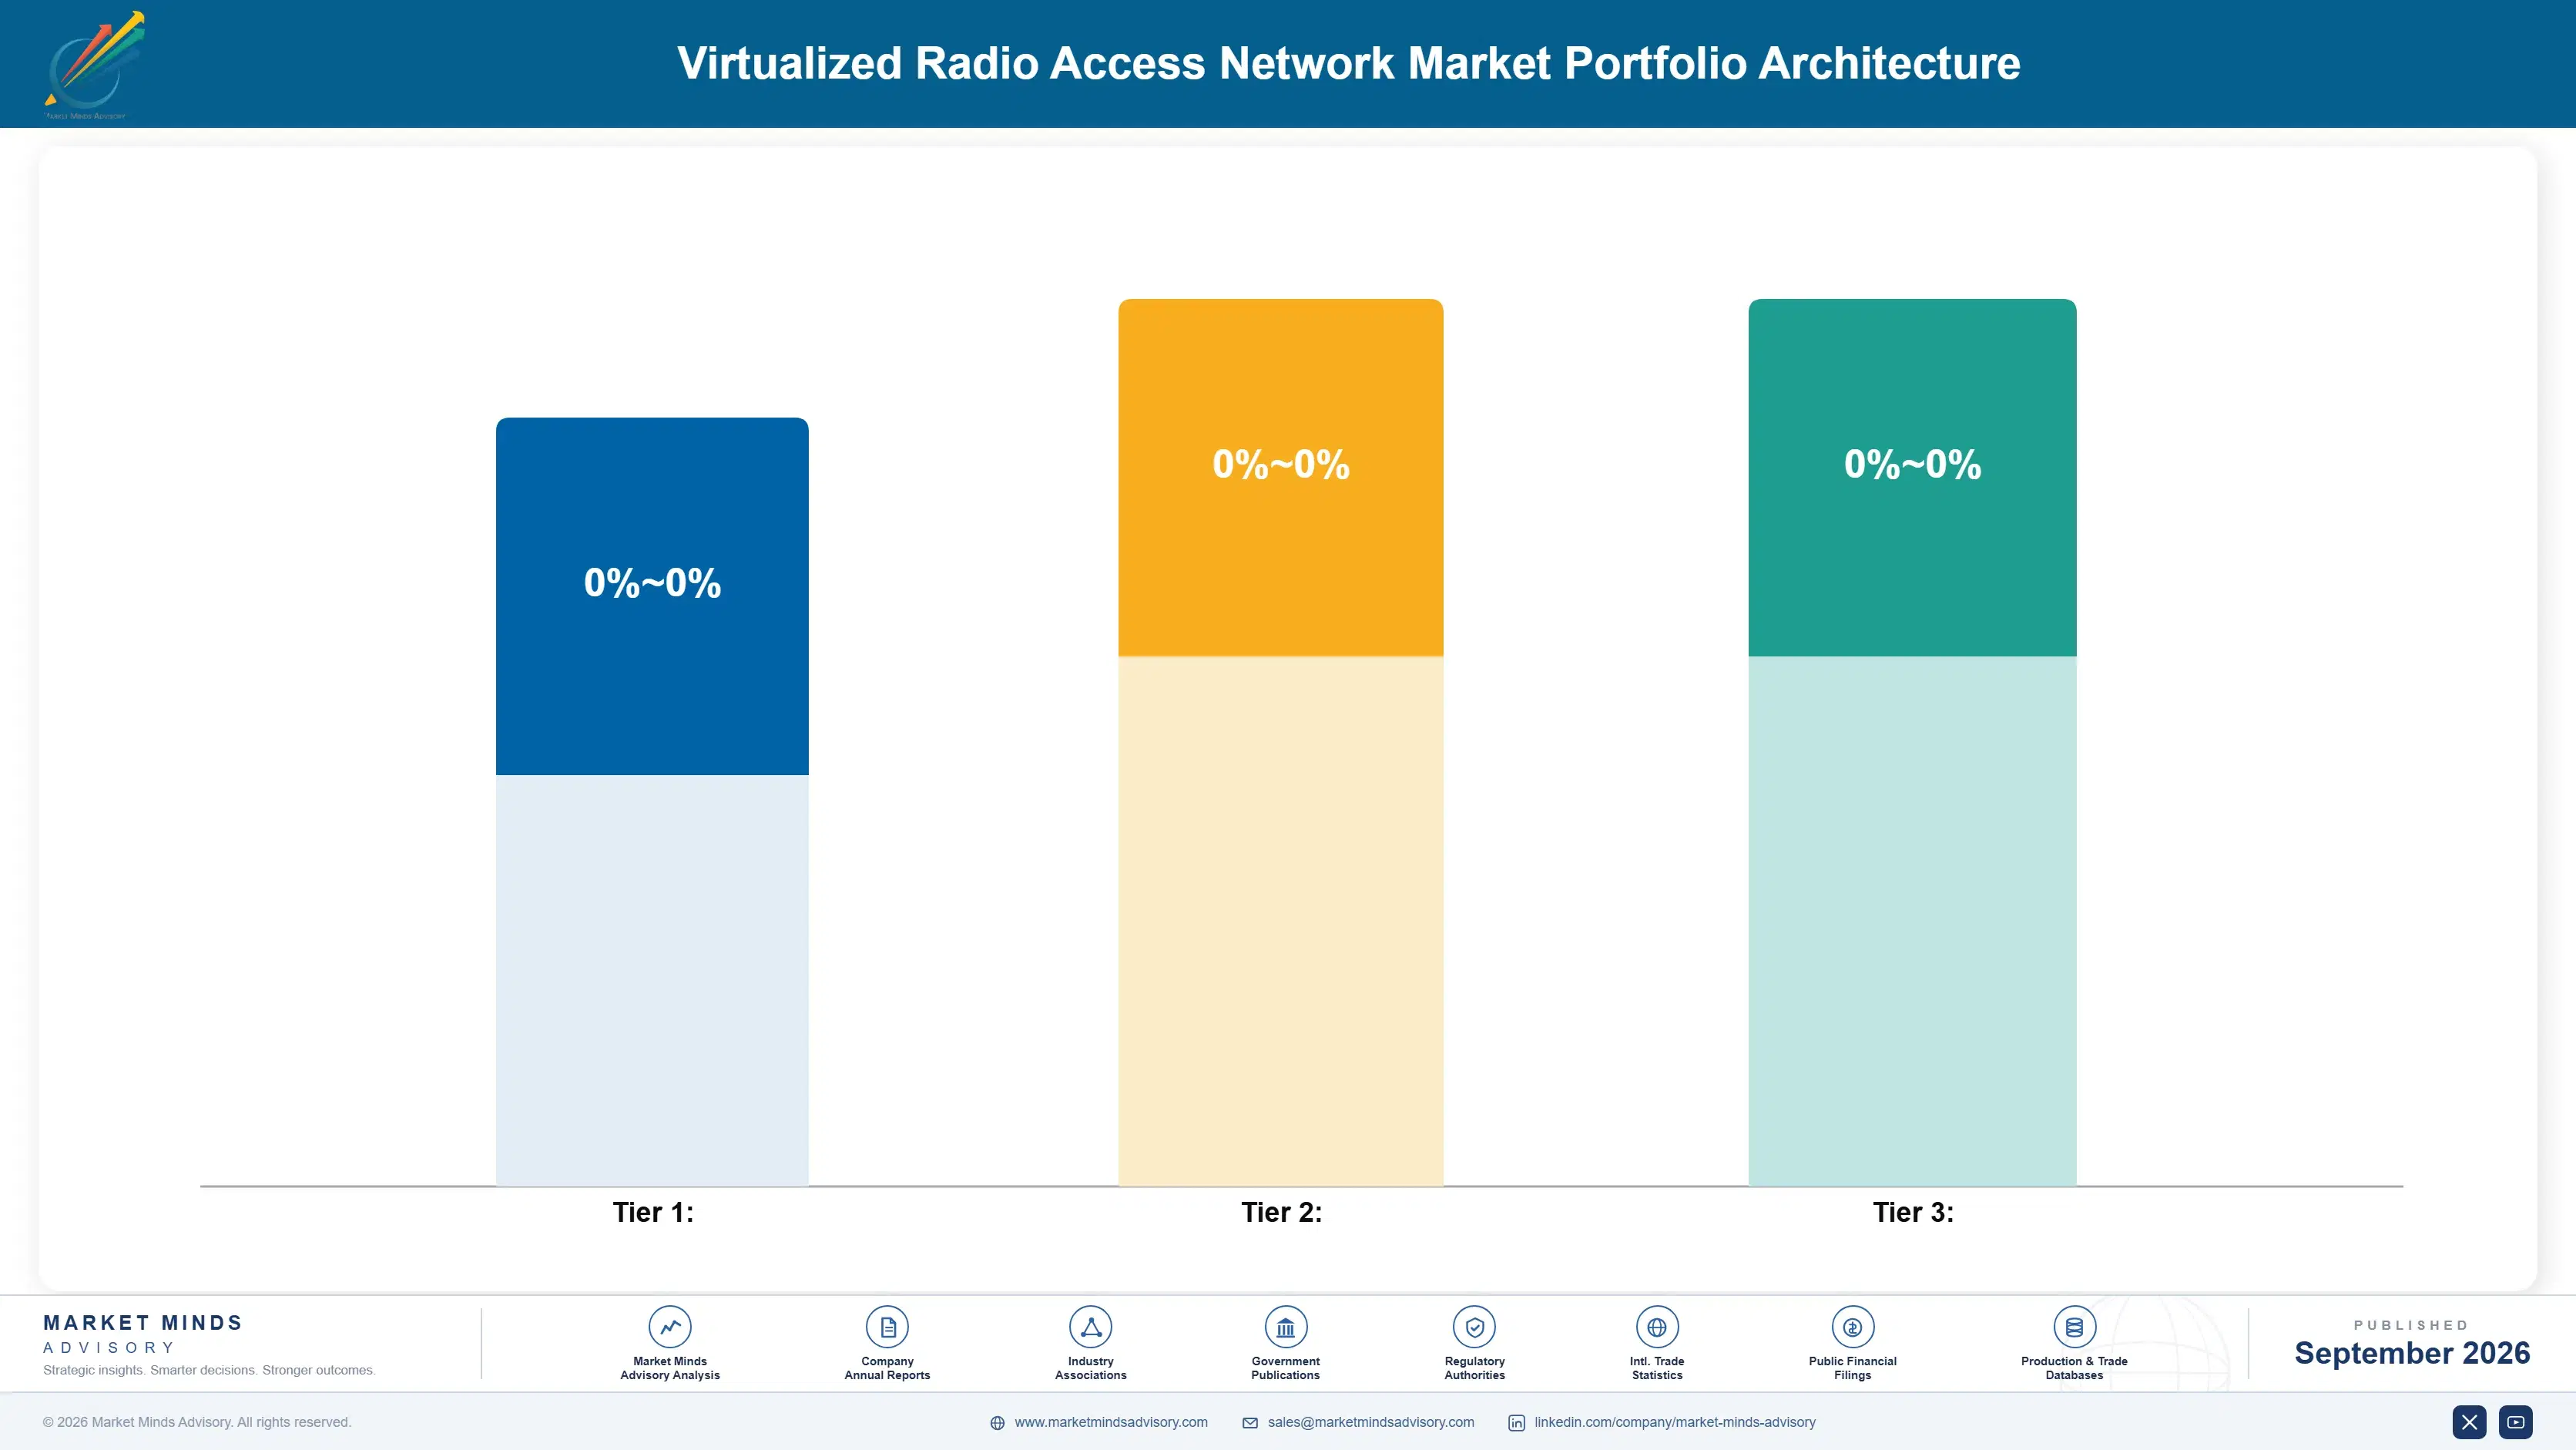
The market splits across three tiers by margin structure. Volume tier standard single-vendor software carries thin margins typical of commodity licensing, while premium tiers bundling multi-vendor certification and network automation command substantially higher margins closer to specialty enterprise software businesses. Sustainability and next-generation tiers, built around intelligent controller automation and reference architecture licensing, are still small but carry the highest long-term margin potential of the three.
Volume and premium tiers pull the market in opposite directions commercially. Volume growth depends on standard single-vendor deployments holding steady, while premium growth depends on convincing carriers that documented interoperability data justifies a higher contract value. Most established vendors now run both tiers under a single platform, using standard clients as a funnel that converts a share into premium upgrades after a well-documented interoperability demonstration.

High-value margin pools concentrate almost entirely in the certification and automation subscription tiers, where vendors capture both a premium fee and a lower acquisition cost through recurring carrier relationships rather than one-off licensing. Volume tier standard licensing generates the bulk of total deployment count but contributes proportionally less to profitability, making it valuable mainly as a funnel into higher-margin offerings.

Standard single-vendor software licenses sold at thin margins comparable to commodity enterprise software, competing primarily on price and basic feature parity rather than interoperability depth. Churn risk is highest here since switching costs are minimal and price comparison across vendors is straightforward for cost-conscious carriers.
Gross Margin

Multi-vendor certified and automation-bundled tiers commanding meaningfully higher margins, priced closer to a specialty enterprise software relationship than commodity licensing, sustained by demonstrated retention advantages. Retention outperforms volume tier customers, since requalifying a certified multi-vendor design mid-deployment is far more disruptive than swapping a license.
Gross Margin

Intelligent controller automation and reference architecture licensing offerings carrying the highest long-term margin potential, dependent on interoperability data that remains costly for smaller vendors to assemble. Adoption remains gradual as carrier buyers demand multi-year field data before committing to broader automation expansion.
Gross Margin
virtualized-radio-access-network-market-portfolio-architecture-1789988773919

High-value Sub-segments and Strategic Watch-out

Virtualized Distributed Unit (vDU) Software Platforms

The fastest-growing and highest-value segment, benefiting directly from greenfield carrier deployments and processing latency improvements that continue to widen its addressable carrier customer base substantially. Vendors documenting audited latency benchmarks are best positioned to capture greenfield design-in wins ahead of competitors still building comparable evidence.

Virtualized Centralized Unit (vCU) Software Platforms

A high-value, moderate-growth segment anchored by centralized processing efficiency and strong retention, expanding steadily as carriers consolidate infrastructure across multiple cell sites into shared platforms. This segment carries the category's largest single deployment footprint and the lowest churn of any tier currently tracked by vendors.

RAN Intelligent Controller (RIC) Software Platforms

The volume core of the market in terms of strategic importance, generating growing automation revenue at expanding margins, competing mainly on documented operational cost reduction rather than raw feature count. Falling automation implementation costs are the main lever pulling budget-conscious carriers into upgrading this segment for the first time.

Commercial Off-The-Shelf Hardware for vRAN

A strategic watch-out segment facing pressure from software differentiation, as vendors increasingly commoditize underlying hardware while competing purely on software capability and interoperability depth. Standalone hardware-only vendors without a software product of their own face genuine pressure to pivot toward software or be quietly acquired.

Deployments Anchor Multi-Year Contracts

The annuity economics here differ from typical enterprise software because renewal depends on multi-year network lifecycle planning rather than continuous daily engagement. Renewal requires sustained proof that the software performs reliably across the full deployment lifespan, not habitual usage patterns the way consumer software retains subscribers. Vendors win renewals by demonstrating documented reliability data that reassures the network engineer. Not by end-user engagement with the underlying software.
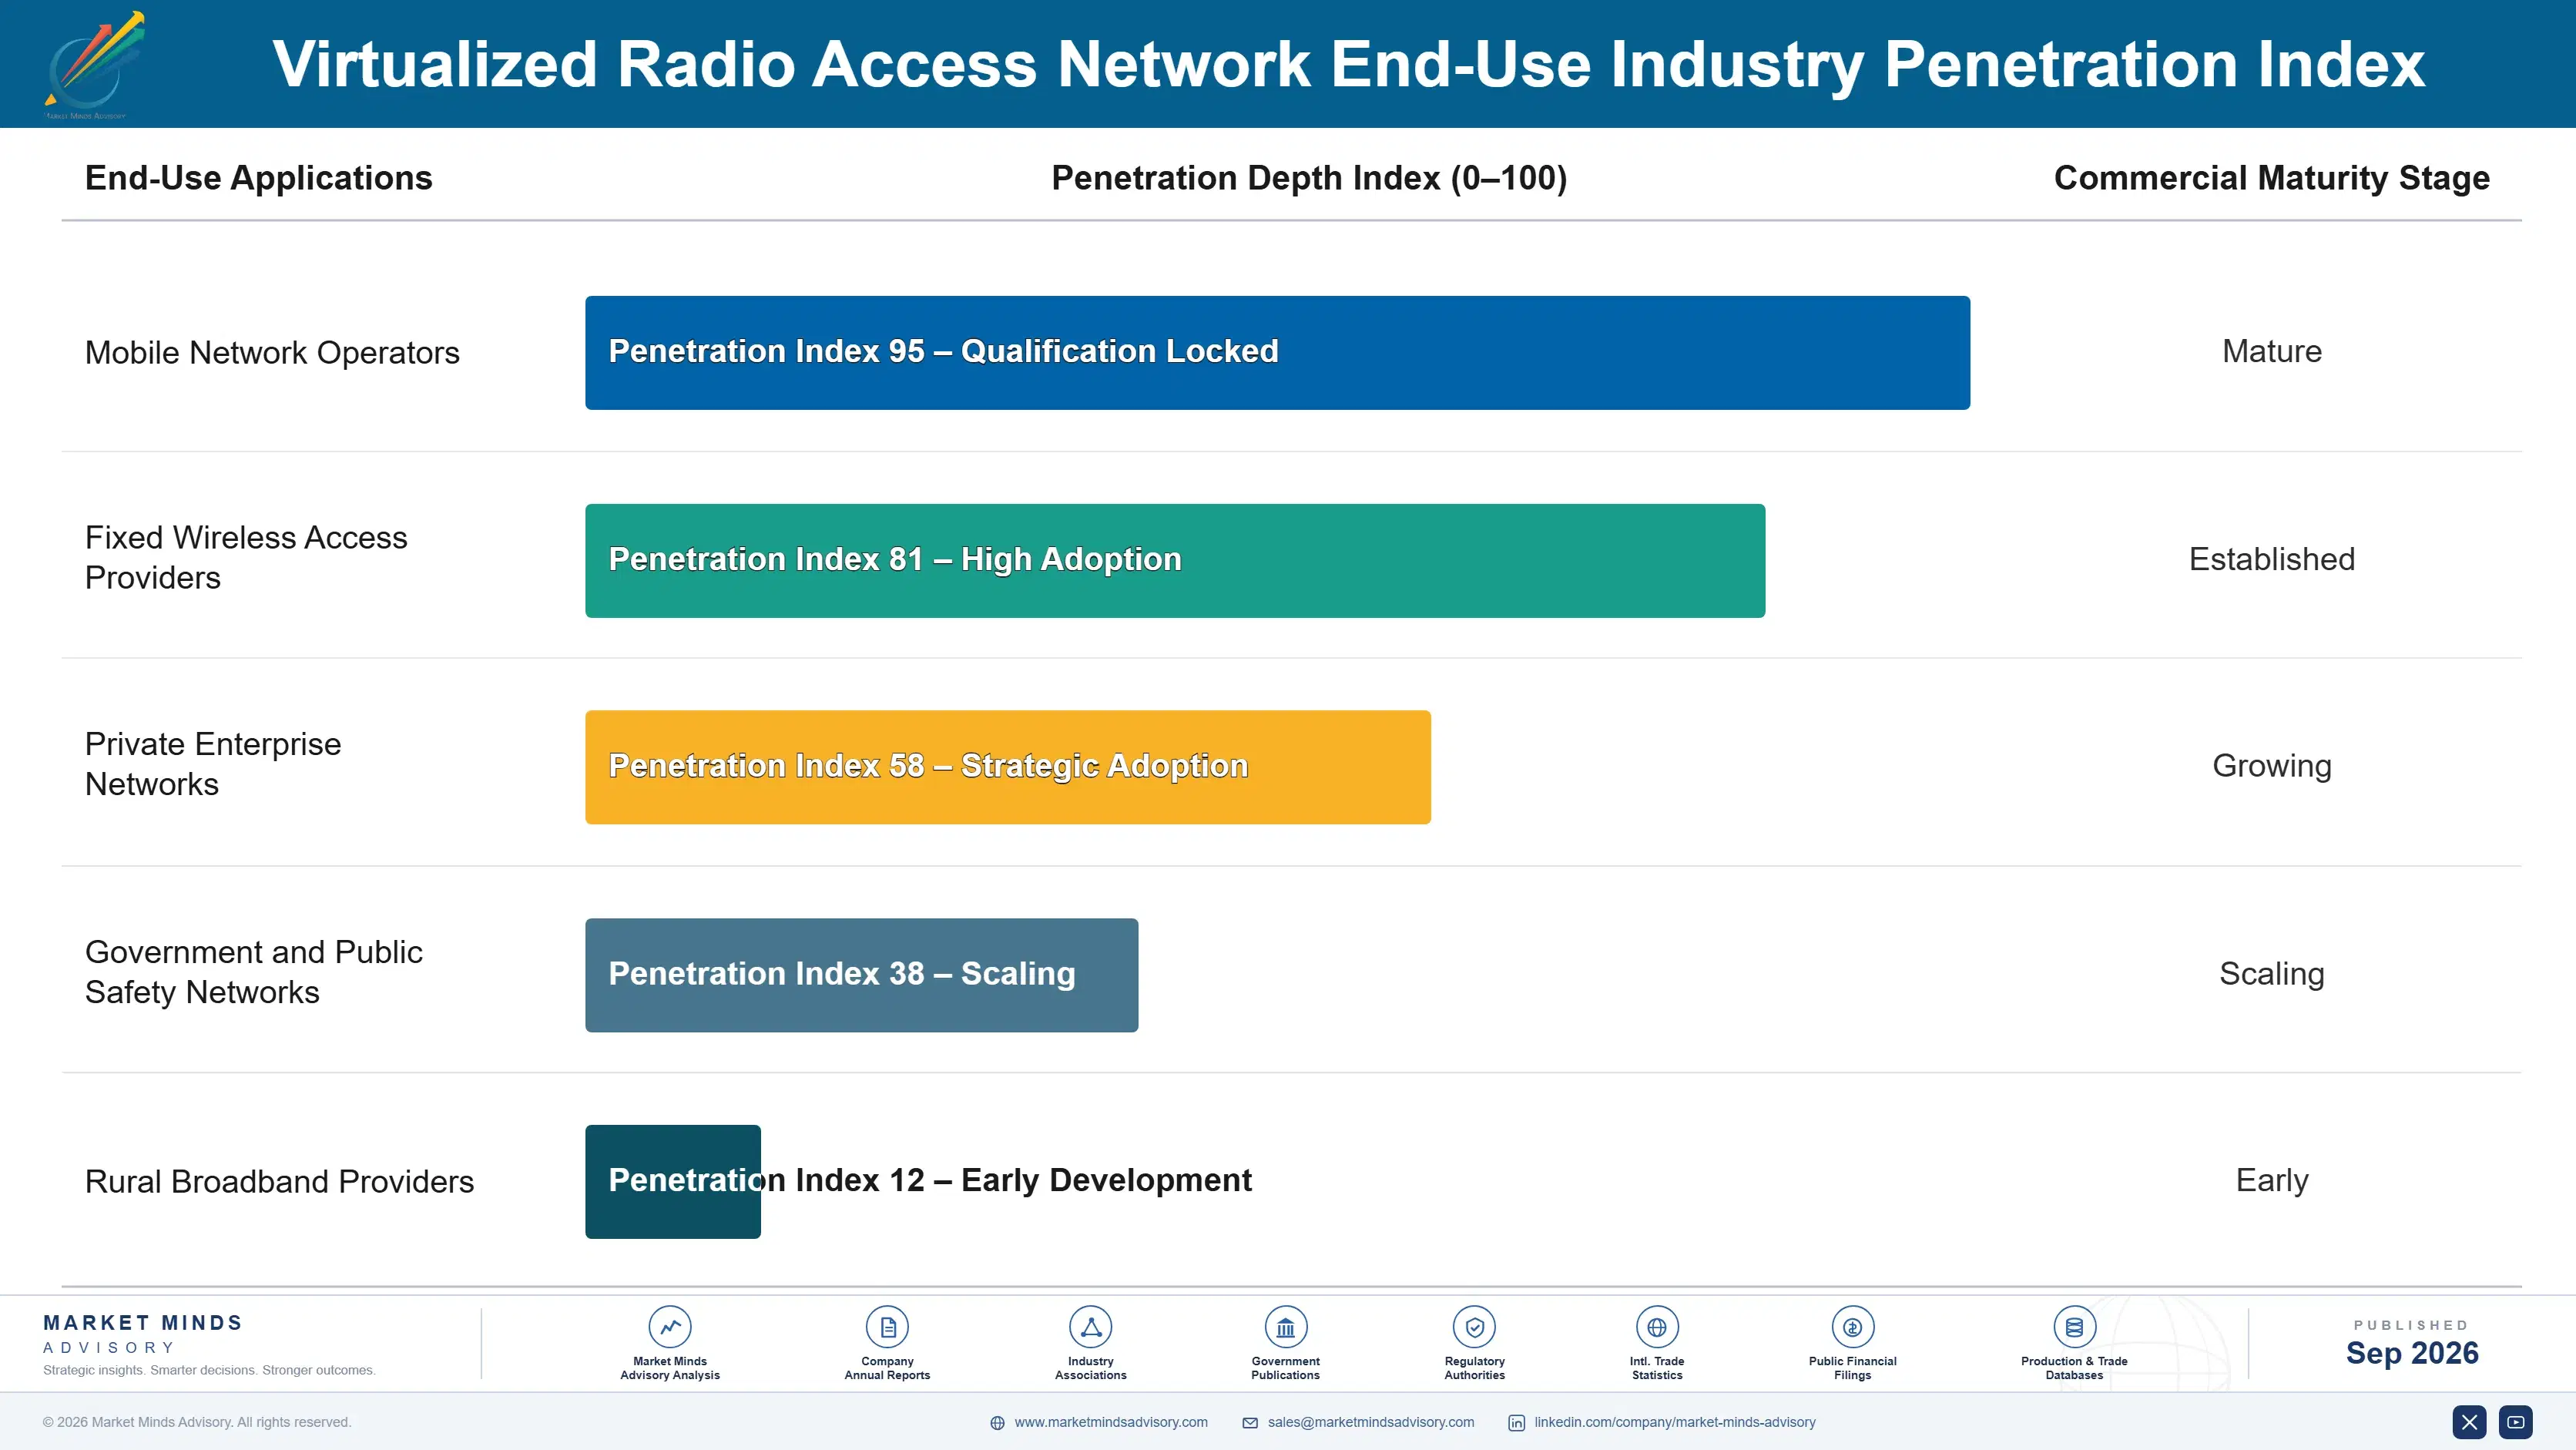
Adoption stickiness varies sharply by end-use vertical. Incumbent carriers show the deepest engagement once converted, since replacing a certified multi-vendor deployment mid-network carries enormous cost and schedule risk, while challenger carriers churn more readily during initial vendor evaluation. RAN intelligent controller subscriptions sit between these extremes, tied closely to network automation maturity rather than the virtualized RAN category itself.

A generational shift is underway in who initiates these purchases. Younger network architects, trained on cloud-native and container orchestration principles from the start of their careers, increasingly specify virtualized software by default rather than defaulting to legacy proprietary hardware, favoring vendors with strong cloud-native engineering support. That cohort is more willing to switch vendors if a competitor demonstrates better interoperability. Brand loyalty here is considerably weaker than among the first wave of hardware-focused engineers.
virtualized-radio-access-network-market-end-use-penetration-index-1789988774413

Where Interoperability Beats Legacy Scale

These are among the four positions where our research anticipates prominent divergence between winners and laggards over the coming forecast period. Each is grounded in the demand model, the regulatory perimeter, and the announced capacity pipeline.
01 / MULTI-VENDOR CERTIFICATION POSITIONING

Build documented interoperability data before rivals win the network

Interoperability certification is becoming the single largest lever separating category leaders from the rest of the field, more so than raw software feature count or basic price ever were in this market's earlier years. Vendors that invest early in dedicated interoperability testing labs are locking in multi-year carrier contracts that competitors cannot easily displace once certified and deployed. Vendors still selling purely on feature checklists risk permanent disadvantage as roughly a third of carrier bids already require documented multi-vendor evidence.
02 / NETWORK AUTOMATION EXPANSION

Convert software customers into automation subscription relationships

Automation subscriptions carry the highest margins and the lowest churn in this category by a wide margin, outperforming standard software licensing on nearly every retention metric vendors track internally today. The strongest commercial opportunity available right now is converting existing software customers into automation relationships after demonstrating measurable operational cost reduction from intelligent controller capability. Vendors without a credible, well-built automation platform will increasingly struggle to capture this upgrade revenue regardless of how established or mature their core software actually is.
03 / HYPERSCALE CLOUD DEFENSE STRATEGY

Build proprietary capability before cloud providers bundle competing tools

Hyperscale cloud providers building comparable network function hosting capability in-house represent a genuine existential risk for standalone vendors dependent purely on software licensing as their core differentiation. Vendors that build or license proprietary interoperability and automation capability early lock in recurring carrier revenue that cloud-native bundles cannot easily replicate without years of dedicated telecom domain expertise of their own. Vendors without a credible defense strategy risk losing carrier contracts entirely as cloud providers continue expanding their native bundled capability further.
04 / HARDWARE COST DIVERSIFICATION STRATEGY

Diversify processor sourcing to defend margin against suppliers

Processor cost concentration leaves smaller vendors disproportionately exposed to pricing changes from a small number of dominant semiconductor suppliers who control most global server hardware capacity today. Vendors that diversify sourcing earlier or invest meaningfully in hardware optimization capability recover faster from price shocks and maintain pricing stability that reassures cost-sensitive carrier clients considering their first multi-year contract. This positioning matters more with each new software release as component intensity keeps rising steadily across an increasingly sophisticated and expanding product lineup.

Engagement Snapshot From the Field

A live engagement with an industry participant carrying material or product regulatory and market exposure ahead of a defining policy shift, showing how our research translates into a defensible multi-year portfolio strategy.
MARKET MINDS ADVISORY · CLIENT ENGAGEMENT SUMMARY
Virtualized Radio Access Network Producer Strategic Portfolio Review and Transition Roadmap 2026·Investment Scenario on Virtualized Radio Access Network Exposure Evaluation 2025-26
CLIENT PROFILE
The client is a mid-size regional wireless carrier evaluating virtualized RAN vendors for its first greenfield network expansion into underserved rural markets. Engineering leadership had relied exclusively on a single legacy hardware vendor for over fifteen years. The carrier had never previously issued a competitive vendor RFP and lacked internal precedent for comparing platforms on a consistent technical basis.
STRATEGIC CHALLENGE
Engineering leadership needed to select a vendor from a crowded field without deep internal cloud-native architecture expertise to evaluate competing interoperability claims independently. A wrong choice risked locking the carrier into a costly redesign if the chosen platform failed multi-vendor certification requirements. Board members were also concerned about committing significant capital to an unproven vendor relationship without independent validation first.
MMA APPROACH
MMA analysts benchmarked five leading vendors against a consistent commercially relevant basis covering documented interoperability certification, network automation capability, and existing regional carrier references. Analysts also interviewed reference clients directly to validate vendor marketing claims independently before finalizing a recommendation. This cross-referencing surfaced meaningful discrepancies between vendor-reported certification status and what comparable regional carriers had actually experienced.
KEY FINDINGS
  1. Only two of five evaluated vendors had independently verified interoperability certification credible enough to support greenfield planning decisions. The remaining three vendors relied primarily on self-reported compatibility claims rather than independently verified certification.
  2. Network automation capability varied enormously across vendors, with the strongest candidate offering pre-built optimization templates. That template capability translated directly into faster deployment and fewer configuration errors during the pilot phase.
  3. Vendor pricing models diverged sharply between flat multi-year licenses and usage-based per-site fee structures. The flat licensing structure ultimately proved more predictable given the carrier's uncertain first-year subscriber growth.
  4. Two vendors lacked prior experience with rural greenfield deployments specifically, requiring a longer planning period. Planning delays would have required additional months of preparation before either vendor could deploy confidently.
CLIENT PROFILE
The client is a mid-size regional wireless carrier evaluating virtualized RAN vendors for its first greenfield network expansion into underserved rural markets. Engineering leadership had relied exclusively on a single legacy hardware vendor for over fifteen years. The carrier had never previously issued a competitive vendor RFP and lacked internal precedent for comparing platforms on a consistent technical basis.
STRATEGIC CHALLENGE
Engineering leadership needed to select a vendor from a crowded field without deep internal cloud-native architecture expertise to evaluate competing interoperability claims independently. A wrong choice risked locking the carrier into a costly redesign if the chosen platform failed multi-vendor certification requirements. Board members were also concerned about committing significant capital to an unproven vendor relationship without independent validation first.
MMA APPROACH
MMA analysts benchmarked five leading vendors against a consistent commercially relevant basis covering documented interoperability certification, network automation capability, and existing regional carrier references. Analysts also interviewed reference clients directly to validate vendor marketing claims independently before finalizing a recommendation. This cross-referencing surfaced meaningful discrepancies between vendor-reported certification status and what comparable regional carriers had actually experienced.
KEY FINDINGS
  1. Only two of five evaluated vendors had independently verified interoperability certification credible enough to support greenfield planning decisions. The remaining three vendors relied primarily on self-reported compatibility claims rather than independently verified certification.
  2. Network automation capability varied enormously across vendors, with the strongest candidate offering pre-built optimization templates. That template capability translated directly into faster deployment and fewer configuration errors during the pilot phase.
  3. Vendor pricing models diverged sharply between flat multi-year licenses and usage-based per-site fee structures. The flat licensing structure ultimately proved more predictable given the carrier's uncertain first-year subscriber growth.
  4. Two vendors lacked prior experience with rural greenfield deployments specifically, requiring a longer planning period. Planning delays would have required additional months of preparation before either vendor could deploy confidently.
RECOMMENDED STRATEGY
Phase 1: Select the vendor with the strongest verified certification and negotiate a flat multi-year licensing structure. This ensures accurate multi-year cost forecasting as subscriber volume scales. Phase 2: Launch a limited pilot across two rural sites before committing to the full greenfield rollout planned. This limits risk while generating enough network data to validate interoperability claims. Phase 3: Require quarterly interoperability audits and build a redesign support clause if certification lapses. This protects the carrier financially if real-world certification diverges from the vendor's initial demonstration.
OUTCOME
The carrier selected its preferred vendor and launched a two-site pilot in early 2026, reporting stable network performance within the first quarter of live operation. Leadership credited the independent vendor comparison with avoiding a costly commitment to a less proven competitor. The pilot's flat-fee structure also meant the carrier faced predictable costs during this initial evaluation period.

Frequently Asked Questions

Foundational context covering the market sizes, CAGR, scope, country, region and competition that inform every finding below. This section is provided to cover basics and most often pre-purchase conversations, answered from the MMA Primary Research Dataset.

What is the current size of the Virtualized Radio Access Network Market?

The Virtualized Radio Access Network Market reached roughly 5.4 billion dollars in 2025. Rising greenfield deployments and multi-vendor interoperability demand are driving continued adoption growth.

How large will the Virtualized Radio Access Network Market be by 2036?

MMA projects the market will reach approximately 29.82 billion dollars by 2036. That represents roughly 4.73 times its 2026 value, driven by automation and multi-vendor certification expansion.

What is the CAGR for the Virtualized Radio Access Network Market 2026 to 2036?

The market is projected to grow at a 16.8% compound annual rate between 2026 and 2036. Greenfield carrier deployments and network densification demand both support this sustained growth pace.

Which segment is growing fastest?

Virtualized Distributed Unit (vDU) Software Platforms are growing fastest, at roughly 24.6% annually, about 1.46 times the overall market rate. Real-time processing demand is the primary driver behind this pace.

Who are the major companies in the Virtualized Radio Access Network Market?

Mavenir, Nokia, Samsung Electronics, Ericsson, and Parallel Wireless lead the market. Together these five companies hold roughly 48% combined share on a network deployment basis.

Which country is growing fastest?

Japan is growing fastest, at roughly 19.6% annually, as Rakuten Mobile's pioneering nationwide commercial network continues demonstrating proven viability at genuine scale across the industry.

Report Segmentation Architecture

The full report scope spans multiple orthogonal segmentation dimensions, with cross-tabulated demand data provided for each dimension pair. Coverage extends further to regional breakdowns, trend trajectories, and the competitive detail needed to support segment-level decision-making.

By Primary Market Dimension

  • Virtualized Distributed Unit (vDU) Software Platforms
  • Virtualized Centralized Unit (vCU) Software Platforms
  • RAN Intelligent Controller (RIC) Software Platforms
  • Cloud-Native Baseband Processing Software
  • Commercial Off-The-Shelf Hardware for vRAN
  • vRAN Integration and Professional Services

By End-Use Industry

  • Mobile Network Operators
  • Fixed Wireless Access Providers
  • Private Enterprise Networks
  • Government and Public Safety Networks
  • Rural Broadband Providers

By Commercial Dimension

  • Direct Carrier Licensing Channels
  • System Integrator Partnership Channels
  • Automation Subscription Channels
  • Reference Architecture Licensing Channels

By Region

  • North America
  • Western Europe
  • East Asia
  • South Asia and Pacific
  • Latin America
  • Middle East and Africa
  • Eastern Europe

Scope, Methodology, and Coverage

Every figure in this report is reproducible from documented input assumptions. The scope below maps the historical period, the forecast horizon, the segmentation dimensions, and the countries covered, alongside the underlying primary and qualitative methodology.
Historical Period
2020 to 2025
Forecast Period
2026 to 2036
Base Year
2025 (USD billions; MMA Primary Research Dataset, September 2026)
Market Definition
This report defines the Virtualized Radio Access Network Market as software platforms that run baseband and radio control functions on general-purpose commercial hardware rather than proprietary integrated equipment. It excludes fully proprietary hardware-integrated RAN systems and the physical antenna and radio unit hardware itself.
Quantitative Units
USD billions, network deployment counts, and percentage share
Segmentation Dimensions
Network function type, end-use industry, and commercial dimension
Regions Covered
North America, Western Europe, East Asia, South Asia and Pacific, Latin America, Middle East and Africa, Eastern Europe
Countries Covered
United States, Japan, India, Germany, China, Brazil, and 21 additional countries
Key Companies Profiled
Mavenir, Nokia, Samsung Electronics, Ericsson, Parallel Wireless, and 15 additional companies
Quantitative Methodology
Primary survey, n=3,800 respondents, Q4 2025, six countries; demand-side model with trade association cross-validation
Qualitative Methodology
47 expert interviews, Q4 2025; applied to validate demand model assumptions, identify emerging dynamics, and assess competitive positioning
Report Format
PDF and XLSX data workbook (Word format preview document)
Publisher
Market Minds Advisory
Report Code
MMA-2026-TEC-236
Published
September 2026
Contact
sales@marketmindsadvisory.com | www.marketmindsadvisory.com

Purchase the full Virtualized Radio Access Network Market Report (2026 to 2036).

This report gives carrier network planning teams and telecom software vendors a complete view of the Virtualized Radio Access Network Market through 2036. It covers segment-level growth, regional demand shifts, and competitive positioning across distributed unit, centralized unit, and intelligent controller product lines. Input cost exposure and margin architecture are analyzed in detail, with particular attention to how server hardware cost volatility is reshaping vendor pricing and consolidation across every major regional market. Readers get actionable guidance on where to concentrate commercial investment over the next decade of network virtualization.
Ten-year global revenue and deployment volume forecasts
Seven-region demand, pricing, and adoption breakdown
Competitive benchmarking across the top twenty vendors
Server hardware cost exposure analysis and mitigation guidance
Segment-level margin architecture and pricing tier analysis
Anonymized client vendor selection engagement case study

Built For The People Who Decide

From boardroom strategy to bench-side execution, this report is read cover-to-cover by leaders shaping the next decade of their industry, turning demand scenarios, market dynamics and valuation benchmarks into decisions.
CXOs/ Presidents/ VPs/ Managers
M&A and Corporate Development
Strategy Teams and R&D Heads
Procurement and Product Directors
Regulatory and Compliance Leaders
Investor Relations and Equity Analysts