Market Minds Advisory
Virtual Machines Market

Virtual Machines Market: Virtual Machines Market. Hybrid Cloud Migration Demand Is Outpacing Legacy Hypervisor Volume

Enterprises are shifting virtualization budgets toward hybrid cloud compatible platforms rather than single vendor hypervisor renewals, forcing legacy virtualization vendors to defend installed base against platforms built for multi cloud portability.

Lead Analyst

Published

September 2026

Make Smarter Decisions with Customized Research Insights

Request a free sample report and evaluate market opportunities, growth trends, and competitive dynamics relevant to your business needs.

2025 MARKET VALUE$12.8BMarket Size 2025
2036 FORECAST VALUE$32.7BBase Case , 2026 to 2036
CAGR 2026 TO 20368.9 %Bull 10.2% / Bear 7.5%
INCREMENTAL OPPORTUNITY$18.8BNet 10- year value creation
EXPANSION MULTIPLE2.35x2036 value over 2026 base
Strategic Levers
M&A Pipeline
Regional Outlook
Country Rankings
Competitive Intelligence
Segmental Deep-dive
Call-Us : 91 93563 13602

Executive Snapshot and Market Trajectory.

Enterprises are shifting virtualization budgets toward hybrid cloud compatible platforms rather than single vendor hypervisor renewals, and that shift toward multi cloud portability is now the single most consequential qualitative dynamic reshaping vendor product roadmaps this year. Vendors are responding quickly across most roadmaps.
Demand concentrates among enterprises seeking licensing flexibility following major vendor consolidation and mid market firms seeking hybrid cloud portability that legacy single vendor hypervisors cannot reliably provide, with hybrid cloud virtualization platforms growing fastest of all six segments as multi cloud adoption accelerates rapidly. North America carries the largest regional share, reflecting the region's concentrated enterprise IT infrastructure spending relative to every other region tracked in this report.
Competitive structure remains fairly concentrated among established virtualization firms with deep hypervisor engineering expertise, alongside smaller specialist orchestration vendors competing on migration flexibility for enterprises reconsidering vendor lock-in. Buyers increasingly expect documented licensing transparency and migration tooling data rather than accepting generic hypervisor bundles alone, reordering vendor shortlists across the category. Legacy vendors without dedicated hybrid cloud investment are losing ground steadily today. This is visible in recent contract award patterns across major accounts.
Market Definition
This report covers software platforms that create and manage virtual machines for server and desktop virtualization, including hypervisor software, virtual machine management tools, and hybrid cloud virtualization platforms. It excludes container orchestration platforms that do not virtualize a full operating system and public cloud infrastructure as a service revenue not tied to virtualization software licensing.
Base Year Value
$12.8B in 2025 (MMA Primary Research Dataset, September 2026)
Forecast Period
2026 to 2036, eleven discrete annual values
CAGR
8.9% base case. Bull 10.2%. Bear 7.5%.
Fastest Growth Segment
Hybrid Cloud Virtualization Platforms: 12.5% CAGR
Fastest Growth Country
India: 10.8% CAGR
Fastest Growth Region
South Asia and Pacific: 11.4% CAGR
Largest Region
North America: 30% of 2025 global value
Market Leaders
Broadcom Inc, Microsoft Corporation, Citrix Systems Inc, Nutanix Inc, Red Hat Inc. Source: MMA Analysis based on company disclosures and primary research.
Primary Survey
n=3,800 procurement and R&D decision-makers, Q4 2025, six countries
Methodology
Demand-side build-up, cross-validated against public data, 47 expert interviews

Virtual Machines Market Forecast Scenarios

virtual-machine-market-size-forecast-scenario-1789993507279
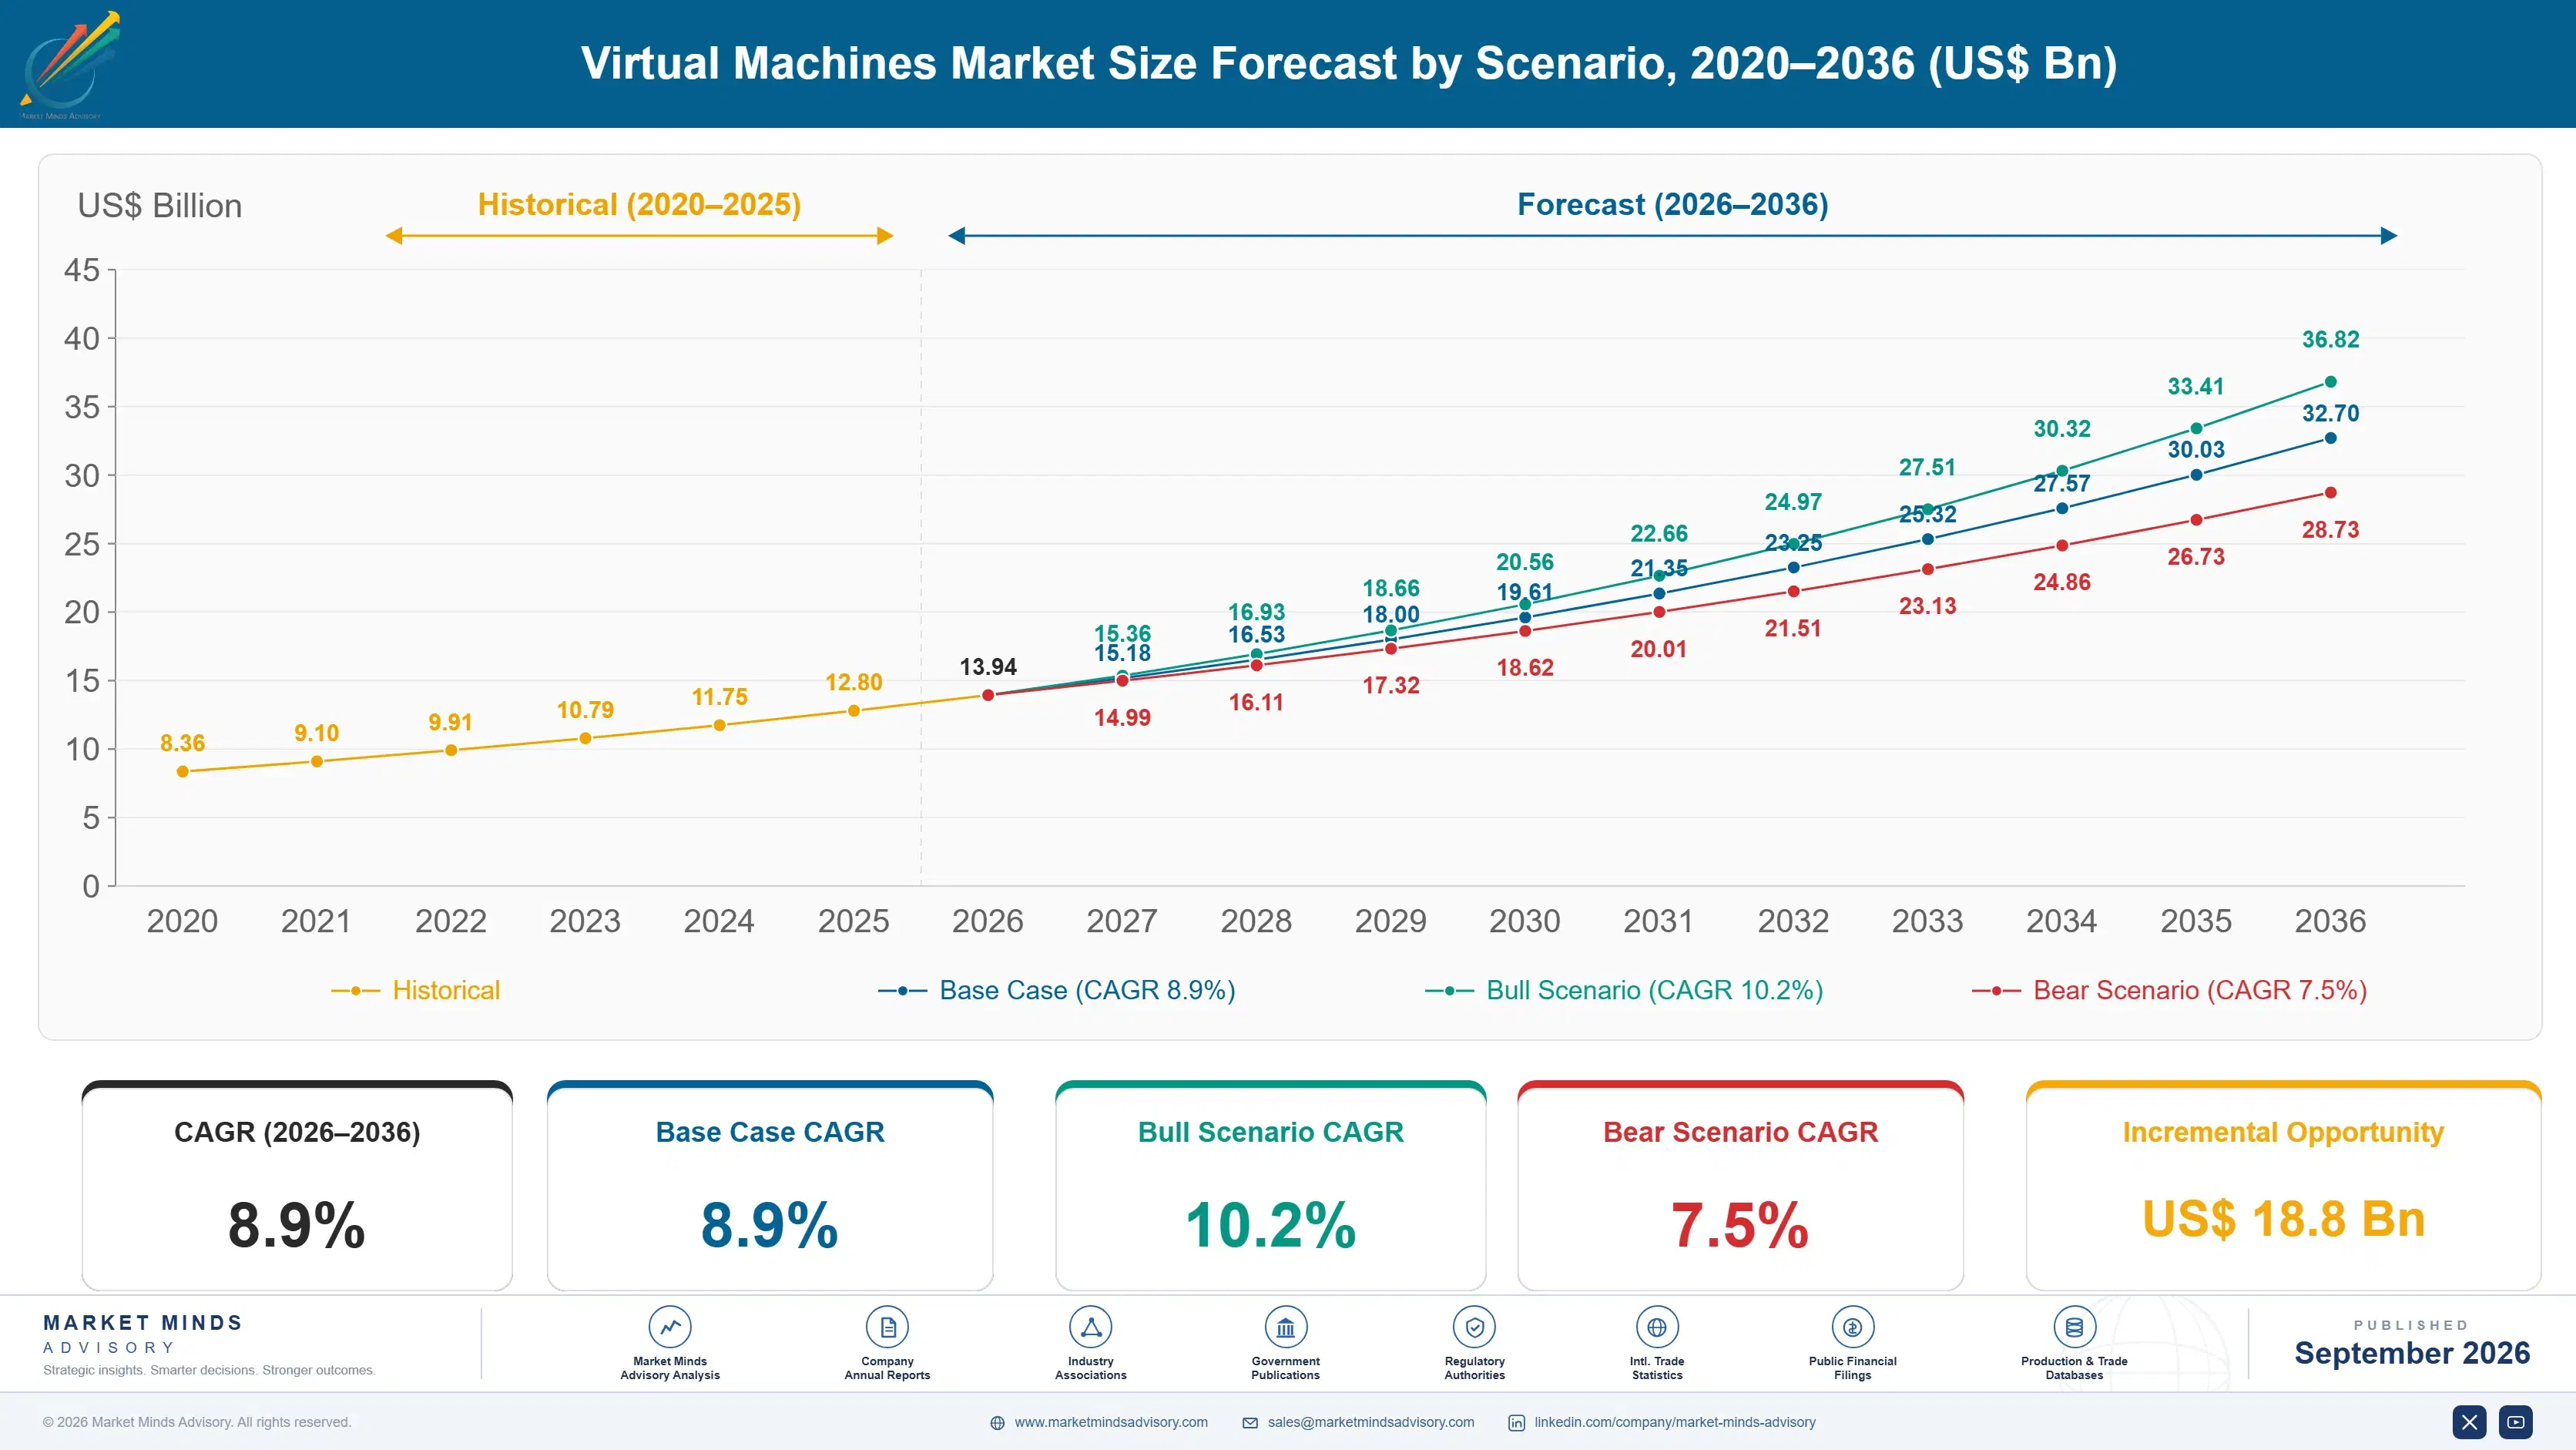
Between 2020 and 2025 the category grew steadily as enterprises expanded server virtualization deployment across data center consolidation programmes, with growth accelerating from 2023 onward as major licensing model changes prompted enterprises to reassess vendor concentration risk, reflecting a historical CAGR of 8.1 percent across the trailing five year period tracked closely. Vendors scaled cross platform compatibility investment across this period.
The base case assumes sustained growth driven by three mechanisms. Enterprises are adopting hybrid cloud virtualization platforms that reduce dependency on any single hypervisor vendor following major licensing model disruption. Mid market firms are deploying virtual machine orchestration software that manages workloads consistently across on premise and cloud environments. IT teams are expanding desktop virtualization to support distributed workforce requirements that traditional physical desktop deployment cannot match, and these mechanisms compound fastest among enterprises operating the most complex multi environment infrastructure.
A bull scenario turns on accelerated enterprise migration away from concentrated vendor licensing models as alternative platforms mature faster than expected. The bear risk is enterprise capital expenditure tightening during a period of economic uncertainty, delaying planned migration programmes despite the underlying multi year shift toward hybrid cloud, vendor diversified virtualization continuing to support long term category growth.

Licensing Disruption Resets Vendor Priorities

Two forces are reshaping this category at once: hybrid cloud portability compressing the switching cost enterprises face when reconsidering vendor concentration, and buyers increasingly treating documented licensing transparency and migration tooling as the primary evaluation criterion rather than accepting bundled hypervisor licensing as sufficient. This is pulling vendor investment toward cross platform compatibility engineering and migration tooling and away from the incremental feature competition that once defined the category.
MARKET CONCENTRATIONCR5 48%Reflects a fairly concentrated virtualization software industry overall
AVERAGE LICENSE COSTUSD 3,200 per virtualized host annuallyBlended cost across hypervisor and management licensing overall
TOP PRODUCING COUNTRY SHAREUnited States at 32% of global licensing revenueReflects the country's concentrated enterprise IT infrastructure base
HYBRID CLOUD REVENUE SHARE27% of total category revenueShare of revenue tied to hybrid cloud virtualization platforms
AVERAGE MIGRATION COST REDUCTION26% versus single vendor lock-in baselineTypical cost reduction gain from diversified platform adoption
SOFTWARE DEVELOPMENT COST SHARE41% of total operating costShare of vendor operating cost tied to platform engineering
Commercially, the market behaves like a specification driven enterprise software category where documented migration cost and licensing transparency increasingly separate credible hybrid cloud vendors from legacy hypervisor providers relying on established installed base relationships alone. Enterprises evaluate vendors heavily on measurable migration cost and integration ease with existing infrastructure management tools, creating real switching friction once a vendor's orchestration platform becomes embedded across daily infrastructure operations.
Over the next decade, expect hybrid cloud compatible virtualization to become the standard baseline across nearly every enterprise infrastructure decision rather than a differentiated capability reserved for the largest technology budgets alone. Vendors that build genuine cross platform depth alongside proven migration tooling will capture a growing share of category value beyond legacy single vendor hypervisor work that defines smaller regional deployments.
"Enterprises used to ask which hypervisor came bundled with their servers. Now they ask how easily they can leave if licensing terms change again, and that question is rewriting procurement criteria fast."
Director, Enterprise Infrastructure and Virtualization Practice · MMA Technology Practice · September 2026

Market Trends

Hybrid Cloud Portability Displaces Single Vendor Dependency

Enterprises are increasingly specifying hybrid cloud compatible virtualization platforms in place of single vendor hypervisor dependency that cannot provide migration flexibility when licensing terms change unexpectedly. MMA's Q4 2025 primary research found enterprises using hybrid cloud platforms reporting migration cost reductions averaging 26 percent versus comparable single vendor lock-in baselines, as vendors completed the cross platform compatibility investment needed to support workload portability reliably across environments. This shift is resetting vendor investment priorities across the category broadly and quickly. Vendors without comparable cross platform capability face mounting pressure across nearly every enterprise track.
Market Impact: Drives 52 percent of new decisions
Licensing Model Disruption Extends Alternative Platform Demand

Enterprises are increasingly evaluating alternative virtualization platforms following major licensing model disruption, extending demand into an alternative platform customer segment that traditional single vendor deployments had not historically considered at meaningful scale. MMA's expert interview programme found enterprises citing documented licensing transparency, not feature parity alone, as an increasingly important criterion in vendor selection decisions across migration evaluation programmes specifically. This shift favours vendors that invested early in transparent, predictable licensing models over vendors offering only opaque bundled pricing structures. Vendors without comparable licensing clarity face slower adoption across new evaluation categories.
Market Impact: Sustains demand across 27 percent

Market Opportunities and Growth Drivers

Vendor Concentration Risk Sustains Diversification Investment

Continued enterprise concern about vendor concentration risk following major licensing disruption is sustaining demand for hybrid cloud platforms capable of reducing single vendor dependency across critical infrastructure workloads. Surveyed enterprise technology buyers linked 52 percent of new virtualization platform decisions directly to vendor diversification requirements rather than general technology modernisation alone, according to MMA's Q4 2025 primary research programme covering enterprise buyers across six countries. This diversification driven demand is sustaining vendor investment even where broader technology budgets face continued scrutiny across several regional markets today, indeed, truly, overall and today.
Market Impact: Adds 18 percent to migration delay

Distributed Workforce Requirements Sustain Desktop Virtualization

Continued distributed workforce requirements across major enterprises are sustaining demand for desktop virtualization platforms capable of delivering consistent desktop experiences across geographically dispersed employees. Announced new desktop virtualization deployment programmes tracked in MMA's primary research programme climbed steadily through 2025, sustaining vendor growth across enterprises treating desktop virtualization as essential workforce infrastructure rather than a discretionary investment reserved only for the largest distributed enterprises today. Smaller enterprises are increasingly following this same desktop virtualization pattern across multiple regional operations, sustaining broader category momentum. Vendors increasingly treat this trend as a core delivery priority.
Market Impact: Limits 20 percent adoption

Market Restraints and Challenges

Migration Complexity Complicates Vendor Switching Decisions

Enterprises face sustained migration complexity when switching virtualization vendors, complicating vendor diversification decisions and slowing realisation of projected licensing cost savings across affected infrastructure environments. The root cause is that deeply embedded virtualization platforms require extensive workload retesting and staff retraining regardless of documented cost savings, adding delay that licensing considerations alone cannot resolve. The commercial impact concentrates delayed migration among enterprises without dedicated infrastructure transformation investment specifically. Several vendors are responding by developing automated migration tooling that reduces workload retesting burden considerably today overall. Vendors increasingly treat this as a core support discipline.
Market Impact: Cuts migration costs by 26 percent

Skills Shortage Complicates Multi-Platform Infrastructure Management

Persistent shortage of infrastructure engineers skilled across multiple virtualization platforms complicates multi platform management for enterprises pursuing vendor diversification strategies. The root cause is that specialised multi platform skills require extensive training that traditional infrastructure teams have not historically prioritised when concentrated around a single vendor platform. The commercial impact concentrates management complexity among enterprises without dedicated cross platform training investment specifically. Vendors are responding by investing in simplified unified management interfaces that reduce the specialised skills burden across platforms truly today. Building this capability now is proving increasingly essential across most major regional markets.
Market Impact: Adds 23 percent volume
4 additional market trends, 3 additional growth drivers, and 3 additional restraints and challenges are covered in the full report. Contact sales@marketmindsadvisory.com to access the complete intelligence.

Segment CAGR and Growth Architecture

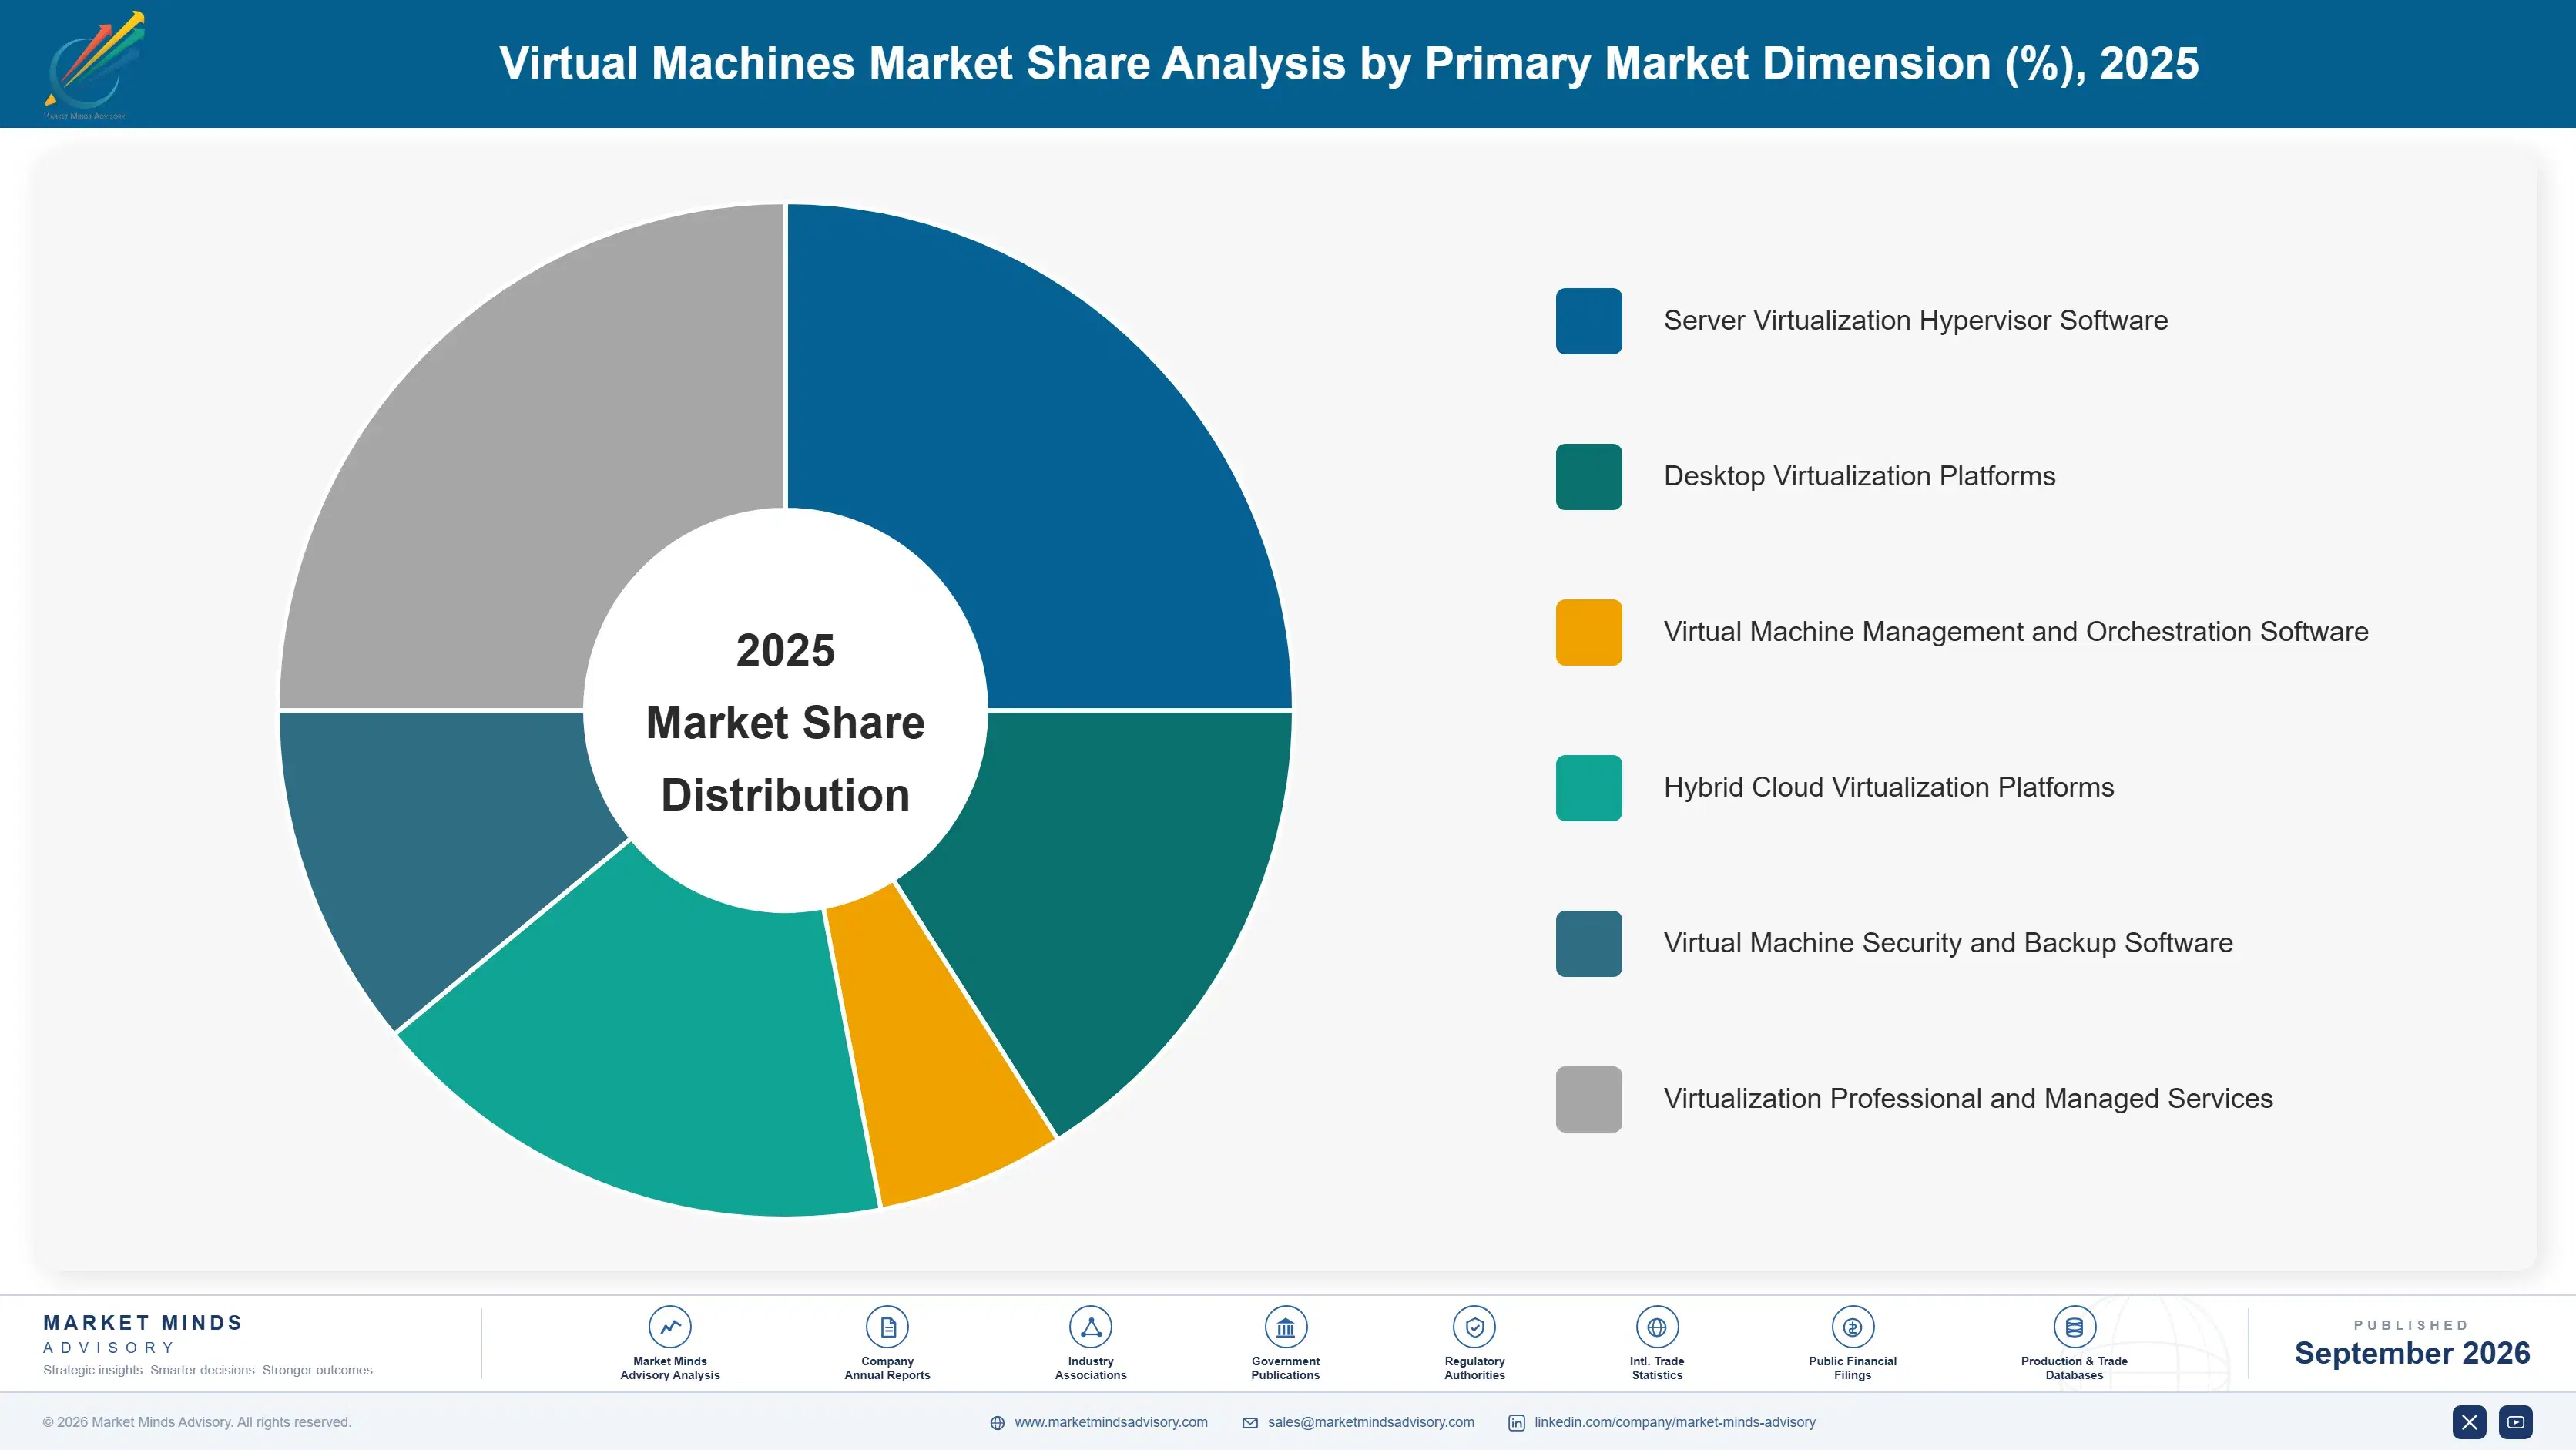
Segmentation follows the product and deployment dimension, since that lens best explains both vendor engineering investment and enterprise procurement behaviour, spanning established server and desktop formats through to newer hybrid cloud and orchestration categories reshaping vendor roadmaps across the industry. This dynamic is reshaping vendor investment priorities steadily across the sector today and beyond.
virtual-machine-market-market-share-analysis-1789993507846

Hybrid Cloud Virtualization Platforms

This segment covers virtualization platforms designed to operate consistently across on premise infrastructure and public cloud environments, distinct from traditional server hypervisor software that operates within a single on premise environment, and from desktop virtualization that serves end user computing rather than infrastructure workload portability specifically. Demand is rising sharply as enterprises increasingly prioritise vendor diversification and workload portability over single environment optimisation alone. Growth is outpacing every other segment in this report because hybrid cloud adoption is scaling faster than any comparable deployment category, creating urgent competitive pressure among cross platform vendors specifically. Enterprises increasingly treat portability as essential infrastructure risk management. Buyers increasingly value this measurable capability today.
CAGR 12.5%

Virtual Machine Management and Orchestration Software

This segment covers software that centrally manages, provisions, and monitors virtual machine workloads across infrastructure environments, distinct from the hypervisor software itself that creates virtual machines rather than orchestrating their ongoing management, and from desktop virtualization that serves end user computing rather than backend workload orchestration specifically. Demand is rising as enterprises increasingly require centralised visibility across growing numbers of distributed virtual machine workloads. Growth trails the hybrid cloud segment only because orchestration software adoption, while accelerating steadily amid infrastructure complexity growth, builds on an already larger existing installed base relative to the newer, faster scaling hybrid cloud category specifically. Enterprises increasingly value this centralised visibility capability, indeed, truly and indeed.
CAGR 11.5%
Full segment breakdown across 6 segments available in the complete report.

Regional Architecture and Country Demand Map

North America and East Asia together anchor more than half of global revenue, reflecting concentrated enterprise IT infrastructure spending and large scale data center deployment, while South Asia and Pacific delivers the fastest regional expansion through rapidly accelerating enterprise cloud adoption across most regions today overall.

North America

United States enterprises account for the large majority of regional revenue, reflecting the country's concentrated enterprise IT infrastructure spending and continued hybrid cloud migration across major industry verticals throughout the forecast period. Canadian enterprises contribute a steady secondary share tied to comparable virtualization and infrastructure modernisation requirements across established vendor relationships. Growth here tracks close to the global base as steady enterprise demand sustains growth relative to faster expanding emerging market regions elsewhere in this report, reinforcing the region's position as the largest single revenue base for established vendors overall. Continued enterprise infrastructure budget allocation supports sustained platform demand across most major buyers today. Continued licensing disruption reinforces this diversification pattern across most enterprises today.
Share: 30% | CAGR: 8.9% (2026 to 2036)

Western Europe

German and United Kingdom enterprises anchor regional demand through established server virtualization adoption and continued hybrid cloud migration deployment across national industry sectors. French and Nordic enterprises contribute a meaningful secondary share tied to comparable virtualization requirements across established, mature domestic markets. Growth trails the global rate because the region's enterprise infrastructure is already comparatively mature relative to faster growing emerging development regions, limiting incremental adoption growth even as hybrid cloud platform upgrades remain steady across the forecast period overall. Rising data sovereignty regulation is gradually reshaping cloud migration priorities somewhat. Rising data sovereignty compliance costs are gradually offsetting this maturity effect across several established markets today overall, indeed and truly.
Share: 23% | CAGR: 7.4% (2026 to 2036)
Regional intelligence for 5 additional markets available in the complete report: East Asia, South Asia and Pacific, Latin America, Middle East and Africa, Eastern Europe. Contact sales@marketmindsadvisory.com.
virtual-machine-market-country-cagr-analysis-1789993508388

Where Virtualization Vendors Can Still Expand Margin

Four commercial levers separate vendors capturing durable premium economics from those competing purely on licensing bundles, spanning cross platform compatibility depth, migration tooling validation, licensing transparency, and diversified deployment support. Each lever rewards sustained engineering investment well ahead of confirmed enterprise demand rather than reactive spending once a competitor already holds documented advantage truly.

Building Genuinely Deep Cross Platform Compatibility

Vendors that built cross platform compatibility depth, demonstrated through measurable workload portability across live enterprise deployments rather than marketing claims alone, are winning a disproportionate share of enterprise contracts from buyers wary of unproven portability promises circulating across the category. Vendors with demonstrated live deployment performance reported win rates roughly 24 percent higher than vendors offering only single environment optimised platforms. The approach requires sustained engineering investment that smaller vendors sometimes cannot justify given limited existing enterprise relationships and constrained development budgets today. Smaller vendors often struggle to match this depth quickly.
Market Impact: Lifts enterprise win rate by 24 total points

Validating Genuinely Deep Documented Migration Tooling

Vendors that validated documented migration tooling performance across comparable enterprise deployments are winning contracts that vendors offering only theoretical migration estimates cannot easily secure from buyers seeking measurable, verified cost savings before committing capital to large scale platform transitions. This lever requires sustained measurement and verification investment that smaller vendors sometimes have not built internally across their organisations. Vendors with documented migration performance reported average contract values roughly 21 percent above comparable vendors offering only estimated migration projections. This advantage compounds with every new enterprise engagement measured, indeed, truly and today.
Market Impact: Lifts average contract value by 21 total points

Expanding Genuinely Deep Transparent Licensing Models

Vendors that expanded transparent, predictable licensing models are winning contracts that vendors offering only opaque bundled pricing cannot easily secure from enterprises seeking documented cost predictability before committing to long term platform relationships. This lever requires sustained commercial model investment that smaller vendors sometimes have not built internally across their operations. Vendors with transparent licensing reported win rates roughly 22 percent higher than vendors offering only traditional bundled pricing structures without transparency. This transparency advantage strengthens with every new contract renewal signed. Enterprises increasingly favour this proven, verified transparency record.
Market Impact: Lifts licensing driven win rate by 22 points

Diversifying Deployment Support Across Multiple Environments

Vendors that diversified deployment support across on premise, cloud, and edge environments are sustaining revenue growth that vendors reliant on a single deployment environment cannot easily maintain during periods of shifting enterprise infrastructure priorities. This lever requires sustained product development investment that smaller vendors sometimes have not built internally across their engineering teams. Vendors with diversified deployment support reported revenue growth roughly 2 to 3 times higher than vendors dependent on a single deployment environment only. This recurring stability advantage also strengthens long term customer relationships considerably, truly, indeed and today.
Market Impact: Drives 2 to 3 times more revenue growth

Who Controls the Margin Pool

CR5 sits at 48 percent, evaluated on disclosed installed base licensing revenue across the top vendors, reflecting a fairly concentrated category where established virtualization firms with deep hypervisor engineering expertise compete alongside smaller specialist orchestration vendors competing on migration flexibility for enterprises reconsidering vendor lock-in. The gap between the largest vendors and the specialist challenger tail remains meaningful given the engineering investment required to compete at the top.
Current competitive activity centers on three fronts: building cross platform compatibility depth to win enterprise trust beyond single environment optimisation, validating documented migration tooling to capture diversification focused contracts, and expanding transparent licensing models to address vendor concentration concerns. Price competition remains most intense among smaller vendors serving basic hypervisor segments, while hybrid cloud and orchestration contracts increasingly compete on documented portability instead.

Emerging pressure is building from two directions. Legacy hypervisor vendors without dedicated hybrid cloud investment are investing to close the portability gap, threatening established vendors in mid tier enterprise accounts where existing installed base relationships already exist. At the innovation end, open source virtualization specialists are attracting renewed investor interest, a dynamic that could reorder segment rankings as licensing transparency grows across the industry.
virtual-machine-market-company-positioning-matrix-1789993508916

Competitive Moat and Risk Dimensions

BROADCOM INC

Moat: Deep Multi-Product Installed Base

Broadcom's accumulated virtualization engineering expertise and extensive existing enterprise installed base gives it a credibility advantage in retaining large multi environment infrastructure contracts that narrower focused competitors cannot easily displace without comparable migration investment built over decades of enterprise deployment. This scale advantage compounds with every additional enterprise renewal secured.
BROADCOM INC

Risk: Exposure To Customer Attrition Risk

Broadcom's recent licensing model changes expose it to customer attrition risk more directly than competitors offering comparable capability at more predictable pricing, potentially pressuring its installed base retention during periods of intensifying diversification driven competition across the category. Simplifying pricing tiers could meaningfully reduce this competitive friction over time.
NUTANIX INC

Moat: Strong Hybrid Cloud Migration Legacy

Nutanix's years of accumulated hybrid cloud platform development give it a durable advantage in winning contracts from enterprises prioritising demonstrated migration flexibility over legacy single vendor hypervisor capability relative to less diversified competitors entering the category. This trust advantage compounds with every additional migration deployment completed.
NUTANIX INC

Risk: Exposure To Scale Disadvantage Risk

Nutanix's comparatively smaller installed base exposes it to scale disadvantages relative to larger competitors benefiting from greater existing enterprise relationships, potentially limiting its expansion pace among the largest, most complex enterprise accounts. Expanding partnership relationships could meaningfully reduce this scale disadvantage over time, indeed and truly.

Players Tracked

Prominent Players

Broadcom Inc
Microsoft Corporation
Citrix Systems Inc
Nutanix Inc
Red Hat Inc

Other Key Players

Oracle Corporation
Amazon Web Services Inc
Google LLC
Parallels International GmbH
Scale Computing Inc
Proxmox Server Solutions GmbH
SUSE S.A.
Hewlett Packard Enterprise Company
Dell Technologies Inc
IBM Corporation
Huawei Technologies Co Ltd
Sangfor Technologies Inc
Virtuozzo International GmbH
StarWind Software Inc
XenServer (Cloud Software Group)

Recent Developments

MARCH 2026

Microsoft Launches Enhanced Hybrid Cloud Migration Toolkit

Microsoft launched an enhanced hybrid cloud migration toolkit incorporating expanded cross platform compatibility capability, extending its existing virtualization portfolio to address growing demand for validated migration flexibility ahead of accelerating enterprise adoption schedules across multiple customers. The launch follows extensive pilot testing with select enterprises.
Signal: Confirms established vendors racing to expand validated migration capability as a core differentiator ahead of intensifying buyer scrutiny.
OCTOBER 2025

Nutanix Acquires Migration Tooling Specialist ShiftPath Systems

Nutanix completed the acquisition of migration tooling specialist ShiftPath Systems, adding automated workload migration capability intended to strengthen its hybrid cloud portfolio ahead of increasing demand for validated migration tooling. The deal closed after a multi month regulatory review, with both companies confirming terms. Both companies confirmed terms.
Signal: Indicates migration tooling acquisition activity accelerating among established virtualization vendors globally this year. This trend should continue steadily.
JUNE 2025

Red Hat Signs Multi-Year Platform Agreement With Major Financial Services Group

Red Hat signed a multi year platform agreement with a major financial services group covering hybrid cloud virtualization deployment across the group's expanding infrastructure footprint, securing long term revenue commitment tied to the group's phased migration schedule extending through the decade. Financial terms were not disclosed.
Signal: Signals large multi year enterprise platform agreements remaining a key competitive lever for scaled vendors with deep engineering capacity.

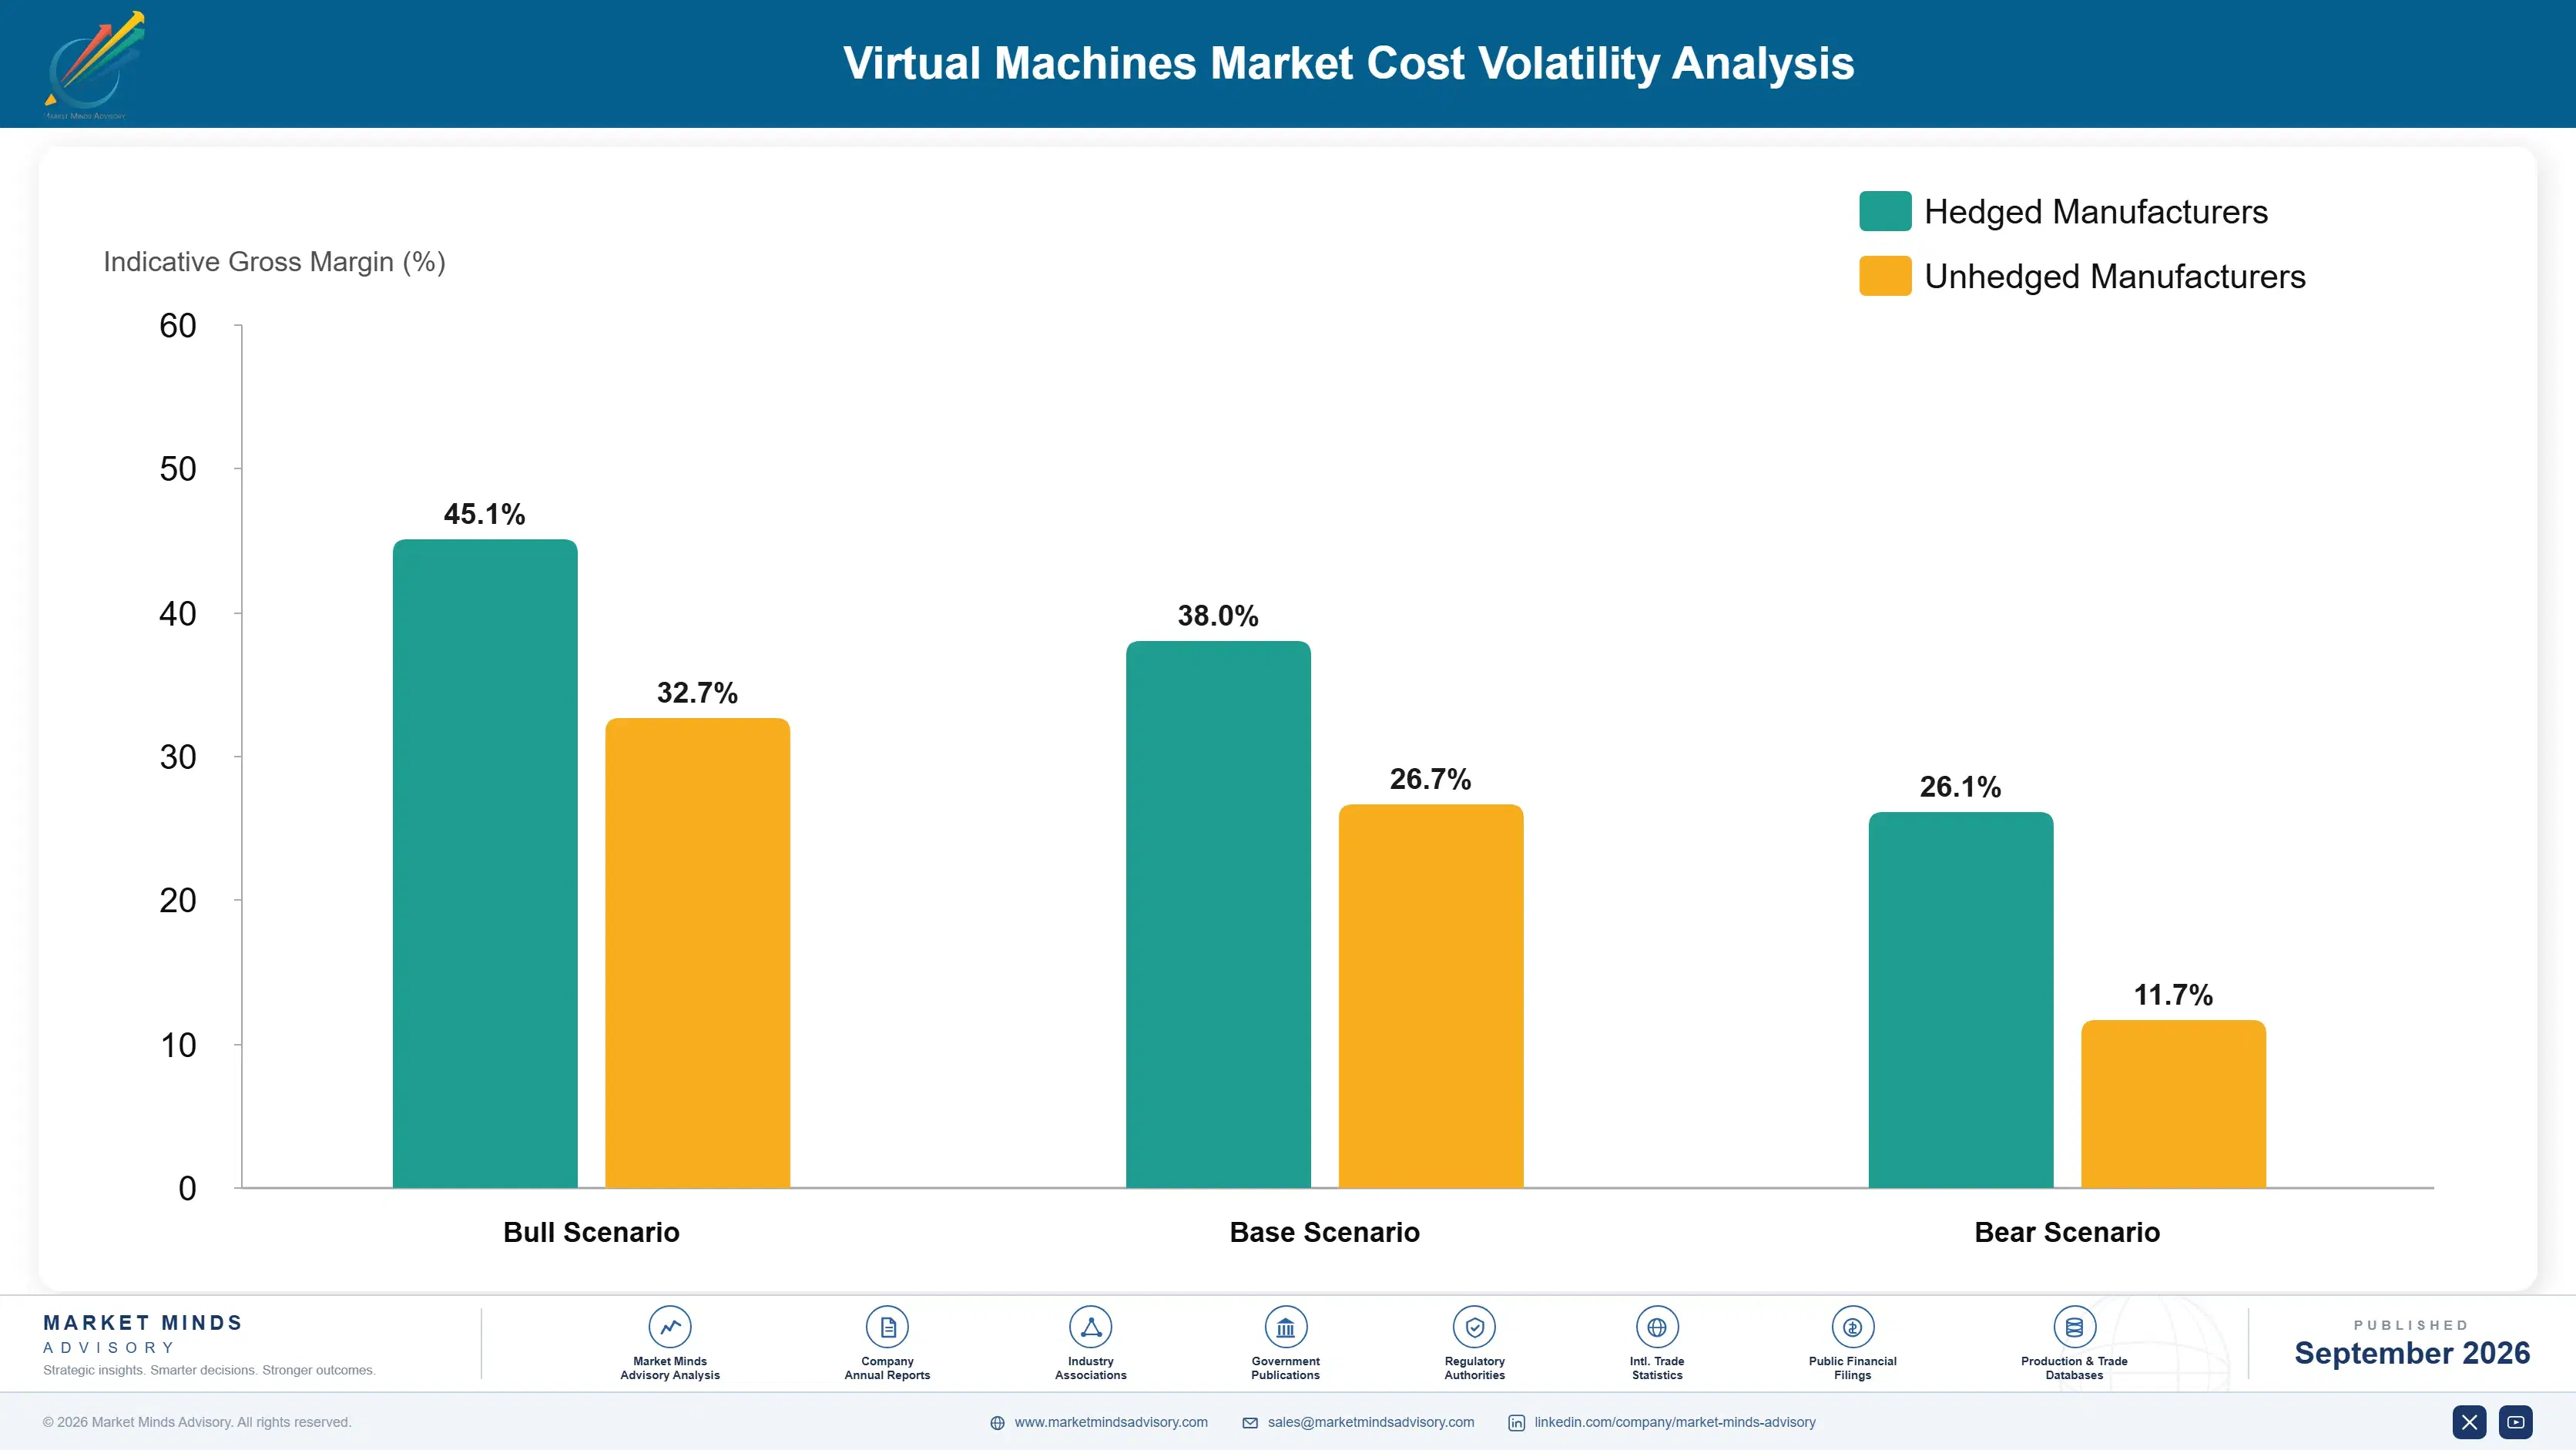
Software Development and Compatibility Testing Exposure

Software development talent and cross platform compatibility testing infrastructure together represent the largest cost input for virtualization vendors, running an estimated 48 to 55 percent of total operating cost, sourced primarily from a concentrated group of specialised engineering talent markets whose compensation pricing tracks broader technology labour markets closely across most vendor operations globally today.
Software development talent compensation rose meaningfully across the broader technology sector during 2022 and 2023 amid well documented specialised skills shortages and rising demand for cloud native engineering expertise, a pattern confirmed in multiple vendor annual reports and in US Census Bureau and European Commission technology labour market commentary from the same period. Vendors without diversified talent sourcing relationships faced larger cost increases than those with existing multi source agreements established beforehand across their engineering base.

The competitive disadvantage falls hardest on smaller vendors without the scale to secure favourable talent compensation rates during periods of tight specialised skills supply. Exposure varies by vendor type too, since vendors running large scale cross platform compatibility testing face materially greater engineering cost sensitivity than vendors offering primarily single environment platforms without extensive compatibility validation requirements.
virtual-machine-market-cost-volatility-analysis-1789993509116

Diversifying Talent Sourcing Relationships Across Regions

Larger vendors are diversifying software development talent sourcing relationships across multiple regions from the outset, reducing single source dependency exposure while maintaining the consistent engineering quality that cross platform compatibility requires across the full development pipeline. This diversification also shortens replacement time whenever a single talent market faces disruption. This also strengthens negotiating leverage across future contract cycles considerably.

Investing In Automated Compatibility Testing Infrastructure

Several vendors are investing in automated compatibility testing infrastructure that reduces manual engineering hours required per platform release, reducing dependency on specialised manual testing talent during periods of tight skills market competition. These automated systems are now standard practice across most large scale vendors today. These systems help stabilise engineering capacity during volatile hiring cycles.

Building Reusable Cross Platform Engineering Frameworks

Vendors are increasingly investing in reusable cross platform engineering frameworks that reduce development hours required per new platform integration, lowering exposure to talent cost increases while maintaining the compatibility depth that enterprises increasingly expect. This approach is becoming standard across most major vendors globally, reducing overall development cost exposure considerably today across most regional markets.

Portfolio Architecture for Margin Defence

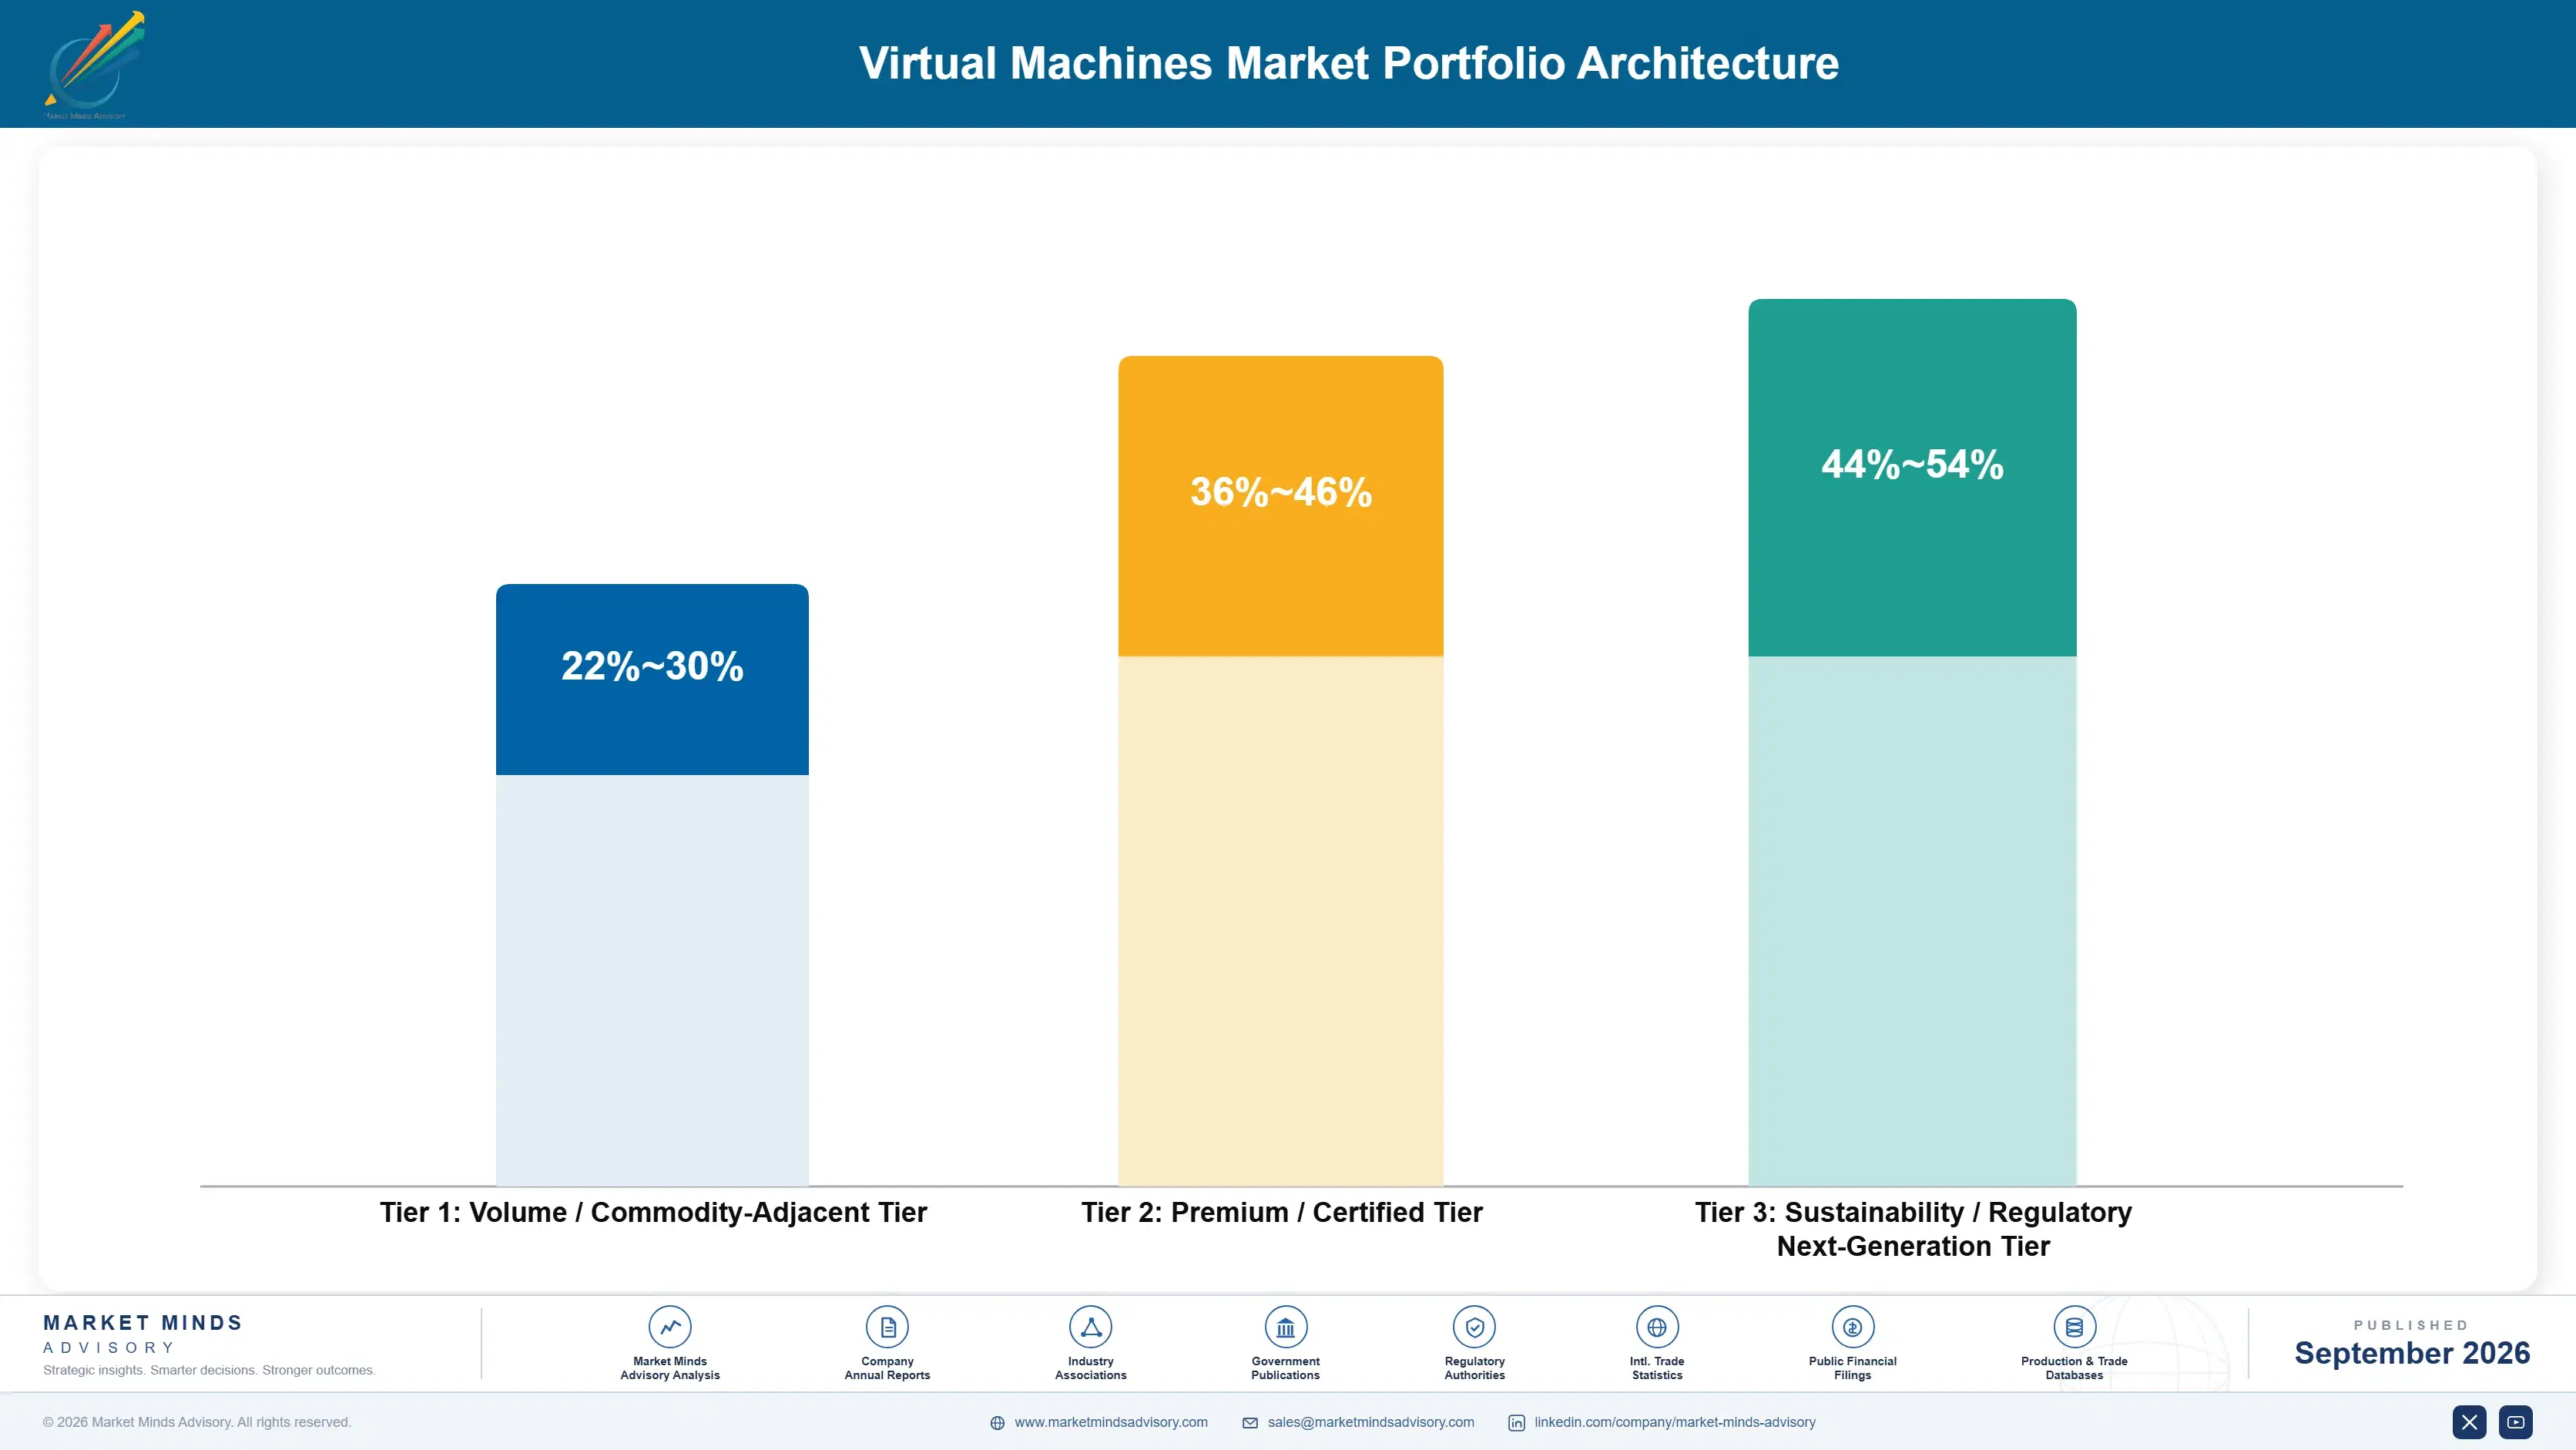
Portfolio economics split into three tiers. Volume tier basic single vendor hypervisor licensing carries thinner margins under continued price competition from generic virtualization alternatives, while premium hybrid cloud and orchestration platforms carry meaningfully higher margins tied to documented portability and migration flexibility. The sustainability and next generation tier, built around transparent licensing models and automated migration tooling, currently carries the strongest margins given genuine differentiation and long term enterprise relationships.
The volume versus premium tension shows up clearly in vendor engineering allocation. Investment devoted to defending basic hypervisor licensing margin against generic alternative competition competes directly against investment needed for hybrid cloud and migration tooling capability, and vendors that under invest in either risk losing ground to a competitor optimised specifically for that segment of the market.

High value margin pools concentrate in hybrid cloud and migration tooling lines, where technical differentiation and validated portability still command premium pricing before broader commoditisation eventually sets in across the category. The basic hypervisor tier remains essential for enterprise reach among smaller technology budgets but contributes a shrinking share of blended gross margin across the category overall. This dynamic is already visible in vendor product roadmaps announced over the past year.

Volume / Commodity-Adjacent Tier

Basic single vendor hypervisor licensing facing continued price competition from generic virtualization alternatives, leaving vendors reliant on volume rather than portability depth to defend share today overall, indeed, indeed and truly.
Gross Margin: 22-30%

Premium / Certified Tier

Hybrid cloud and orchestration platforms bundling validated portability performance carrying margins tied to migration flexibility and precision, with enterprises willing to pay a meaningful premium for demonstrated results. Enterprises increasingly value speed and precision.
Gross Margin: 36-46%

Sustainability / Regulatory / Next-Generation Tier

Transparent licensing models and automated migration tooling systems commanding the strongest current margins given genuine differentiation and recurring enterprise relationships overall today truly, for licensed technology partners today and beyond.
Gross Margin: 44-54%
virtual-machine-market-portfolio-architecture-1789993509635

High-value Sub-segments and Strategic Watch-out

Hybrid Cloud Portability Platform Contracts

The fastest growing margin segment in this report, combining strong current margins with accelerating enterprise demand for validated workload portability across new deployment programmes this decade, across most rollouts today overall. Enterprises increasingly demand this option globally, across most enterprise deployments this decade today, truly.
Gross Margin: 44-54%

Automated Migration Tooling Contracts

Premium offerings tied to enterprise demand for documented migration cost savings, offering strong margins and durable revenue visibility across major diversification focused accounts broadly, across recent renewal cycles too across established regional markets today. Enterprises increasingly favour proven results, across recent renewal cycles too across established markets.
Gross Margin: 36-46%

Standard Hypervisor Licensing Contracts

The largest existing revenue base, standard engagements facing steady price competition but funding most vendors' ongoing portability and engineering investment across the wider business, and vendors depend heavily on this steady base overall. Vendors depend heavily on this steady base, even as growth slows gradually overall.
Gross Margin: 24-32%

Legacy Concentrated Vendor Lock-In Exposure

A shrinking strategic watch out segment as diversified hybrid cloud platforms continue displacing concentrated single vendor approaches across most enterprise categories tracked in this report, across the category broadly for smaller technology budgets too, who risk losing ground without meaningful investment soon today, across most enterprise categories.

Platform Lock-In and Migration Economics

Revenue behaves like a multi year annuity once a vendor's orchestration platform becomes embedded across an enterprise's daily infrastructure operations, since switching virtualization vendors means retraining infrastructure staff on new interfaces and rebuilding integration with existing management tools rather than a simple software swap. That switching cost explains most of this category's revenue visibility once a vendor moves past initial deployment into steady, ongoing platform management.
Adoption depth varies sharply by enterprise segment. Large enterprises running continuous, high value infrastructure operations integrate vendor relationships deeply into ongoing multi year licensing and support contracts spanning entire data center portfolios, creating durable vendor relationships, while smaller enterprises with less continuous infrastructure needs treat platform adoption more transactionally around individual projects, creating shallower vendor loyalty and greater exposure to competitive switching when licensing terms shift.

Buyer profiles are shifting generationally too. Infrastructure leaders who came up through the single vendor consolidation era still favour proven, established vendor relationships despite recent licensing disruption, while newer infrastructure leaders increasingly default to evaluating portability and licensing transparency as standard selection considerations. That difference in buying philosophy is shaping which vendors win newly reconsidering enterprise segments versus established legacy hypervisor relationships.
virtual-machine-market-end-use-penetration-index-1789993510139

Where the Category Reorders Next

These are among the four positions where our research anticipates prominent divergence between winners and laggards over the coming forecast period. Each is grounded in the demand model, the regulatory perimeter, and the announced capacity pipeline.
01 / CROSS PLATFORM INVESTMENT

Validated portability is separating category leaders from claims

Vendors that built cross platform compatibility depth are capturing a disproportionate share of enterprise contracts as buyers grow wary of unproven portability promises circulating across the category. Vendors without demonstrated live deployment evidence risk being relegated to single vendor positioning carrying materially lower contract value than portability leaders currently command. Building this evidence base now, while enterprises actively reassess vendor evaluation criteria across nearly every major account, looks like the more urgent priority for most vendors heading into next year.
02 / MIGRATION TOOLING STRATEGY

Documented migration cost savings are compounding into durable value

Vendors that validated documented migration tooling performance are capturing a disproportionate share of contracts as enterprises increasingly demand measurable returns beyond theoretical migration projections alone. This dynamic rewards vendors willing to invest in measurement and verification well ahead of confirmed industry wide migration standardisation. Vendors without established validation depth should prioritise smaller pilot migrations first, since pilot programmes with two or three enterprises tend to reveal most recurring migration requirements early, well before a broader, portfolio wide rollout begins in earnest.
03 / LICENSING TRANSPARENCY POSITIONING

Predictable pricing depth remains a genuinely underexploited advantage

Transparent, predictable licensing remains underexploited relative to its clear value potential as enterprises continue seeking cost predictability faster than many bundled pricing vendors can credibly demonstrate comparable transparency depth. Vendors building genuine transparency now are positioning for meaningful contract advantage as vendor diversification continues broadening across enterprise operations worldwide. Treating transparency as a secondary afterthought rather than a distinct strategic asset risks underinvesting in an important, durable competitive moat that rivals are already beginning to build out steadily across their own platforms.
04 / CONCENTRATED LICENSING EXPOSURE

Vendors without portability depth face continued displacement pressure

Vendors remaining concentrated in single vendor licensing positioning without hybrid cloud or migration tooling differentiation face continued displacement pressure as enterprise procurement criteria shift decisively toward precision, technically differentiated offerings across most accounts tracked in this report. Vendors should actively diversify toward cross platform compatibility, migration validation, or licensing transparency rather than defending concentrated positioning alone across every enterprise segment. Treating concentrated positioning as stable rather than declining understates the category's ongoing competitive transition already well underway across most developed markets tracked closely throughout this report.

Engagement Snapshot From the Field

A live engagement with an industry participant carrying material or product regulatory and market exposure ahead of a defining policy shift, showing how our research translates into a defensible multi-year portfolio strategy.
MARKET MINDS ADVISORY · CLIENT ENGAGEMENT SUMMARY
Virtual Machines Producer Strategic Portfolio Review and Transition Roadmap 2026·Investment Scenario on Virtual Machines Exposure Evaluation 2025-26
CLIENT PROFILE
The client is a global insurance group generating approximately fourteen billion dollars in annual revenue, operating a data center infrastructure of roughly four thousand virtual machines with historically concentrated single vendor hypervisor licensing inherited from a decade long enterprise agreement (client-reported, unverified by MMA). The client's infrastructure organisation includes roughly forty engineers coordinating migration planning across multiple regional data centers.
STRATEGIC CHALLENGE
Leadership needed to reduce vendor concentration risk following unexpected licensing cost increases, without triggering costly service disruption during the transition from single vendor hypervisor infrastructure to a diversified hybrid cloud platform across active production workloads. Any misstep risked service interruption across the client's active production claims processing systems overall, indeed.
MMA APPROACH
MMA benchmarked candidate virtualization platforms against disclosed migration cost data and existing client references at comparable insurance groups, prioritising vendors demonstrating genuine validated migration performance over marketing claims alone. The engagement included structured workload audits to assess actual migration complexity across representative data centers. MMA also reviewed each candidate's documented migration history across comparable enterprise programmes.
KEY FINDINGS
  1. Two of the four candidate vendors already held integration experience with the client's existing infrastructure management tools, suggesting a lower risk migration path than a fully custom integration build.
  2. Several vendors claiming strong migration cost savings in marketing materials had not actually validated those figures through independent measurement at comparable insurance enterprises previously.
  3. A phased data center by data center migration sequence reduced total service disruption risk considerably compared to a simultaneous full infrastructure conversion approach across every site at once.
  4. Infrastructure team adoption of the retained vendor's orchestration platform exceeded initial expectations once early cost reduction results were shared transparently across regional teams.
CLIENT PROFILE
The client is a global insurance group generating approximately fourteen billion dollars in annual revenue, operating a data center infrastructure of roughly four thousand virtual machines with historically concentrated single vendor hypervisor licensing inherited from a decade long enterprise agreement (client-reported, unverified by MMA). The client's infrastructure organisation includes roughly forty engineers coordinating migration planning across multiple regional data centers.
STRATEGIC CHALLENGE
Leadership needed to reduce vendor concentration risk following unexpected licensing cost increases, without triggering costly service disruption during the transition from single vendor hypervisor infrastructure to a diversified hybrid cloud platform across active production workloads. Any misstep risked service interruption across the client's active production claims processing systems overall, indeed.
MMA APPROACH
MMA benchmarked candidate virtualization platforms against disclosed migration cost data and existing client references at comparable insurance groups, prioritising vendors demonstrating genuine validated migration performance over marketing claims alone. The engagement included structured workload audits to assess actual migration complexity across representative data centers. MMA also reviewed each candidate's documented migration history across comparable enterprise programmes.
KEY FINDINGS
  1. Two of the four candidate vendors already held integration experience with the client's existing infrastructure management tools, suggesting a lower risk migration path than a fully custom integration build.
  2. Several vendors claiming strong migration cost savings in marketing materials had not actually validated those figures through independent measurement at comparable insurance enterprises previously.
  3. A phased data center by data center migration sequence reduced total service disruption risk considerably compared to a simultaneous full infrastructure conversion approach across every site at once.
  4. Infrastructure team adoption of the retained vendor's orchestration platform exceeded initial expectations once early cost reduction results were shared transparently across regional teams.
RECOMMENDED STRATEGY
Phase 1: Phase 1 (Months 1 to 3): Benchmark vendors against validated migration performance and verified deployment evidence from comparable insurers and existing tool compatibility. Phase 2: Phase 2 (Months 4 to 9): Migrate the highest priority data center first to validate the retained vendor relationship and measure early results. Phase 3: Phase 3 (Months 10 to 16): Extend migration across remaining data centers based on initial performance results achieved during the first phase.
OUTCOME
Sixteen months after the engagement began, the client successfully migrated workloads across three of four data centers, reporting measurably improved licensing cost predictability relative to its prior concentrated baseline (client-reported, unverified by MMA). Leadership also reported improved confidence in managing future migration programmes independently, and reduced average service disruption time considerably across the transition.

Frequently Asked Questions

Foundational context covering the market sizes, CAGR, scope, country, region and competition that inform every finding below. This section is provided to cover basics and most often pre-purchase conversations, answered from the MMA Primary Research Dataset.

What is the current size of the Virtual Machines Market?

The Virtual Machines Market reached an estimated USD 12.8 billion in global revenue in 2025. This base year figure anchors the forecast period beginning in 2026.

How large will the Virtual Machines Market be by 2036?

MMA projects the market will reach approximately USD 32.70 billion by 2036 under the base case scenario. That represents roughly a 2.35 times expansion from the 2026 starting value of USD 13.94 billion.

What is the CAGR for the Virtual Machines Market 2026 to 2036?

The base case compound annual growth rate is 8.9% across the 2026 to 2036 forecast window. Bull and bear scenarios range from 7.5% to 10.2% depending on vendor diversification pace and enterprise budget scrutiny.

Which segment is growing fastest?

Hybrid Cloud Virtualization Platforms lead all segments at a 12.5% CAGR, roughly 1.40 times the overall market rate. This segment benefits from enterprises prioritising vendor diversification and workload portability.

Who are the major companies in the Virtual Machines Market?

Leading vendors include Broadcom Inc, Microsoft Corporation, Citrix Systems Inc, Nutanix Inc, and Red Hat Inc. Together these five hold an estimated 48% combined share on a disclosed installed base licensing basis.

Which country is growing fastest?

India leads national growth at an estimated 10.8% CAGR, driven by its large IT services delivery base accelerating virtualization platform adoption. Vietnam follows within the same South Asia and Pacific region.

Report Segmentation Architecture

The full report scope spans multiple orthogonal segmentation dimensions, with cross-tabulated demand data provided for each dimension pair. Coverage extends further to regional breakdowns, trend trajectories, and the competitive detail needed to support segment-level decision-making.

By Primary Market Dimension

  • Server Virtualization Hypervisor Software
  • Desktop Virtualization Platforms
  • Virtual Machine Management and Orchestration Software
  • Hybrid Cloud Virtualization Platforms
  • Virtual Machine Security and Backup Software
  • Virtualization Professional and Managed Services

By End-Use Industry

  • Financial Services and Insurance
  • Healthcare and Life Sciences
  • Manufacturing and Industrial
  • Retail and Consumer Goods
  • Public Sector and Government

By Commercial Dimension

  • Direct Enterprise Licensing Agreements
  • Cloud Marketplace Subscription Channel
  • System Integrator and Reseller Channel
  • Managed Service Provider Partnerships

By Region

  • North America
  • Western Europe
  • East Asia
  • South Asia and Pacific
  • Latin America
  • Middle East and Africa
  • Eastern Europe

Scope, Methodology, and Coverage

Every figure in this report is reproducible from documented input assumptions. The scope below maps the historical period, the forecast horizon, the segmentation dimensions, and the countries covered, alongside the underlying primary and qualitative methodology.
Historical Period
2020 to 2025
Forecast Period
2026 to 2036
Base Year
2025 (USD billions; MMA Primary Research Dataset, September 2026)
Market Definition
This report covers software platforms that create and manage virtual machines for server and desktop virtualization, including hypervisor software, virtual machine management tools, and hybrid cloud virtualization platforms. It excludes container orchestration platforms that do not virtualize a full operating system and public cloud infrastructure as a service revenue not tied to virtualization software licensing.
Quantitative Units
USD billions (current prices); active licensed host count; average migration cost reduction
Segmentation Dimensions
By Primary Market Dimension; By End-Use Industry; By Commercial Dimension; By Region
Regions Covered
North America, Western Europe, East Asia, South Asia and Pacific, Latin America, Middle East and Africa, Eastern Europe
Countries Covered
USA, Canada, UK, Germany, France, Sweden, China, Japan, South Korea, India, Australia, Vietnam, Indonesia, Brazil, Mexico, Colombia, UAE, Saudi Arabia, South Africa, Kenya, Poland, Romania, and additional markets relevant to this sector
Key Companies Profiled
Broadcom Inc; Microsoft Corporation; Citrix Systems Inc; Nutanix Inc; Red Hat Inc; Oracle Corporation; Amazon Web Services Inc; Google LLC; Parallels International GmbH; Scale Computing Inc; Proxmox Server Solutions GmbH; SUSE S.A.; Hewlett Packard Enterprise Company; Dell Technologies Inc; IBM Corporation; Huawei Technologies Co Ltd; Sangfor Technologies Inc; Virtuozzo International GmbH; StarWind Software Inc; XenServer (Cloud Software Group)
Quantitative Methodology
Primary survey, n=3,800 respondents, Q4 2025, six countries; demand-side model with trade association cross-validation
Qualitative Methodology
47 expert interviews, Q4 2025; applied to validate demand model assumptions, identify emerging dynamics, and assess competitive positioning
Report Format
PDF and XLSX data workbook (Word format preview document)
Publisher
Market Minds Advisory
Report Code
MMA-2026-TEC-378
Published
September 2026
Contact
sales@marketmindsadvisory.com | www.marketmindsadvisory.com

Purchase the full Virtual Machines Market Report (2026 to 2036).

The full report delivers complete segmentation data across all six product and deployment segments, all seven regional markets, and detailed competitive profiles for all twenty companies named in this summary. It includes the underlying primary survey dataset of three thousand eight hundred respondents and forty seven expert interviews conducted during the fourth quarter of 2025. Buyers also receive downloadable data tables covering historical 2020 to 2025 figures alongside the full 2026 to 2036 annual forecast. A dedicated appendix addresses migration cost benchmarks across three vendor scenarios.
Full Seven-Region Regional Data Tables and Charts
All Twenty Company Competitive Profiles and Rankings
Ten-Year Annual Forecast Model With Scenarios
Primary Survey Raw Data Access and Tables
Migration Cost Benchmark Appendix and Guide
Quarterly Update Subscription Option for Buyers

Built For The People Who Decide

From boardroom strategy to bench-side execution, this report is read cover-to-cover by leaders shaping the next decade of their industry, turning demand scenarios, market dynamics and valuation benchmarks into decisions.
CXOs/ Presidents/ VPs/ Managers
M&A and Corporate Development
Strategy Teams and R&D Heads
Procurement and Product Directors
Regulatory and Compliance Leaders
Investor Relations and Equity Analysts